
Assessment Method for Feeding Intensity of Fish Schools Using MobileViT-CoordAtt


Abstract
1. Introduction
2. Materials and Methods
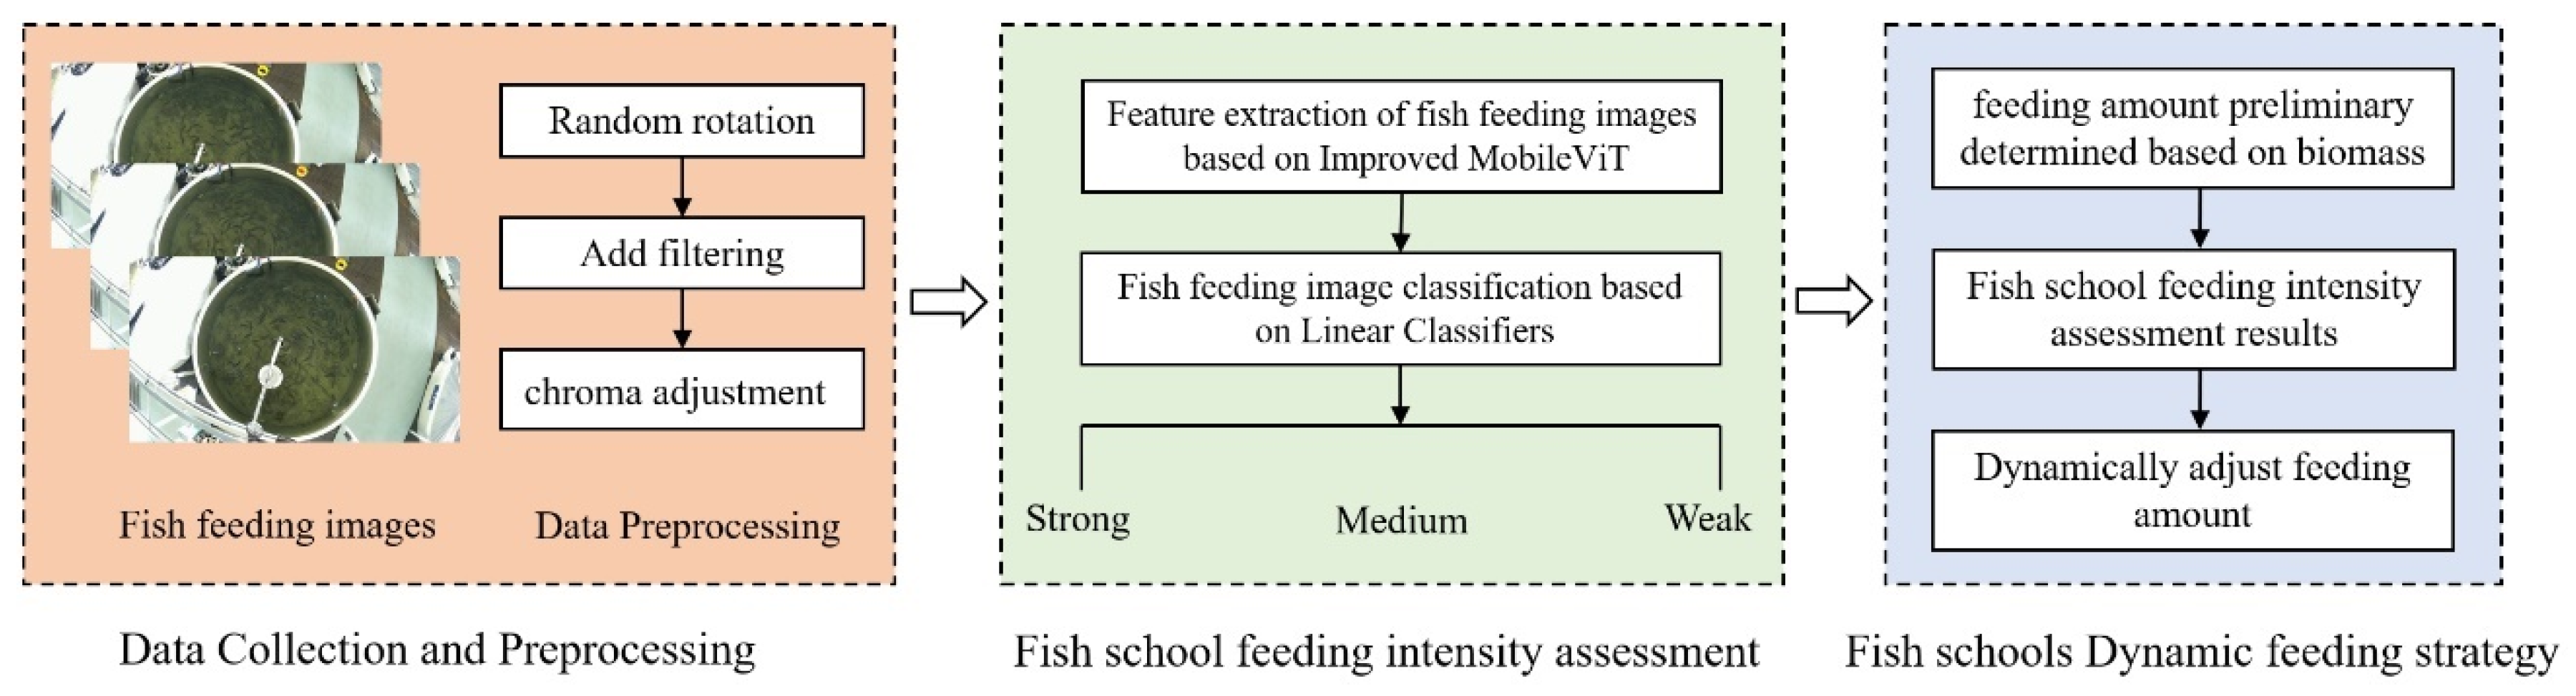
2.1. Overall Process
- (1)
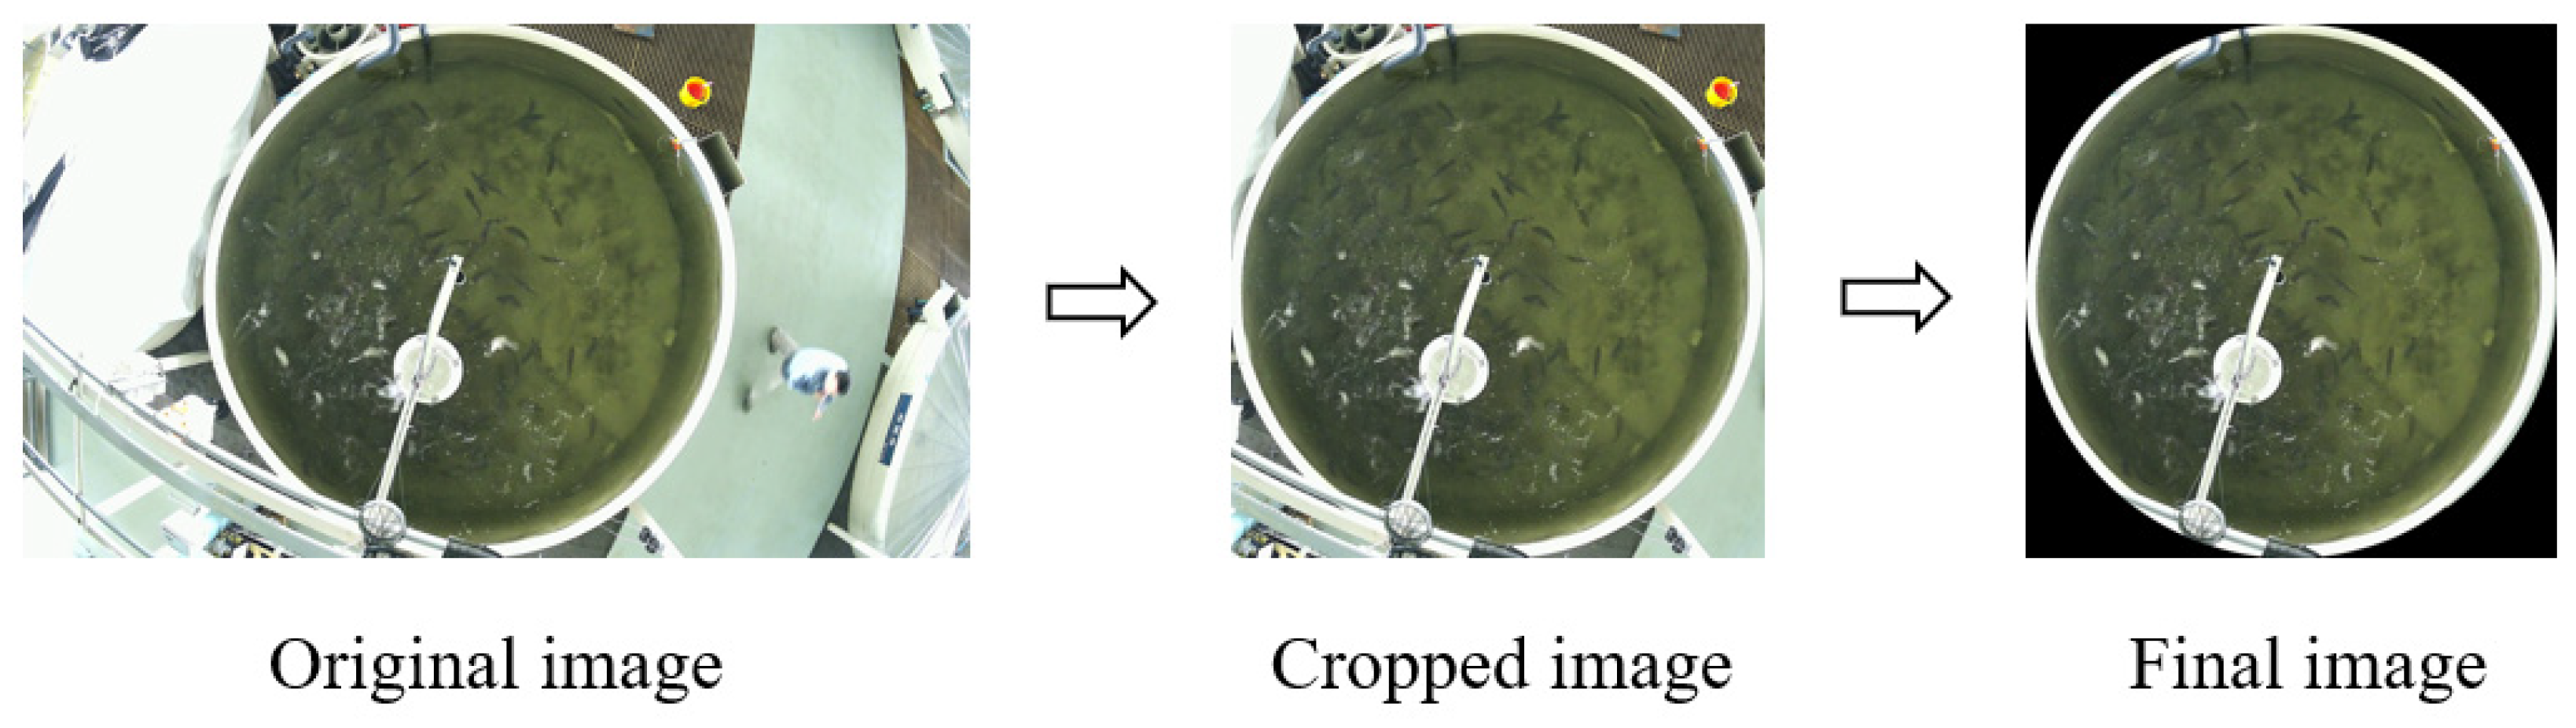
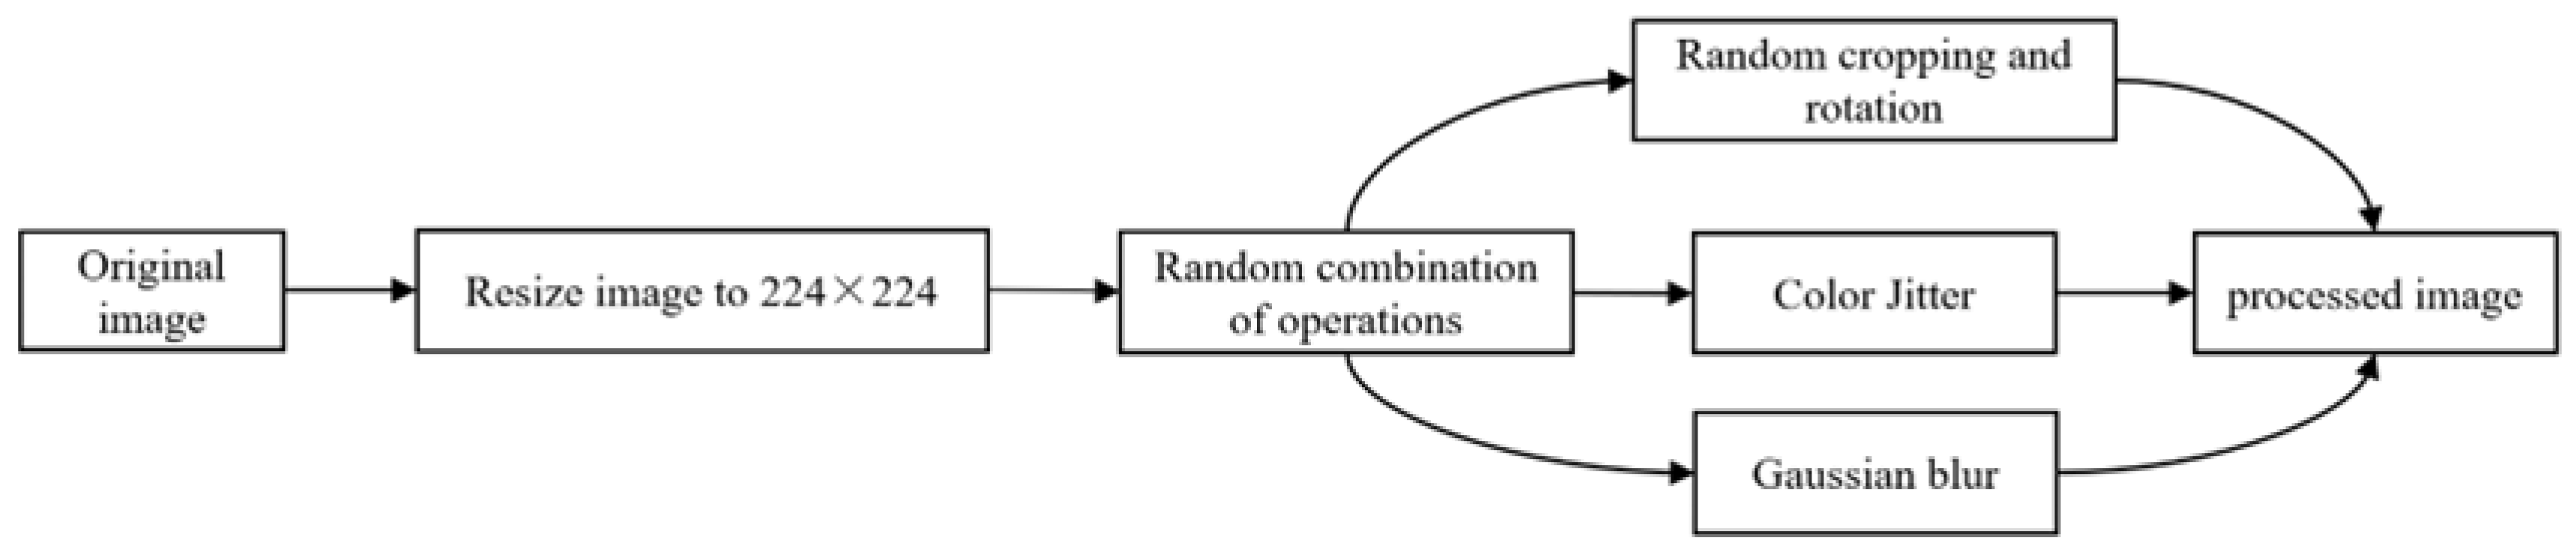
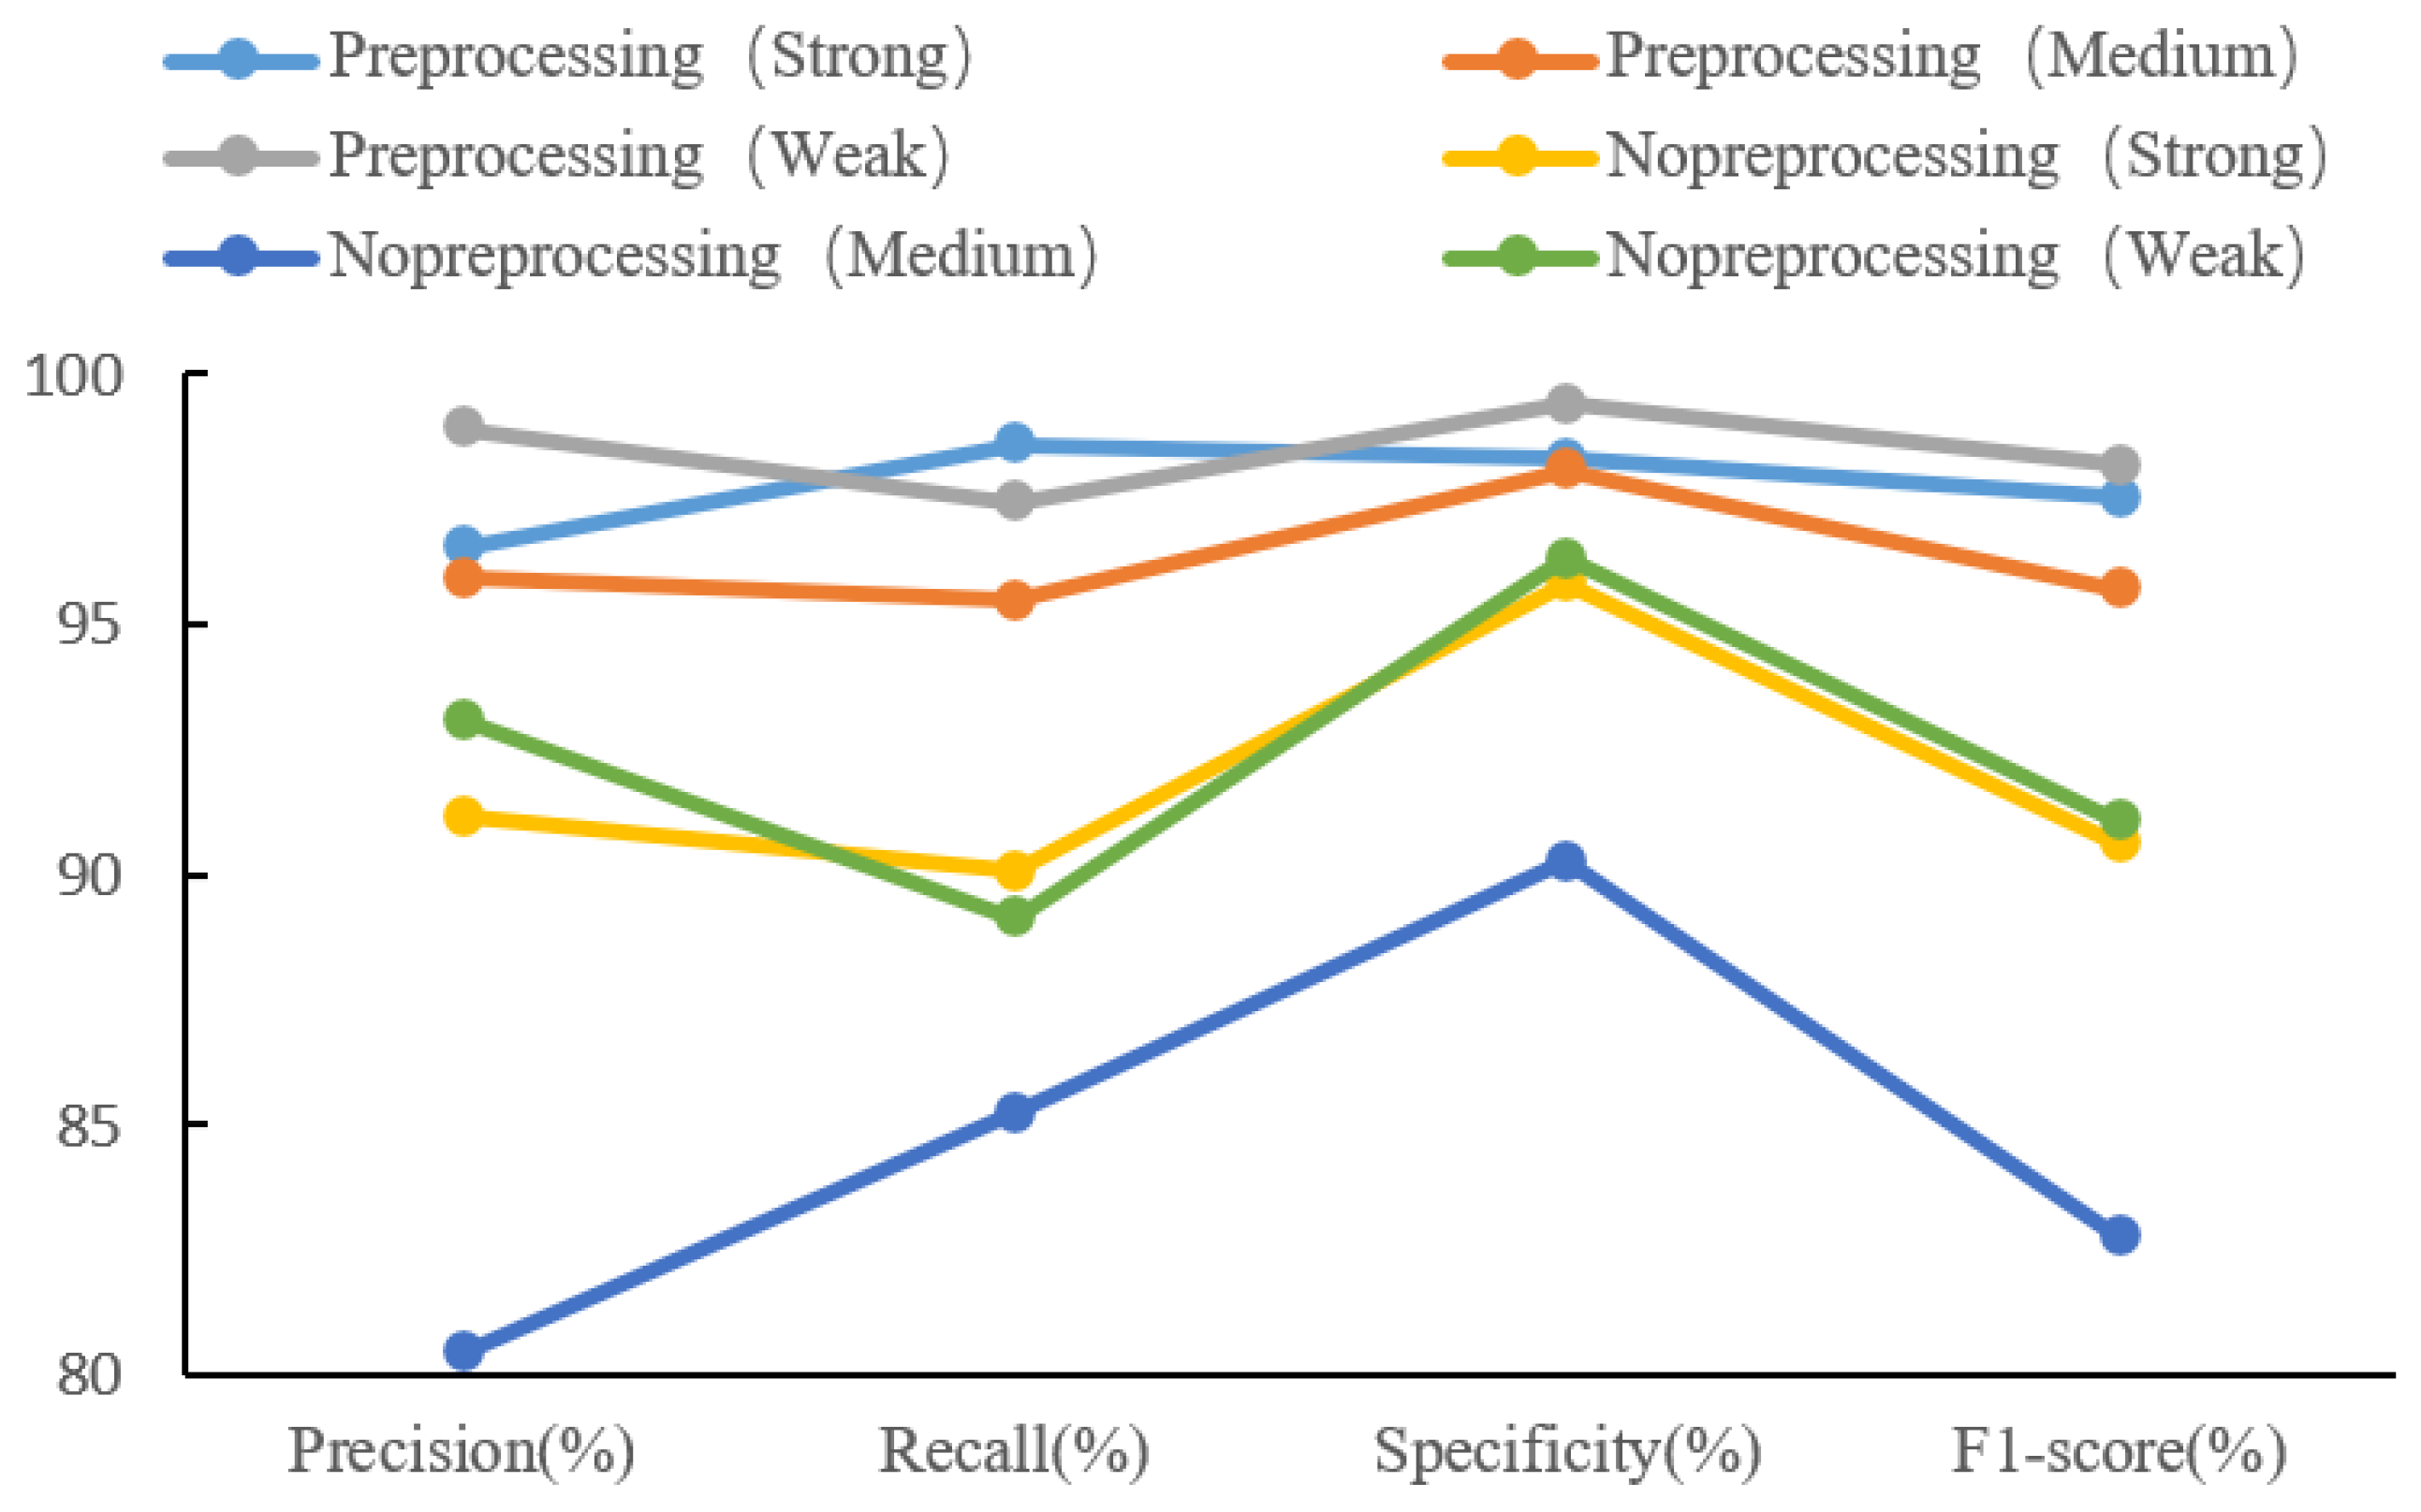
- Data Acquisition and Preprocessing. Feeding image data of fish schools were collected, and some preprocessing operations such as size adjustment, random cropping, random horizontal flip, random rotation, color jitter and gaussian blur, to enhance sample diversity and improve model generalization.
- (2)
- Assessment of Feeding Intensity in Fish Schools. A feeding intensity assessment model for fish schools was developed based on MobileViT-CoordAtt. The model was trained using annotated fish school feeding images to extract pre-trained weights encoding feeding intensity features. The pre-trained weights were subsequently employed to assess the feeding intensity of the fish schools.
- (3)
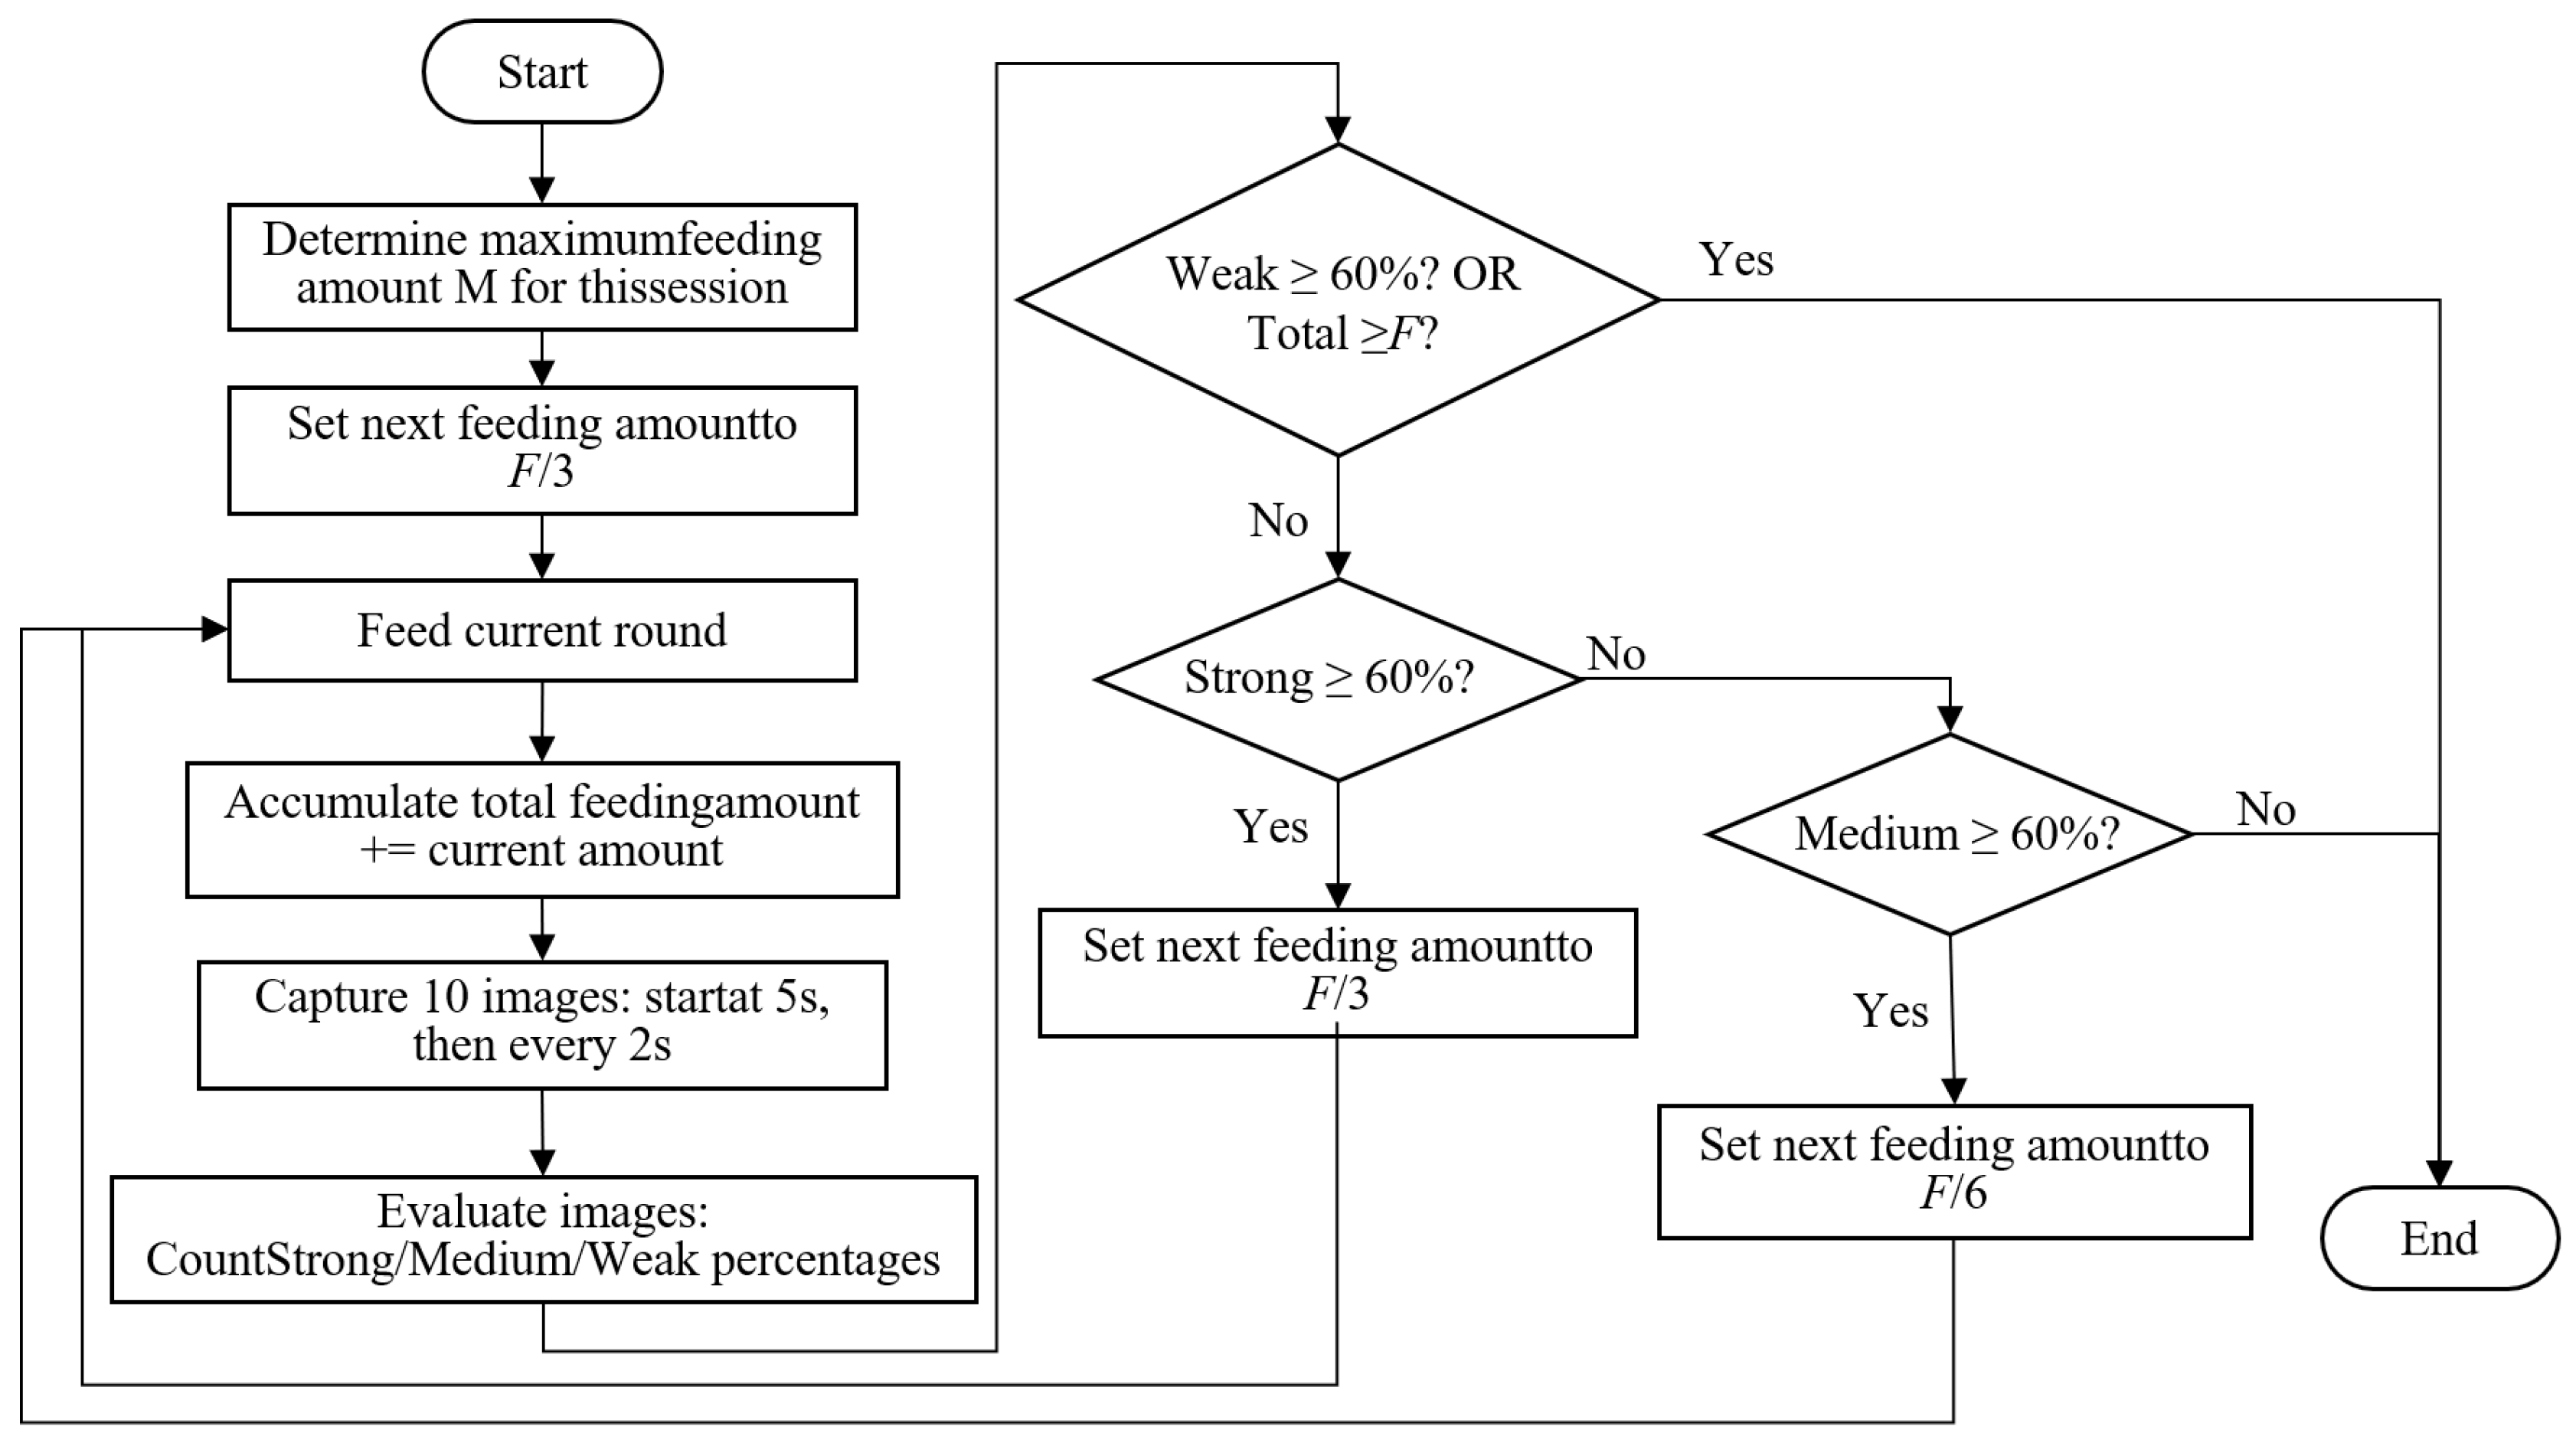
- Dynamic Feeding Strategy. A dynamic feeding strategy was developed by integrating biomass and fish feeding intensity. Before feeding, the total feed ration is determined based on the biomass within the culture area. During feeding, the feed amount is dynamically adjusted according to the assessed feeding intensity of the fish.
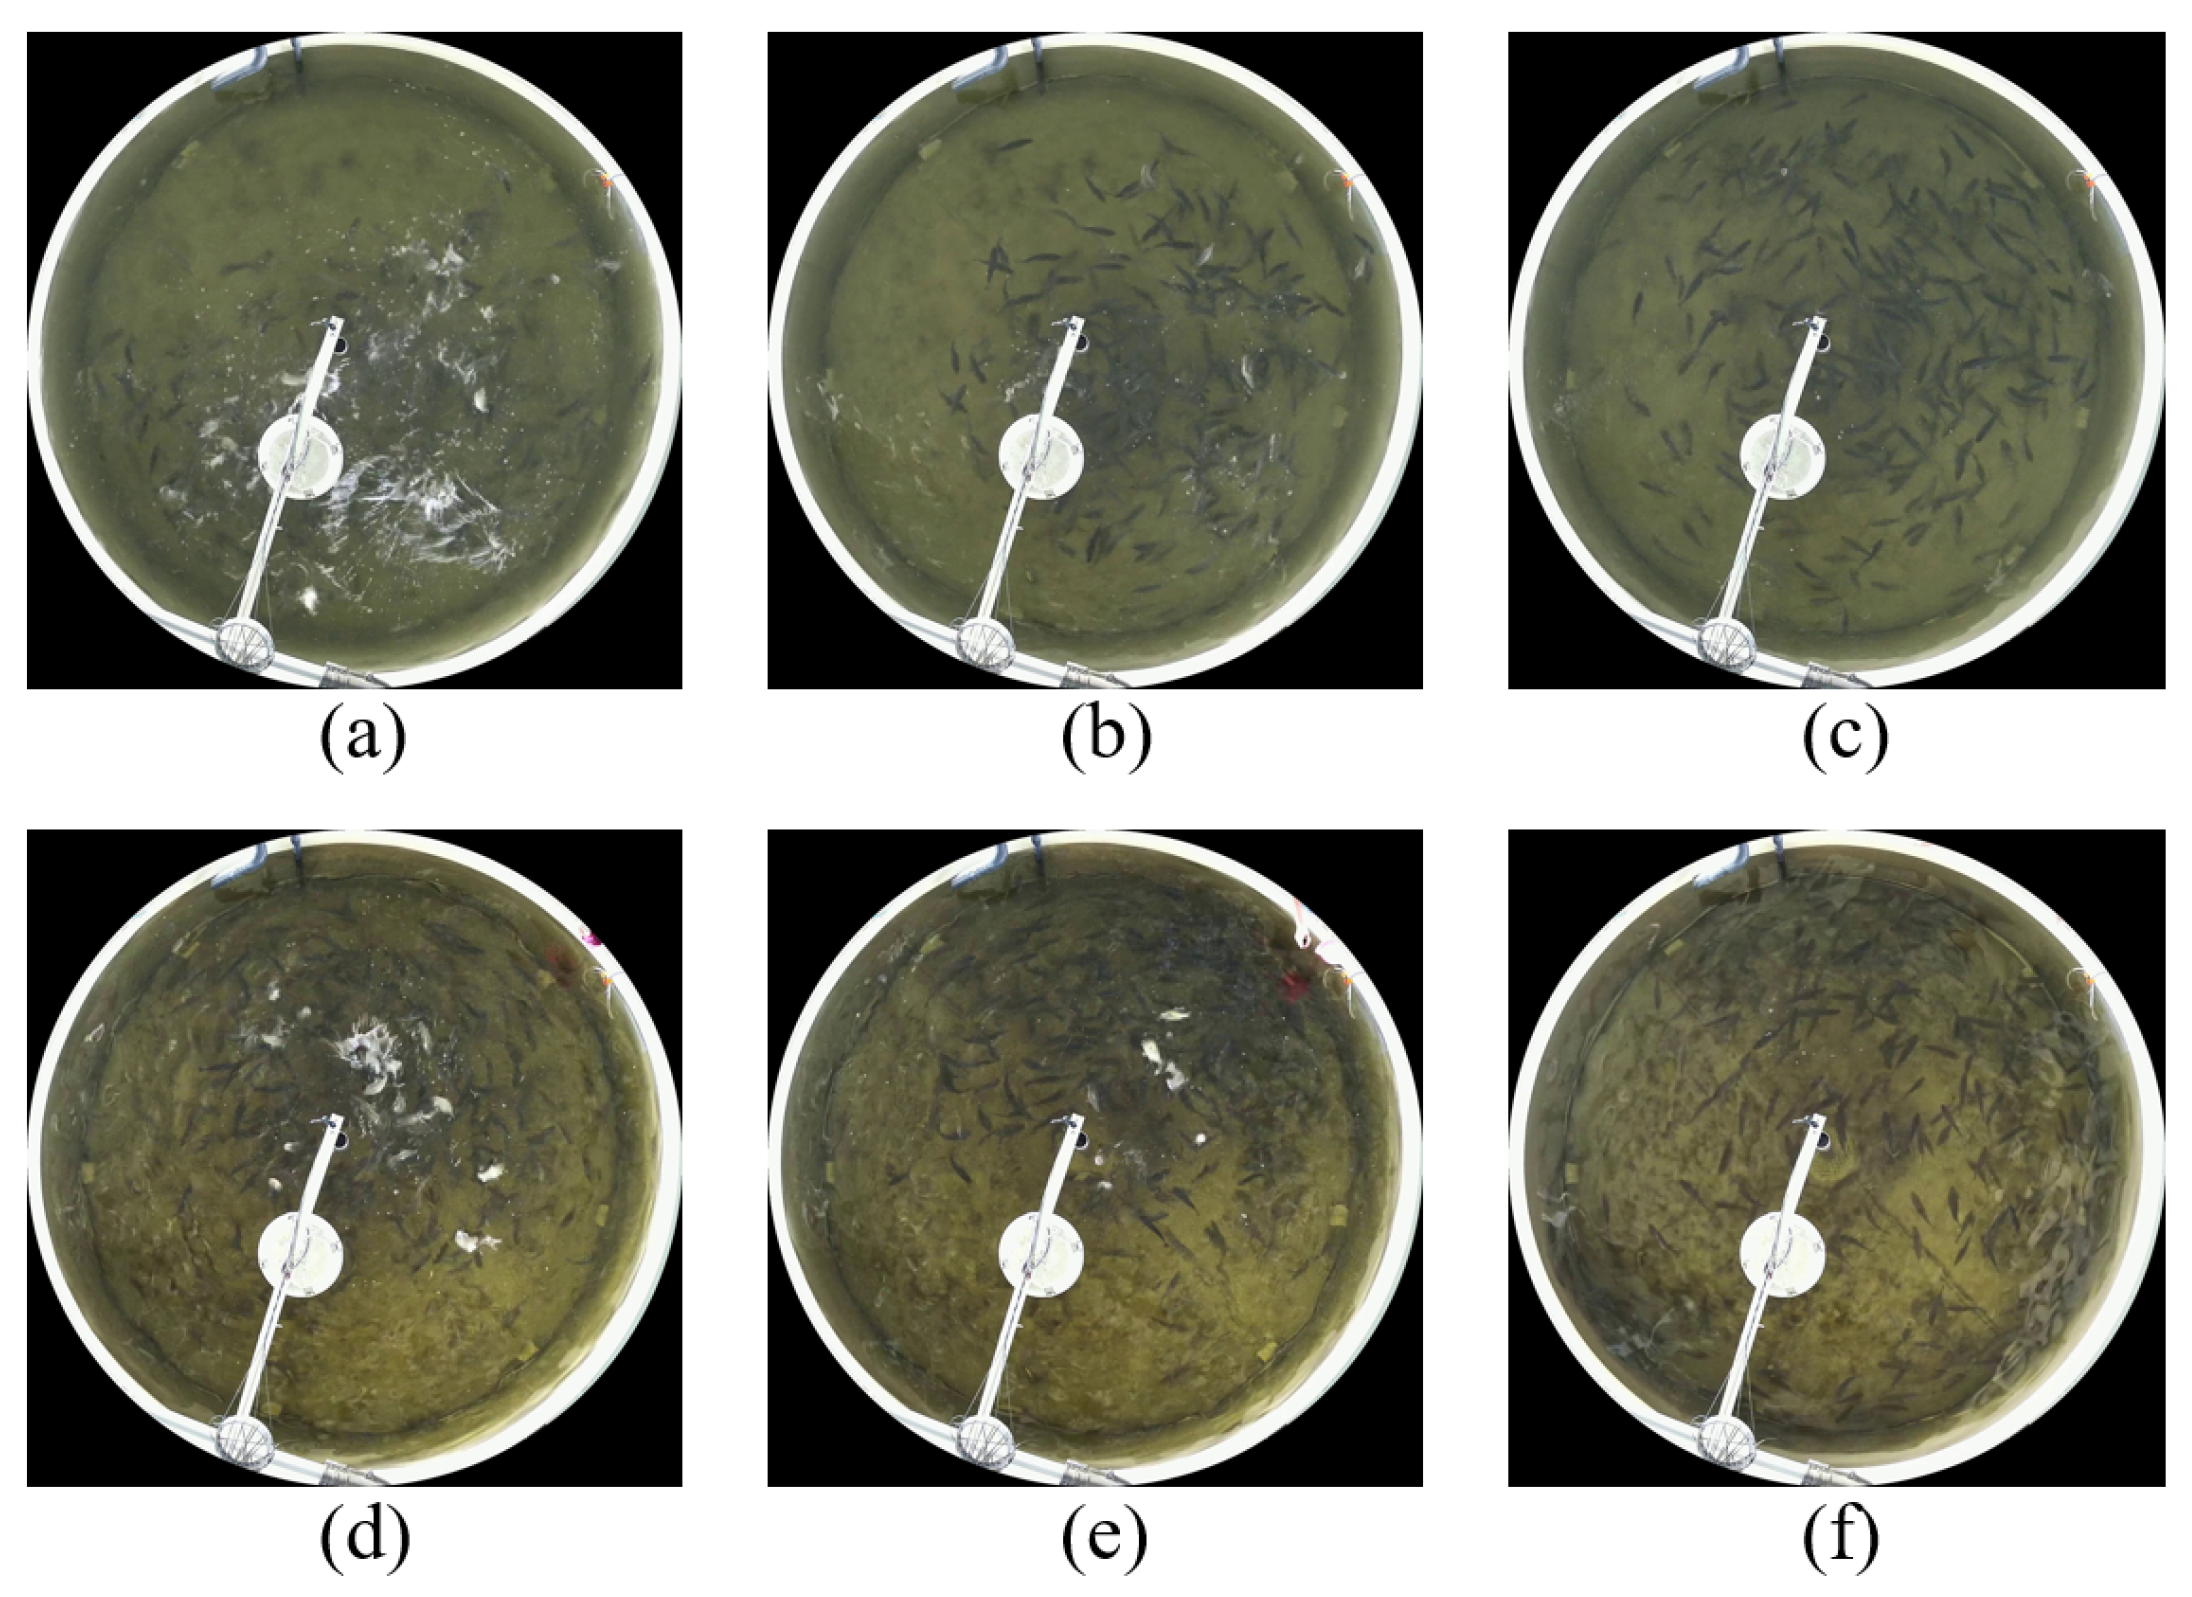
2.2. Data Acquisition and Preprocessing
2.3. Assessment of Feeding Intensity in Fish Schools
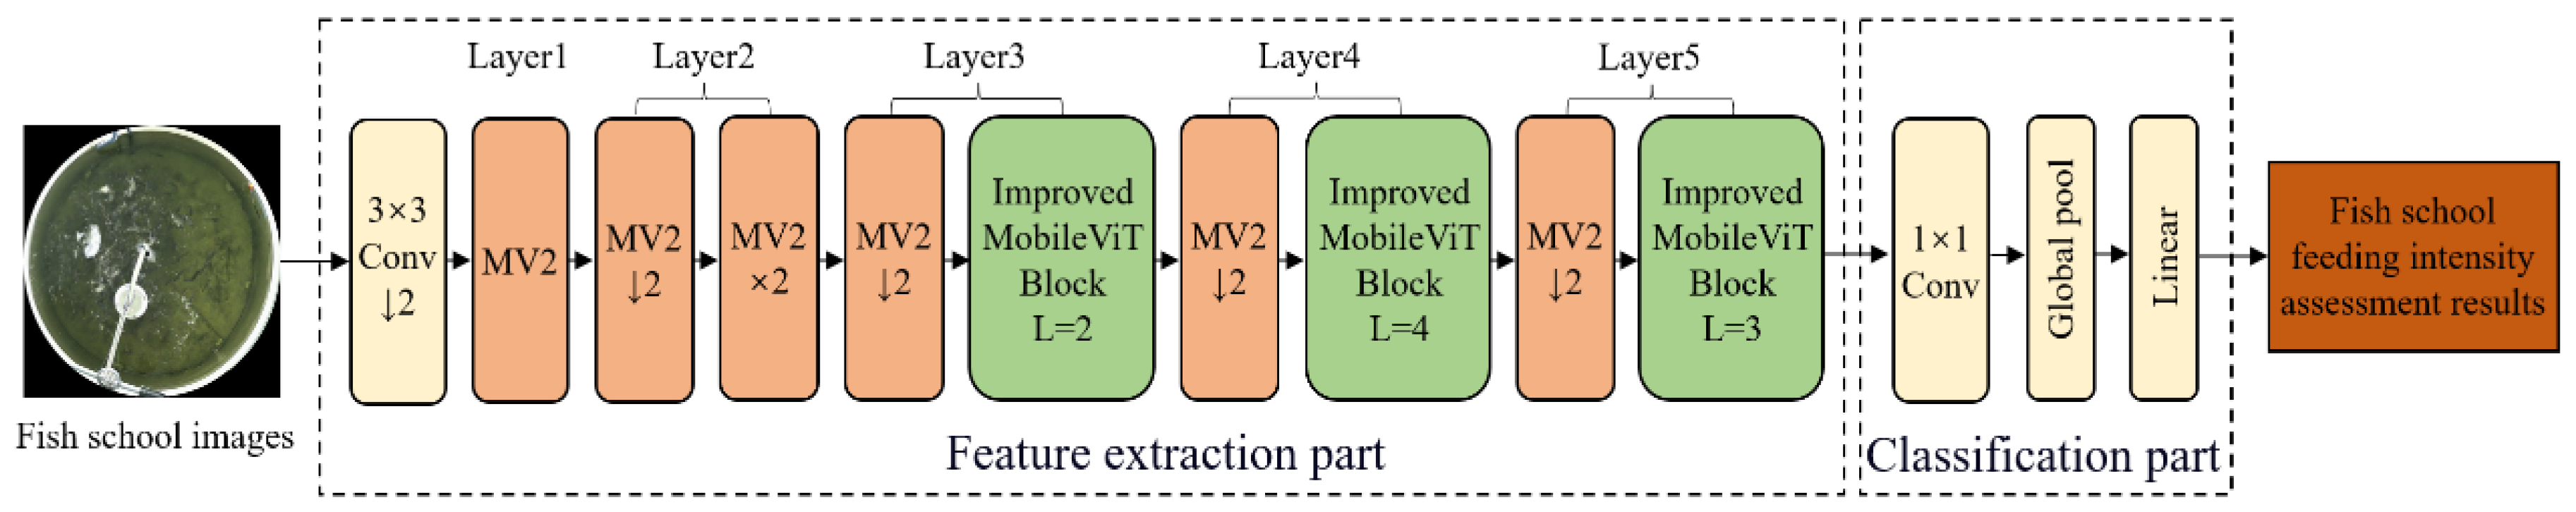
2.3.1. Image Feature Extraction Based on MobileViT-CoordAtt
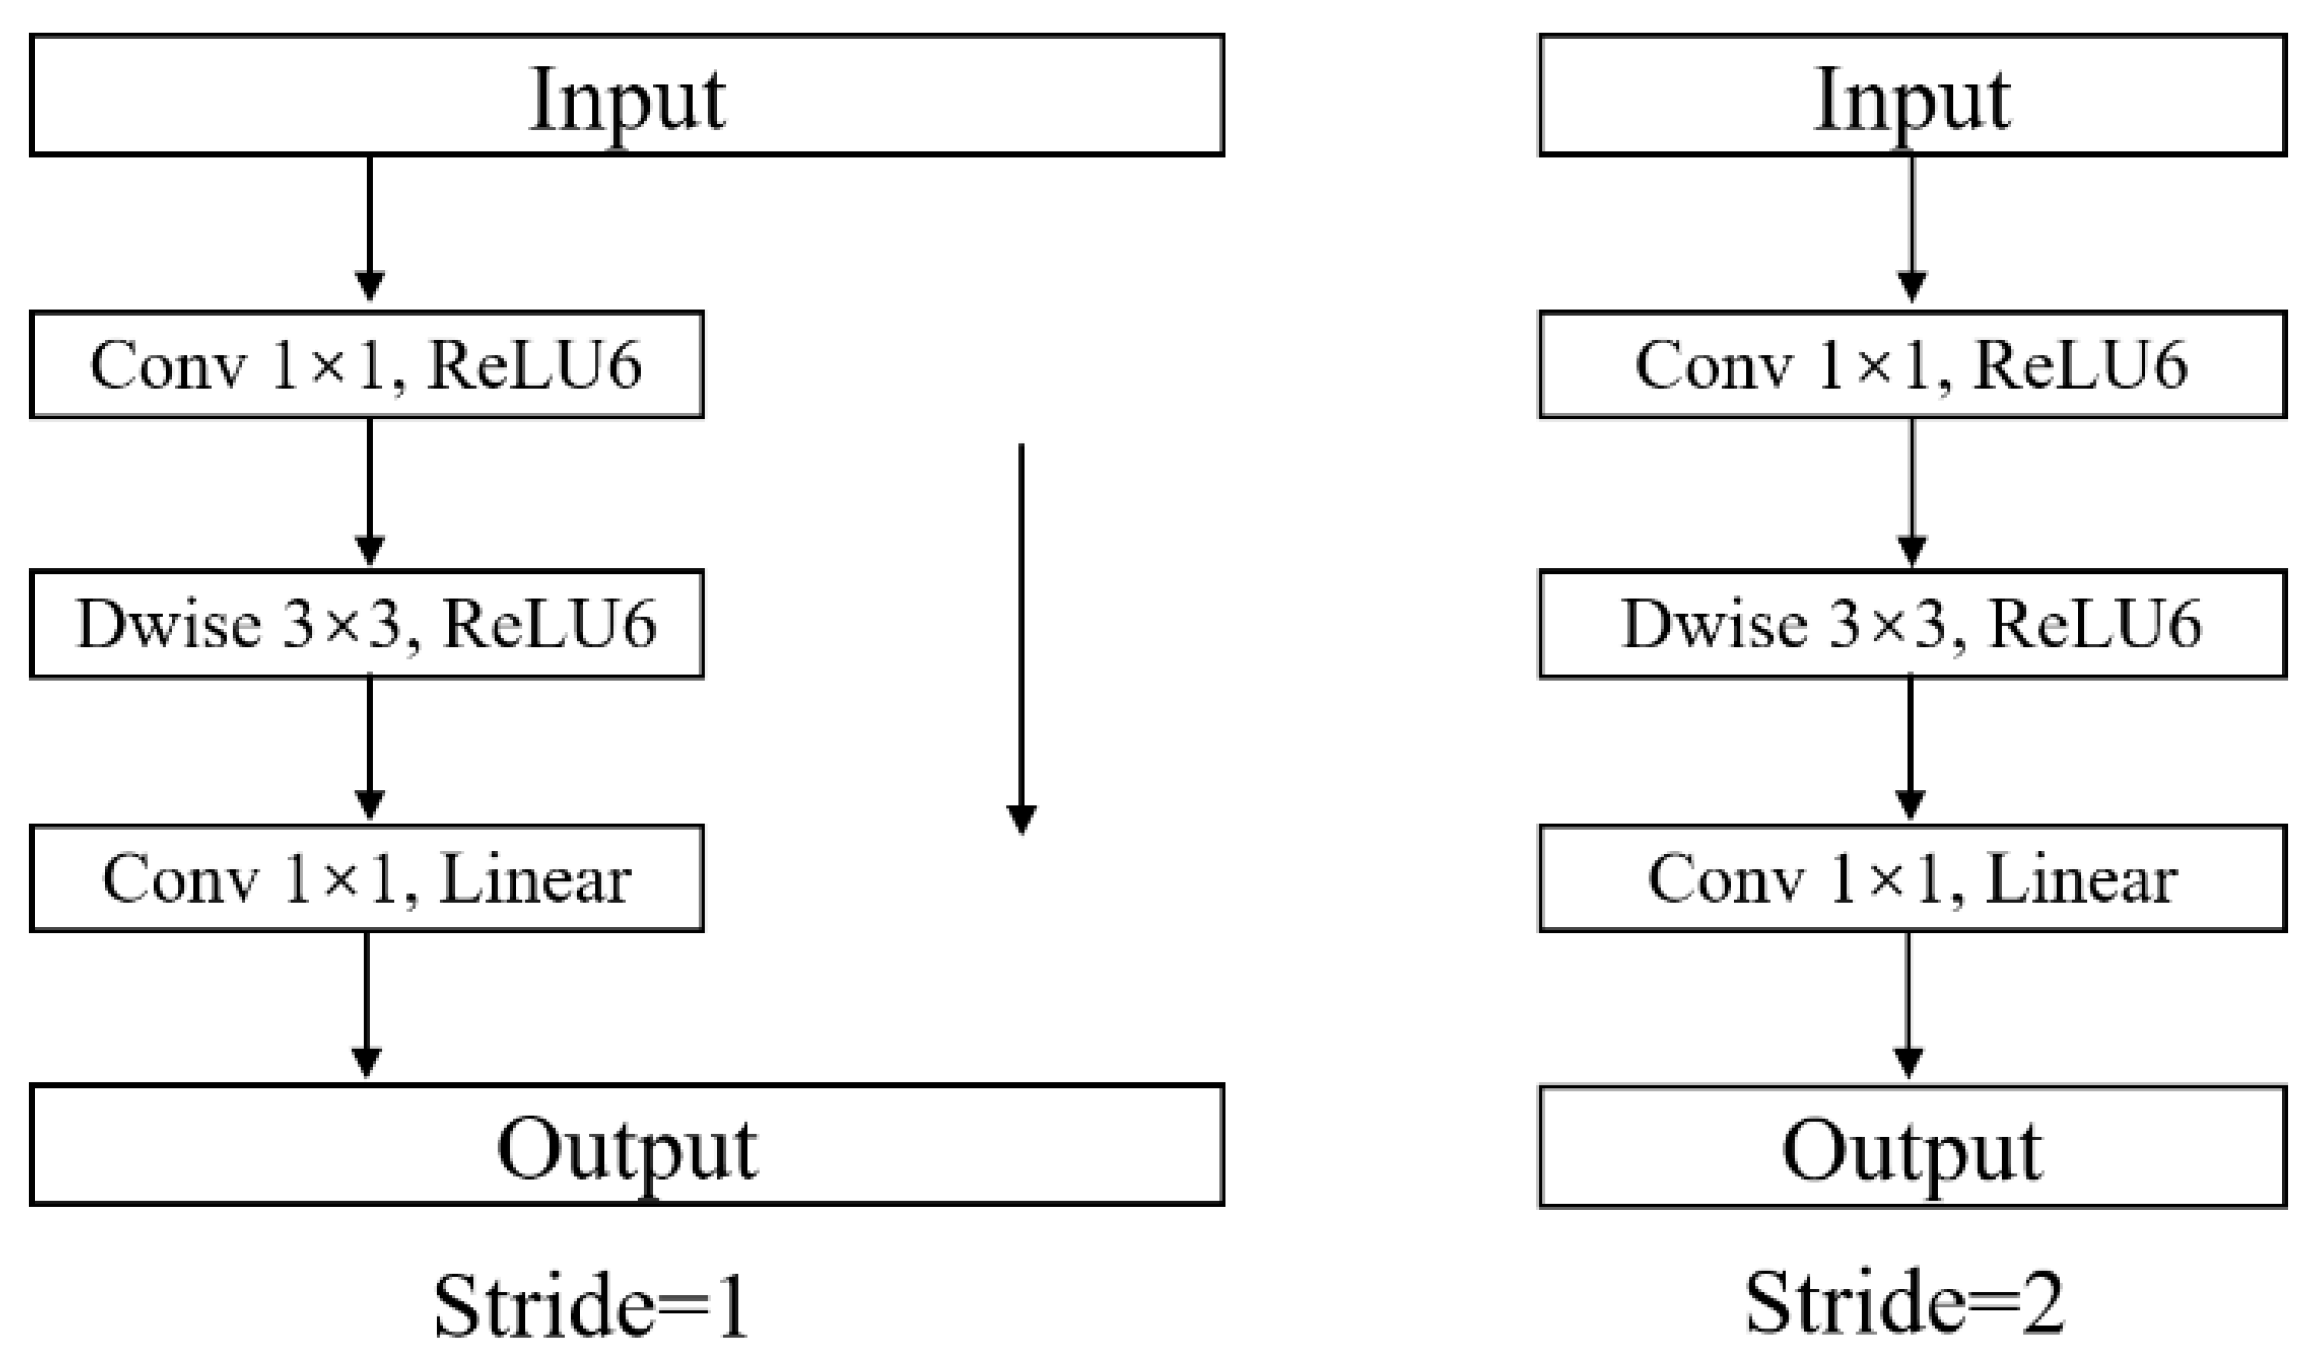
2.3.2. MobileNetV2 Block
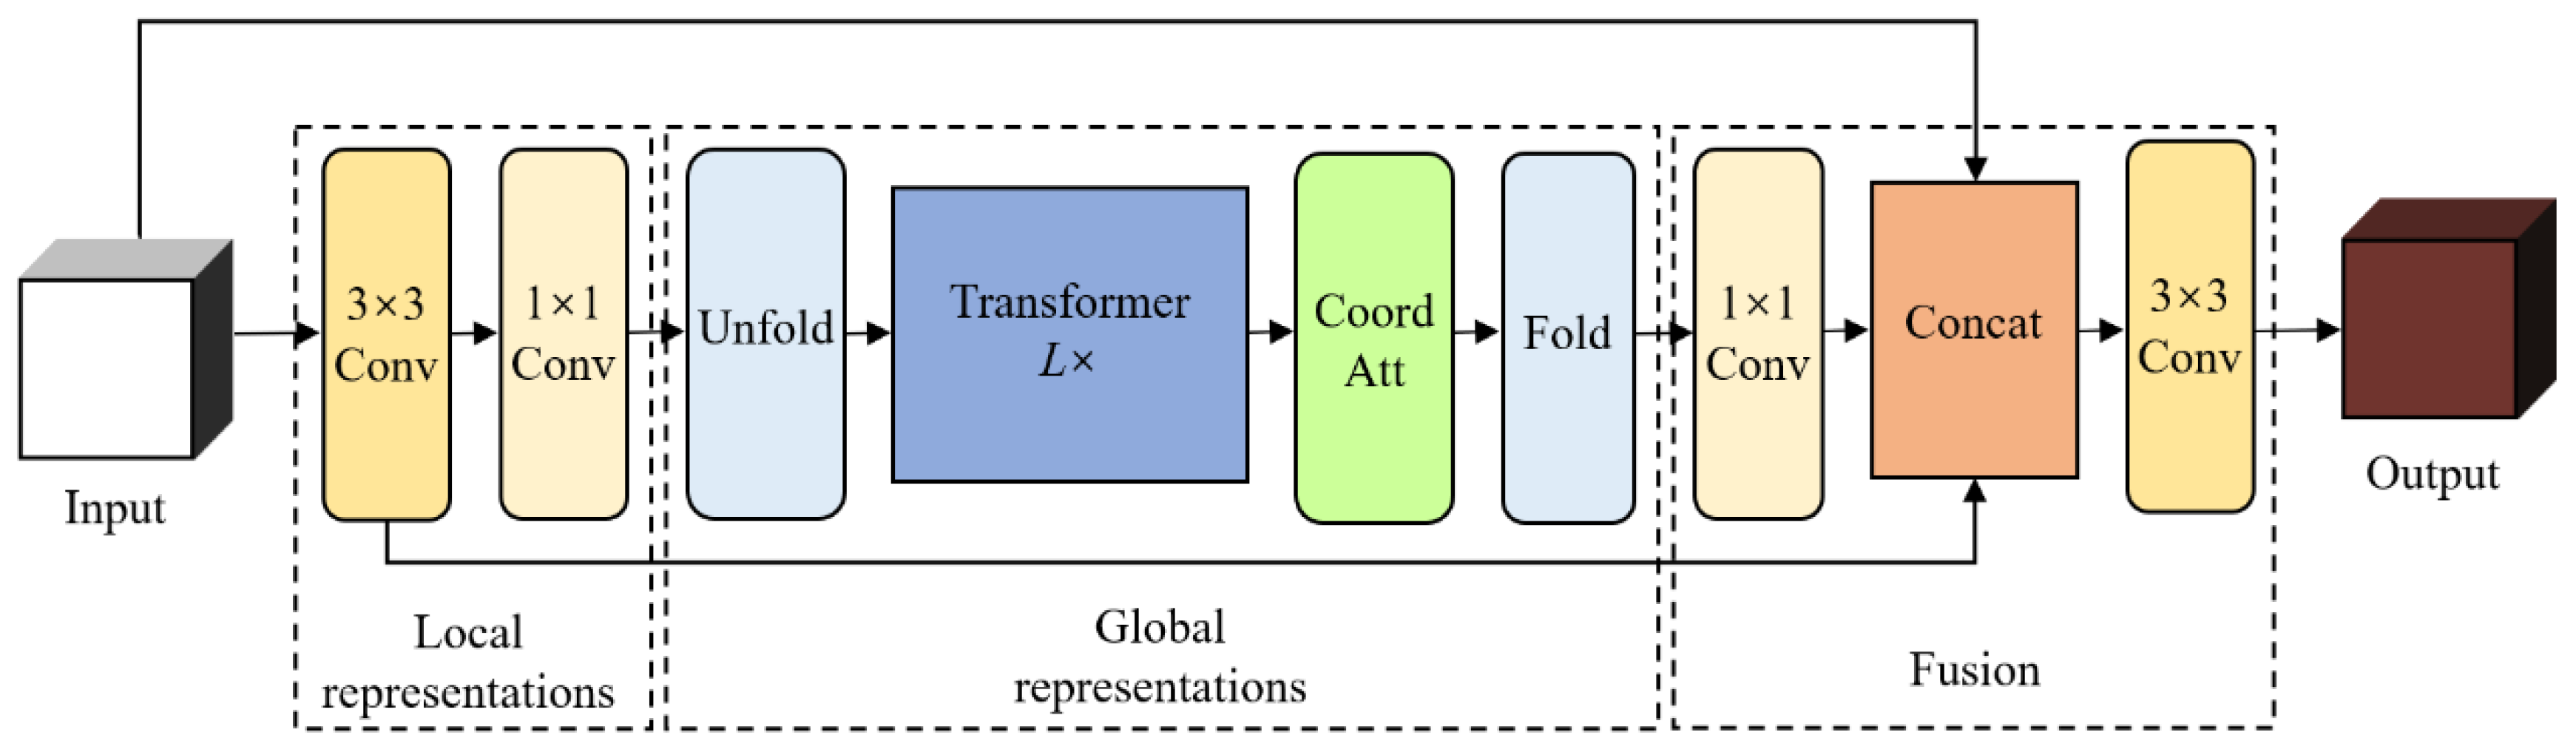
2.3.3. Improvement of the MobileViT Block
- (1)
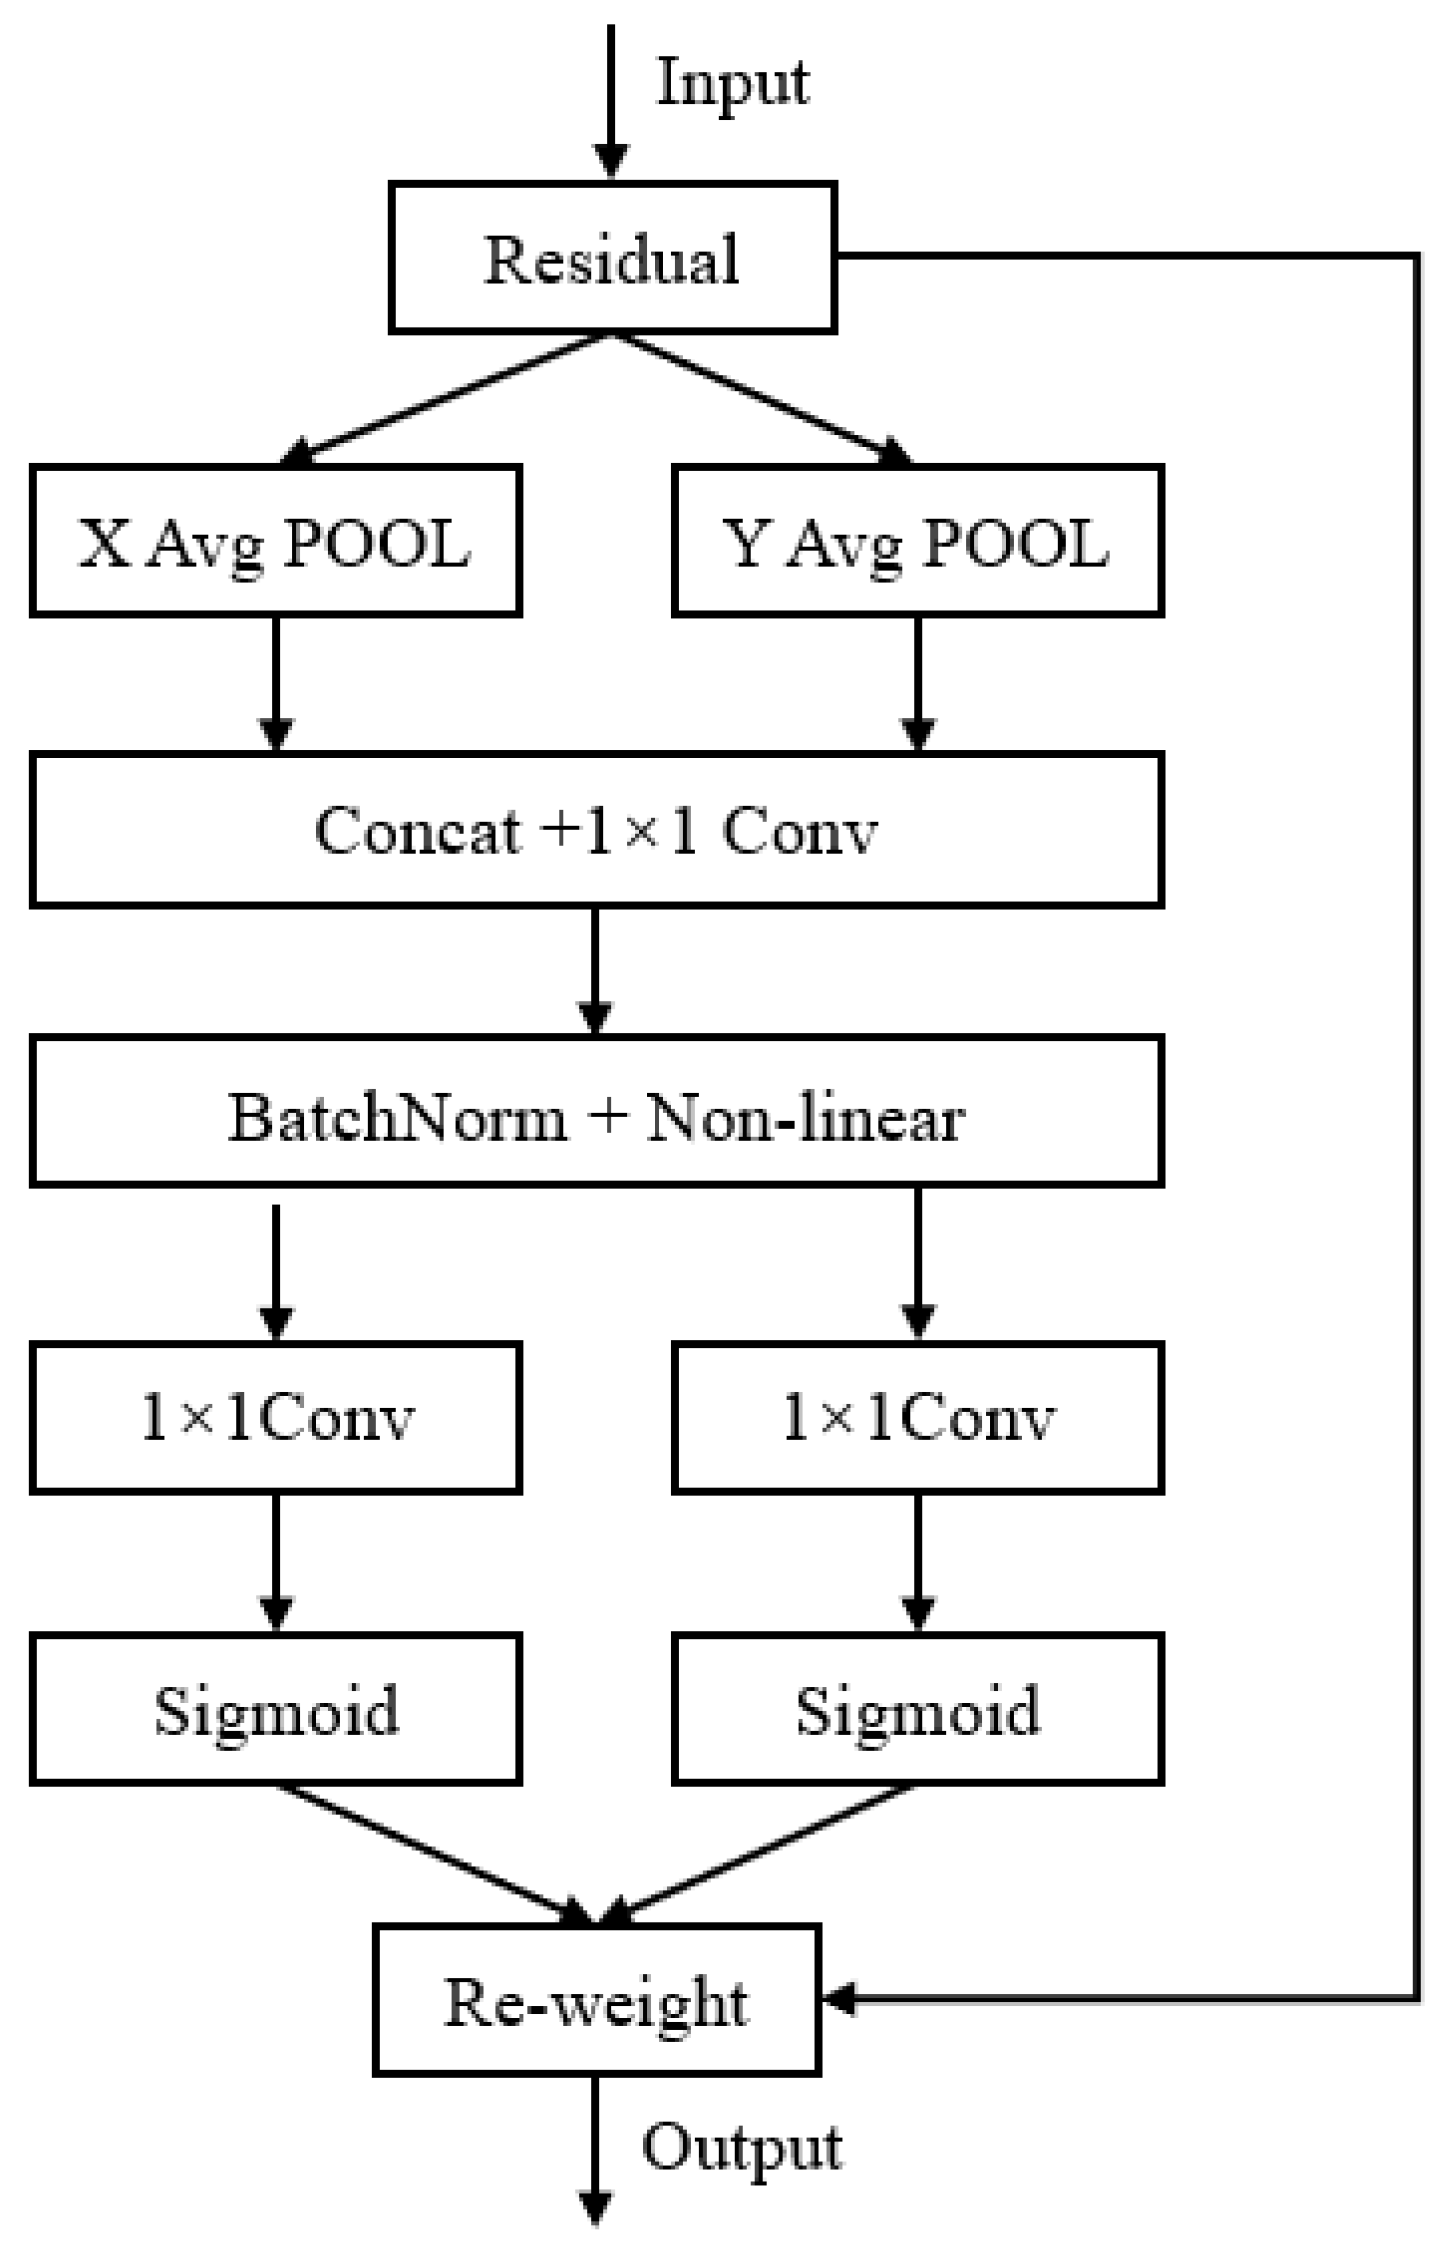
- CoordAtt
- (2)
- Fusion Strategy Improvement
2.3.4. Image Classification Based on Linear Classifier
2.3.5. Dynamic Feeding Strategy
2.4. Model Training and Evaluation Metrics
2.4.1. Model Training
2.4.2. Evaluation Metrics
3. Results
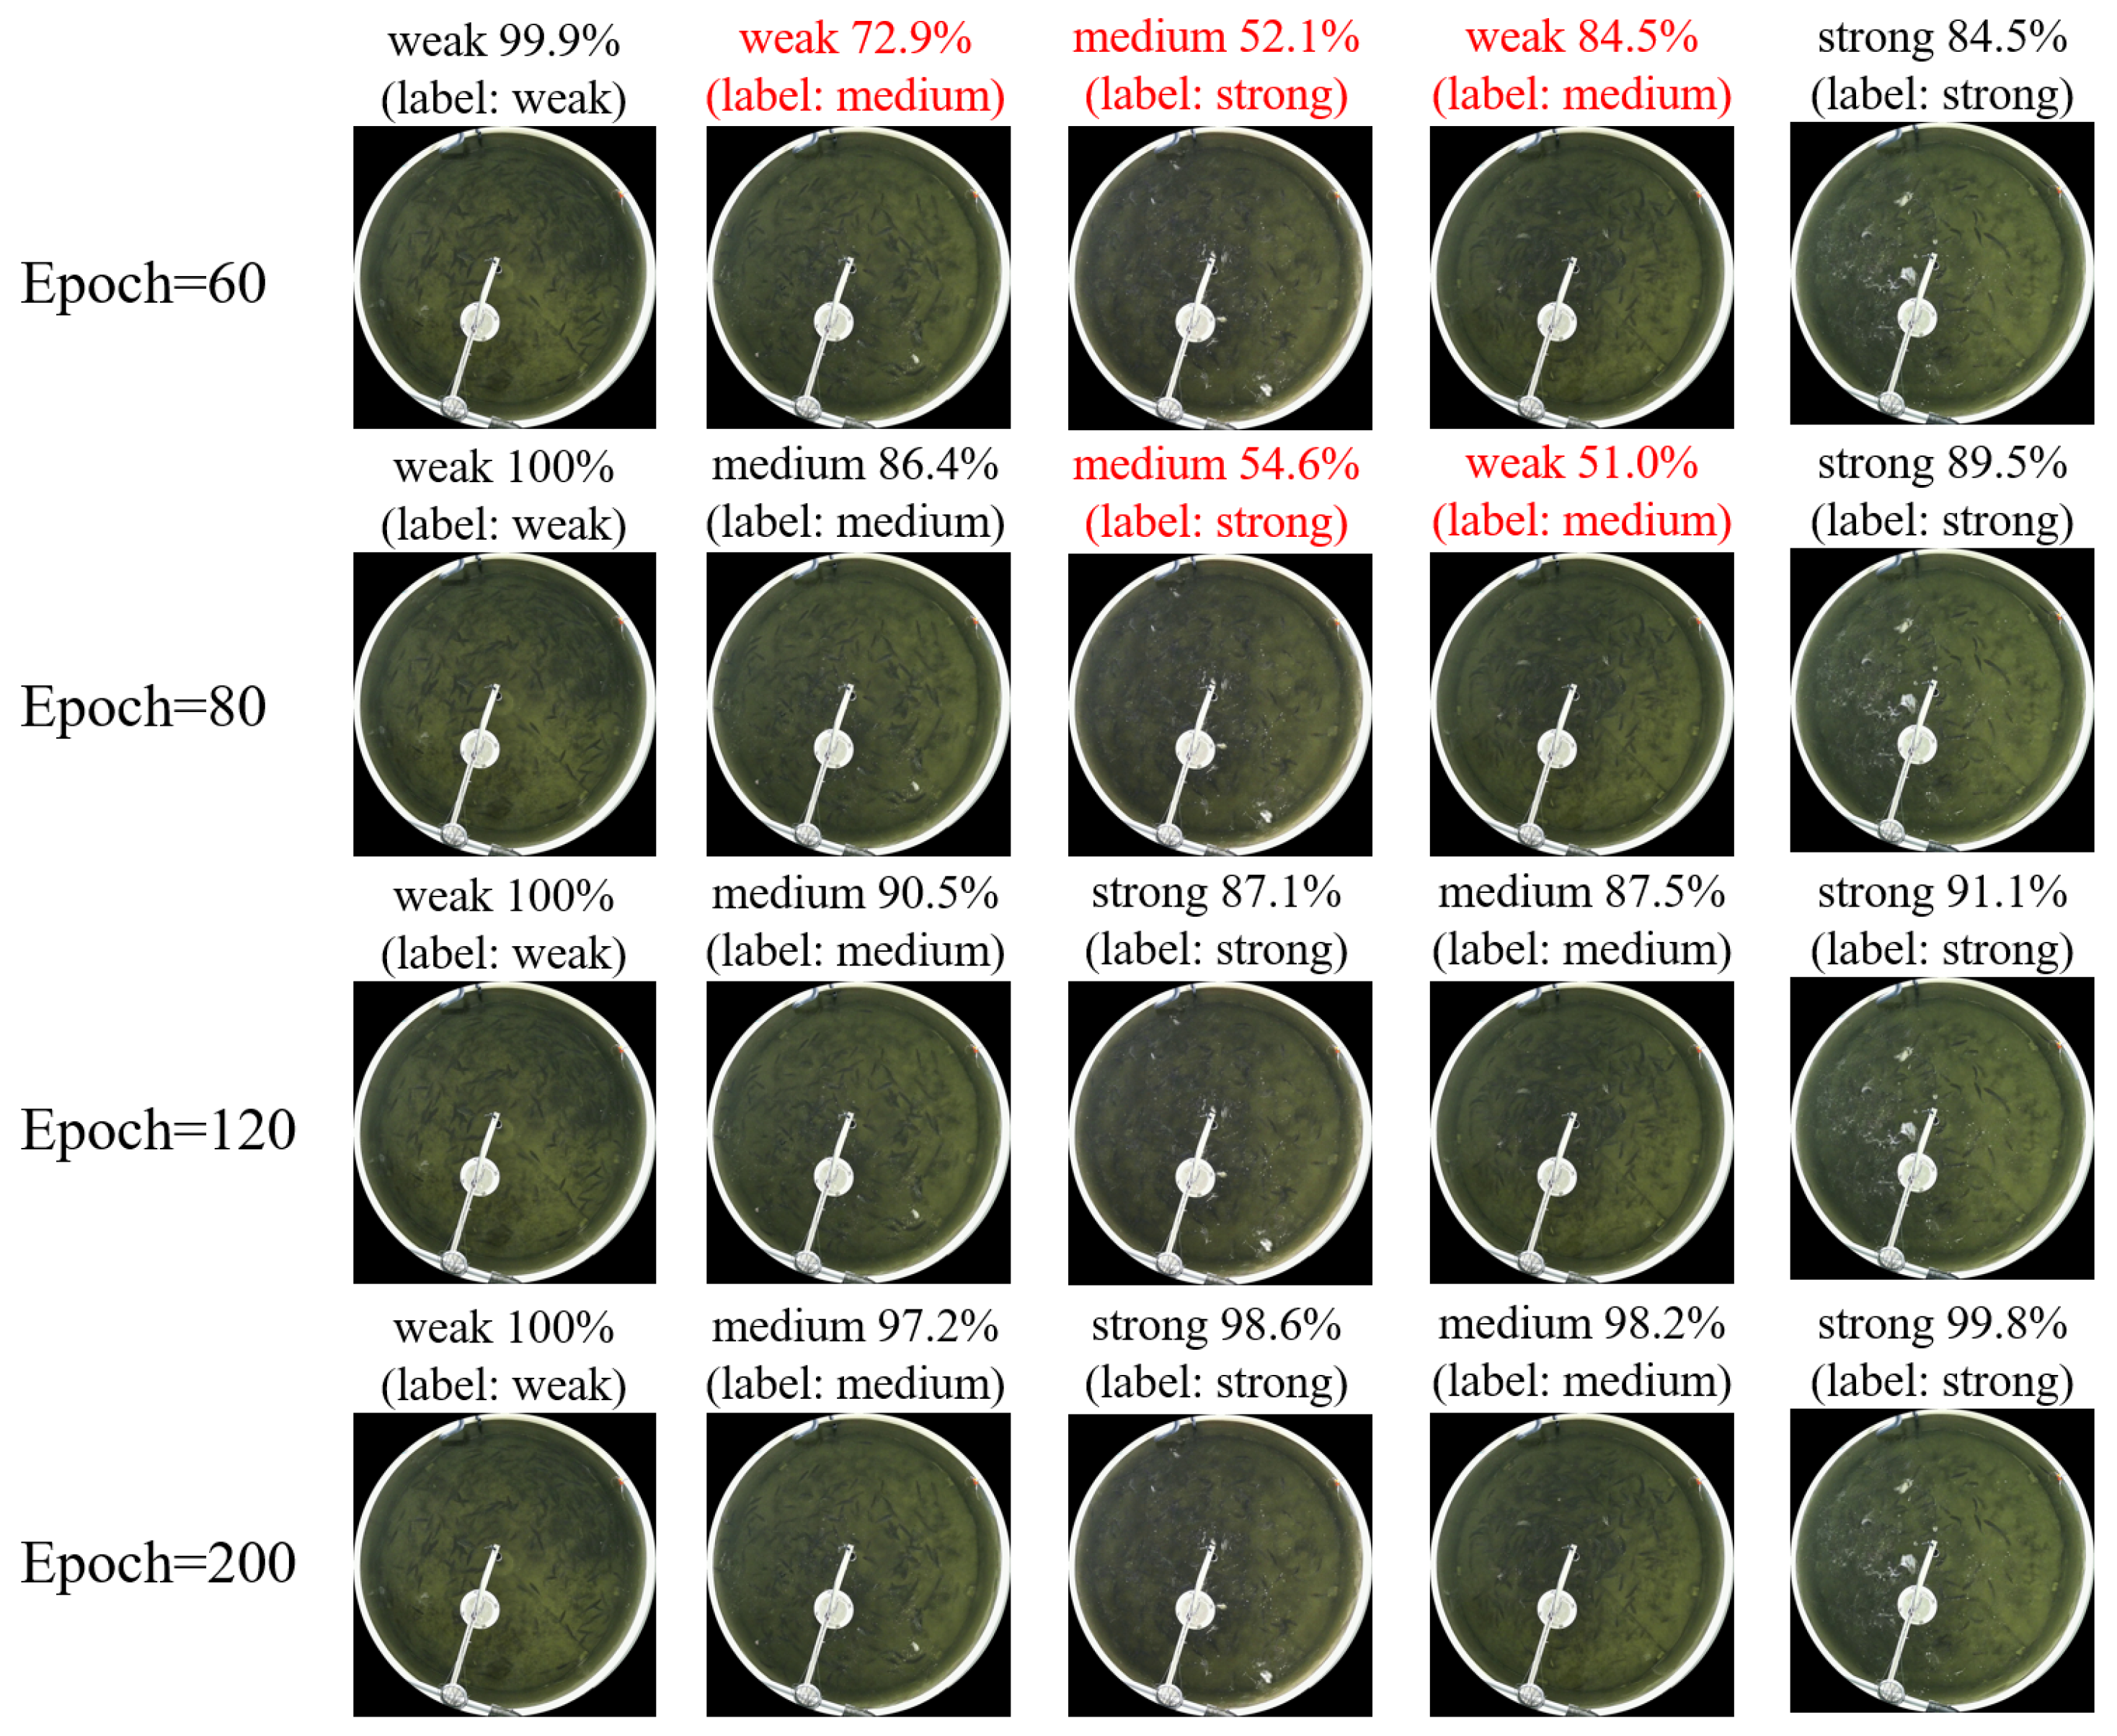
3.1. Model Training Results
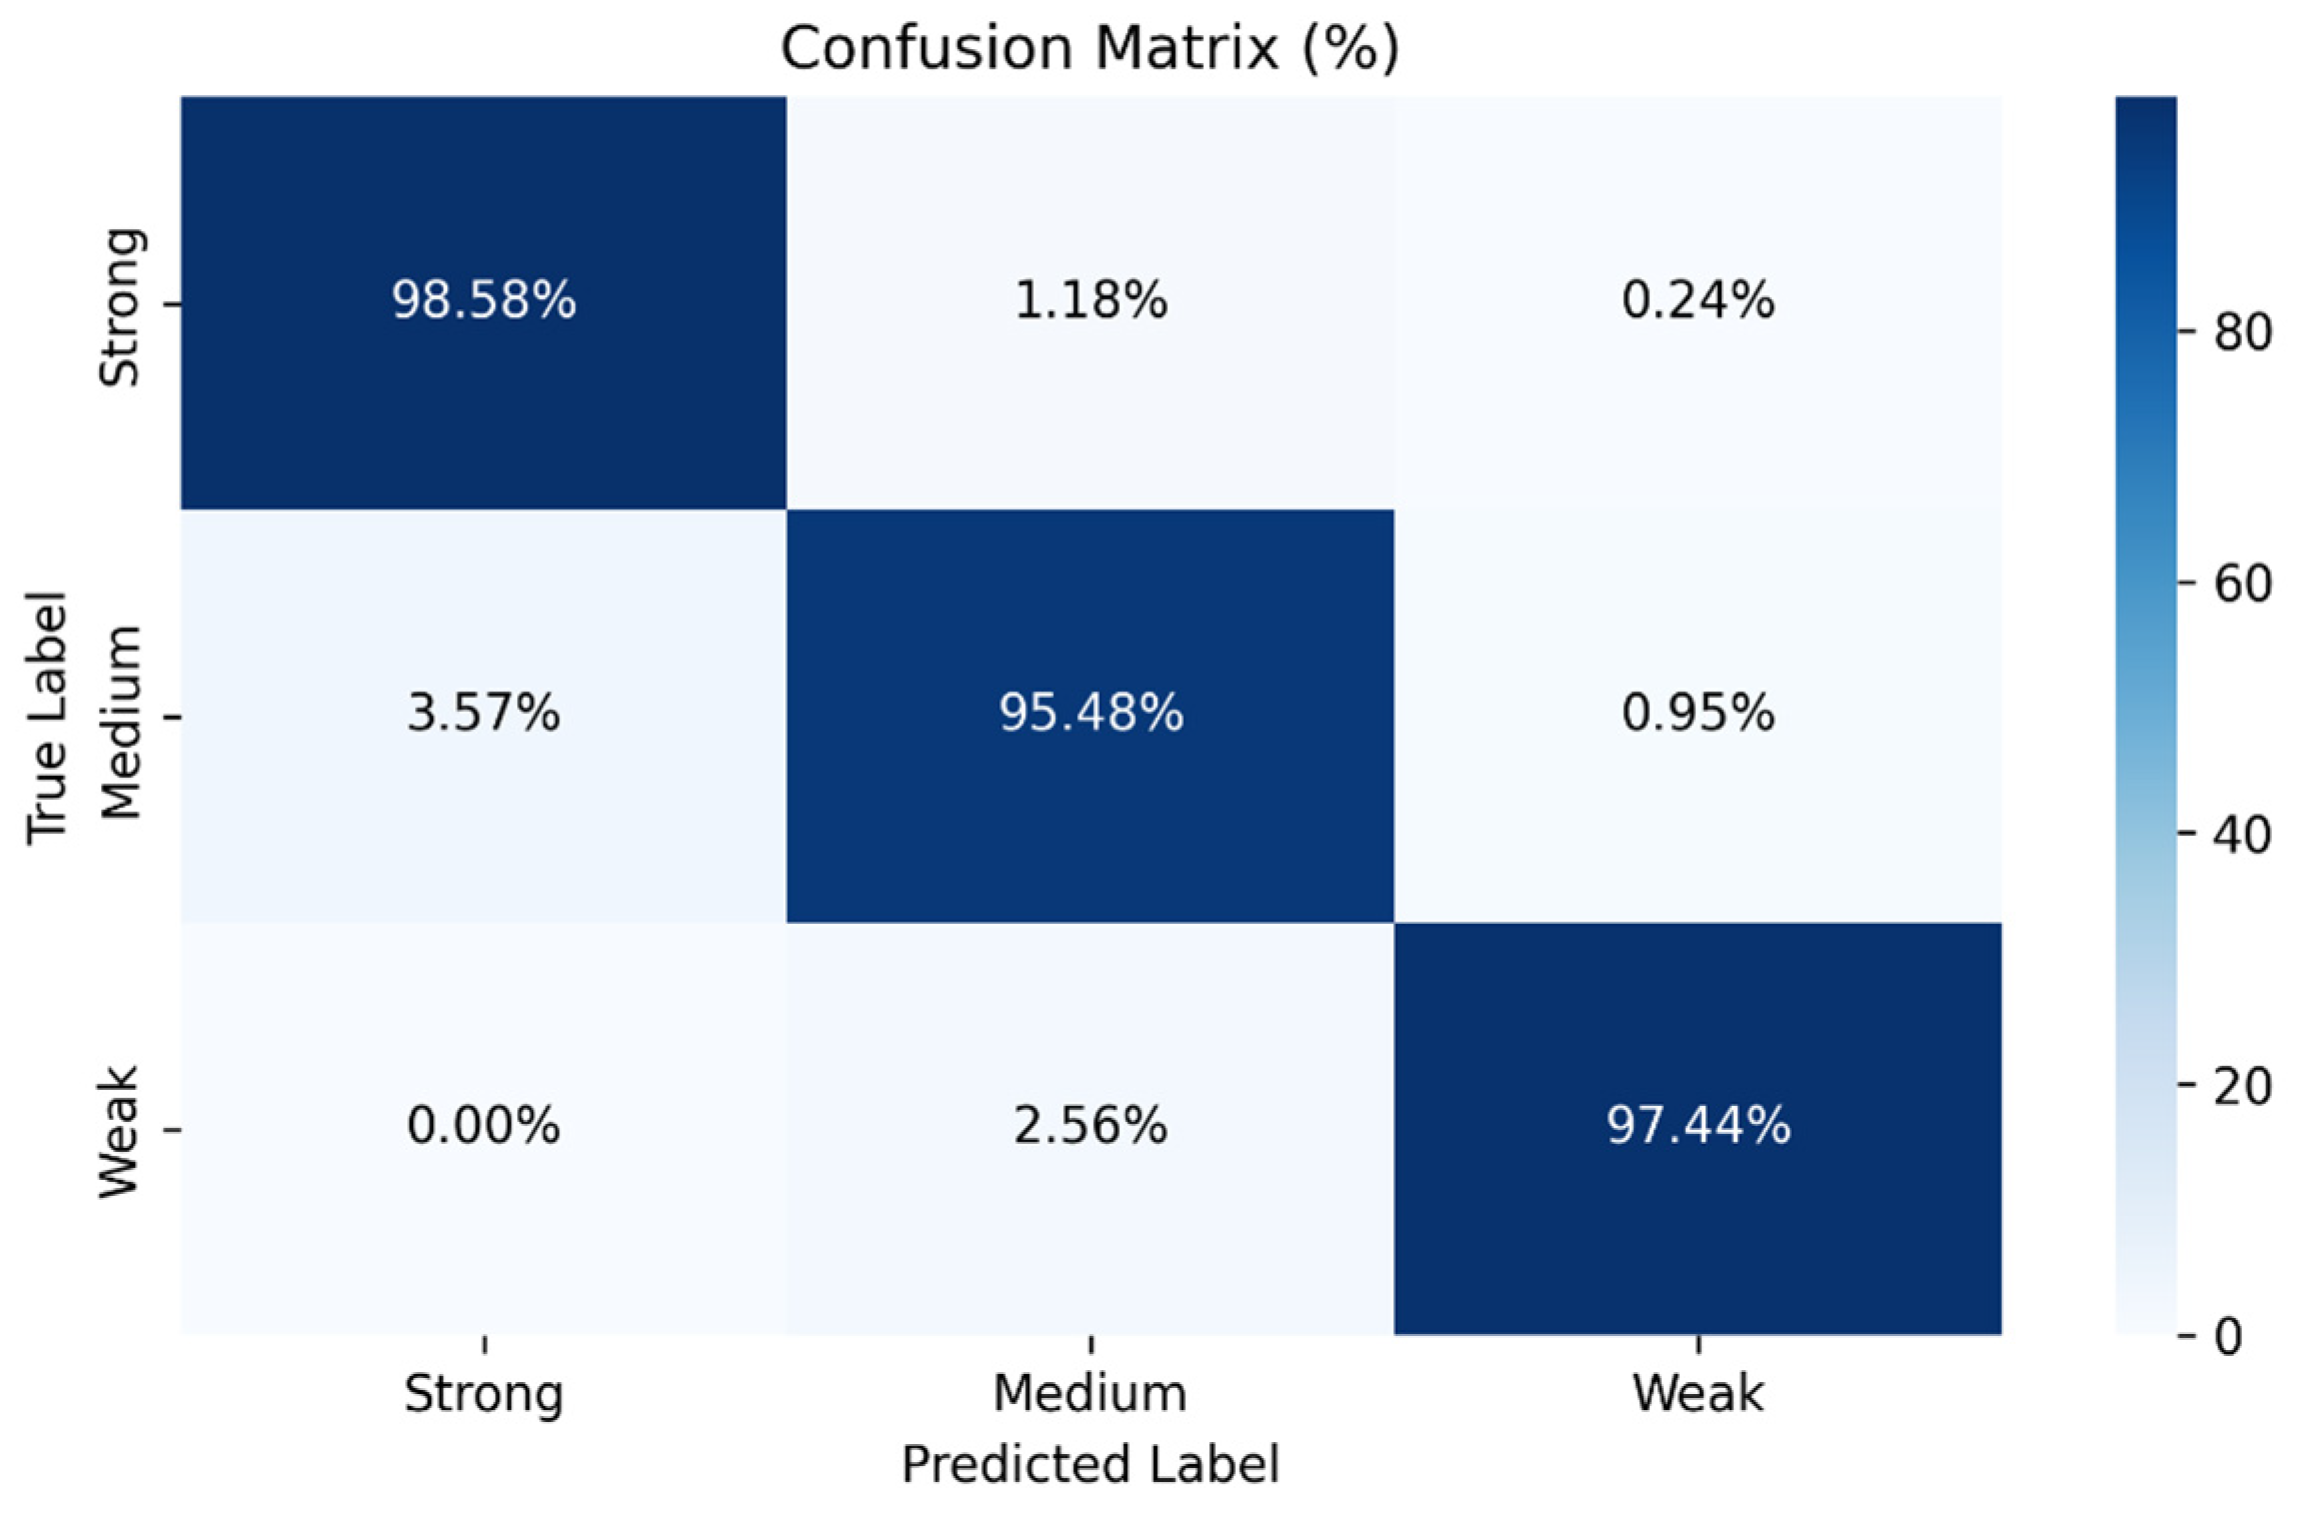
3.2. Model Evaluation Results
3.3. Results of the Comparison Experiments
3.3.1. Comparison of Preprocessing Operation Effects
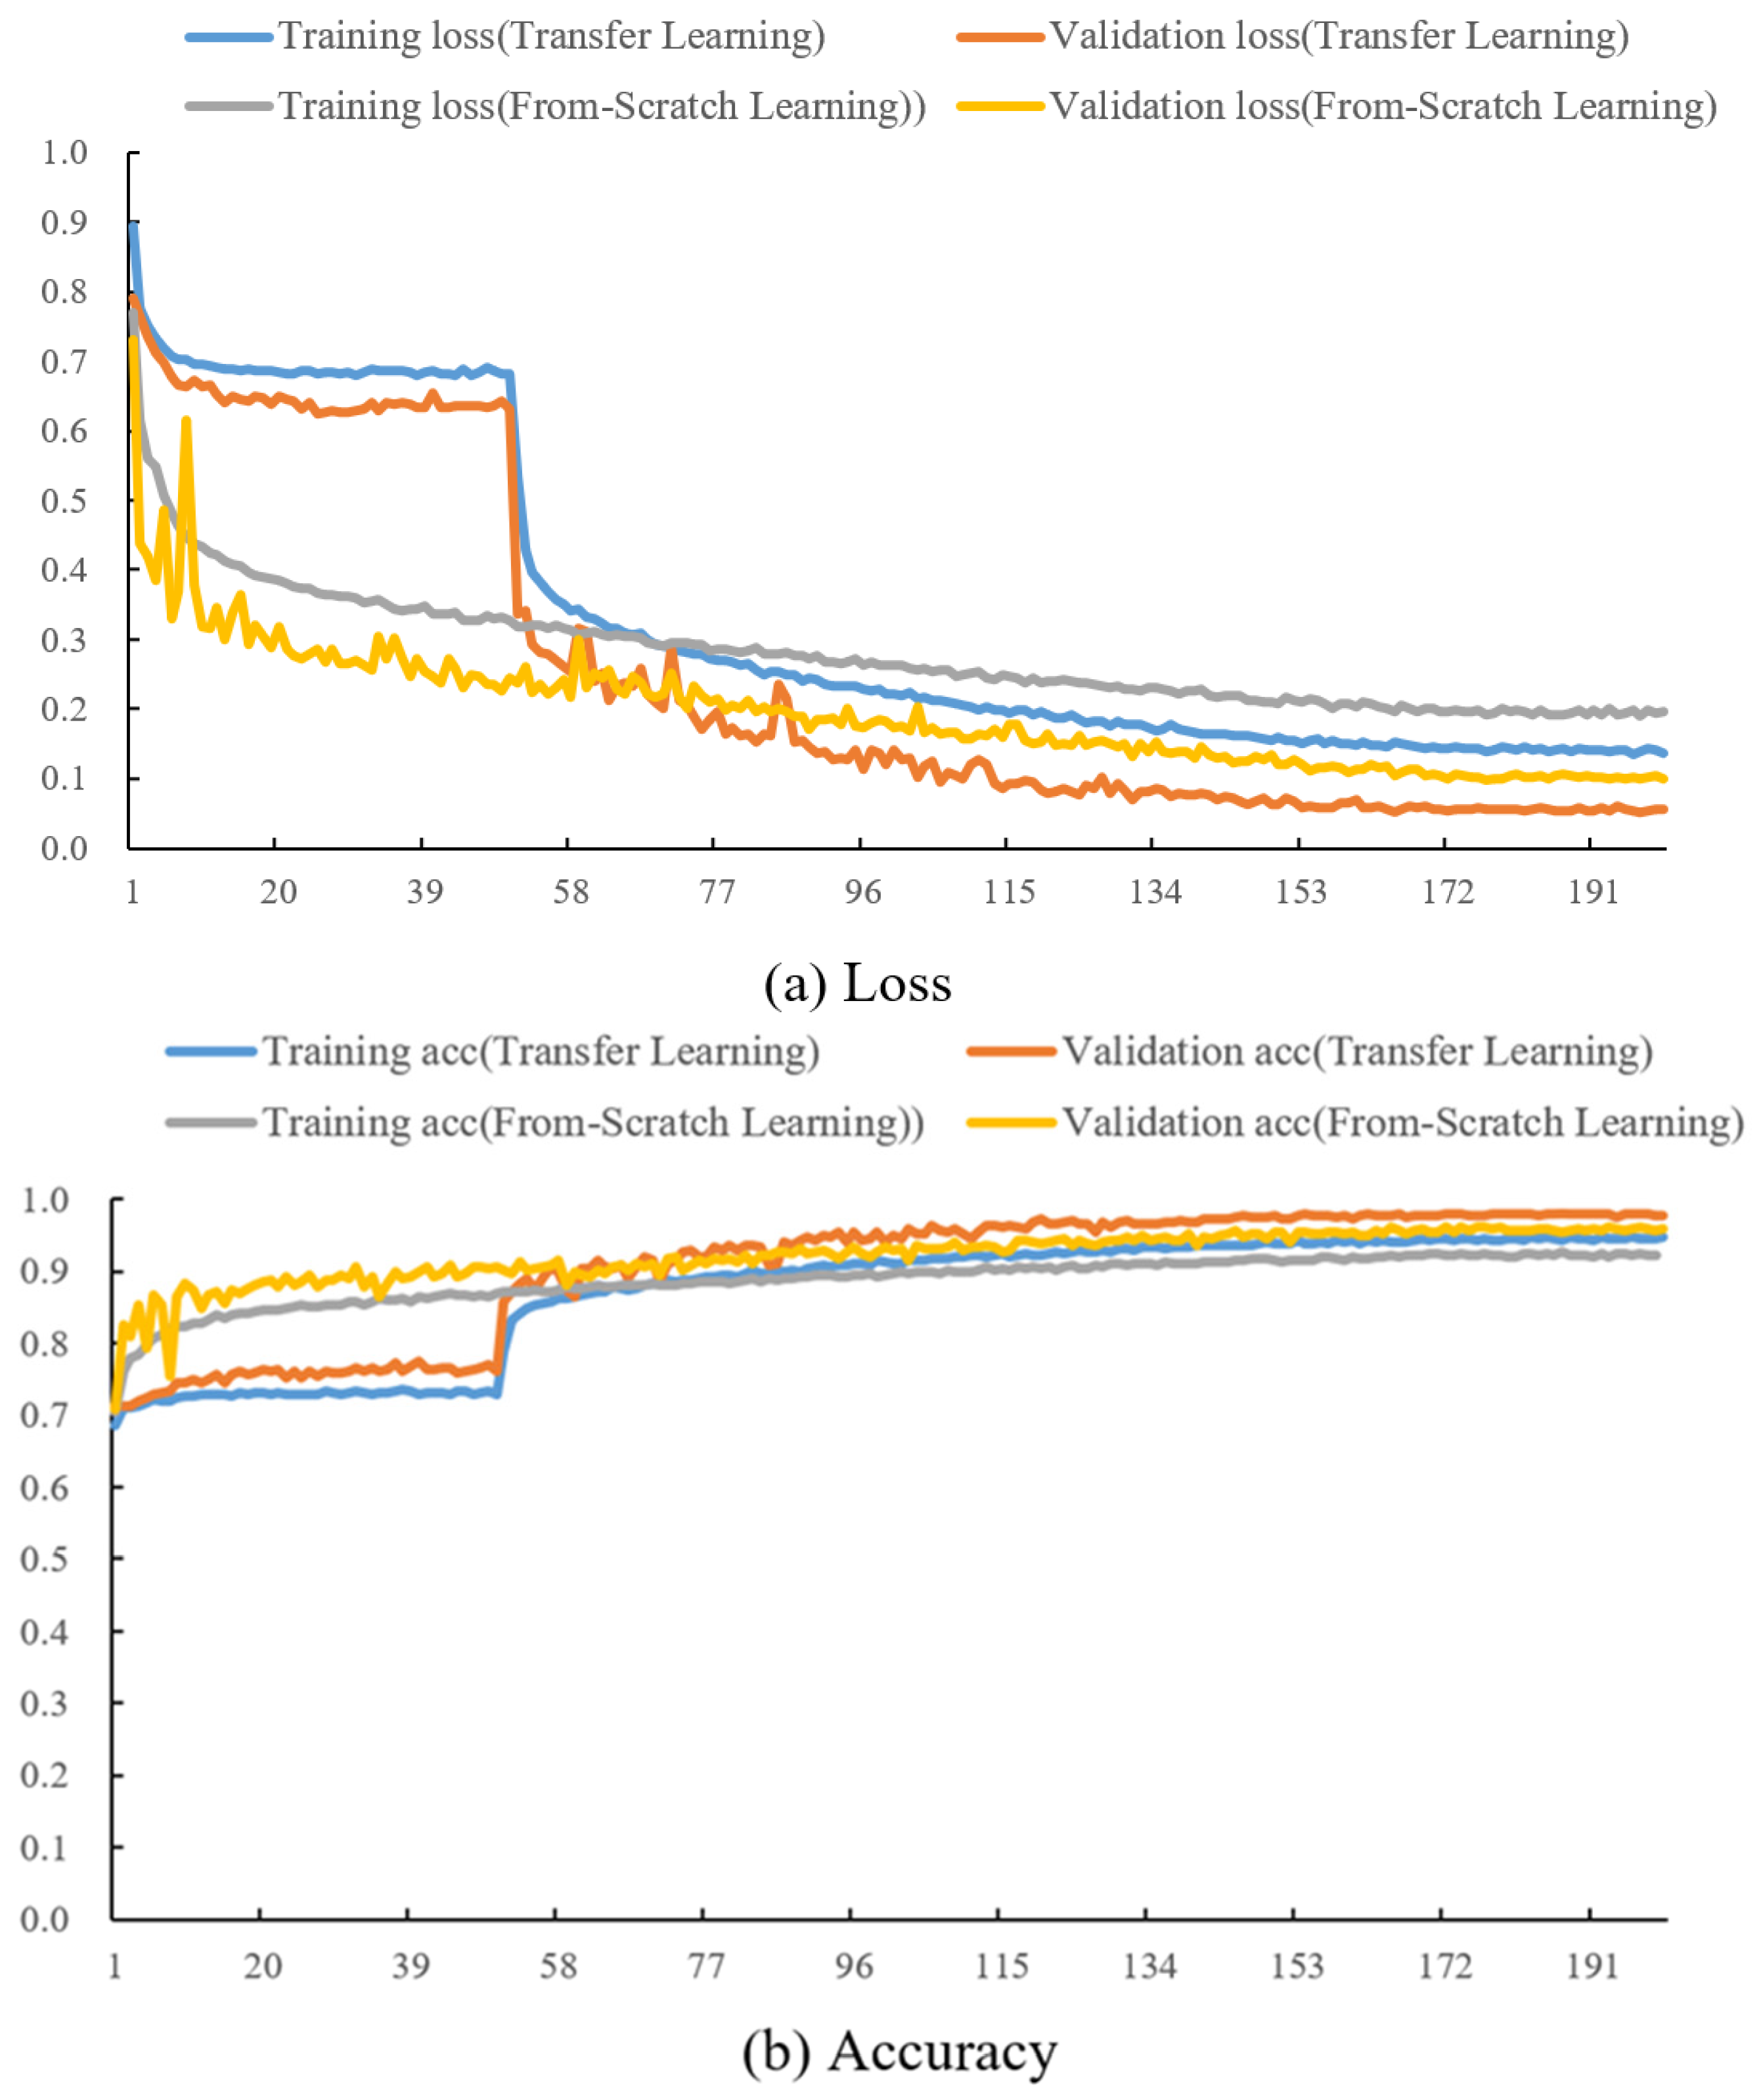
3.3.2. Comparison of Transfer Learning Training Methods
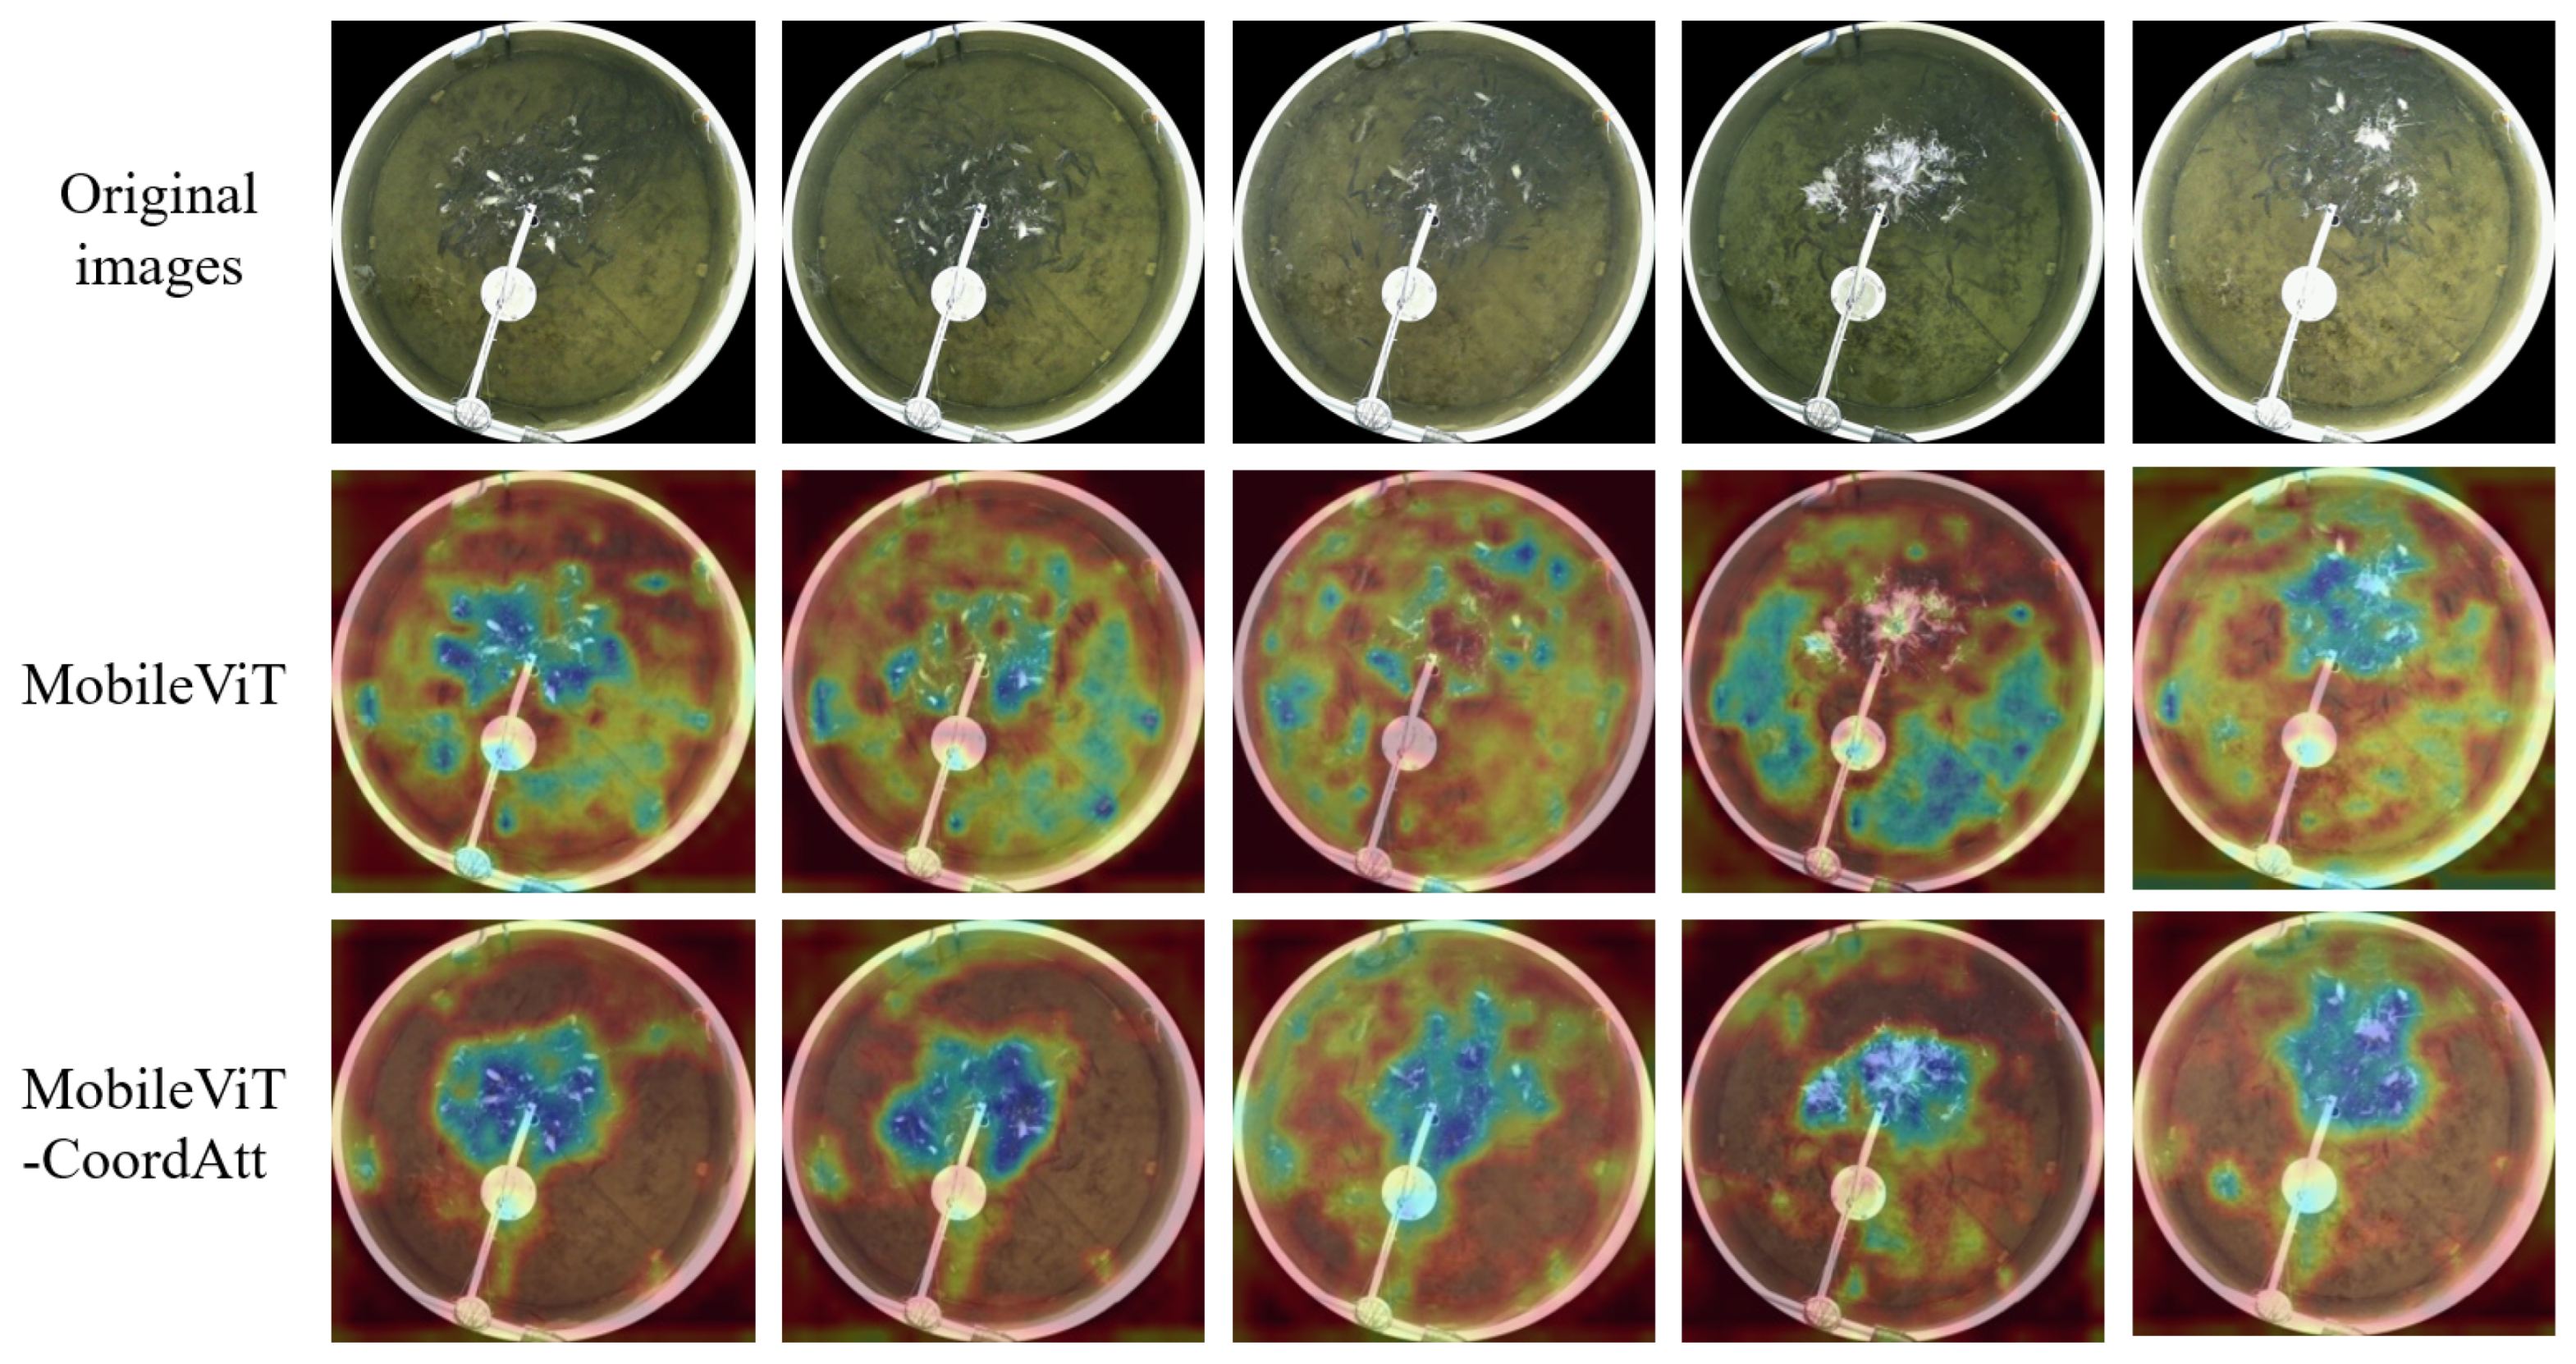
3.3.3. Comparison of the Model Before and After Improvement
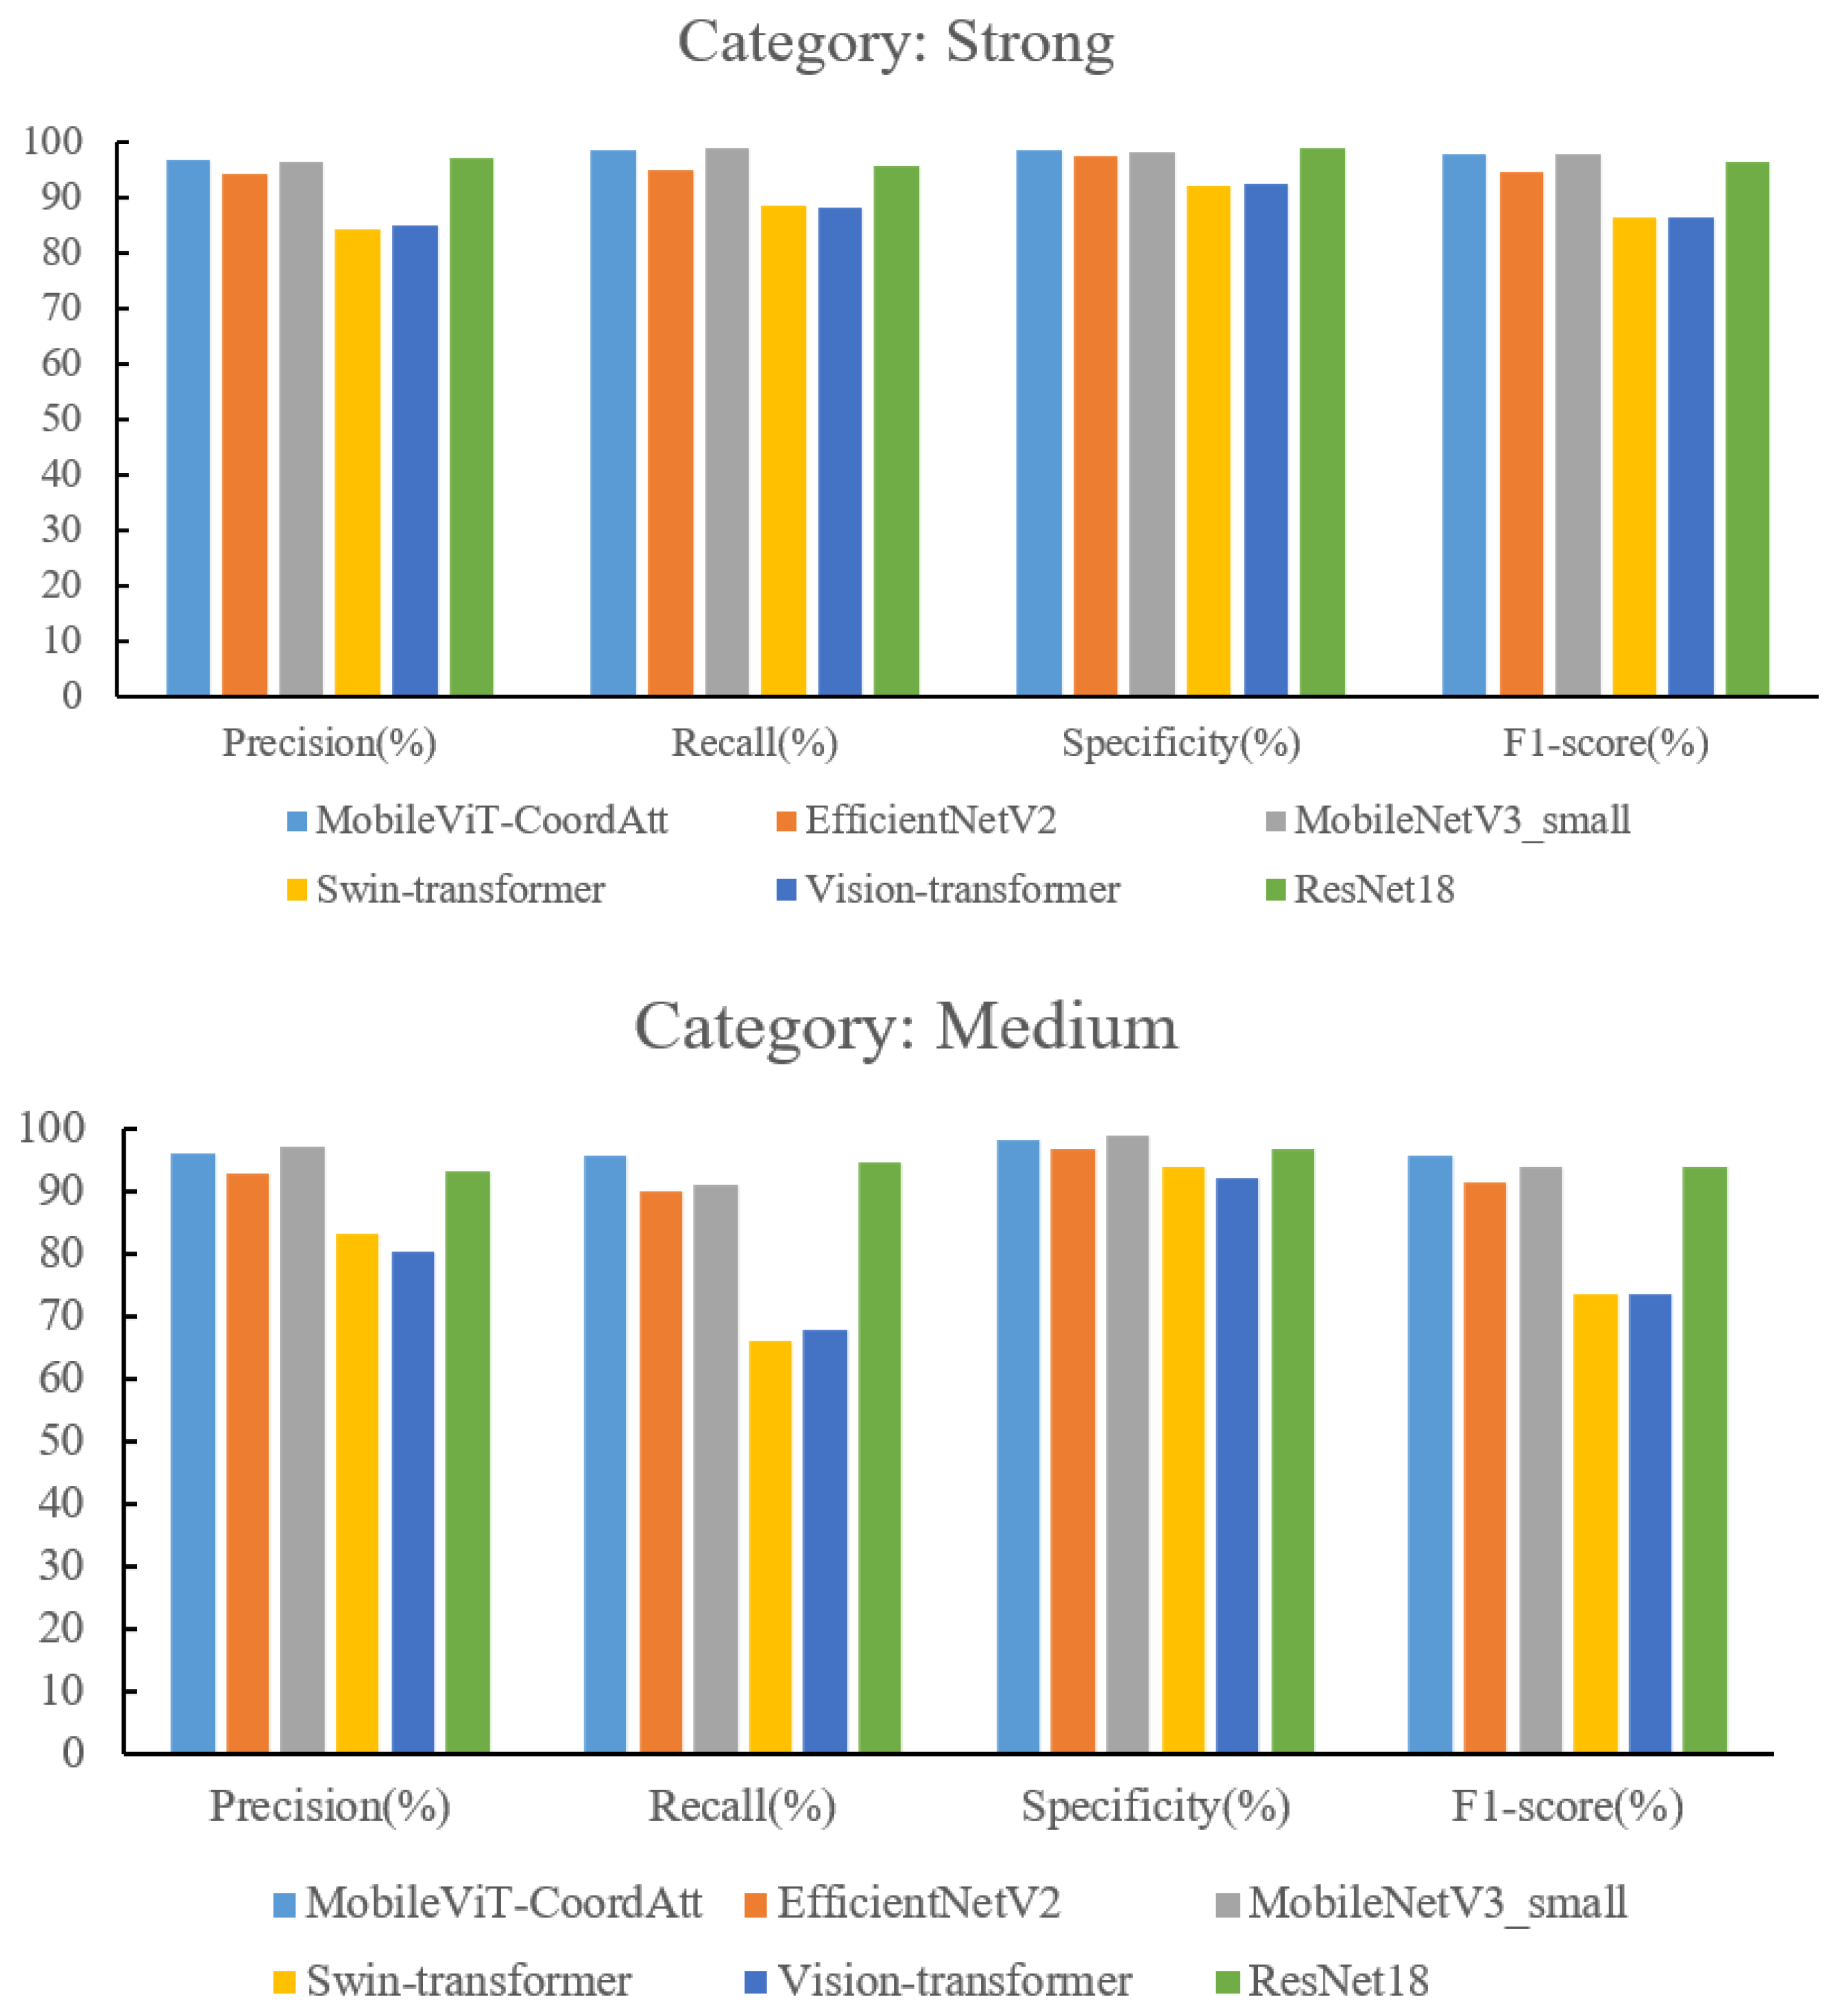
3.3.4. Comparison of Different Models
4. Discussion
4.1. Improvement Efficacy of the Proposed Fish Feeding Intensity Evaluation Methods
4.2. Performance Comparison Across Models
4.3. Dynamic Feeding Strategy Optimization
4.4. Study Limitations
5. Conclusions
Author Contributions
Funding
Institutional Review Board Statement
Informed Consent Statement
Data Availability Statement
Acknowledgments
Conflicts of Interest
References
- Zhang, L.; Li, B.; Sun, X.; Hong, Q.; Duan, Q. Intelligent fish feeding based on machine vision: A review. Biosyst. Eng. 2023, 231, 133–164. [Google Scholar] [CrossRef]
- Villes, V.S.; Durigon, E.G.; Hermes, L.B.; Uczay, J.; Peixoto, N.C.; Lazzari, R. Feeding rates affect growth, metabolism and oxidative status of Nile tilapia rearing in a biofloc system. Trop. Anim. Health Prod. 2024, 56, 208. [Google Scholar] [CrossRef] [PubMed]
- Wang, M.; Li, F.; Wu, J.; Yang, T.; Xu, C.; Zhao, L.; Liu, Y.; Fang, F.; Feng, J. Response of CH4 and N2O emissions to the feeding rates in a pond rice-fish co-culture system. Environ. Sci. Pollut. Res. 2024, 31, 53437–53446. [Google Scholar] [CrossRef] [PubMed]
- Liu, J.; Bienvenido, F.; Yang, X.; Zhao, Z.; Feng, S.; Zhou, C. Nonintrusive and Automatic Quantitative Analysis Methods for Fish Behaviour in Aquaculture. Aquac. Res. 2022, 53, 2985–3000. [Google Scholar] [CrossRef]
- Sadoul, B.; Evouna Mengues, P.; Friggens, N.C.; Prunet, P.; Colson, V. A New Method for Measuring Group Behaviours of Fish Shoals from Recorded Videos Taken in near Aquaculture Conditions. Aquaculture 2014, 430, 179–187. [Google Scholar] [CrossRef]
- Liu, Z.; Li, X.; Fan, L.; Lu, H.; Liu, L.; Liu, Y. Measuring Feeding Activity of Fish in RAS Using Computer Vision. Aquac. Eng. 2014, 60, 20–27. [Google Scholar] [CrossRef]
- Zhou, C.; Zhang, B.; Lin, K.; Xu, D.; Chen, C.; Yang, X.; Sun, C. Near-Infrared Imaging to Quantify the Feeding Behavior of Fish in Aquaculture. Comput. Electron. Agric. 2017, 135, 233–241. [Google Scholar] [CrossRef]
- Zhao, J.; Bao, W.J.; Zhang, F.D.; Ye, Z.Y.; Liu, Y.; Shen, M.W.; Zhu, S.M. Assessing Appetite of the Swimming Fish Based on Spontaneous Collective Behaviors in a Recirculating Aquaculture System. Aquac. Eng. 2017, 78, 196–204. [Google Scholar] [CrossRef]
- Yang, X.; Zhang, S.; Liu, J.; Gao, Q.; Dong, S.; Zhou, C. Deep Learning for Smart Fish Farming: Applications, Opportunities and Challenges. Rev. Aquac. 2021, 13, 66–90. [Google Scholar] [CrossRef]
- Chen, L.; Yang, X.; Sun, C.; Wang, Y.; Xu, D.; Zhou, C. Feed Intake Prediction Model for Group Fish Using the MEA-BP Neural Network in Intensive Aquaculture. Inf. Process. Agric. 2020, 7, 261–271. [Google Scholar] [CrossRef]
- Adegboye, M.A.; Aibinu, A.M.; Kolo, J.G.; Aliyu, I.; Folorunso, T.A.; Lee, S.H. Incorporating Intelligence in Fish Feeding System for Dispensing Feed Based on Fish Feeding Intensity. IEEE Access 2020, 8, 91948–91960. [Google Scholar] [CrossRef]
- Måløy, H.; Aamodt, A.; Misimi, E. A Spatio-Temporal Recurrent Network for Salmon Feeding Action Recognition from Underwater Videos in Aquaculture. Comput. Electron. Agric. 2019, 167, 105087. [Google Scholar] [CrossRef]
- Zhou, C.; Xu, D.; Chen, L.; Zhang, S.; Sun, C.; Yang, X.; Wang, Y. Evaluation of Fish Feeding Intensity in Aquaculture Using a Convolutional Neural Network and Machine Vision. Aquaculture 2019, 507, 457–465. [Google Scholar] [CrossRef]
- Yang, L.; Yu, H.; Cheng, Y.; Mei, S.; Duan, Y.; Li, D.; Chen, Y. A Dual Attention Network Based on EfficientNet-B2 for Short-Term Fish School Feeding Behavior Analysis in Aquaculture. Comput. Electron. Agric. 2021, 187, 106316. [Google Scholar] [CrossRef]
- Zhang, L.; Wang, J.; Li, B.; Liu, Y.; Zhang, H.; Duan, Q. A MobileNetV2-SENet-Based Method for Identifying Fish School Feeding Behavior. Aquac. Eng. 2022, 99, 102288. [Google Scholar] [CrossRef]
- Feng, S.; Yang, X.; Liu, Y.; Zhao, Z.; Liu, J.; Yan, Y.; Zhou, C. Fish Feeding Intensity Quantification Using Machine Vision and a Lightweight 3D ResNet-GloRe Network. Aquac. Eng. 2022, 98, 102244. [Google Scholar] [CrossRef]
- Liu, J.; Becerra, A.T.; Bienvenido-Barcena, J.F.; Yang, X.; Zhao, Z.; Zhou, C. CFFI-Vit: Enhanced Vision Transformer for the Accurate Classification of Fish Feeding Intensity in Aquaculture. J. Mar. Sci. Eng. 2024, 12, 1132. [Google Scholar] [CrossRef]
- Zhang, L.; Liu, Z.; Zheng, Y.; Li, B. Feeding intensity identification method for pond fish school using dual-label and MobileViT-SENet. Biosyst. Eng. 2024, 241, 113–128. [Google Scholar] [CrossRef]
- Mehta, S.; Rastegari, M. MobileViT_Light-weight__General-purpose__and_Mobile-friendly_Vision_Transformer. In Proceedings of the Tenth International Conference on Learning Representations, Virtual, 25 April 2022. [Google Scholar]
- Sandler, M.; Howard, A.; Zhu, M.; Zhmoginov, A.; Chen, L.-C. MobileNetV2_Inverted_Residuals_and_Linear_Bottlenecks. In Proceedings of the 2018 IEEE/CVF Conference on Computer Vision and Pattern Recognition, Salt Lake City, UT, USA, 18–23 June 2018. [Google Scholar]
- Hou, Q.; Zhou, D.; Feng, J. Coordinate Attention for Efficient Mobile Network Design. In Proceedings of the 2021 IEEE/CVF Conference on Computer Vision and Pattern Recognition (CVPR), Nashville, TN, USA, 20–25 June 2021. [Google Scholar]
- Li, H.; Chen, Y.; Li, W.; Wang, Q.; Duan, Y.; Chen, T. An adaptive method for fish growth prediction with empirical knowledge extraction. Biosyst. Eng. 2021, 212, 336–346. [Google Scholar] [CrossRef]
- Zhu, Z.; Lin, K.; Jain, A.K.; Zhou, J. Transfer Learning in Deep Reinforcement Learning: A Survey. IEEE Trans. Pattern Anal. Mach. Intell. 2023, 45, 13344–13362. [Google Scholar] [CrossRef] [PubMed]
- Tan, M.; Le, Q.V. EfficientNetV2 Smaller Models and Faster Training. In Proceedings of the Thirty-Eighth International Conference on Machine Learning, Virtual, 18–24 July 2021. [Google Scholar]
- Howard, A.; Sandler, M.; Chu, G.; Chen, L.-C.; Chen, B.; Tan, M.; Wang, W.; Zhu, Y.; Pang, R.; Vasudevan, V.; et al. Searching for MobileNetV3. In Proceedings of the 2019 IEEE/CVF International Conference on Computer Vision (ICCV), Seoul, Republic of Korea, 27 October–2 November 2019. [Google Scholar]
- He, K.; Zhang, X.; Ren, S.; Sun, J. Deep Residual Learning for Image Recognition. In Proceedings of the 2016 IEEE Conference on Computer Vision and Pattern Recognition (CVPR), Las Vegas, NV, USA, 7–30 June 2019. [Google Scholar]
- Liu, Z.; Lin, Y.; Cao, Y.; Hu, H.; Wei, Y.; Zhang, Z.; Lin, S.; Guo, B. Swin Transformer Hierarchical Vision Transformer using Shifted Windows. In Proceedings of the 2021 IEEE/CVF International Conference on Computer Vision (ICCV), Montreal, QC, Canada, 10–17 October 2021. [Google Scholar]
- Dosovitskiy, A.; Beyer, L.; Kolesnikov, A.; Weissenborn, D.; Zhai, X.; Unterthiner, T.; Dehghani, M.; Minderer, M.; Heigold, G.; Gelly, S.; et al. An Image is Worth 16x16 Words Transformers for Image Recognition at Scale. In Proceedings of the Ninth International Conference on Learning Representations, Virtual, 3–7 May 2021. [Google Scholar]


| Category | Training Set | Validation Set | Testing Set | Total |
|---|---|---|---|---|
| Strong | 887 | 98 | 423 | 1408 |
| Medium | 879 | 97 | 420 | 1396 |
| Weak | 983 | 109 | 469 | 1561 |
| Total | 2749 | 304 | 1312 | 4365 |
| Operation | Parameter Setting | Parameter Description |
|---|---|---|
| Size Adjustment | size = 224 | Images were resized to 224 × 224 |
| Random Cropping | scale = (0.8, 1.0) | Random cropping was applied to the images, with the cropped area ranging from 80% to 100% of the original image area |
| Random Horizontal Flip | prob = 0.5 | Images were horizontally flipped with a 50% probability |
| Random Rotation | deg = 15 | Images were randomly rotated with rotation angles ranging from −15° to 15° |
| Color Jitter | params = [0.2, 0.2, 0.2] | Brightness, contrast, and saturation were adjusted by ±20% from their original values |
| Gaussian Blur | radius = 3 | A 3 × 3 Gaussian kernel was applied to blur the images |
| Category | Precision (%) | Recall (%) | Specificity (%) | F1-Score (%) |
|---|---|---|---|---|
| Strong | 96.53 | 98.58 | 98.31 | 97.54 |
| Medium | 95.93 | 95.48 | 98.09 | 95.70 |
| Weak | 98.92 | 97.44 | 99.41 | 98.17 |
| Method | Category | Precision (%) | Recall (%) | Specificity (%) | F1-Score (%) |
|---|---|---|---|---|---|
| Transfer learning | Strong | 96.53 | 98.58 | 98.31 | 97.54 |
| Medium | 95.93 | 95.48 | 98.09 | 95.70 | |
| Weak | 98.92 | 97.44 | 99.41 | 98.17 | |
| From-scratch learning | Strong | 94.99 | 94.09 | 97.64 | 94.54 |
| Medium | 91.87 | 91.43 | 96.19 | 91.65 | |
| Weak | 95.16 | 96.38 | 97.27 | 95.76 |
| Method | Category | Precision (%) | Recall (%) | Specificity (%) | F1-Score (%) |
|---|---|---|---|---|---|
| Model 1 | Strong | 96.88 | 95.51 | 98.54 | 96.19 |
| Medium | 94.95 | 94.05 | 97.65 | 94.50 | |
| Weak | 96.87 | 98.93 | 98.22 | 97.89 | |
| Model 2 | Strong | 96.92 | 96.69 | 98.54 | 96.80 |
| Medium | 93.97 | 96.43 | 97.09 | 95.18 | |
| Weak | 98.91 | 96.80 | 99.41 | 97.84 | |
| Model 3 | Strong | 98.78 | 95.51 | 99.44 | 97.12 |
| Medium | 93.84 | 97.86 | 96.97 | 95.80 | |
| Weak | 98.28 | 97.44 | 99.05 | 97.86 | |
| Model 4 | Strong | 96.53 | 98.58 | 98.31 | 97.54 |
| Medium | 95.93 | 95.48 | 98.09 | 95.70 | |
| Weak | 98.92 | 97.44 | 99.41 | 98.17 |
| Model | Memory Footprint/MB | Category | Precision (%) | Recall (%) | Specificity (%) | F1-Score (%) |
|---|---|---|---|---|---|---|
| MobileViT-CoordAtt | 4.09 | Strong | 96.53 | 98.58 | 98.31 | 97.54 |
| Medium | 95.93 | 95.48 | 98.09 | 95.70 | ||
| Weak | 98.92 | 97.44 | 99.41 | 98.17 | ||
| EfficientNetV2 | 81.86 | Strong | 94.13 | 94.8 | 97.19 | 94.46 |
| Medium | 92.63 | 89.76 | 96.64 | 91.17 | ||
| Weak | 95.62 | 97.65 | 97.51 | 96.62 | ||
| MobileNetV3 _small | 9.7 | Strong | 96.31 | 98.82 | 98.20 | 97.55 |
| Medium | 96.95 | 90.95 | 98.65 | 93.86 | ||
| Weak | 95.04 | 98.08 | 97.15 | 96.54 | ||
| Swin-Transformer | 334.81 | Strong | 84.23 | 88.42 | 92.13 | 86.27 |
| Medium | 82.93 | 65.95 | 93.61 | 73.47 | ||
| Weak | 83.52 | 95.10 | 89.56 | 88.93 | ||
| Vision-Transformer | 330.23 | Strong | 84.77 | 88.18 | 92.46 | 86.44 |
| Medium | 80.28 | 67.86 | 92.15 | 73.55 | ||
| Weak | 84.91 | 93.6 | 90.75 | 89.05 | ||
| ResNet18 | 44.59 | Strong | 97.12 | 95.51 | 98.65 | 96.31 |
| Medium | 93.19 | 94.52 | 96.75 | 93.85 | ||
| Weak | 96.60 | 96.80 | 98.10 | 96.70 |
Disclaimer/Publisher’s Note: The statements, opinions and data contained in all publications are solely those of the individual author(s) and contributor(s) and not of MDPI and/or the editor(s). MDPI and/or the editor(s) disclaim responsibility for any injury to people or property resulting from any ideas, methods, instructions or products referred to in the content. |
© 2025 by the authors. Licensee MDPI, Basel, Switzerland. This article is an open access article distributed under the terms and conditions of the Creative Commons Attribution (CC BY) license (https://creativecommons.org/licenses/by/4.0/).
Share and Cite
Liu, S.; Liu, X.; Zou, H. Assessment Method for Feeding Intensity of Fish Schools Using MobileViT-CoordAtt. Fishes 2025, 10, 253. https://doi.org/10.3390/fishes10060253
Liu S, Liu X, Zou H. Assessment Method for Feeding Intensity of Fish Schools Using MobileViT-CoordAtt. Fishes. 2025; 10(6):253. https://doi.org/10.3390/fishes10060253
Chicago/Turabian StyleLiu, Shikun, Xingguo Liu, and Haisheng Zou. 2025. "Assessment Method for Feeding Intensity of Fish Schools Using MobileViT-CoordAtt" Fishes 10, no. 6: 253. https://doi.org/10.3390/fishes10060253
APA StyleLiu, S., Liu, X., & Zou, H. (2025). Assessment Method for Feeding Intensity of Fish Schools Using MobileViT-CoordAtt. Fishes, 10(6), 253. https://doi.org/10.3390/fishes10060253