Article

Effect of Berberine Hydrochloride on Disposition Characteristics of Ciprofloxacin Hydrochloride and Its Mechanism in Yellow Catfish (Pelteobagrus fulvidraco) Following Combined Oral Administration

1
College of Fisheries and Life Science, Shanghai Ocean University, Shanghai 201306, China
2
Yangtze River Fisheries Research Institute, Chinese Academy of Fishery Sciences, Wuhan 430223, China
3
Hubei Province Engineering and Technology Research Center for Aquatic Product Quality and Safety, Wuhan 430223, China
4
Key Laboratory of Aquatic Product Quality and Safety Control, Ministry of Agriculture and Rural Affairs, Beijing 100141, China
*
Author to whom correspondence should be addressed.
Fishes 2025, 10(6), 245; https://doi.org/10.3390/fishes10060245
Submission received: 8 April 2025 / Revised: 19 May 2025 / Accepted: 21 May 2025 / Published: 23 May 2025
(This article belongs to the Special Issue Aquaculture Pharmacology)

Abstract

To investigate the effects and underlying mechanisms of the Chinese herbal medicine berberine hydrochloride (BBH) on the pharmacokinetics of the antibiotic ciprofloxacin hydrochloride (CIP) in yellow catfish (Pelteobagrus fulvidraco), this study established two experimental groups: CIP alone and CIP combined with BBH. After administering the two treatment groups, we analyzed the pharmacokinetic characteristics and tissue distribution of CIP in yellow catfish, as well as the differences in the expression levels of two key genes involved in drug disposition—ABCB4 (ATP-binding cassette subfamily B member 4, related to drug transport) and CYP3A40 (cytochrome P450 3A40, related to drug metabolism)—in the intestinal tract. The results demonstrated that co-administration of CIP and BBH increased the maximum concentration (Cmax) and area under the concentration–time curve (AUC) of CIP while reducing its total body clearance (CL/F). Regarding gene expression, the combined treatment significantly downregulated ABCB4 expression in the intestine at certain time points compared to CIP alone, whereas CYP3A40 expression showed a non-significant decreasing trend. These findings suggest that BBH may enhance the absorption of CIP in yellow catfish by suppressing ABCB4 expression, thereby improving therapeutic efficacy at the same dosage.
Key Contribution: This study compared the disposition characteristics of CIP and the expression levels of drug transport and metabolism-related genes in yellow catfish before and after BBH exposure, providing concrete evidence and a theoretical foundation for the combined application of antibiotics and herbal medicines in aquaculture.

1. Introduction

The aquatic economic species yellow catfish (Pelteobagrus fulvidraco) is favored by consumers for its delicious taste and rich nutritional value, and the farmed production of yellow catfish in China reached as high as 622,651 tons in 2023 [1]. However, due to large-scale and high-density farming, bacterial diseases of yellow catfish have frequently broken out [2,3], and in order to achieve therapeutic effects, farmers have to increase the use of antibiotics. Quinolones are a class of synthetic anti-bacterial drugs that affect DNA replication by inhibiting bacterial DNA gyrase, ultimately killing bacteria [4]. They are extensively used in the clinical treatment of bacterial infections because of their broad anti-bacterial spectrum, high bioavailability, and mild adverse reactions [5]. However, due to the use of large quantities of such antibiotics, a series of problems have followed, the first being the problem of bacterial resistance [6,7,8]. Ciprofloxacin (CIP), as the third generation of quinolones, perfectly inherits the total advantages of quinolones, especially with its better inhibitory effect on Gram-negative bacteria, but the problem of bacterial resistance is also inevitable. Relevant studies have shown that the resistance of quinolones can be transmitted between bacteria [9], which is of infinite harm to the environment and human health. If quinolone use can be reduced, this thorny situation may be mitigated at its source, preventing uncontrolled escalation and providing critical support for the sustainable development of aquaculture.
Berberine (BER), an isoquinoline alkaloid, is the main ingredient of the natural Chinese herbal medicine Coptis chinensis Franch. Its hydrochloride form, berberine hydrochloride (BBH), is widely used because of the higher water solubility. In recent years, berberine has been found to have anti-inflammatory [10], anti-oxidation [11], anti-tumor [12], anti-bacterial [13], and anti-viral [14,15] effects in clinical studies. It is considered a Chinese herbal medicine with a high application prospect. In the study of pharmacokinetics, berberine has the characteristics of low oral bioavailability and poor absorption [16]. It usually resides in the intestine, enters the organism in a small amount, and has a very low plasma concentration [17]. However, previous studies have found that berberine may promote the absorption of certain drugs by the organism, such as atorvastatin [18], midazolam [19], and florfenicol [20]. CIP and BBH premix are often used to treat animal intestinal diseases in animal husbandry as well as in aquaculture to combat stubborn bacterial infections. But the mechanism of the combination of the two drugs has not been elucidated. We speculate that it may be related to the absorption and metabolism of the drug. BBH may play a synergistic role, so that CIP can achieve the desired effect even at low doses.
The absorption and metabolism of drugs in organisms are inseparable from the participation of various transporters and enzymes, among which the ATP-binding cassette transporter superfamily and cytochrome P450 enzymes are essential. ABCB4 is a member of the ATP-binding cassette transporter superfamily, also known as MDR3. Related studies have indicated that it can also identify multiple drugs [21,22]. Existing studies in zebrafish have shown that the ABCB4 gene in zebrafish is homologous to the ABCB1 gene (MDR1) encoding P-glycoprotein in humans [23,24]. After oral administration, the drug will be absorbed into the organism through the intestinal tract, and the factors affecting the absorption of the drug in the intestinal tract include the transporter P-glycoprotein located in the apical membrane of intestinal epithelial cells. It restricts the entry of drugs into organisms to participate in the circulation [25], is related to the efflux of drugs, and has the function of maintaining the organism’s homeostasis [26]. The cytochrome P450 enzyme (CYP450) can participate in the metabolism of xenobiotics in the organisms. As xenobiotics, drugs can be converted into hydrophilic metabolites [27] by this enzyme and then be excreted. CYP3A is an important subfamily involved in drug metabolism, and its substrates can cover at least 50% of the drugs on the market. The substrate specificity of P-glycoprotein and CYP3A exhibits significant overlap. They co-exist in intestinal epithelial cells and influence the absorption and metabolism of orally administered drugs in animals [28]. CYP3A40 is a type of CYP3A.
So far, the effect of BBH on CIP disposition patterns has not been investigated in aquatic animals. Therefore, in the present study, single oral instillation of CIP and CIP + BBH in yellow catfish, respectively, was performed. The important characteristics of absorption and metabolism of CIP in yellow catfish under two treatment groups were described. Combined with the difference in the expression of ABCB4 and CYP3A40 under the two treatment groups, the mechanism of the combined effect was discussed in depth. Our research guides how to give full play to the pharmacological effects of drugs, achieve the best curative effect, and improve the safety of drug use.

2. Materials and Methods

2.1. Reagents

The CIP standard (purity ≥ 98%) was supplied by Dr. Ehrenstorfer (Augsburg, Germany). The CIP-D8 standard (purity ≥ 95%) was acquired from Toronto Research Chemicals (Toronto, ON, Canada). The BBH standard (purity ≥ 98%), CIP technical powder (purity ≥ 88.5%), BBH technical powder (purity ≥ 95%), and heparin sodium were purchased from Shanghai Yuanye Bio-Technology Co., Ltd. (Shanghai, China). The HPLC-grade methanol, acetonitrile, n-hexane, formic acid, and ammonium acetate were provided by J. T. Baker (Deventer, The Netherlands). Anhydrous magnesium sulfate and anhydrous ethanol were purchased from Sinopharm Group (Beijing, China). The Trizol reagent was obtained from Thermo Fisher Scientific (Waltham, MA, USA). The reverse-transcription reagent and qPCR enzyme were provided by Yeasen Co., Ltd. (Shanghai, China).

2.2. Administration and Sample Collection of Yellow Catfish

After a 14-day acclimatization period, 160 yellow catfish were randomly divided into two groups, the CIP group and the CIP + BBH group, with 80 fish in each group. The doses of CIP and BBH administered referred to the Quality Standards for Veterinary Drugs (2017 Edition) [29], which were 10 mg/kg bw and 4 mg/kg bw for CIP and BBH, respectively. An amount of 10 mg/kg bw of CIP was orally administered to yellow catfish in the CIP group, while in the CIP + BBH group, CIP was orally administered at the same time, with CIP at a dose of 10 mg/kg bw and BBH at a dose of 4 mg/kg bw. Drug administration was performed via oral gavage using a pre-assembled syringe with a gavage needle. The needle was carefully inserted into the esophageal tract for precise delivery. If the fish regurgitated the medication, the procedure was repeated using a replacement specimen. For co-administration, BBH was given orally first, followed by the administration of CIP. The experimental water temperature was 8 ± 2 °C, and the weight of yellow catfish was 46.03 ± 8.23 g. Among the indicators of water, the ammonia nitrogen value was less than 0.1 mg/L; the nitrite content was less than 0.03 mg/L; the value of dissolved oxygen was determined as 7.0 ± 0.2 mg/L; and the pH value was measured as 7.2 ± 0.3.
Five fish were randomly selected at 0.5 h, 1 h, 2 h, 4 h, 6 h, 8 h, 10 h, 12 h, 16 h, 24 h, 48 h, 72 h, 96 h, 120 h, 144 h, and 168 h after administration. Blood was taken from the tail vein, and yellow catfish was anesthetized with 300 mg/L MS-222 solution before blood collection [30]. Blood was centrifuged at 4000× g for 5 min, and the supernatant was taken. Then, the fish was euthanized with 300 mg/L MS-222 solution [30]; the muscle, liver, and gills were collected; and the tissue was homogenized with a homogenizer. Intestinal tissues were taken at 2 h, 6 h, 12 h, 24 h, 48 h, 72 h, 120 h, and 168 h. After the intestinal contents were washed with 4 °C normal saline, the intestine was placed in an RNA Keeper Tissue Stabilizer (Vazyme, Nanjing, China), fully infiltrated at 4 °C overnight, and then frozen for storage, and the plasma and tissue samples were stored in an ultra-low-temperature refrigerator at −80 °C, waiting for the liquid chromatography–tandem mass spectrometry (HPLC-MS/MS) analysis.

2.3. Equipment

2.3.1. Chromatographic Conditions

The analytes were separated by using Thermo Fisher Scientific Hypersil GOLD 100 mm × 2.1 mm, 3 μm chromatographic column; the injection volume was 10 μL; and the column temperature was kept at 35 °C. The mobile phase was a gradient composed of (A) 5 mmol/L ammonium acetate aqueous solution containing 0.1% formic acid and (B) methanol. The elution program is shown in Table 1.

2.3.2. Mass Spectrometry Conditions

The TSQ Quantum three-stage quadrupole mass spectrometer, equipped with a heated atmospheric pressure electrospray ionization source (HESI), was utilized for analysis. It used the positive ion mode in SRM mode scanning with the following settings: spray voltage at 3500 V, atomization temperature at 300 °C, sheath gas pressure of 35 psi, auxiliary gas pressure of 5 arb, capillary temperature of 350 °C, collision pressure of 1.5 mtorr. The parent ions and fragment ions are shown in Table 2.

2.4. Sample Pretreatment

For the muscle, 2 g samples were accurately weighed and centrifuged in a 10 mL centrifuge tube, and 100 μL 1 μg/mL CIP-D8 solution was added as the internal standard. Then, 5 mL extraction agent (acetonitrile:hydrochloric acid:ultrapure water = 2500:10:10, v/v/v) and 1 g anhydrous magnesium sulfate were put in the centrifuge tube (Biosharp, Hefei, China), mixed on a vortex shaker (Beijing Northland Zhiheng Technology, Beijing, China) for 30 s, and centrifuged at 7500× g for 5 min. After centrifugation, the upper solution was transferred to another 10 mL centrifuge tube, and the residue precipitation was repeatedly extracted with 4 mL extractant, vortexed for 30 s, followed by 5 min 7500× g centrifugation. The upper solution of the two centrifugations was combined into the same centrifuge tube and blown to dryness at 50 °C nitrogen, with 2 mL initial mobile phase (5 mmol/L ammonium acetate aqueous solution containing 0.1% formic acid:methanol = 80:20, v/v) and 4 mL n-hexane added to the blown-dry centrifuge tube, vortexed for 15 s, and centrifuged at 7500× g for 5 min. After centrifugation, the solution in the centrifuge tube had an organic phase in the upper layer (n-hexane) and an aqueous phase in the lower layer (initial mobile phase). The lower layer solution was carefully drawn with a 1 mL syringe, and the sample was then filtered through a 0.22 μm filter membrane and injected into the sample vial, awaiting the HPLC-MS/MS analysis.
For plasma and other tissues, 1 mL or 1 g samples were accurately weighed and centrifuged in a 10 mL centrifuge tube, and 50 μL 1 μg/mL CIP-D8 solution was added as the internal standard. Then, 4 mL extraction agent (acetonitrile:hydrochloric acid:ultrapure water = 2500:10:10, v/v/v) and 1 g anhydrous magnesium sulfate were put in the centrifuge tube, mixed on a vortex shaker for 30 s, and centrifuged at 7500× g for 5 min. After centrifugation, the upper solution was transferred to another 10 mL centrifuge tube, and the residue precipitation was repeatedly extracted with 3 mL extractant, vortexed for 30 s, followed by 5 min 7500× g centrifugation. The upper solution of the two centrifugations was combined into the same centrifuge tube and blown to dryness at 50 °C nitrogen, with 1 mL initial mobile phase (5 mmol/L ammonium acetate aqueous solution containing 0.1% formic acid:methanol = 80:20, v/v) and 4 mL n-hexane added to the blown-dry centrifuge tube, vortexed for 15 s, and centrifuged at 7500× g for 5 min. After centrifugation, the solution in the centrifuge tube had an organic phase in the upper layer (n-hexane) and an aqueous phase in the lower layer (initial mobile phase). The lower layer solution was carefully drawn with a 1 mL syringe, and the sample was then filtered through a 0.22 μm filter membrane and injected into the sample vial, awaiting the HPLC-MS/MS analysis.

2.5. Method Validation

A series of CIP + BBH standard solutions (1, 10, 50, 100, 200, and 500 μg/L) containing 50 μg/L CIP-D8 (internal standard) were prepared in 5 mmol/L ammonium acetate aqueous solution with 0.1% formic acid:methanol (80:20, v/v) as the mobile phase and analyzed via HPLC-MS/MS. Calibration curves were constructed with CIP concentrations (1–500 μg/L) versus CIP/CIP-D8 peak area ratios for CIP quantification, while BBH concentrations were plotted against absolute peak areas for BBH quantification. Blank plasma and tissue samples were spiked with standard solutions to achieve the final concentrations of 1–500 μg/kg for CIP and BBH (CIP-D8 maintained at 50 μg/kg), processed according to the sample pretreatment protocol (Section 2.4), and analyzed via HPLC-MS/MS to generate matrix-matched standard curves.
Quality control samples of plasma and tissues containing 1, 20, and 200 μg/kg CIP with BBH were prepared in five plicates, and average recoveries (%) were calculated using their corresponding matrix-matched standard curves. Precisions were expressed as the coefficient of variation (CV, %) calculated from the above-mentioned spiked samples. Intra-day precisions were determined within a single day, while inter-day precisions were assessed over three different days. The evaluation criteria for the recovery rate and precision comply with the requirements of Commission Decision 2002/657/EC (Official Journal of the European Communities) [31].
The limit of detection (LOD) was calculated as 3 times the signal-to-noise ratio S/N, and the limit of quantitation (LOQ) was calculated as 10 times the signal-to-noise ratio S/N.

2.6. Detection of Gene Expression in Yellow Catfish

The collected intestinal tissues of yellow catfish were used to extract total RNA via the trizol method, and the concentration and quality of RNA were detected by a UV spectrophotometer (VWR, Shanghai, China), and the quality was determined by the ratio of A260/A280 in the range of 1.8~2.0. The RNA was reverse-transcribed with Hifair® III 1st Strand cDNA Synthesis SuperMix for qPCR (Yeasen, Shanghai, China), and the obtained cDNA was subjected to RT-qPCR with HieffUNICON® qPCR SYBR Green Master Mix (Yeasen, Shanghai, China). The relative expression levels of ABCB4 and CYP3A40 were detected using β-actin as an internal reference gene. The primer sequence is shown in Table 3.

2.7. Data Processing and Analysis

GraphPad Prism 8.0.2 was used to draw all the image data in this paper. The pharmacokinetic parameters were calculated by the non-compartment model of Phoenix WinNonlin 8.1, and the relative gene expression was calculated using the 2−ΔΔCt method. The difference analysis between the drug concentration of the two treatment groups was performed using the independent sample t-test in IBM SPSS Statistics 19.0. The difference analysis between the relative expression levels of the genes was performed using one-way analysis of variance, and * was used to indicate significant differences (p < 0.05), with ** indicating extremely significant differences (p < 0.01).

3. Results

3.1. Validation of HPLC-MS/MS Method

The calibration curves of CIP and BBH both have a good linear relationship in the range of 1–500 μg/L. If the concentration of the sample to be measured is greater than 500 μg/L, it is diluted to within the linear range and assayed again. The calibration curve of CIP is y = 0.1027x − 0.09553 (R2 = 0.9998), and that of BBH is y = 96,272x + 91,334 (R2 = 0.9991). The matrix-matched calibration curves for CIP and BBH in the plasma and tissues are similarly well linear, with R2 ≥ 0.999 for each of them.
It can be seen in Table 4 that the recovery rates of ciprofloxacin and berberine in various tissues of yellow catfish were between 81.0% and 117.9%, and the intra-day and inter-day precisions were between 1.1% and 9.3%. The limit of detection (LOD) was 0.5 μg/kg, calculated as 3 times the signal-to-noise ratio S/N, and the limit of quantitation (LOQ) was 1.0 μg/kg, calculated as 10 times the signal-to-noise ratio S/N.

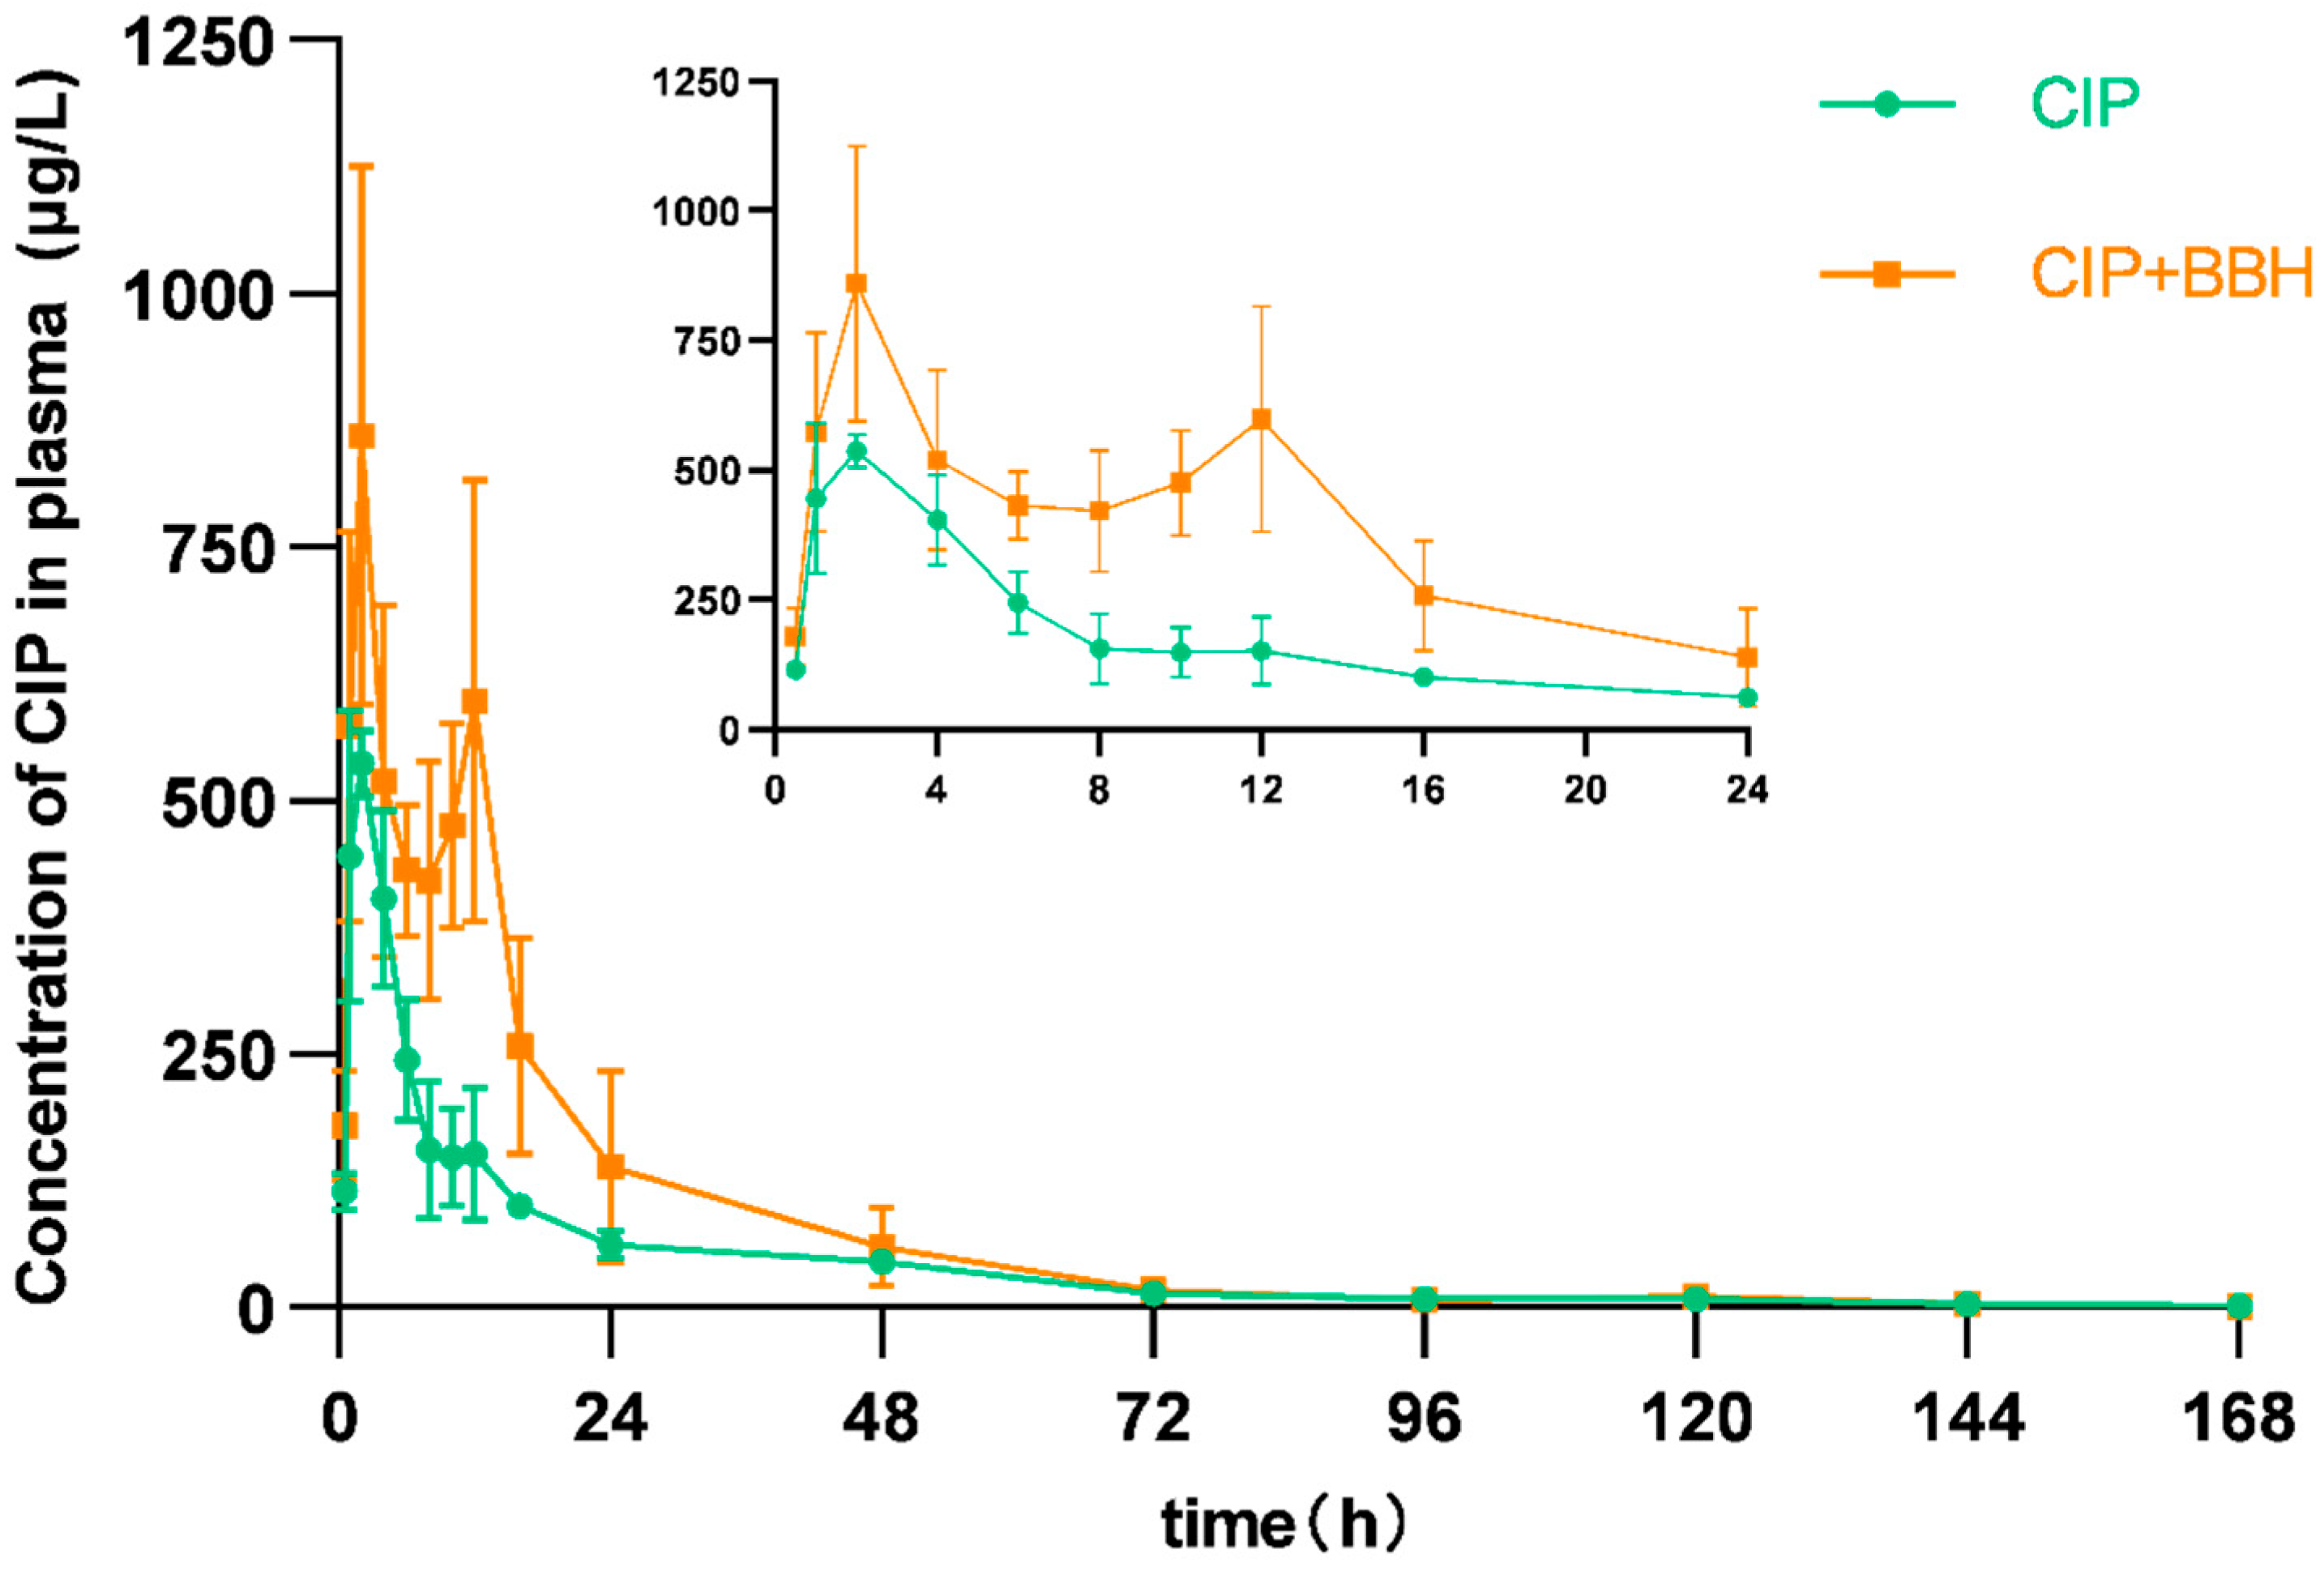
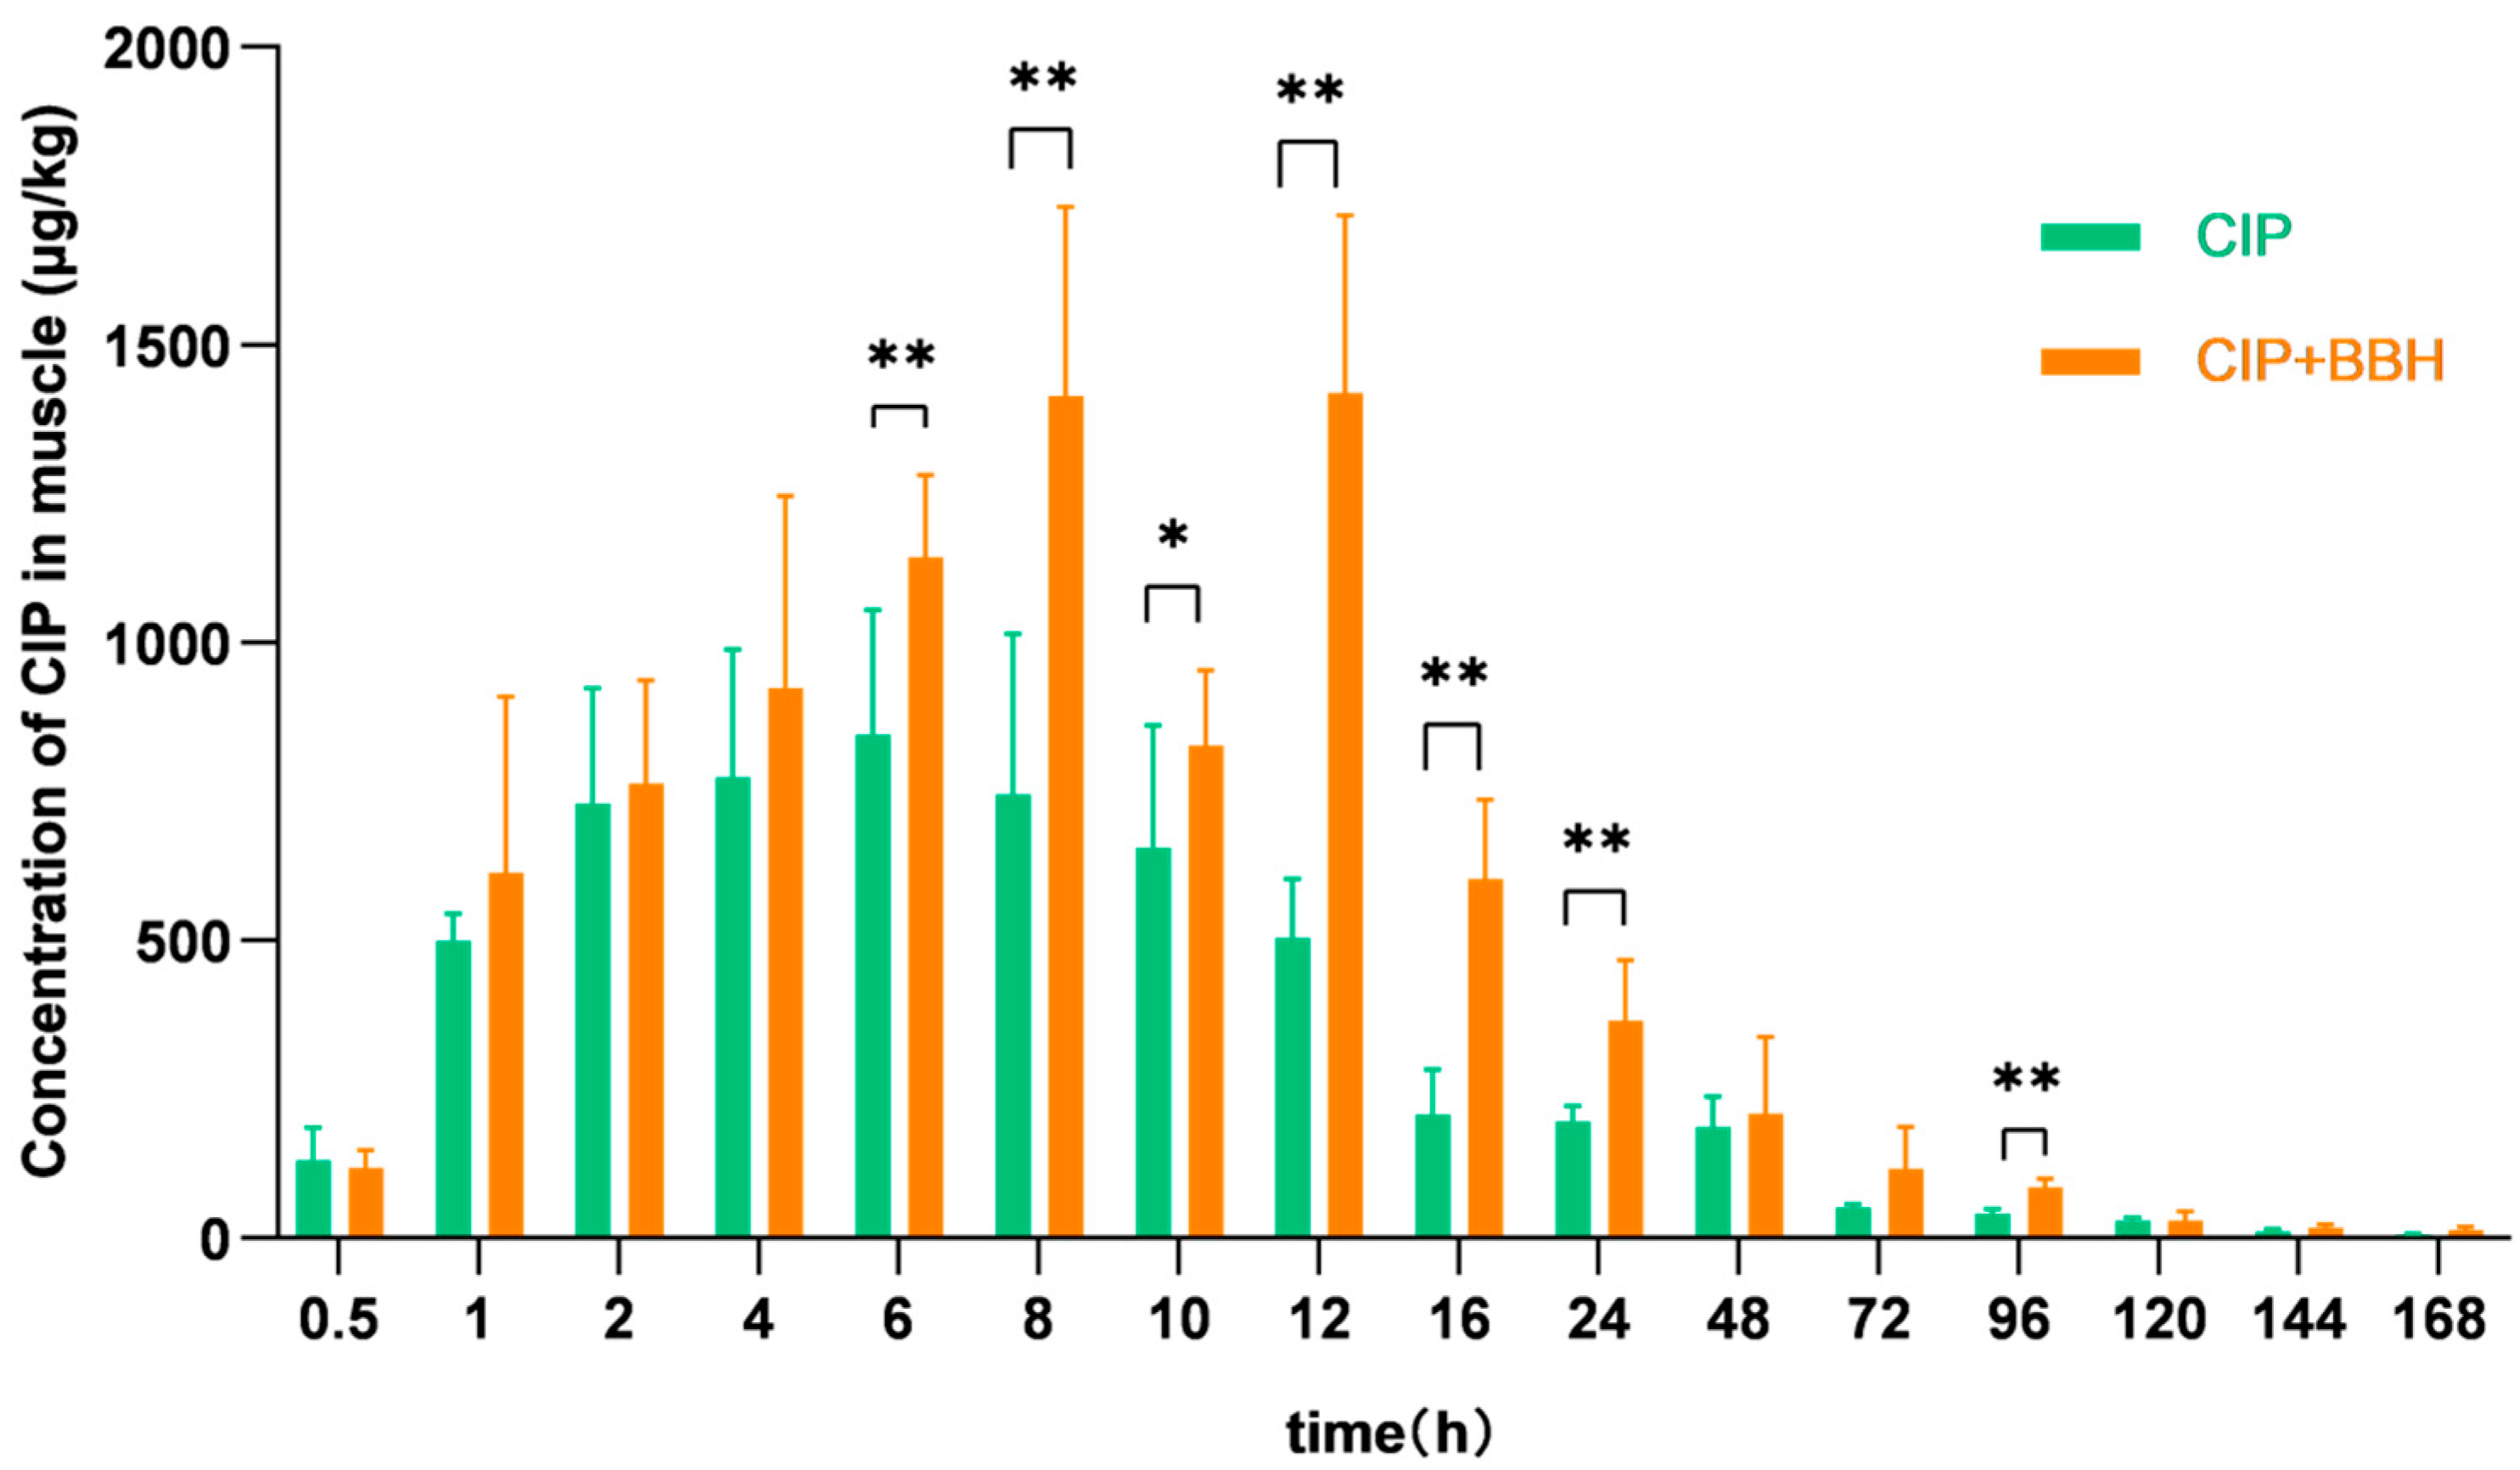
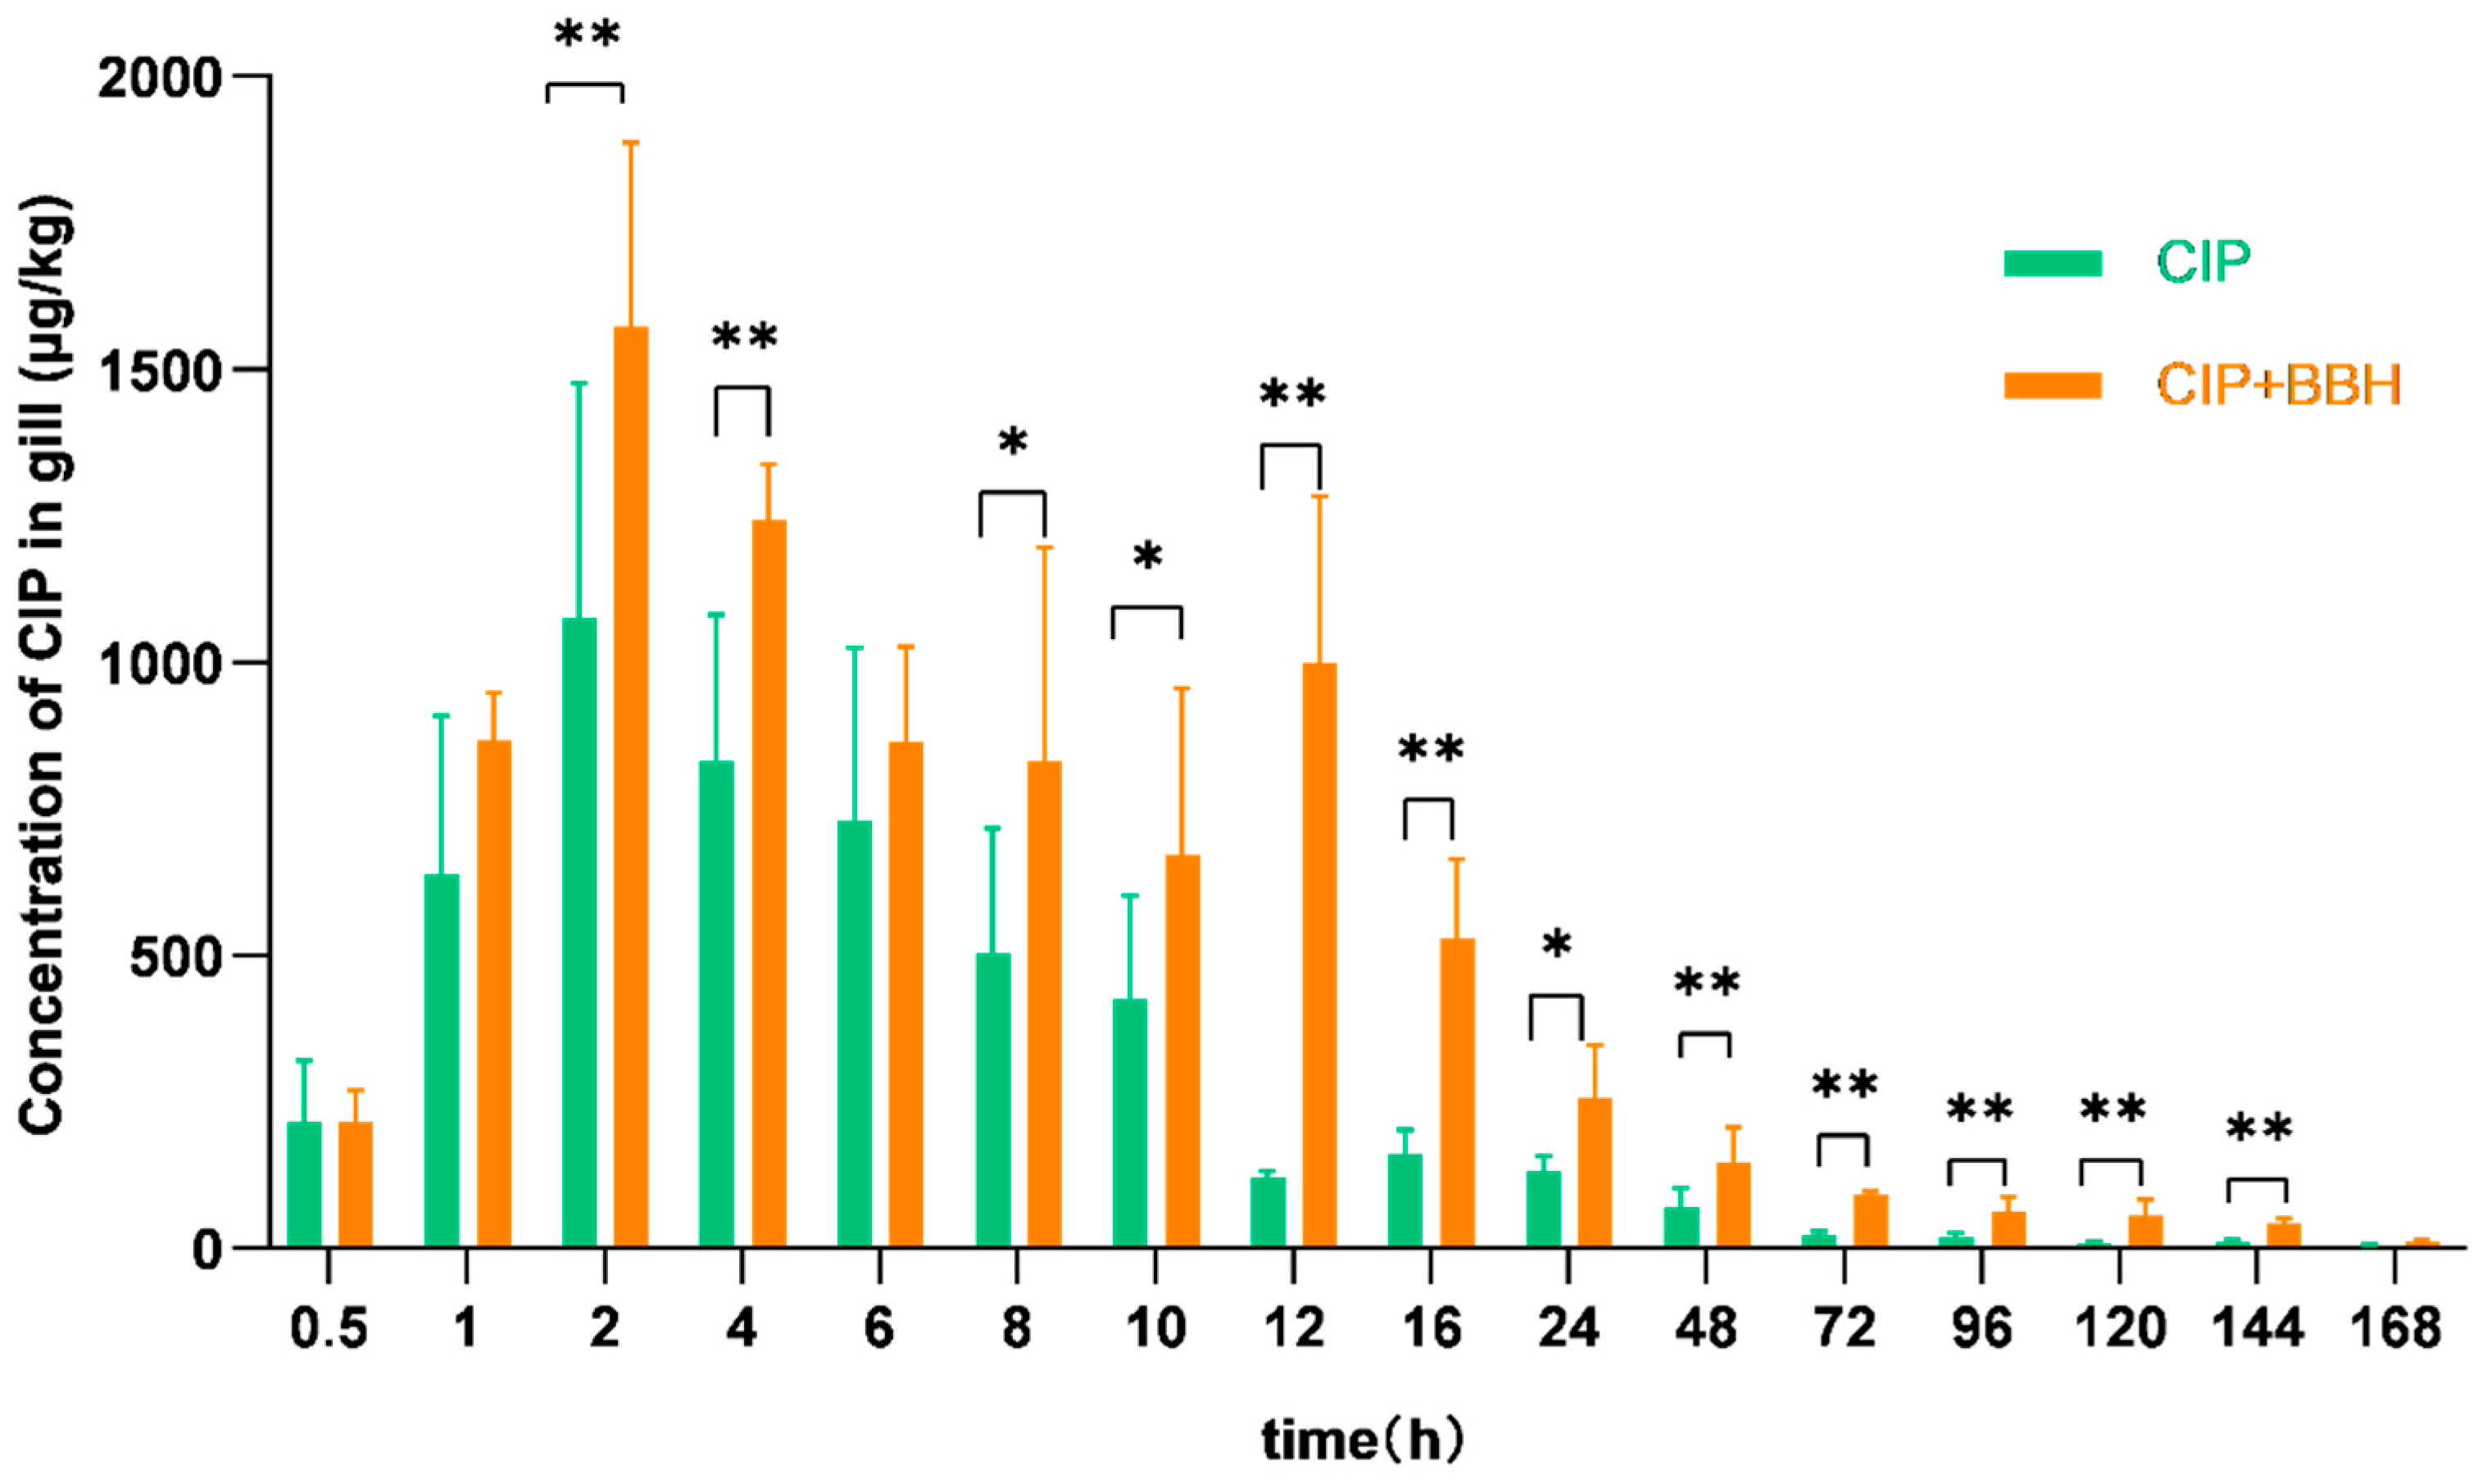
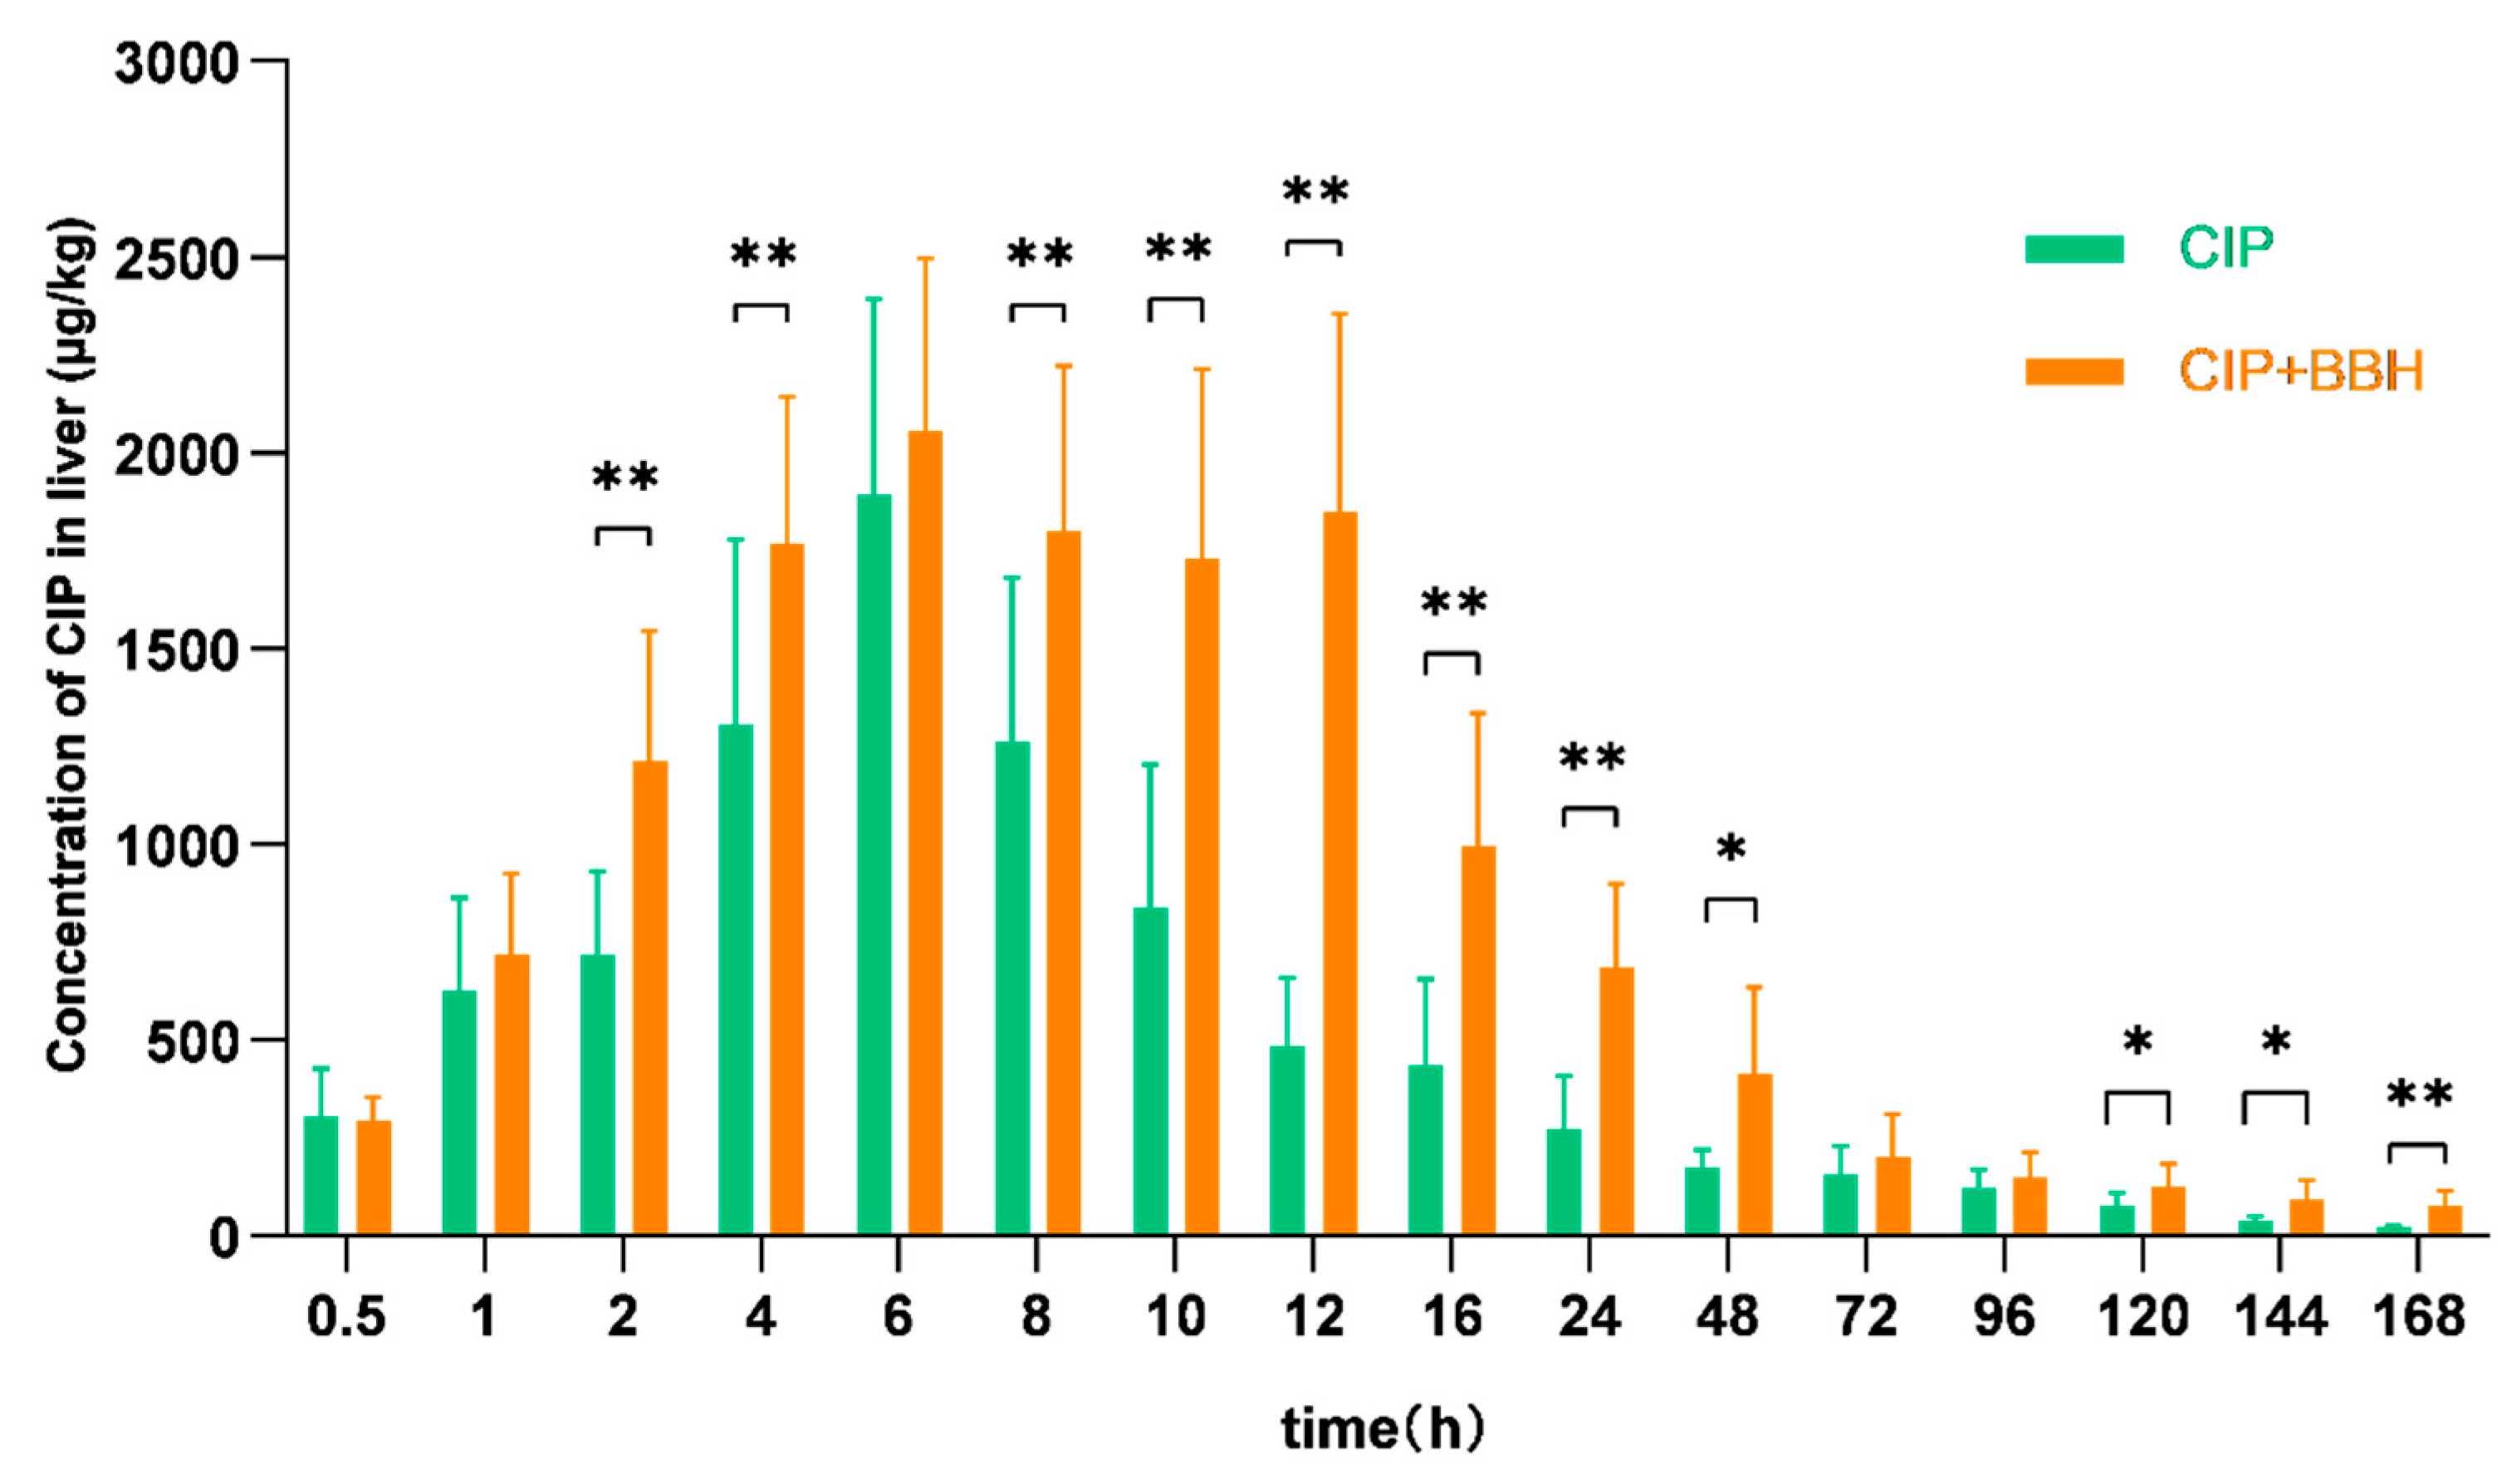
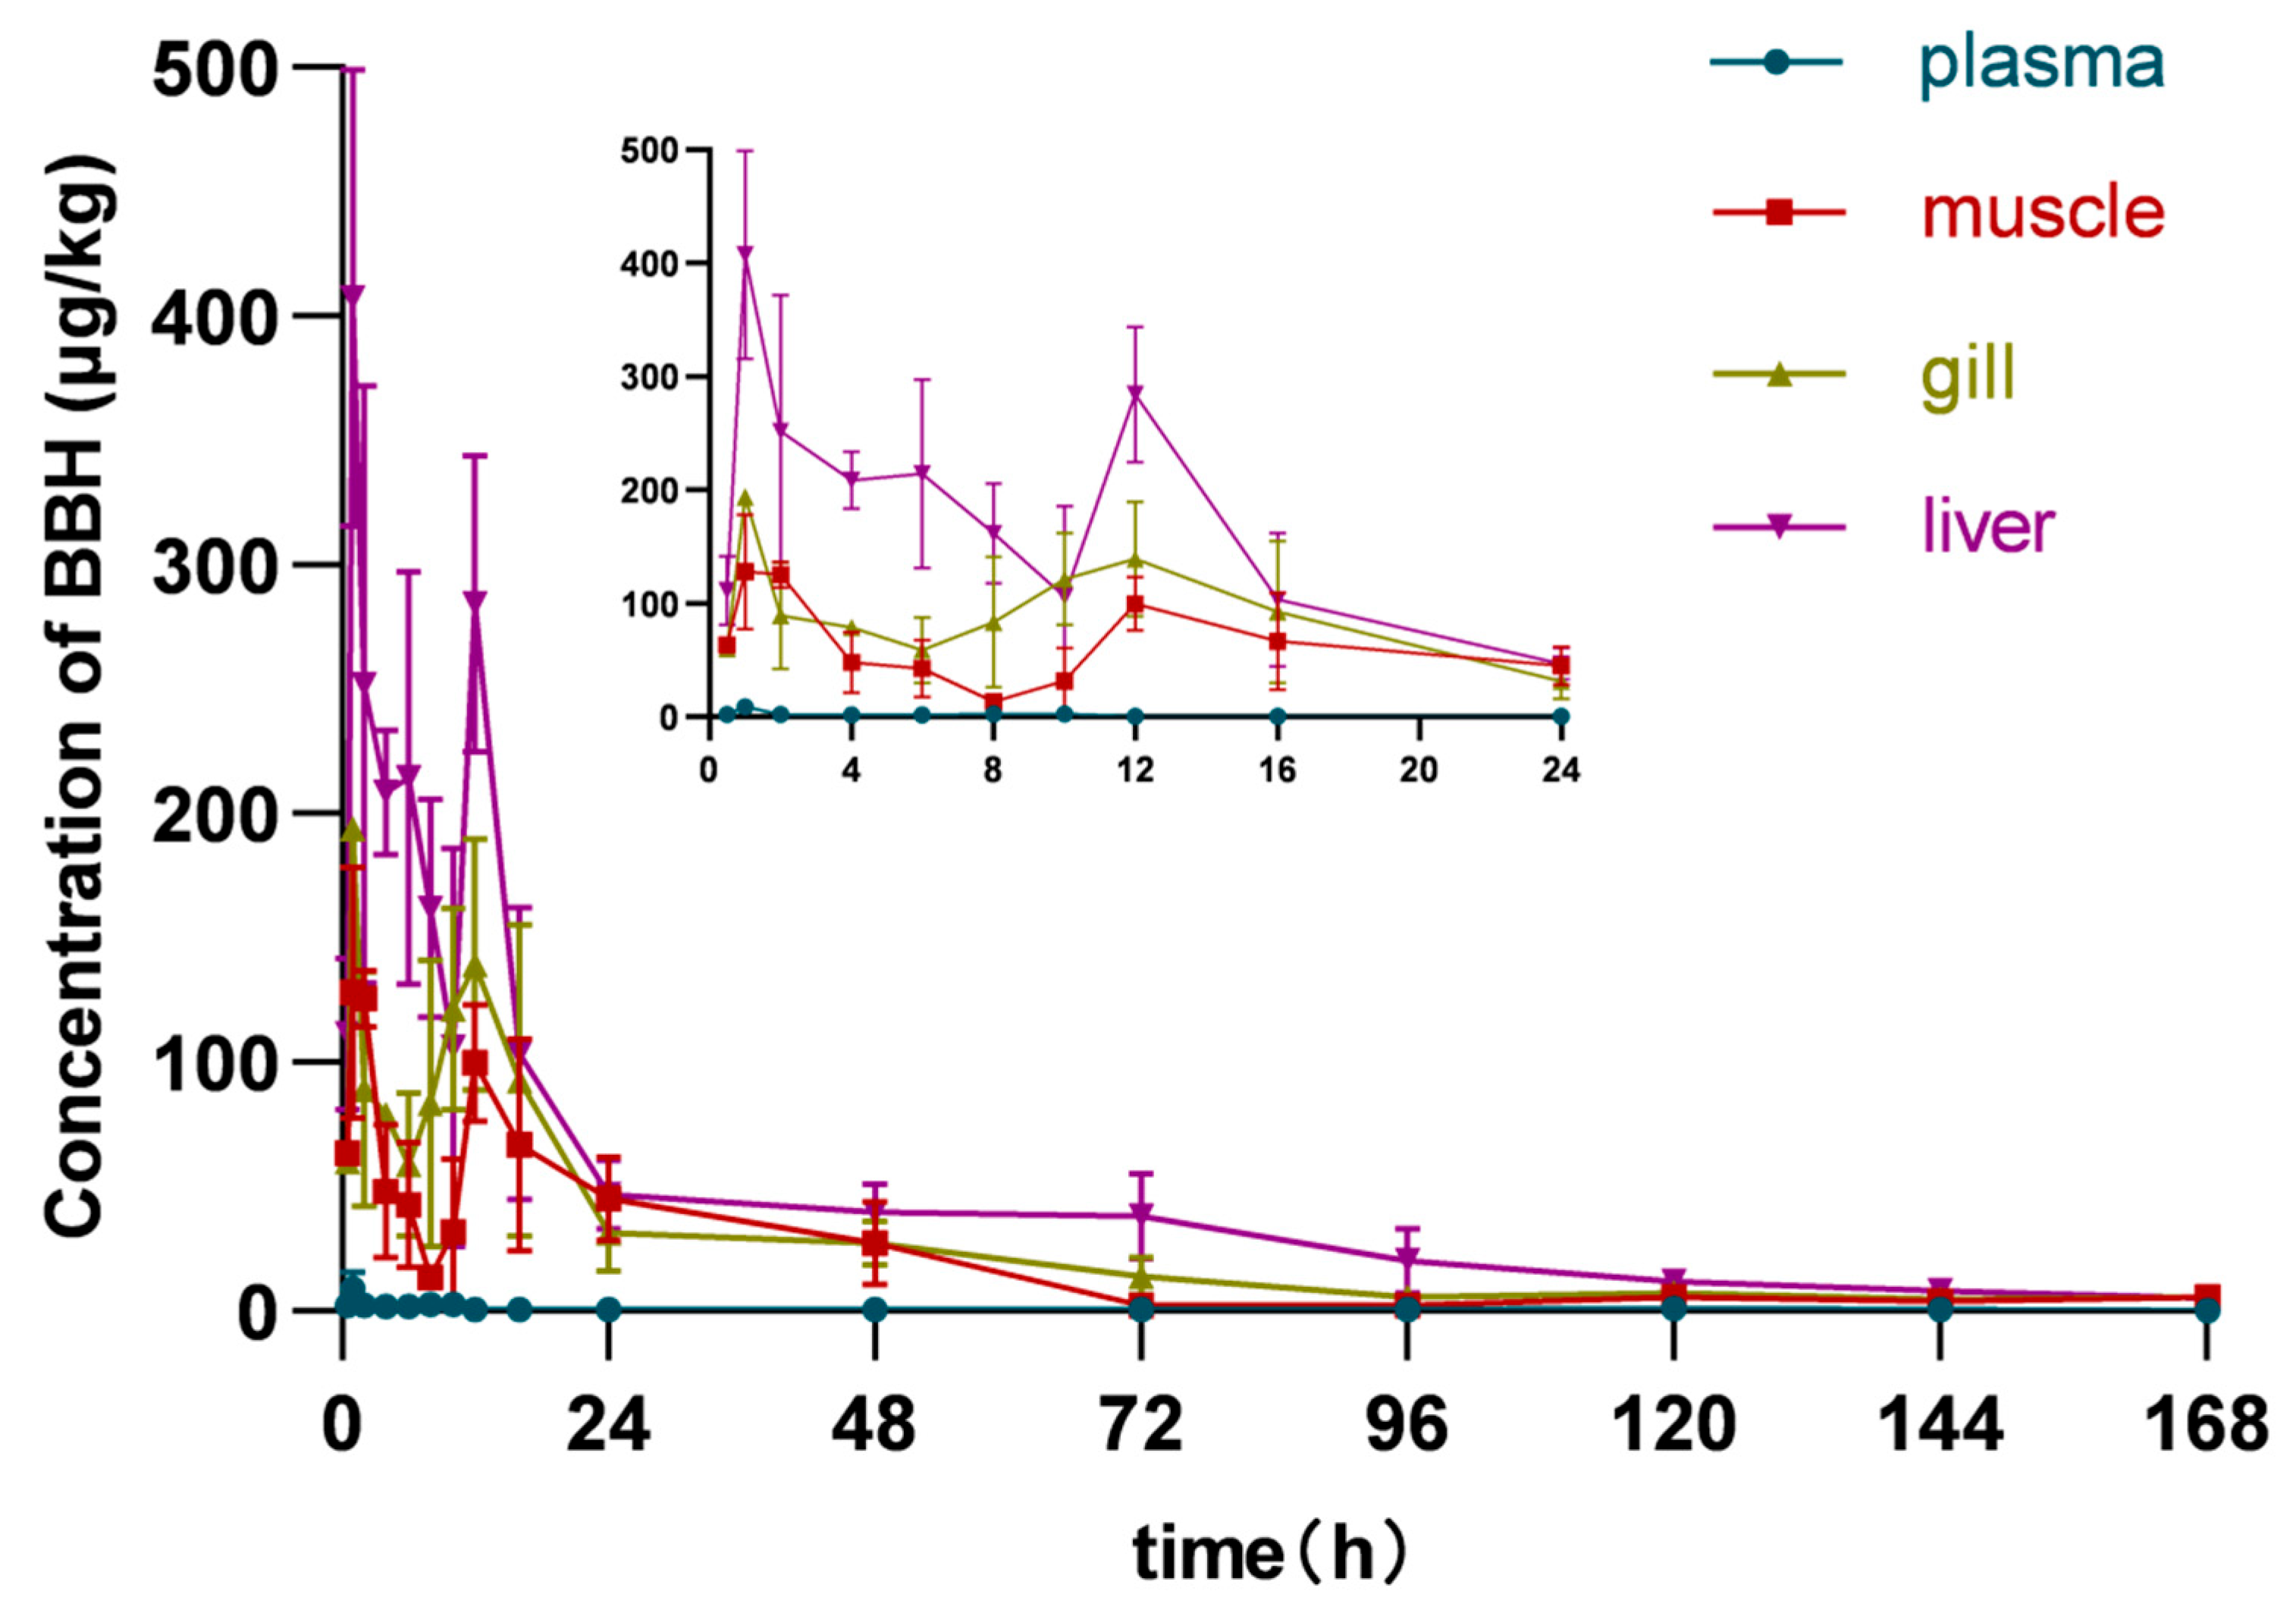
3.2. Analysis of Pharmacokinetic Parameters in Plasma and Tissues of Yellow Catfish

The plasma concentration–time curve of CIP is shown in Figure 1. It can be found that the CIP concentration in the CIP + BBH group was generally higher than that in the CIP group, and the pharmacokinetic parameters are shown in Table 5. The Tmax (time to peak concentration) was 2 h for both single drug administration and combined administration, and the Cmax (maximum concentration) of the CIP + BBH group (859.83 μg/L) was higher than that of the CIP group (537.37 μg/L), and there was a significant difference (p < 0.05). According to the plasma concentration–time curve, the blood concentration of the CIP group decreased rapidly after 2 h, but the blood concentration of the CIP + BBH group decreased first and then increased after 2 h and reached a small peak again at 12 h. After the small peak, it showed a continuous decreasing trend. The integral result of the AUC0–168 (0–168 h area under the curve) in the CIP + BBH group was greater than that in the CIP group. The AUC0–∞ (0–∞ area under the curve) derived from the known data also had the same characteristics: the values of CIP single drug administration and CIP + BBH combined administration were estimated to be 7169.71 h·μg/L and 13,513.24 h·μg/L. The calculated CL/F value revealed that the CIP monotherapy was 1.88 times that of the CIP + BBH combined administration.
The tissue distribution of CIP in the muscle is shown in Figure 2. It can be found that the CIP concentration in the CIP + BBH group was generally higher than that in the CIP group, and the pharmacokinetic parameters are shown in Table 5. The Tmax of single drug administration and co-administration were 6 h and 12 h, respectively, and the Cmax was greater in the CIP + BBH group (1418.80 μg/kg) than in the CIP group (844.64 μg/kg), and there was a significant difference (p < 0.01). Based on the distribution of tissues, it can be found that the tissue concentration in the CIP group decreased continuously after 6 h, and the tissue concentration in the CIP + BBH group exhibited a declining trend first and then increased after 6 h and reached a peak at 12 h, finally showing a trend of decreasing continuously after the peak. The integral result of AUC0–168 in the CIP + BBH group was higher than that in the CIP group, and the AUC0–∞ derived from the known data also had the same characteristics. The value of AUC0–∞ in CIP + BBH combined administration was 1.65-fold higher than that in CIP monotherapy.
The tissue distribution of CIP in the gill is shown in Figure 3. It can be found that the CIP concentration in the CIP + BBH group was generally higher than that in the CIP group. The pharmacokinetic parameters are shown in Table 5. The Tmax of single drug administration and combined administration was 2 h. The Cmax of the CIP + BBH group (1572.09 μg/kg) was higher than that of the CIP group (1073.92 μg/kg), and there was a significant difference (p < 0.01). According to the tissue distribution, the tissue concentration of the CIP group decreased rapidly after 2 h, and the tissue concentration of the CIP + BBH group decreased first and then increased after 2 h of reaching the peak, with a small peak again at 12 h, finally showing a continuous decreasing trend after the small peak. The integral result of AUC0–168 in the CIP + BBH group was higher than that in the CIP group, and the AUC0–∞ derived from the known data also had the same characteristics. The value of AUC0–∞ in CIP + BBH combined administration was 2.22-fold higher than that in CIP monotherapy.
The tissue distribution of CIP in the liver is shown in Figure 4. It can be found that the CIP concentration in the CIP + BBH group was generally higher than that in the CIP group, and the pharmacokinetic parameters are shown in Table 5. The Tmax of single drug administration and combined administration was 6 h. The Cmax of the CIP + BBH group (2056.71 μg/kg) was higher than that of the CIP group (1892.26 μg/kg). Based on the distribution of tissues, it can be found that the tissue concentration in the CIP group decreased continuously after 6 h, and the tissue concentration in the CIP + BBH group decreased first and then increased after 6 h of reaching the peak, with a small peak again at 12 h, finally showing a continuous decreasing trend after the small peak. The integral result of AUC0–168 in the CIP + BBH group was higher than that in the CIP group, and the AUC0–∞ derived from the known data also had the same characteristics. The value of AUC0–∞ in CIP + BBH combined administration was 2.02-fold higher than that in CIP monotherapy.
After the combined administration, the concentration–time curve of BBH in the plasma and tissues is shown in Figure 5. The concentration of BBH in the plasma was almost undetectable after oral administration, and the maximum concentration detected was no more than 10 μg/L. In the muscle, gill, and liver, the Tmax of BBH was 1 h, and the Cmax were 128.09 μg/kg, 193.94 μg/kg, and 407.29 μg/kg, respectively. After the peak, the concentration of BBH in the tissues showed a trend of decreasing first and then increasing, and a small peak was again induced at 12 h; finally, the concentration of BBH showed a continuous decreasing trend after the small peak.

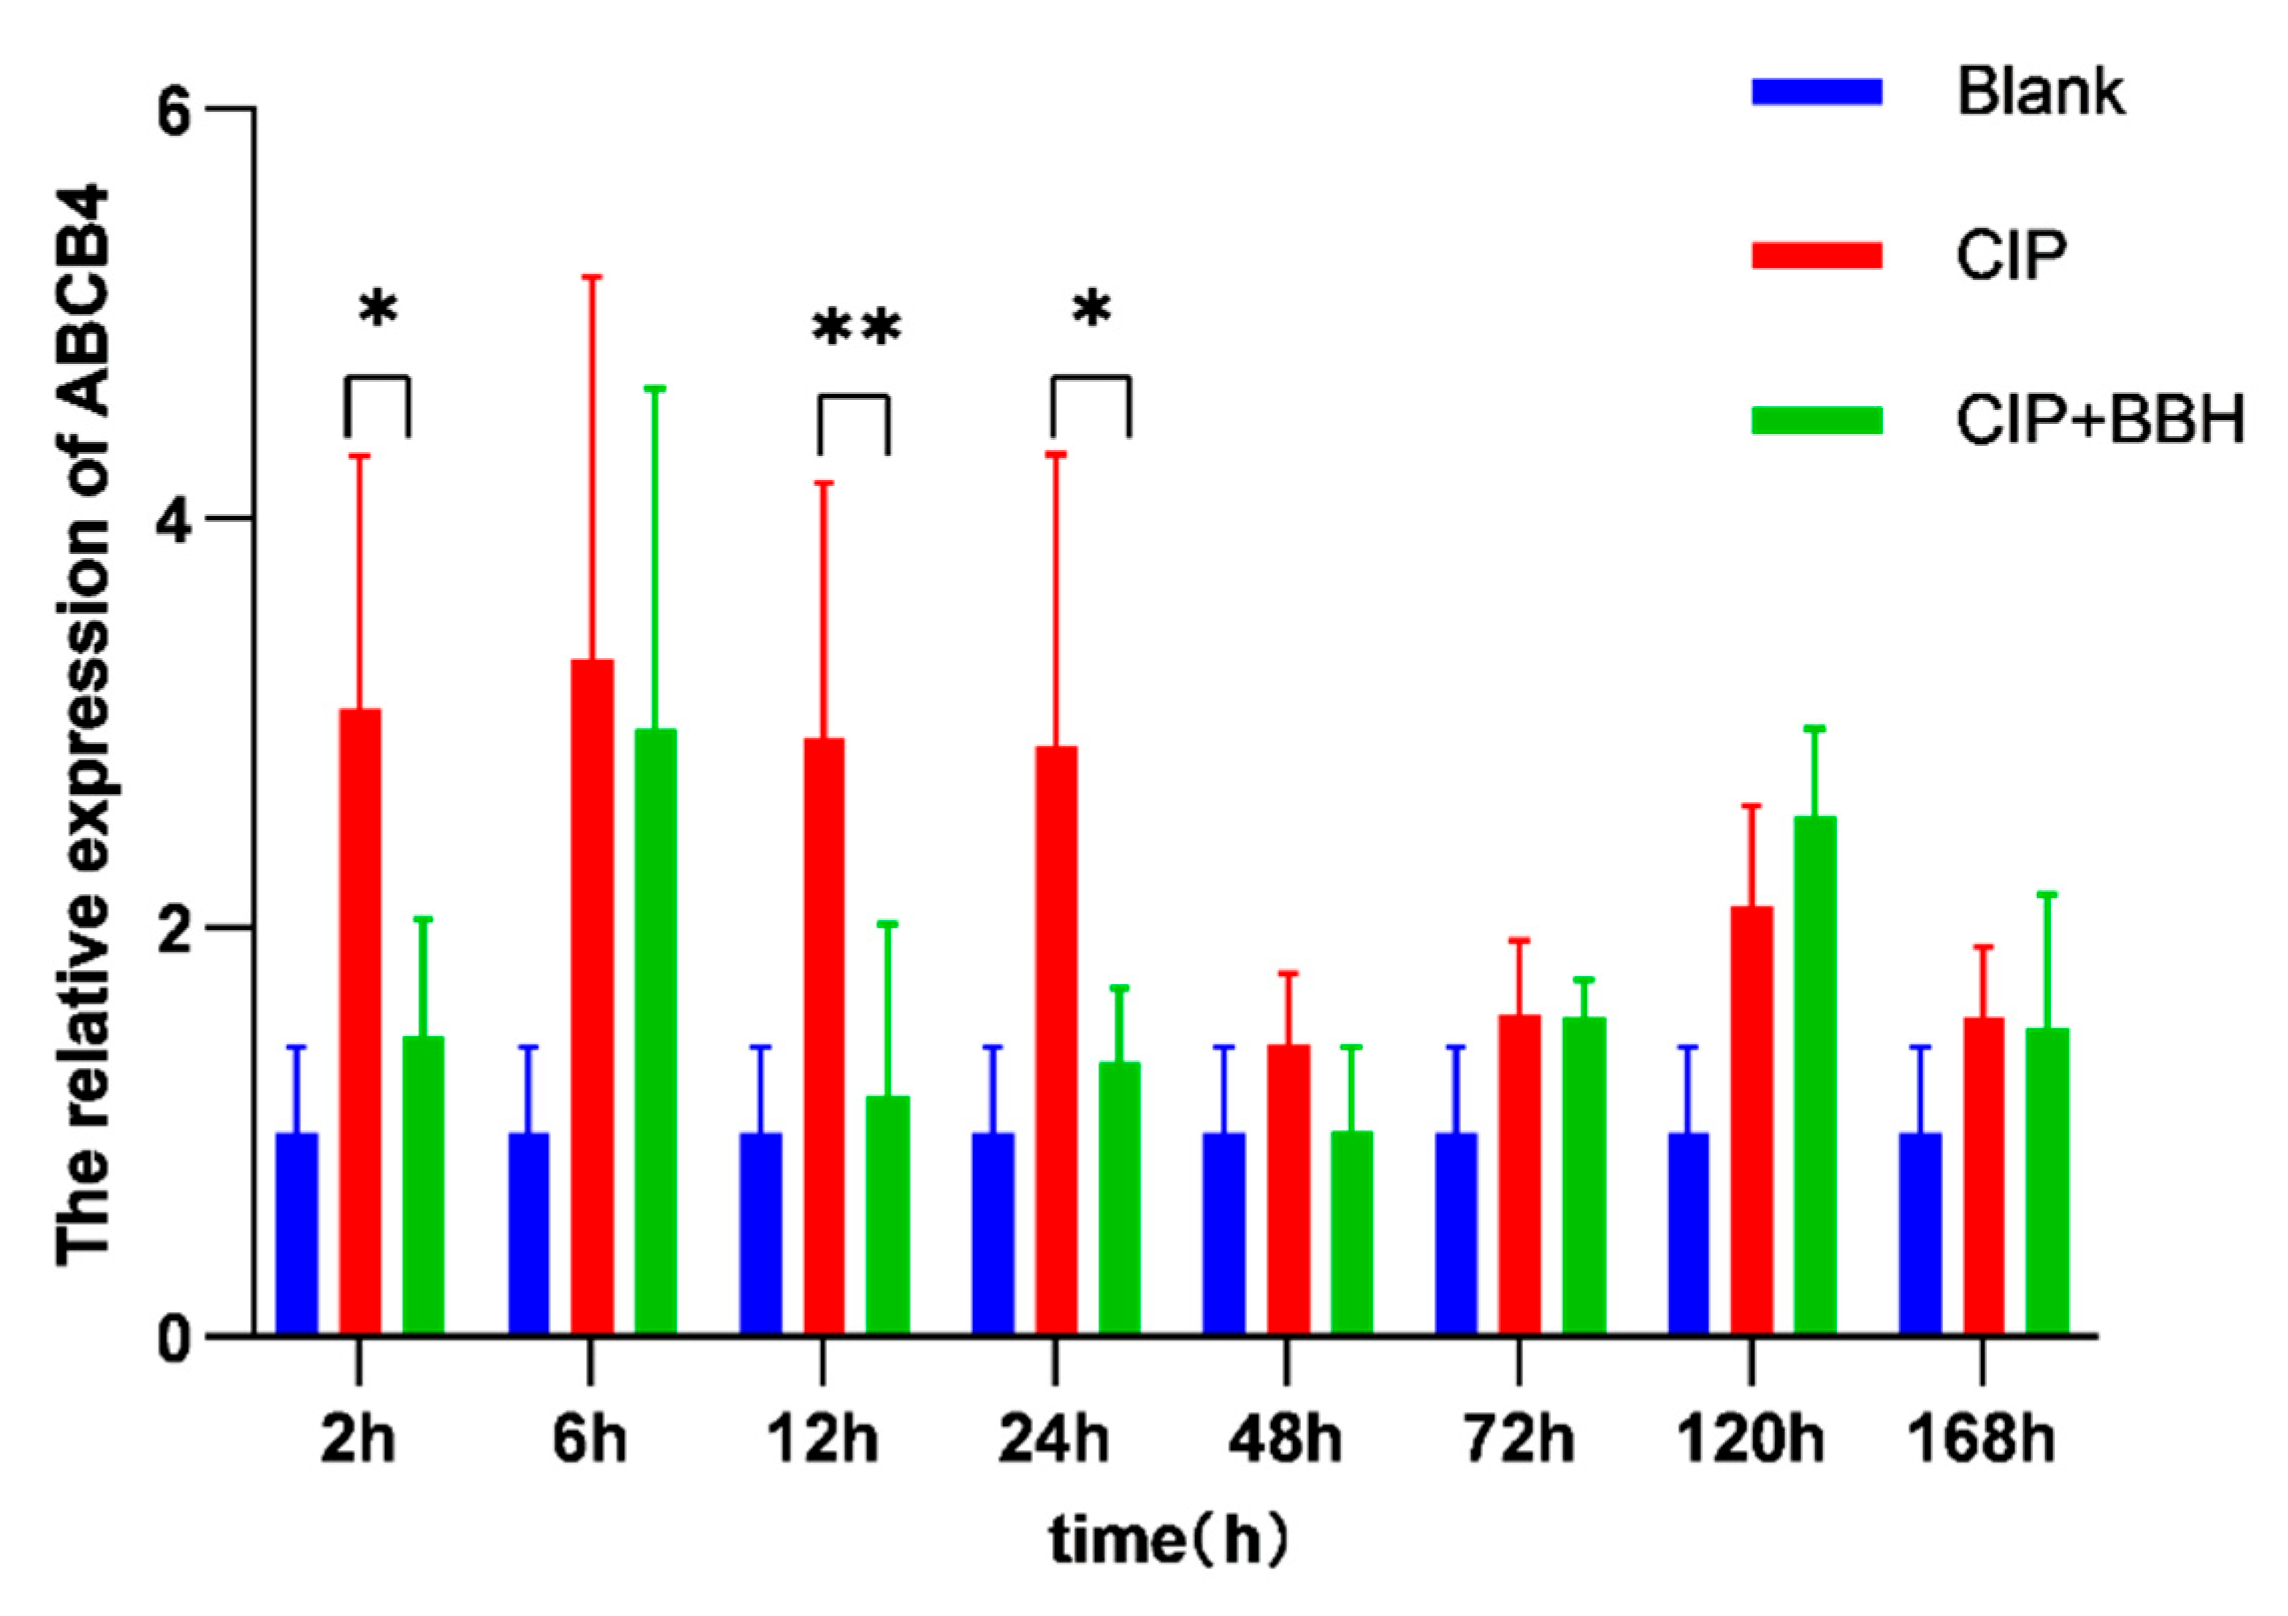
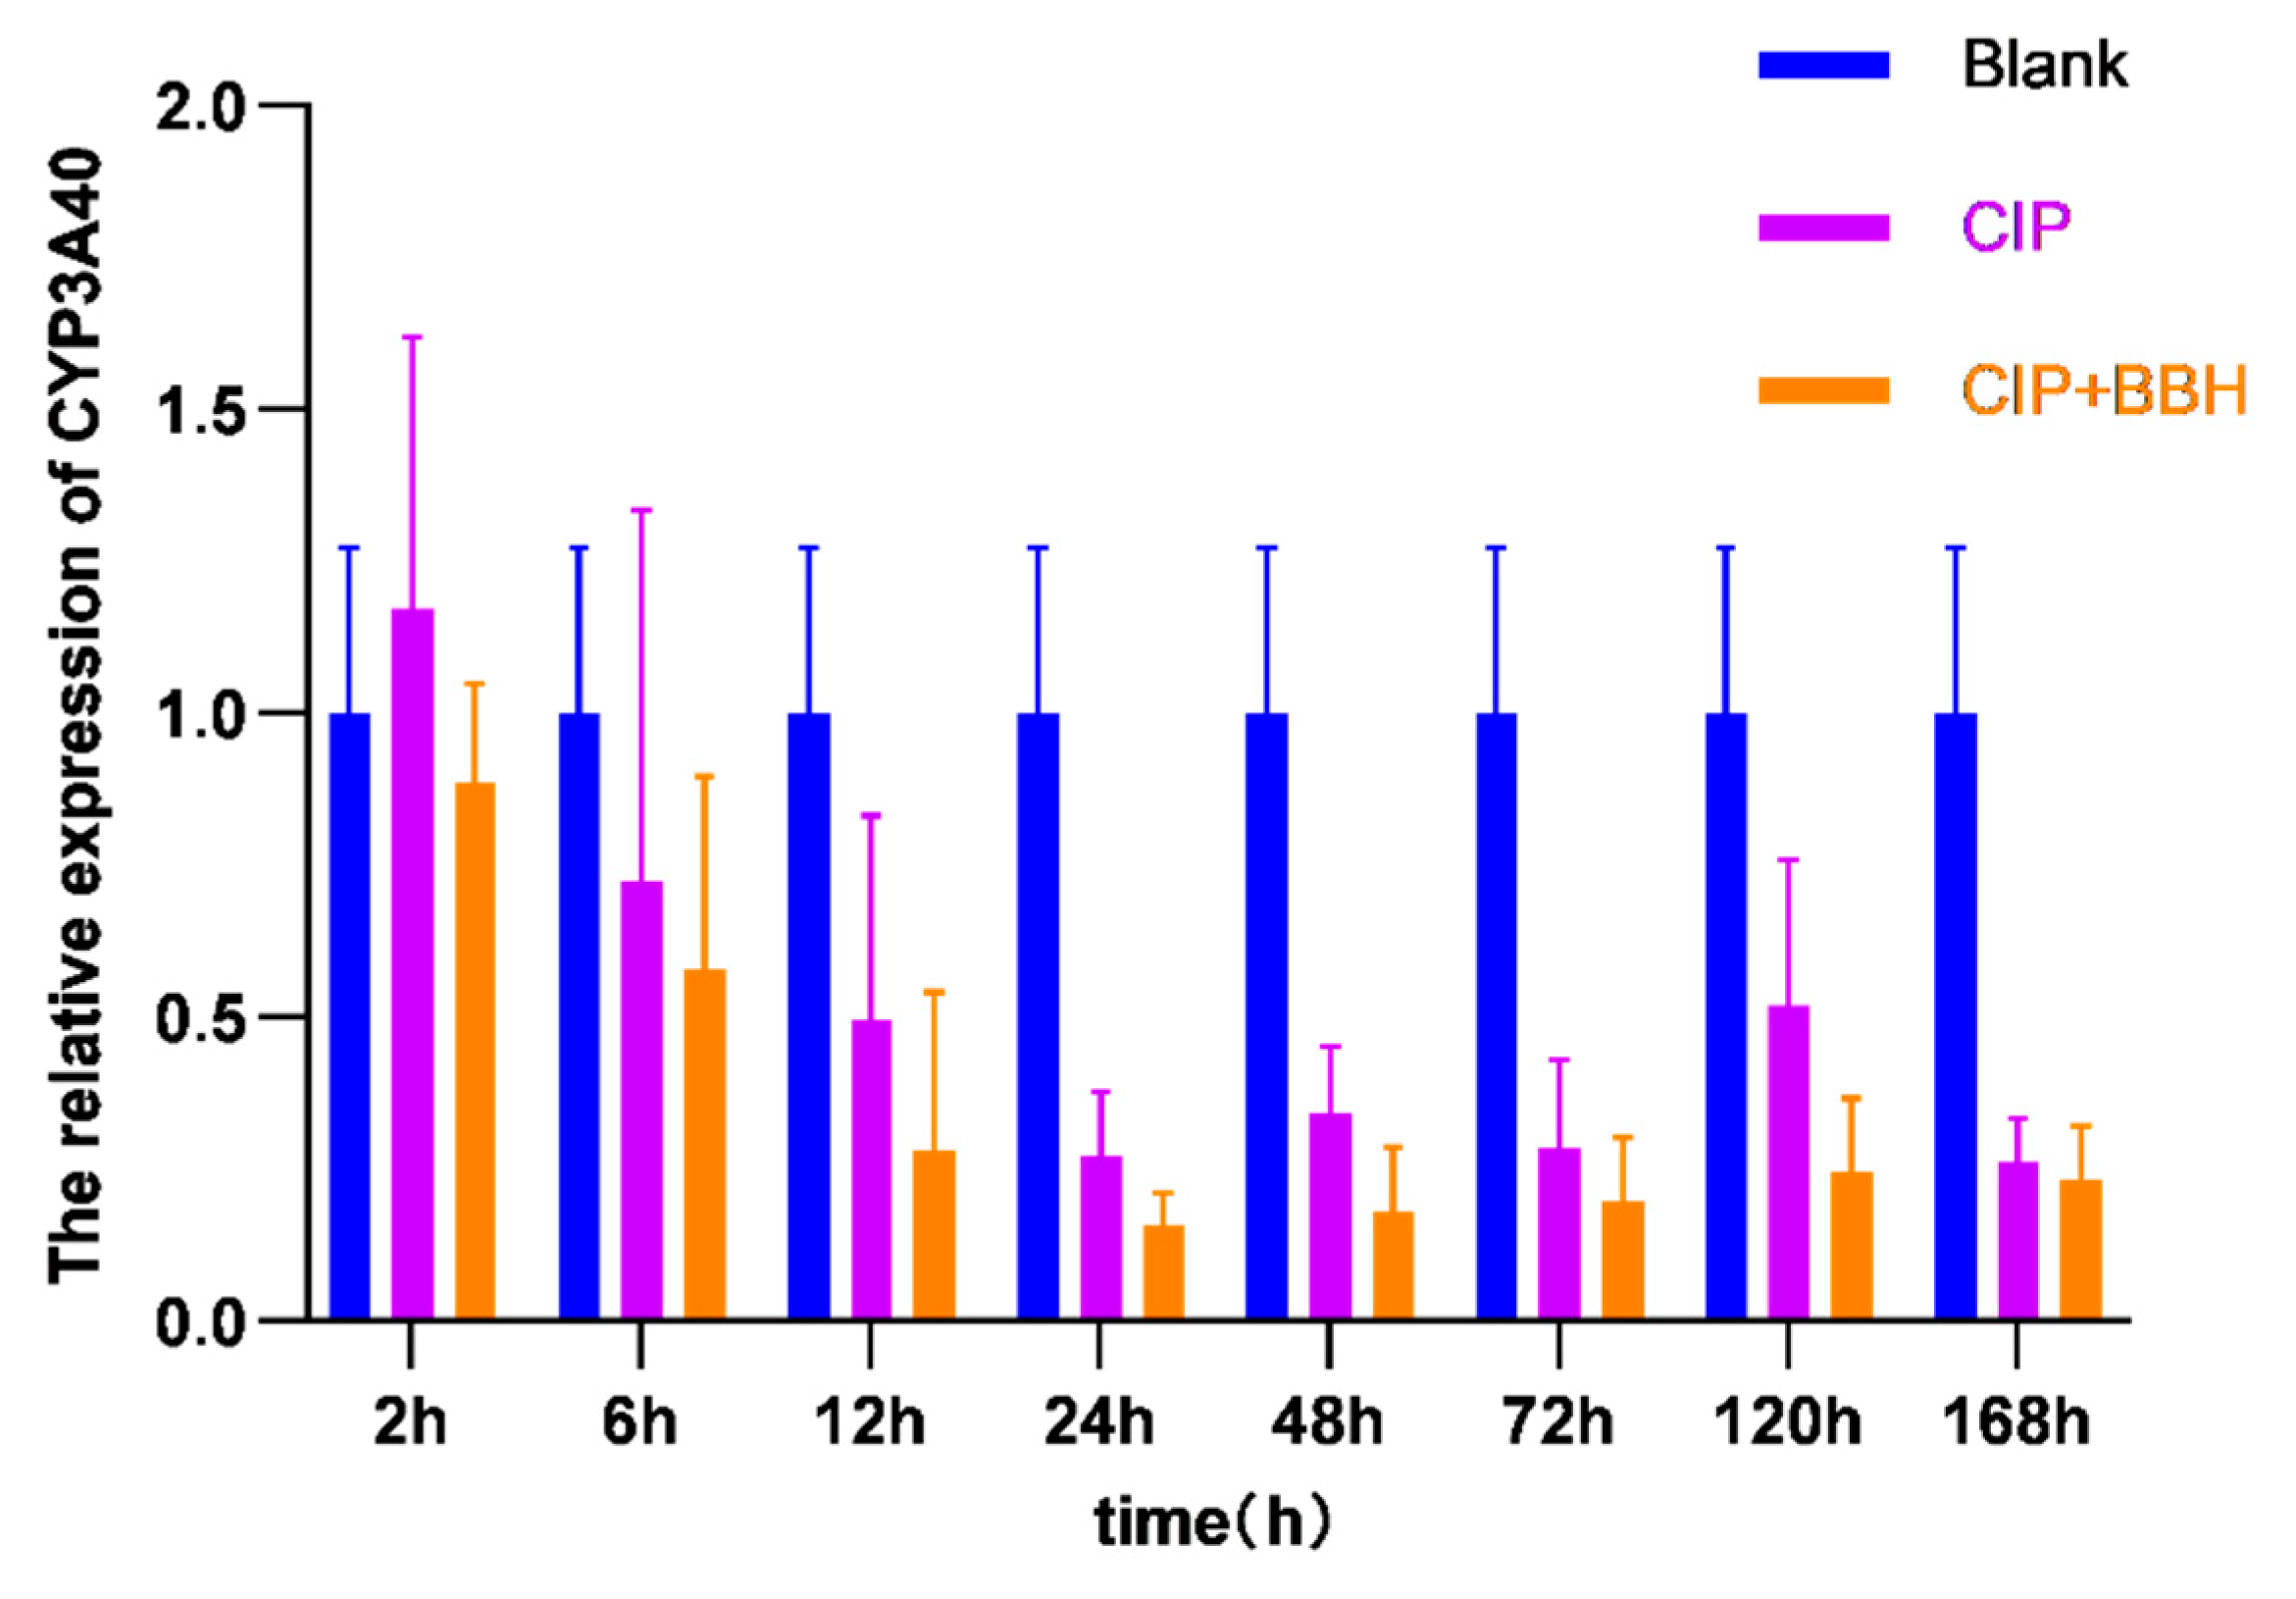
3.3. Analysis of Gene Expression Level in Yellow Catfish

The expression of ABCB4 in the intestine of yellow catfish is shown in Figure 6. The average relative expression of ABCB4 in the CIP + BBH group was generally lower than that in the CIP group, and only 120 h was slightly higher than that in the CIP group, but there was no statistical difference. After a single oral administration of CIP, the expression of the ABCB4 gene in the intestine of yellow catfish increased compared with the blank group and returned to the initial state (blank group) at 48 h. The expression of the ABCB4 gene in the intestine of yellow catfish at 2 h, 6 h, 12 h, and 24 h was significantly higher than that of the blank group (p < 0.01), and the multiples were 3.07 times, 3.31 times, 2.45 times, and 2.89 times, respectively. After the combined administration of CIP and BBH, the relative expression of ABCB4 was significantly lower than that of CIP single drug administration at 2 h, 12 h, and 24 h (p < 0.05). The relative expression at 2 h decreased from 3.07 to 1.47; the relative expression at 12 h decreased from 2.45 to 1.17; and the relative expression at 24 h decreased from 2.89 to 1.34, so that the relative expression of the combined drug group was basically equivalent to the blank group and no longer had statistical difference.
The expression of CYP3A40 in the intestine of yellow catfish is shown in Figure 7. From 12 h onwards, the relative expression of CYP3A40 in the CIP group and the CIP + BBH group was significantly lower than that in the blank group (p < 0.05). The expression of CYP3A40 detected at each time point in the CIP + BBH group was lower than that in the CIP group, but significant difference was not exhibited.

4. Discussion

4.1. Effect of BBH on the Pharmacokinetics of CIP

After the combined administration of BBH and CIP, the Cmax, AUC0–168, and AUC0–∞ of CIP in the plasma and most tissues were higher than those of CIP alone, indicating that the addition of BBH significantly improved the absorption of CIP. Some studies have demonstrated that herbal medicines or plant extracts can significantly enhance the absorption of chemically synthesized drugs in animals [20,32,33]; however, inhibitory effects have also been observed in certain cases [34,35]. Therefore, it is critical to investigate the pharmacokinetic changes in the primary active drug following a combination therapy before co-formulating multiple drugs. Under the two treatment groups, the concentration of CIP in the plasma was always lower than that in other tissues, which was consistent with the results of Wang et al. [36], indicating that ciprofloxacin had strong tissue penetration ability and could be rapidly distributed to various parts of the body. This inference can be confirmed by the fact that the apparent distribution volume (Vz/F) of the plasma was greater than 20 L/kg. The bioavailability of co-administration was higher relative to single administration because bioavailability was correlated with the AUC, with larger AUC resulting in higher bioavailability [4], indicating that BBH improved the bioavailability of CIP in yellow catfish to a certain extent.
The elimination half-life (t1/2) can be used to measure the drug’s ability to eliminate in vivo, and the interval time of continuous administration can be determined according to it. In this study, it was greater than 21 h, except for the t1/2 of CIP plasma after co-administration of the drug, confirming that the efficacy duration of ciprofloxacin is long enough. The total body clearance (CL/F) can reflect the clearance ability of all organs in the body of drugs. After combined administration, the CL/F of CIP in the plasma and tissues was significantly lower than that of CIP single drug administration, suggesting that it was related to the addition of BBH. In a study of the combination of plant extracts and chemical drugs, the guava leaf extract, Schisandra sphenanthera extract, and berberine all reduced the CL/F of warfarin, tacrolimus, and florfenicol in animal plasma, respectively [20,32,33]. The lower CL/F values may also be due to the enterohepatic circulation of the combined administration. Relevant studies have demonstrated that when the drug can be metabolized by the liver, the enterohepatic circulation will significantly reduce the CL/F of the drug [37].

4.2. The Effect of BBH on the Expression of Genes Related to Drug Absorption and Metabolism

ATP transporters are related to drug absorption, which can discharge drugs into intestinal epithelial cells, thus affecting drug absorption. The expression products of the ABCB4 gene can recognize various drugs [21,22] and play an efflux role. At the same time, ABCB4 in fish is homologous to ABCB1, which encodes mammalian P-glycoprotein [23,24]. The increase in its expression will reduce the absorption of drugs. In this study, the expression of ABCB4 was significantly increased after single administration of CIP and then decreased with the increase in time after administration. It is speculated that the concentration of CIP in intestinal tissue increased rapidly after oral administration of CIP, which stimulated the expression of ABCB4 and up-regulated it significantly. Then, the concentration of CIP decreased gradually with the passage of time, and the expression of ABCB4 gradually returned to the blank level. However, after combined administration, compared with single drug administration, ABCB4 significantly reduced the expression at 2 h, 12 h, and 1 d and tended to be consistent with the blank group, which was similar to the results in chickens, with the addition of berberine reducing the expression of the MDR1 gene in broilers [20,38]. It can be found that the addition of berberine hydrochloride reduced the effect of CIP on the expression of the ABCB4 gene in yellow catfish. Combined with the distribution of BBH in tissues after combined administration, it was found that 2 h and 12 h corresponded to the two peaks of BBH concentration in tissues, indicating that the ability of BBH to restore ABCB4 expression may be related to the concentration of BBH in yellow catfish. When the expression of ABCB4 was reduced, the efflux capacity of CIP in intestinal tissue was significantly weakened, which affected the absorption of ciprofloxacin. The peak concentration of ciprofloxacin and the area under the concentration–time curve were significantly higher than those of single drug administration.
The CYP450 enzyme is associated with drug metabolism, which is the main pathway of drug metabolism. The increase in its expression can accelerate the metabolism of drugs, and CYP3A40 is one of them. In our study, the expression of CYP3A40 was remarkably decreased after 12 h of single administration of ciprofloxacin and further decreased after combined administration, but the difference was not significant. In the study of crucian carp [39], berberine can dramatically reduce the expression of CYP3A in the hepatopancreas. It is hypothesized that because the intestine is not the primary site of CYP450 enzyme action, which primarily acts in the liver [40], thus, the changes in the intestinal tract failed to demonstrate statistically significant differences.
The phenomenon whereby the drug flows into the intestine with the bile and then returns to the liver again through reabsorption of the intestine is called enterohepatic circulation [41], which is reflected in the appearance of double peaks or multiple peaks in the concentration–time curve. By comparing the concentration–time curves of CIP after combined administration and single drug administration, it was found that there was a double-peak phenomenon in the combined administration. It was speculated that due to the addition of BBH, enterohepatic circulation of CIP appeared in the yellow catfish. Similar situations also appeared after the combined administration of ferulic acid and warfarin. Under the influence of ferulic acid, warfarin showed a similar double-peak phenomenon [42]. The emergence of enterohepatic circulation has been reported to be related to transporters, and P-glycoprotein is one of them [41,43]. In this study, the concentration–time curve of BBH in each tissue showed a second peak at 12 h after combined administration. At the same time, ABCB4 in the combined administration group was significantly down-regulated at 12 h, and the concentration–time curve of CIP also showed a second peak at 12 h. It is speculated that the reason is that BBH has a higher concentration in intestinal tissue at 12 h, which significantly reduces the expression of ABCB4, resulting in an increase in the reabsorption effect of the intestinal tract on CIP followed by bile inflow near 12 h, so that its concentration in the body shows a small peak again.
Enterohepatic circulation tends to increase the elimination half-life of the drug in the plasma. In this study, the addition of BBH resulted in occurrence of enterohepatic circulation of CIP in the yellow catfish, but the elimination half-life of CIP was reduced. We speculate that this may be due to differences among individual yellow catfish. The plasma concentration fluctuation of CIP over 16–48 h in the CIP and BBH combination administration group was significantly greater than that in the CIP monotherapy group. The lower extreme values reduced the mean concentration at the current time point, leading to a larger decline in plasma concentration for the combination group compared to the monotherapy group, and the calculated elimination half-life was deviated. It is also possible that BBH affects other enzymes involved in CIP metabolism, which strengthens the metabolism of CIP and reduces the elimination half-life of the co-administration group.

4.3. Effect of Combined Administration on Efficacy

CIP is a class of concentration-dependent drugs, and the pharmacokinetic and pharmacodynamic parameters (PK-PD parameters) are AUC/MIC or Cmax/MIC. Previous studies have shown that AUC/MIC > 125 or Cmax/MIC > 8 [44] of quinolones can effectively treat the diseases caused by Gram-negative bacteria and reduce the probability of drug resistance. According to the current situation of yellow catfish breeding, it is not difficult to find that a large part of pathogenic bacteria, such as Aeromonas sobria [45], Edwardsiella ictalurid [2], Vibrio mimicus [3], and so on, are Gram-negative bacteria, and most of the MIC of ciprofloxacin against these aquatic pathogens were ≤0.1 μg/mL [46]. Therefore, according to the above formula, it can be calculated that 10 mg/kg ciprofloxacin hydrochloride can be used to treat diseases caused by bacteria with MIC < 0.057 μg/mL. The same dose of ciprofloxacin hydrochloride combined with berberine hydrochloride can treat diseases caused by bacteria with MIC < 0.108 μg/mL. It can be found that the combined administration promotes the therapeutic effect of CIP at the same dose, and the degree of promotion is about 2 times that of single drug administration.
The recommended dosing regimen can be calculated using the following formula: Dose (per day) = (AUC/MIC) × MICtarget × CL/F. AUC/MIC = 125 h was the best surrogate indicator, and MICtarget was the minimum inhibitory concentration of the target pathogen [47]. Therefore, to inhibit the growth of bacteria with an MIC of 0.1 μg/mL, substituting AUC/MIC = 125 and MICtarget = 0.1 into the calculation, the effective dose of CIP when used alone is 17.38 mg/kg/day; meanwhile, when combined with BBH, the effective dose of CIP is 9.25 mg/kg/day. It is evident that the addition of BBH can effectively reduce the dosage of CIP. Reducing the dosage of antibiotics can reduce the proportion of drug-resistant bacteria to a certain extent [48]; thus, the combined use of BBH and CIP may reduce the emergence of ciprofloxacin-resistant strains in aquatic environments, which is of significant importance for mitigating quinolone resistance in aquaculture.

4.4. Limitations of the Study

Temperature is an important variable affecting the absorption and metabolism of drugs in fish [49]. However, this study was conducted at a single temperature, and the differences between different species should also be noted. Therefore, it is imperative to investigate the influence of BBH on CIP pharmacokinetics in fish under various water temperatures and across different species.

5. Conclusions

The results of this investigation suggest that the addition of BBH can promote the absorption of CIP in yellow catfish, improve the bioavailability of CIP after oral administration, and thus promote the effect of CIP in the treatment of bacterial diseases at the same dose. The specific mechanism may be that BBH reduces the relative expression of the ABCB4 gene, resulting in increased absorption of CIP in fish.

Author Contributions

T.Z.: Conceptualization, Formal Analysis, Investigation, Writing—Original Draft; X.D.: Methodology, Investigation; Y.C.: Validation, Investigation; Y.L.: Supervision, Writing—Review and Editing. All authors have read and agreed to the published version of the manuscript.

Funding

This study was financially supported by the National Key Research and Development Program of China (2023YFD2400705), the open fund of China (Guangxi)-ASEAN key Laboratory of Comprehensive Exploitation and Utilization of Aquatic Germplasm Resources, the Ministry of Agriculture and Rural Affairs (GXKEYLA-2023-01-8), and the Central Public-interest Scientific Institution Basal Research Fund, CAFS (No. 2024TD47).

Institutional Review Board Statement

All animal experiments in this study strictly adhered to the guidelines for the care and management of experimental animals, and the study procedures were conducted at Yangtze River Fisheries Research Institute, Chinese Academy of Fishery Sciences (Wuhan, China), and approved by the Fish Ethics Committee of Yangtze River Fisheries Research Institute, Chinese Academy of Fishery Sciences, Wuhan, China (Approval number: 2022-Liu Yongtao-04), on 16 August 2023.

Informed Consent Statement

Not applicable.

Data Availability Statement

The datasets used and analyzed in the current study are available from the corresponding author upon reasonable request.

Conflicts of Interest

The authors declare that they have no competing interests.

References

  1. CCFA. China Fisheries Statistics Yearbook; China Agriculture Press: Beijing, China, 2024. [Google Scholar]
  2. Guo, M.; Sun, R.; Wu, Z.; Li, A.; Wang, Q.; Zhao, Z.; Liu, H.; Wang, B.; Xiao, K.; Shi, Z.; et al. A comparative study on the immune response in the head and trunk kidney of yellow catfish infected with Edwardsiella ictaluri. Fish Shellfish Immunol. 2024, 154, 109895. [Google Scholar] [CrossRef] [PubMed]
  3. Geng, Y.; Liu, D.; Han, S.; Zhou, Y.; Wang, K.Y.; Huang, X.L.; Chen, D.F.; Peng, X.; Lai, W.M. Outbreaks of vibriosis associated with Vibrio mimicus in freshwater catfish in China. Aquaculture 2014, 433, 82–84. [Google Scholar] [CrossRef]
  4. Yang, B.; Chen, J. Pharmacology, 9th ed.; People’s Medical Publishing House: Beijing, China, 2018. [Google Scholar]
  5. Millanao, A.R.; Mora, A.Y.; Villagra, N.A.; Bucarey, S.A.; Hidalgo, A.A. Biological Effects of Quinolones: A Family of Broad-Spectrum Antimicrobial Agents. Molecules 2021, 26, 7153. [Google Scholar] [CrossRef]
  6. Jiang, Y.; Yao, L.; Li, F.; Tan, Z.; Zhai, Y.; Wang, L. Characterization of antimicrobial resistance of Vibrio parahaemolyticus from cultured sea cucumbers (Apostichopus japonicas). Lett. Appl. Microbiol. 2014, 59, 147–154. [Google Scholar] [CrossRef]
  7. Lukkana, M.; Jantrakajorn, S.; Wongtavatchai, J. Antimicrobial susceptibility and enrofloxacin resistance of streptococcal bacteria from farmed Nile tilapia, Oreochromis niloticus (Linnaeus 1758) in Thailand. Aquac. Res. 2016, 47, 3136–3144. [Google Scholar] [CrossRef]
  8. Chokmangmeepisarn, P.; Thangsunan, P.; Kayansamruaj, P.; Rodkhum, C. Resistome characterization of Flavobacterium columnare isolated from freshwater cultured Asian sea bass (Lates calcarifer) revealed diversity of quinolone resistance associated genes. Aquaculture 2021, 544, 737149. [Google Scholar] [CrossRef]
  9. Tomova, A.; Ivanova, L.; Buschmann, A.H.; Godfrey, H.P.; Cabello, F.C. Plasmid-Mediated Quinolone Resistance (PMQR) Genes and Class 1 Integrons in Quinolone-Resistant Marine Bacteria and Clinical Isolates of Escherichia coli from an Aquacultural Area. Microb. Ecol. 2017, 75, 104–112. [Google Scholar] [CrossRef]
  10. Wang, K.; Yin, J.; Chen, J.; Ma, J.; Si, H.; Xia, D. Inhibition of inflammation by berberine: Molecular mechanism and network pharmacology analysis. Phytomedicine 2024, 128, 155258. [Google Scholar] [CrossRef]
  11. Chen, S.; Jiang, X.; Liu, N.; Ren, M.; Wang, Z.; Li, M.; Chen, N.; Li, S. Effects of dietary berberine hydrochloride inclusion on growth, antioxidant capacity, glucose metabolism and intestinal microbiome of largemouth bass (Micropterus salmoides). Aquaculture 2022, 552, 738023. [Google Scholar] [CrossRef]
  12. Sun, Q.; Tao, Q.; Ming, T.Q.; Tang, S.; Zhao, H.; Liu, M.L.; Yang, H.; Ren, S.; Lei, J.R.; Liang, Y.J.; et al. Berberine is a suppressor of Hedgehog signaling cascade in colorectal cancer. Phytomedicine 2023, 114, 154792. [Google Scholar] [CrossRef]
  13. Zhang, D.; Li, A.; Xie, J.; Ji, C. In vitro antibacterial effect of berberine hydrochloride and enrofloxacin to fish pathogenic bacteria. Aquac. Res. 2010, 41, 1095–1100. [Google Scholar] [CrossRef]
  14. Jiang, Y.; Han, C.; Gong, H.; Chen, J.; Tang, B.; Yang, M.; Qin, Q.; Wei, S. Berberine inhibits SGIV replication by suppressing inflammatory response and oxidative stress. Fish Shellfish Immunol. 2024, 149, 109522. [Google Scholar] [CrossRef] [PubMed]
  15. Yang, B.; Liu, T.; Yang, F.; Wang, M.; Liu, X.; Li, P.; Ling, F.; Wang, G. Mitochondrial apoptotic pathway-mediated suppression of largemouth bass virus proliferation by berberine. Aquaculture 2024, 588, 740881. [Google Scholar] [CrossRef]
  16. Feng, X.; Wang, K.; Cao, S.; Ding, L.; Qiu, F. Pharmacokinetics and Excretion of Berberine and Its Nine Metabolites in Rats. Front. Pharmacol. 2020, 11, 594852. [Google Scholar] [CrossRef]
  17. Kumar, A.; Ekavali; Chopra, K.; Mukherjee, M.; Pottabathini, R.; Dhull, D.K. Current knowledge and pharmacological profile of berberine: An update. Eur. J. Pharmacol. 2015, 761, 288–297. [Google Scholar] [CrossRef]
  18. Wu, F.; Cui, M.; Wang, S.; Yu, C.; Yin, W.; Li, J.; Yan, X. Effect of berberine on pharmacokinetics and pharmacodynamics of atorvastatin in hyperlipidemia rats. Xenobiotica 2023, 53, 644–652. [Google Scholar] [CrossRef]
  19. Xin, H.W.; Tang, X.; Ouyang, M.; Zhong, J.X.; Li, W.L. Effects of berberine on pharmacokinetics of midazolam and rhodamine 123 in rats in vivo. SpringerPlus 2016, 5, 380. [Google Scholar] [CrossRef]
  20. Li, S.; Wang, B.; Zhang, M.; Yuan, D.; Li, J.; Li, X.; Liang, G. Effects of berberine on the pharmacokinetics of florfenicol and levels of cytochrome P450 3A37, multidrug resistance 1, and chicken xenobiotic-sensing orphan nuclear receptor mRNA expression in broilers. Vet. Med. Sci. 2022, 8, 619–625. [Google Scholar] [CrossRef] [PubMed]
  21. Wen, C.; Fu, L.; Huang, J.; Dai, Y.; Wang, B.; Xu, G.; Wu, L.; Zhou, H. Curcumin reverses doxorubicin resistance via inhibition the efflux function of ABCB4 in doxorubicin-resistant breast cancer cells. Mol. Med. Rep. 2019, 19, 5162–5168. [Google Scholar] [CrossRef]
  22. Xu, X.; Zheng, Y.; Luo, L.; You, Z.; Chen, H.; Wang, J.; Zhang, F.; Liu, Y.; Ke, Y. Glioblastoma stem cells deliver ABCB4 transcribed by ATF3 via exosomes conferring glioblastoma resistance to temozolomide. Cell Death Dis. 2024, 15, 318. [Google Scholar] [CrossRef]
  23. Luckenbach, T.; Burkhardt-Medicke, K. Differing temperature dependencies of functional homologs zebrafish Abcb4 and human ABCB1. Front. Pharmacol. 2024, 15, 1426040. [Google Scholar] [CrossRef]
  24. Park, J.; Kim, H.; Alabdalla, L.; Mishra, S.; McHaourab, H. Generation and characterization of a zebrafish knockout model of abcb4, a homolog of the human multidrug efflux transporter P-glycoprotein. Hum. Genom. 2023, 17, 84. [Google Scholar] [CrossRef] [PubMed]
  25. Li, J.; Wang, S.; Tian, F.; Zhang, S.Q.; Jin, H. Advances in Pharmacokinetic Mechanisms of Transporter-Mediated Herb-Drug Interactions. Pharmaceuticals 2022, 15, 1126. [Google Scholar] [CrossRef] [PubMed]
  26. Xu, Y.; Chen, G.; Xiong, T.; Peng, Y.; Ruan, T.; Wang, G.; Sun, J. Research progress of P-glycoprotein induction. J. China Pharm. Univ. 2018, 49, 26–33. [Google Scholar] [CrossRef]
  27. Wei, Y.; Palazzolo, L.; Ben Mariem, O.; Bianchi, D.; Laurenzi, T.; Guerrini, U.; Eberini, I. Investigation of in silico studies for cytochrome P450 isoforms specificity. Comput. Struct. Biotechnol. J. 2024, 23, 3090–3103. [Google Scholar] [CrossRef]
  28. Zhang, Y.C.; Benet, L.Z. The gut as a barrier to drug absorption—Combined role of cytochrome P450 3A and P-glycoprotein. Clin. Pharmacokinet. 2001, 40, 159–168. [Google Scholar] [CrossRef]
  29. CVPC. Quality Standards for Veterinary Drugs, 2017 ed.; China Agriculture Press: Beijing, China, 2017. [Google Scholar]
  30. Liu, Y.; Han, G.; Dong, J.; Yang, Y.; Yang, Q.; Xu, N.; Zhou, S.; Ai, X. Sex-related differences in disposition of sulfamethoxazole, N-acetyl-sulfamethoxazole and trimethoprim in yellow catfish (Pelteobagrus fulvidraco) following a single oral administration. Aquaculture 2021, 531, 735869. [Google Scholar] [CrossRef]
  31. EC. Commission Decision of 12 August 2002 Implementing Council Directive 96/23/Ec Concerning the Performance of Analytical Methods and the Interpretation of Results (2002/657/Ec). L221, 8–36: Official Journal of the European Communities. 2002. Available online: https://eur-lex.europa.eu/legal-content/EN/TXT/PDF/?uri=CELEX:32002D0657&from=EN (accessed on 11 May 2024).
  32. Alnaqeeb, M.; Mansor, K.A.; Mallah, E.M.; Ghanim, B.Y.; Idkaidek, N.; Qinna, N.A. Critical pharmacokinetic and pharmacodynamic drug-herb interactions in rats between warfarin and pomegranate peel or guava leaves extracts. BMC Complement. Altern. Med. 2019, 19, 29. [Google Scholar] [CrossRef]
  33. Qin, X.; Li, J.; Wang, S.; Chen, X.; Huang, M.; Bi, H. Co-administration of Wuzhi tablet (Schisandra sphenanthera extract) alters tacrolimus pharmacokinetics in a dose- and time-dependent manner in rats. J. Ethnopharmacol. 2020, 263, 113233. [Google Scholar] [CrossRef]
  34. Liu, Y.; Zhang, G.; Yang, Y.; Zhou, S.; Dong, J.; Yang, Q.; Xu, N.; Ai, X. Artemisinin alters disposition regularities of enrofloxacin and its metabolite ciprofloxacin in channel catfish (Ictalurus punetaus) following combined oral administration. Aquaculture 2023, 572, 739466. [Google Scholar] [CrossRef]
  35. Chen, H.; Yuan, L.; Ma, X.; Gong, Z.; Li, Y.; Chen, S.; Pan, J.; Wang, A.; Zheng, L.; Huang, Y. Herb-drug interaction: The effect of Polygonum capitatum extract on pharmacokinetics of levofloxacin in rats. J. Pharm. Biomed. Anal. 2021, 195, 113832. [Google Scholar] [CrossRef] [PubMed]
  36. Wang, H.; Xu, L.; Chen, X.; Yuan, J.; Tian, D.; Jiang, F.; Wu, Z. Pharmacokinetics of enrofloxacin in Procambarus clarkiiat different temperatures. J. Huazhong Agric. Univ. 2021, 40, 112–119. [Google Scholar] [CrossRef]
  37. Ibarra, M.; Troconiz, I.F.; Fagiolino, P. Enteric reabsorption processes and their impact on drug pharmacokinetics. Sci. Rep. 2021, 11, 5794. [Google Scholar] [CrossRef] [PubMed]
  38. Zhang, Y.; Guo, L.; Huang, J.; Sun, Y.; He, F.; Zloh, M.; Wang, L. Inhibitory Effect of Berberine on Broiler P-glycoprotein Expression and Function: In Situ and In Vitro Studies. Int. J. Mol. Sci. 2019, 20, 1966. [Google Scholar] [CrossRef]
  39. Zhou, C.; Li, X.; Fang, W.; Yang, X.; Hu, L.; Zhou, S.; Zhou, J. Inhibition of CYP450 1A and 3A by berberine in crucian carp Carassius auratus gibelio. Comp. Biochem. Physiol. Part C Toxicol. Pharmacol. 2011, 154, 360–366. [Google Scholar] [CrossRef]
  40. LeCluyse, E.L. Human hepatocyte culture systems for the in vitro evaluation of cytochrome P450 expression and regulation. Eur. J. Pharm. Sci. 2001, 13, 343–368. [Google Scholar] [CrossRef] [PubMed]
  41. Malik, M.Y.; Jaiswal, S.; Sharma, A.; Shukla, M.; Lal, J. Role of enterohepatic recirculation in drug disposition: Cooperation and complications. Drug Metab. Rev. 2016, 48, 281–327. [Google Scholar] [CrossRef]
  42. Li, H.; Wang, Y.; Fan, R.; Lv, H.; Sun, H.; Xie, H.; Tang, T.; Luo, J.; Xia, Z. The effects of ferulic acid on the pharmacokinetics of warfarin in rats after biliary drainage. Drug Des. Devel Ther. 2016, 10, 2173–2180. [Google Scholar] [CrossRef]
  43. Stieger, B.; Meier, P.J. Pharmacogenetics of Drug Transporters in the Enterohepatic Circulation. Pharmacogenomics 2011, 12, 611–631. [Google Scholar] [CrossRef]
  44. Wright, D.H.; Brown, G.H.; Peterson, M.L.; Rotschafer, J.C. Application of fluoroquinolone pharmacodynamics. J. Antimicrob. Chemother. 2000, 46, 669–683. [Google Scholar] [CrossRef]
  45. Liu, F.; Meng, L.; Yang, S.; Shi, Y.; Meng, D.; Yi, X. The study of yellow catfish muscle decay and its therapy technique. Chin. Fish. Qual. Stand. 2016, 6, 63–70. [Google Scholar]
  46. Akinbowale, O.L.; Peng, H.; Barton, M.D. Antimicrobial resistance in bacteria isolated from aquaculture sources in Australia. J. Appl. Microbiol. 2006, 100, 1103–1113. [Google Scholar] [CrossRef] [PubMed]
  47. Toutain, P.L.; del Castillo, J.R.; Bousquet-Melou, A. The pharmacokinetic-pharmacodynamic approach to a rational dosage regimen for antibiotics. Res. Vet. Sci. 2002, 73, 105–114. [Google Scholar] [CrossRef] [PubMed]
  48. St-Hilaire, S.; Chan, S.C.H.; Lim, K.Z.; MacKinnon, B.; Cheng, T.H.; Cheng, K.P.F.; Leung, A.C.F.; Lam, S.H.Y.; Bhardwaj, V.; Chan, O.S.K. Subsidized veterinary extension services may reduce antimicrobial resistance in aquaculture. Sci. Rep. 2023, 13, 10118. [Google Scholar] [CrossRef]
  49. Rairat, T.; Hsieh, C.Y.; Thongpiam, W.; Sung, C.H.; Chou, C.C. Temperature-dependent pharmacokinetics of florfenicol in Nile tilapia (Oreochromis niloticus) following single oral and intravenous administration. Aquaculture 2019, 503, 483–488. [Google Scholar] [CrossRef]
Figure 1. The plasma concentration–time curve of CIP in yellow catfish after single administration of CIP and combined administration with BBH (n = 5). The upper right section shows the concentration–time curve over 0–24 h.
Fishes 10 00245 g001
Figure 2. The distribution of CIP in muscle of yellow catfish after single administration of CIP and combined administration with BBH (n = 5). * was used to indicate significant differences (p < 0.05); ** indicates extremely significant differences (p < 0.01).
Fishes 10 00245 g002
Figure 3. The distribution of CIP in gill of yellow catfish after single administration of CIP and combined administration with BBH (n = 5). * was used to indicate significant differences (p < 0.05); ** indicates extremely significant differences (p < 0.01).
Fishes 10 00245 g003
Figure 4. The distribution of CIP in liver of yellow catfish after single administration of CIP and combined administration with BBH (n = 5). * was used to indicate significant differences (p < 0.05); ** indicates extremely significant differences (p < 0.01).
Fishes 10 00245 g004
Figure 5. The concentration–time curves of BBH in plasma and tissues of yellow catfish after the combination of CIP and BBH (n = 5). The upper right section shows the concentration–time curve over 0–24 h.
Fishes 10 00245 g005
Figure 6. The relative expression levels of ABCB4 gene in the intestine of yellow catfish across the blank control group, the CIP single administration group, and the CIP + BBH combined administration group (n = 5). * was used to indicate significant differences (p < 0.05); ** indicates extremely significant differences (p < 0.01).
Fishes 10 00245 g006
Figure 7. The relative expression levels of CYP3A40 gene in the intestine of yellow catfish across the blank control group, the CIP single administration group, and the CIP + BBH combined administration group (n = 5).
Fishes 10 00245 g007
Table 1. Gradient elution procedure.
Time (min)A (V/V, %)B (V/V, %)Flow Rate (μL/min)
08020300
38020300
41090300
58020300
98020300
Table 2. The parent ions and fragment ions of target compounds.
ComponentParent Ion (m/z)Fragment Ion (m/z)CE (eV)
CIP332288.318
314.1 *22
BBH336292.131
320.4 *29
CIP-D8340322.5 *26
* is a quantitative ion.
Table 3. RT-qPCR primers of yellow catfish.
GeneGenBank NumberSequence (5′–3′)BaseProduct (bp)
ABCB4XM_027172914.2F: GCAGCCCTGGATAAGGTGAG20116
R: ATTTCTGCGACTTCCCCGTT20
CYP3A40XM_027170875.2F: CTCTCAGACACACTACAGTAACG23178
R: CAGTACCCATACAGCAGGAC20
β-actinXM_027148463.2F: TCTATGAAGGTTATGCTCTGCCCC24130
R: ATTTCCCTCTCAGCTGTGGTAGTG24
Table 4. Recovery rates and precisions of CIP and BBH in plasma and various tissues (n = 5).
TissuesAnalytesConcentration
(μg/L or μg/kg)
Average Recoveries
(%)
Precisions (CV, %)
Intra-DayInter-Day
CIPplasma1110.77.84.3
2087.28.99.1
20092.11.13.1
muscle193.4 7.45.8
2081.74.73.9
20087.91.35.6
gill190.6 1.22.1
2084.23.06.9
20092.14.05.1
liver196.8 1.27.9
2085.72.12.3
20095.11.47.1
BBHplasma184.9 2.8 3.4
2090.64.64.9
20083.63.86.7
muscle186.5 4.7 4.3
2081.02.23.7
20088.81.83.8
gill189.2 1.7 5.3
2094.74.02.2
20090.73.34.7
liver185.4 1.1 4.2
20108.59.32.8
200117.94.51.7
Table 5. Pharmacokinetic parameters of CIP in plasma and tissues of yellow catfish under two treatment groups (n = 5).
PlasmaMuscleGillLiver
CIPCIP + BBHCIPCIP + BBHCIPCIP + BBHCIPCIP + BBH
Tmaxh226122266
Cmaxμg/L (μg/kg)537.37 ± 32.67859.83 ± 265.45 *844.64 ± 209.951418.80 ± 298.23 **1073.92 ± 401.421572.09 ± 314.10 **1892.26 ± 500.072056.71 ± 439.02
AUC0–168h·μg/L7109.9413,479.4621,224.5535,130.8913,786.0130,330.6034,788.0064,469.70
AUC0–∞h·μg/L7169.7113,513.2421,519.8635,573.6813,945.9230,909.7335,769.5872,228.07
λzL/h0.0320.0360.0250.0240.0240.0230.0240.010
t1/2h21.8019.3827.6729.2628.8729.6629.2370.05
Vz/FL/kg43.8520.67------
CL/FL/h/kg1.390.74------
MRT0–168h27.0221.6332.6331.9024.4034.3240.3439.66
MRT0–∞h28.4622.0735.0734.1026.5437.6045.0064.30
Tmax: the time to peak concentration; Cmax: the maximum concentration; AUC0–168: 0–168 h area under the curve; AUC0–∞: 0–∞ area under the curve; λz: the elimination rate constant; t1/2: the elimination half-life; Vz/F: the apparent distribution volume; CL/F: the total body clearance; MRT0–168: the mean residence time from 0 to 168 h; MRT0–∞: the mean residence time from 0 to infinity. * was used to indicate significant differences (p < 0.05); ** indicates extremely significant differences (p < 0.01).
Disclaimer/Publisher’s Note: The statements, opinions and data contained in all publications are solely those of the individual author(s) and contributor(s) and not of MDPI and/or the editor(s). MDPI and/or the editor(s) disclaim responsibility for any injury to people or property resulting from any ideas, methods, instructions or products referred to in the content.

