1. Introduction
Mariculture is an important part of the global supply of aquatic products and plays an indispensable role in ensuring food security and promoting economic development in coastal areas. However, with the continuous expansion of farming scale, achieving sustainable development in the industry has become an urgent global issue. The Food and Agriculture Organization of the United Nations (FAO) is highly concerned about the ecological sustainability of mariculture and has put forward a series of policy recommendations and development goals. Strengthening the ecosystem management of mariculture is regarded as the top priority, including optimizing the layout and density of aquaculture, reducing environmental impacts, and achieving coordinated development of aquaculture and ecological protection. FAO places special emphasis on promoting the interests of small-scale fisheries and developing mariculture models suitable for local economic development and employment in less-developed coastal areas. In this context, marine oyster farming, as a typical form of small-scale aquaculture, is ecologically friendly and socially inclusive, aligning well with FAO’s concept of sustainable development. This study focuses on the marine oyster farming industry in the Maowei Sea and explores the potential of applying remote sensing technology to the optimization of the layout and scale of local aquaculture, thus providing scientific evidence for high-stake decision-making in the benefit of sustainable development of the mariculture industry.
Since the continuous management and monitoring of marine aquaculture are essential for the sustainable development of the local economy and environmental conservation, high-resolution remote sensing imagery has become an invaluable tool in this domain, offering detailed insights that support effective planning and dynamic monitoring of aquaculture activities [
1,
2].
Accurate extraction of aquaculture areas from remote sensing imagery is critical for optimizing resource use, assessing production scales, and mitigating environmental impacts. However, extracting accurate information from remote sensing imagery presents several challenges, one of which is the presence of substantial noise in remote sensing imagery, including both coherent noise from optical sources and incoherent noise from sediments and floating objects on the sea surface. This noise complicates the segmentation process, making it difficult to accurately isolate aquaculture targets such as oyster rafts, which often occupy a minimal fraction of the overall pixel count and predominantly consist of small-scale objects [
3,
4,
5]. The complexity of recording and collecting remote sensing imagery datasets makes it more difficult for the robustness of tools specifically for aquaculture applications [
6,
7]. Traditional Convolutional Neural Network (CNN) architectures, characterized by successive pooling operations and large convolutional kernels, may result in reduced resolution of feature maps, which is detrimental to the segmentation accuracy of small-scale targets [
8].
Previously, conventional segmentation techniques such as threshold segmentation and mathematical transformations have been employed to identify aquaculture areas based on characteristics like shape, color, grayscale, and texture [
9,
10,
11,
12,
13,
14,
15,
16]. While useful for preliminary classification and basic feature identification, these methods are resource-intensive and less efficient. They are also prone to disturbances from extraneous noise sources like ships and floating debris, limiting their accuracy and applicability [
11,
12,
14,
16]. Recent advancements in Deep Learning (DL) have shown promise in addressing these challenges. For instance, Cheng et al. developed a semantic segmentation model based on a Hybrid Extended Convolutional Neural Network (HECNet), combining UNet and Hybrid Extended Convolution to reduce the influence of similar objects on the sea surface, thus improving boundary segmentation accuracy [
6]. Semi-supervised learning methods have been designed to tackle the issues of data acquisition and labeling, proving effective in emergency response and area estimation for aquaculture areas [
7]. An improved version of UNet, incorporating an Atrous Spatial Pyramid Pooling (ASPP) module, has been applied to medium-resolution remote sensing imagery to address the boundary edge segmentation problem of densely distributed aquaculture areas [
17]. However, these methods generally overlook the multi-scale characteristics of aquaculture areas, leading to the loss of critical features at small and medium scales as the network depth increases. Current DL models struggle to fully capture the features of aquaculture areas, particularly those with similar spacing, due to the reliance on outputs from limited network layers.
In order to overcome these limitations, this study introduces SwinNet, a novel semantic segmentation model designed to enhance the extraction of aquaculture areas in high-resolution remote sensing images, focusing on the Maowei Sea in the Beibu Gulf area of China. SwinNet employs the Swin Transformer as its backbone, leveraging its ability to model global semantic information through a self-attention mechanism without traditional convolution and pooling operations [
18,
19]. The model incorporates a novel Parallel Pooling Attention Module (PPAM) to minimize background noise and emphasize essential aquaculture areas. Furthermore, a multi-scale feature decoder merges high-level semantic details with multi-scale features, improving segmentation accuracy [
20,
21]. By addressing the shortcomings of traditional methods and existing DL models, SwinNet aims to provide a robust and accurate solution for the large-scale, high-precision monitoring of marine aquaculture targets. This model holds significant potential for enhancing the management and conservation of coastal aquaculture resources, particularly in the Maowei Sea region of the Beibu Gulf [
1,
2,
9,
22,
23,
24].
The rest of the paper is organized into seven sections. The second section introduces the previous works related to the proposed method, and the third section lists the materials used in this study, including the study region and the data used. The fourth section demonstrates the proposed SwinNet for aquaculture area extraction and compares it with the related works. In the fifth part, the experiments and results are presented. Discussions will be given in the sixth Section, and finally a conclusion will be drawn.
2. Related Work
In previous works, a Full Convolutional Neural Network (FCN) is regarded as a milestone of deep learning in the field of image segmentation [
21]. FCN solves the pixel-level image segmentation problem by replacing the fully connected layer with a convolutional layer. Another representative approach is UNet [
25], which fuses the different scale features of the encoding phase corresponding to the decoding phase, thus obtaining rich contextual and spatial location information [
25]. The DeepLab family of algorithms has further advanced the field of semantic segmentation [
26,
27,
28,
29]. In particular, DeepLab V3+ [
29] not only uses the Atrous Spatial Pyramid Pooling (ASPP) module to capture the target information and its contextual information from multiple scales but also introduces Depthwise Separable Convolution (DSConv) into the encoder, which effectively reduces the number of parameters in the model and the amount of computation [
29]. In addition, for the receptor field limitation problem caused by the fixed size of the convolutional kernel, KNet improves the segmentation accuracy by applying the unification of instance segmentation and semantic segmentation through a set of learnable convolutional kernel parameters [
30].
The detailed information in the shallow output is particularly important for the accurate segmentation of small-scale targets. Nevertheless, the CNN-based FCN variant models only focus on the output of the deeper parts of the network for semantic segmentation without taking full advantage of the multi-scale features. In target detection, Feature Pyramid Networks (FPN) is an important multi-scale feature fusion strategy that is often used to capture small-scale targets [
20]. Similarly, FPNs have powerful multi-scale feature fusion capabilities for semantic segmentation. For example, Kirillov et al. expanded the resolution of each layer of the FPN’s feature map through operations such as up-sampling and bilinear interpolation and fused them into a final feature map for segmentation, which effectively improved the segmentation of small-scale targets [
31]. Since the scale of aquaculture areas is much smaller than the land region, in order to improve the accuracy of segmentation in remote sensing imagery, a multi-scale feature fusion decoder is designed in this paper to retain more feature channels in the FPN and utilize the ASPP (DSConvASPP) module with depth-separable convolution to denoise the fused feature maps.
It is generally recognized that the Transformer scheme has achieved great success in the field of natural language processing and gained popularity in tasks such as image classification, target detection, and semantic segmentation due to its excellent sequence modeling capabilities and global information perception [
32]. VIT was demonstrated as the first Transformer structure for the task of image classification [
33]. Later, Zheng et al. proposed a SEgmentation TRansformer (SETR), which introduced semantic segmentation as a sequence-to-sequence prediction task [
34]. In the following effort, Segmenter uses VIT as an encoder for feature encoding and applies Mask Transformer to decode the output of the encoder and class embedding vectors [
35]. In contrast, SegFormer [
36] was introduced with Mix Transformers to extract and fuse multiscale features through an MLP decoder, to achieve a combination of local and global attention [
36].
Despite all the performance of the VIT, only single-scale and low-resolution feature maps can be obtained and it is generally computationally expensive. In order to extract the rich multi-scale features of aquaculture areas in the remote sensing imagery, Swin Transformer has drawn researchers’ attention. In this research, the Swin Transformer is used as the backbone network, with a hierarchical pyramid structure of CNN to effectively reduce the model complexity and computation cost [
8].
In this study, the existing limitations in the field of semantic segmentation are addressed, particularly focusing on the application of CNNs such as the FCN, UNet, and the DeepLab algorithmic suite. While these methods have notably advanced segmentation accuracy and target recognition efficiency—especially through innovations in handling multi-scale features and reducing model parameters—significant research gaps remain, particularly in the context of remote sensing imagery and the segmentation of aquaculture areas. These gaps include:
- (1)
Accurate segmentation of small-scale targets: Despite advancements in multi-scale feature fusion strategies such as FPNs, challenges persist in the segmentation of very small-scale targets. This is especially pertinent in specialized application scenarios, like aquaculture area segmentation in remote sensing imagery, where the scale of interest significantly differs from larger terrestrial regions, necessitating enhanced feature capture capabilities.
- (2)
Effective fusion of deep and shallow features in UNet: Current methodologies tend to emphasize the output of deeper network layers for semantic segmentation. This approach often overlooks the potential of shallow layer features, which contain rich detail information critical for the accurate recognition of small-scale targets.
- (3)
Balancing computational efficiency and accuracy in DeepLab models: Although the introduction of depthwise separable convolution in DeepLab V3+ has reduced model parameters and computational requirements, further optimization is needed. Enhancing model efficiency, while maintaining or improving accuracy for resource-constrained scenarios, remains an essential research direction.
By addressing these gaps, this study aims to enhance semantic segmentation in terms of accuracy, efficiency, generalization, and robustness through targeted innovations.
3. Materials
3.1. Study Region
Located in Guangxi, China (21.5° N, 109.1° E), the Maowei Sea exemplifies ideal conditions for sustainable oyster farming as advocated by FAO such as clear water, moderate salinity, and rich plankton to support rapid oyster growth. The warm climate, with winter temperatures above 10 °C, summer temperatures between 28 and 30 °C, and annual rainfall around 1500 mm, is one of the most ideal marine ranches for oyster farming. According to the 2023 Statistical Review of World Food and Agriculture, Maowei Sea’s oyster production increased from 190,000 tons in 2010 to 310,000 tons in 2021. As the largest oyster breeding bay in Southwest China, the oyster density per square meter has also been increased to meet the market demand. The recent construction of the Pinglu Canal in Guangxi Province also brings new opportunities and challenges for marine aquaculture in the Maowei Sea.
Situated in the Beibu Gulf’s northern sector, the Maowei Sea encompasses approximately 135 km
2, marking it as the Guangxi Zhuang Autonomous Region’s sole marine park within China’s expansive South China Sea. This region, teeming with plankton, serves as one of China’s key aquaculture hubs [
37]. For the communities lining the Maowei Sea, aquaculture stands as a pivotal economic pillar. However, the sector is currently navigating through a multitude of challenges, prompted by rapid economic growth [
38,
39,
40]. These hurdles are fast becoming critical impediments to the region’s sustainable economic progression. A notable concern is the practice of near-shore aquaculture, particularly the dense cultivation of oysters, which now surpasses the area’s carrying capacity. This intensive farming has inflicted significant harm on marine biodiversity, impairing the sea’s natural purification processes, and leading to riverbed elevation and potential waterway blockages [
38,
39]. Moreover, discarded aquaculture plastics further exacerbate marine pollution, endangering local flora and fauna. The current approach to aquaculture management in the Qinzhou city area relies on a cumbersome system of community feedback and hierarchical reporting. Given the aquaculture’s extensive scope, this method is not only inefficient but also susceptible to inaccuracies and underreporting. This backdrop underscores the urgent need for a more effective technique to delineate oyster farming zones, thereby enhancing the stewardship of Maowei Sea’s aquaculture assets.
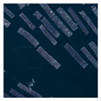
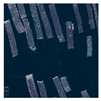
The sample data for this study were obtained from the Maowei Sea waters near Qinzhou City, Guangxi Province in China, using Google Earth high-resolution remote sensing imagery data taken on 5 November 2019. The remote sensing imagery contains three channels of RGB WorldView 2 with a spatial resolution of 0.593 m as shown in
Figure 1A.
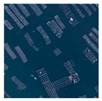
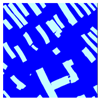
Figure 1 illustrates a detailed view of the aquaculture landscape in a part of the area with geographic coordinates of 108°32′ E and 21°47′ N (
Figure 1B(a)). There are two main types of aquacultures in the Maowei Sea waters such as raft culture and cage culture, respectively. Raft culture (
Figure 1B(b)) employs floating rafts equipped with supports and ropes, identifiable by sporadic luminous markers along their peripheries, presenting as dark, cohesive rectangles from above. Cage culture (
Figure 1B(c)), alternatively, utilizes natural materials like bamboo and wood, forming structures of varying shapes marked by distinct grid patterns, indicative of small enclosures used for marine cultivation.
3.2. Experimental Data
The dataset for this study, pivotal in training a model for remote sensing imagery segmentation specifically for aquaculture area identification, is constructed on the backbone of meticulously selected principles aimed at maximizing its effectiveness. These guiding principles—sample representation, accurate labeling, flexibility, discrimination, and computational feasibility—are integral for the precise and efficient analysis of the Maowei Sea’s aquaculture environments. Ensuring comprehensive representation, the dataset includes a wide array of aquaculture practices across different seasons and tidal conditions to capture environmental variabilities, enhancing the robustness of the model. Accurate labeling, performed with expert precision, defines the aquaculture areas, setting a clear ground truth essential for the model’s learning accuracy. Designed to be flexible, the dataset accommodates future changes in aquaculture practices and environmental shifts, maintaining its relevance. Discriminative capability is heightened by including distinct features that separate aquaculture zones from non-aquaculture areas, thus minimizing false positives and bolstering segmentation accuracy. Lastly, computational feasibility is carefully balanced against data quality and complexity, ensuring the dataset enriches the model’s training without imposing prohibitive computational demands. This holistic approach not only facilitates effective remote sensing imagery segmentation but also contributes significantly to the sustainable management and ecological conservation of aquaculture practices in the Maowei Sea, illustrating a commitment to both technological advancement and environmental stewardship.
3.2.1. Dataset Selection and Labeling
In recognition of the necessity for a dataset that accurately reflects the diverse environmental characteristics of aquaculture areas within the Maowei Sea, our selection focused on the imagery from Longmen Harbor and Fortress Point of the Beibu Gulf. This selection strategy was guided by the aim to encompass a wide distribution of aquaculture zones, thereby enhancing the dataset’s representativeness and diversity. Such diversity is crucial for improving the model’s generalization capabilities, enabling it to perform reliably across large-scale remote sensing imagery segmentation tasks. In order to facilitate precise training and validation, we employed Labelme V4.5.7 an open-source data labeling software, for the meticulous labeling of each image within the dataset. This process involved categorizing the imagery into two principal classes: aquaculture areas and land. Concurrently, objects such as ships and sea surface floats, which do not belong to these categories, were labeled as complex backgrounds. This approach ensures in-class flexibility and out-of-class discrimination, critical for the model’s accuracy and robustness.
3.2.2. Data Transformation and Augmentation
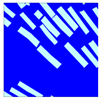
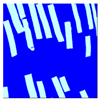
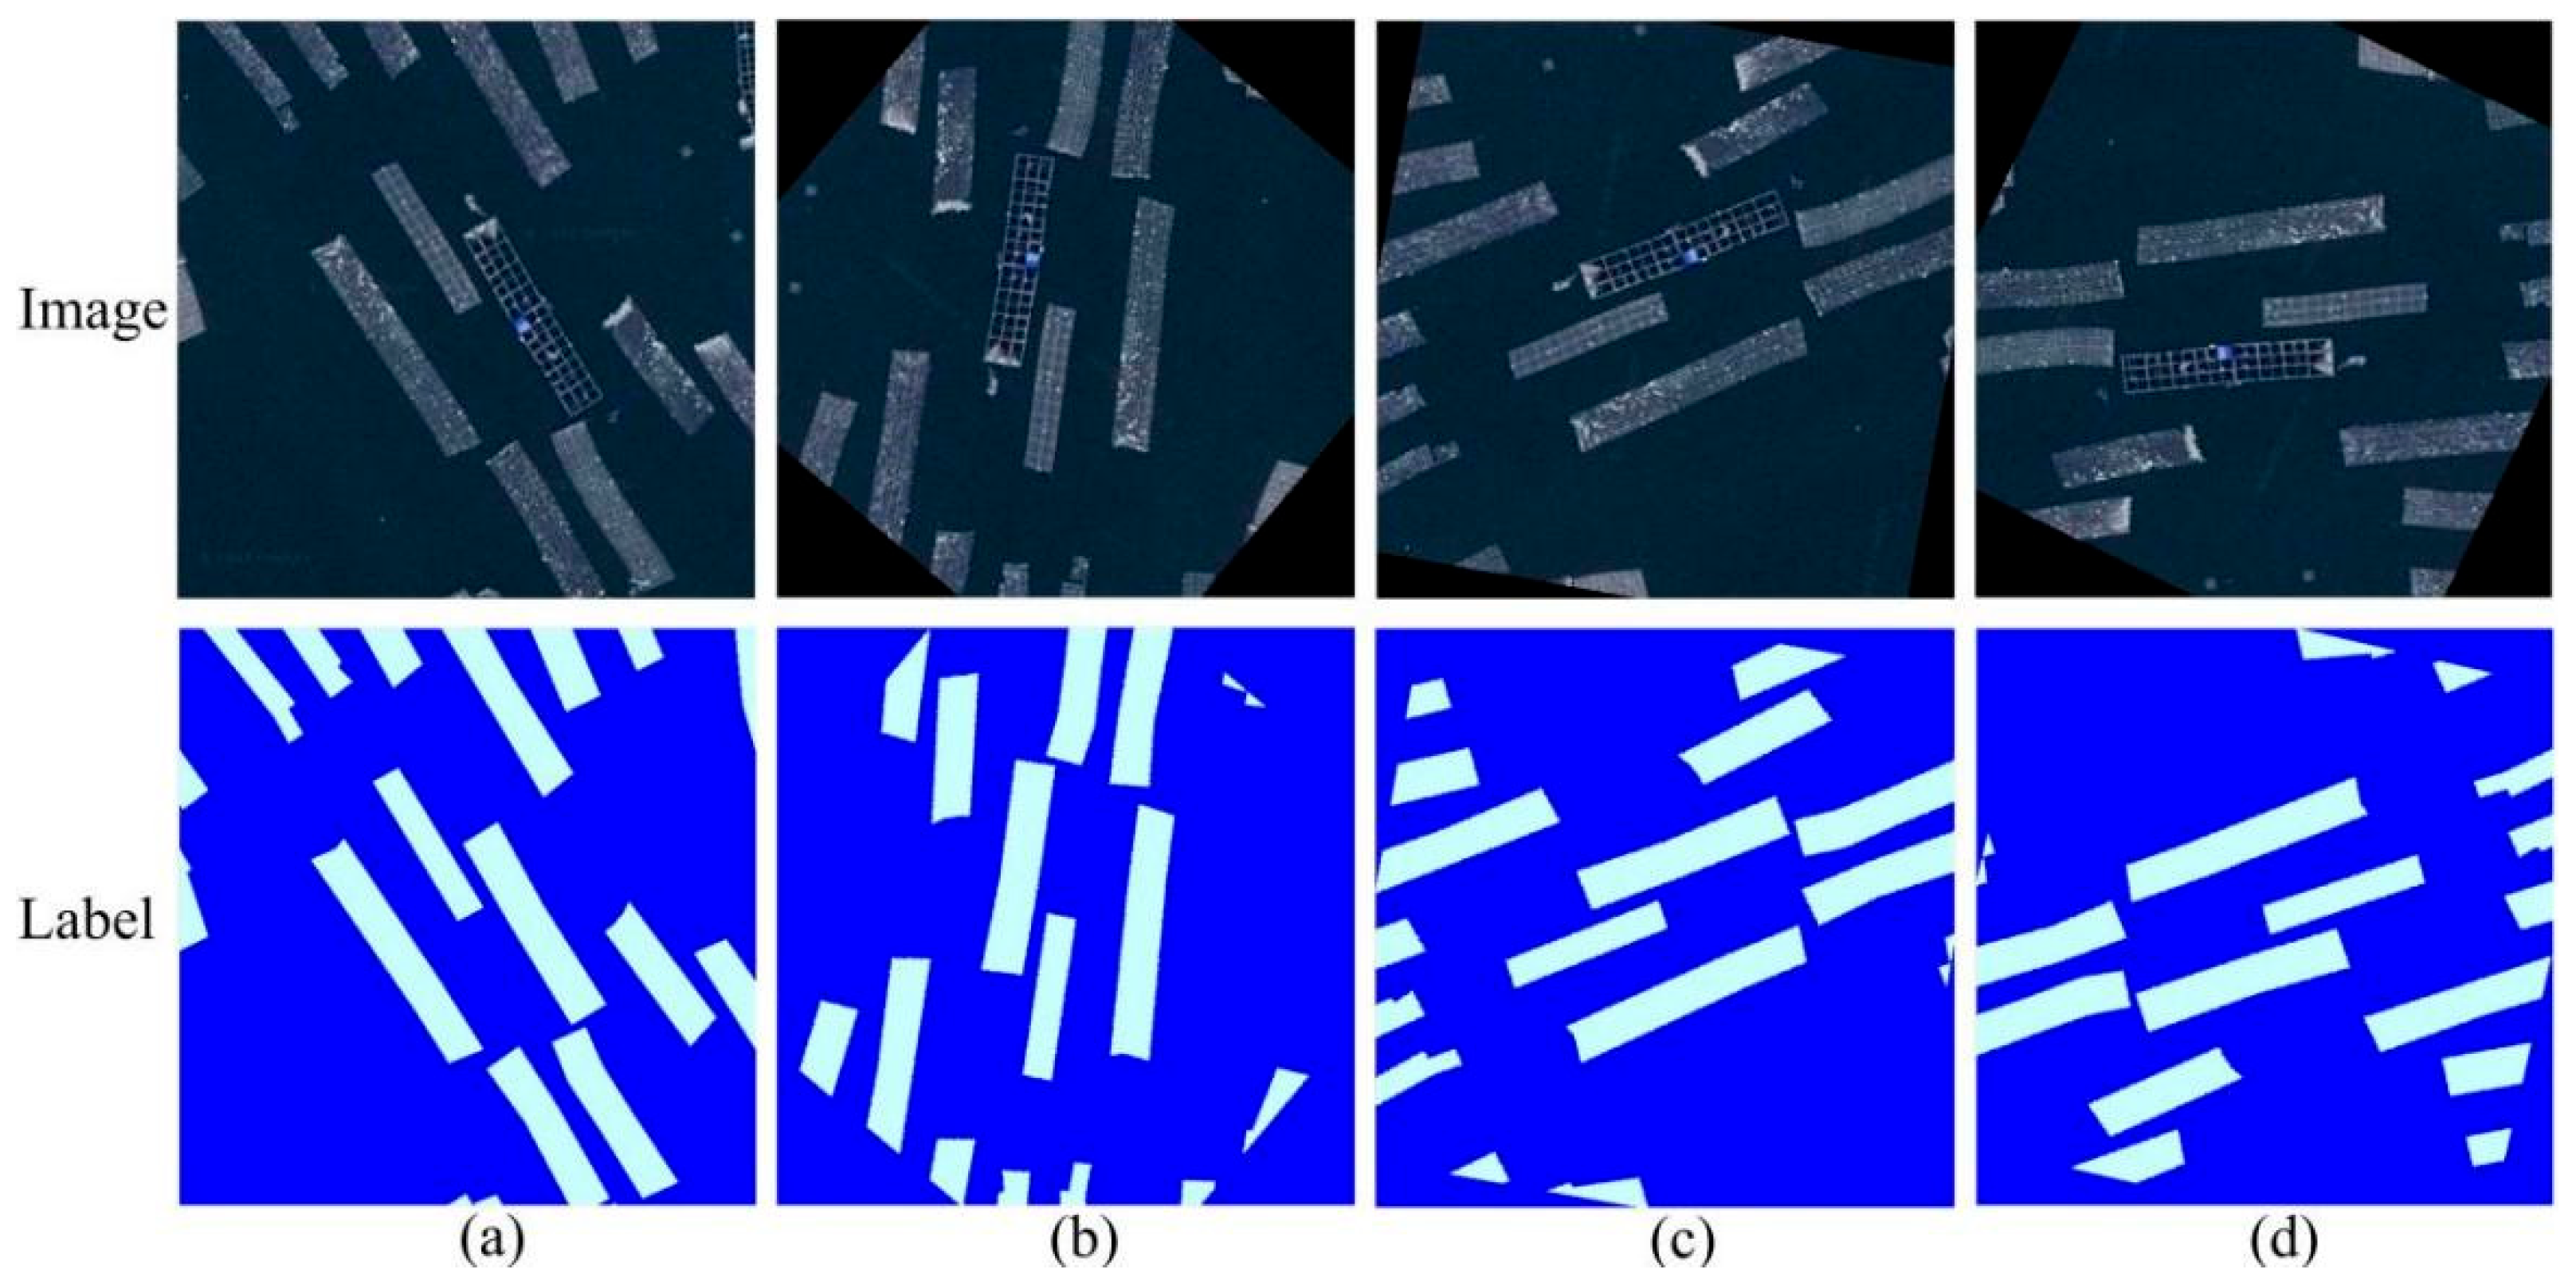
Acknowledging the challenges in acquiring extensive remote sensing imagery data, the collected dataset is relatively modest in size. However, to mitigate this limitation and enhance model performance, we adopted data augmentation techniques. Notably, we employed random rotation transformations on the sample images. This method allows for the extraction of aquaculture areas across various orientations and morphologies, significantly enriching the dataset. Examples of these transformations are illustrated in
Figure 2, showcasing the augmented variability introduced to the model training process.
3.2.3. Dataset Configuration and Evaluation
The dataset was strategically divided into training and validation sets, adhering to an 8:2 ratio [
41,
42]. This division is aimed at optimizing the training process while reserving a significant portion of the data for model validation and testing. In furtherance of a rigorous evaluation of the model’s generalization performance, half of the data within the validation set were designated as a test set.
Table 1 details the dataset’s configuration, including the sizes of the sample images and labeled maps, both before and after augmentation. This table also includes information on the distribution of samples across training, validation, and test sets, providing a comprehensive overview of the dataset’s structure.
Through meticulous adherence to the outlined principles of dataset creation and preparation, we have developed a resource that is not only representative of the Maowei Sea’s aquaculture landscapes but is also tailored to maximize the performance of our remote sensing imagery segmentation model. This careful preparation underscores the dataset’s suitability for the task at hand, ensuring that it meets the computational demands of modern processing equipment while accommodating the nuanced requirements of aquaculture area identification through remote sensing imagery analysis.
4. Methodology
4.1. The Proposed SwinNet: The Model Structure
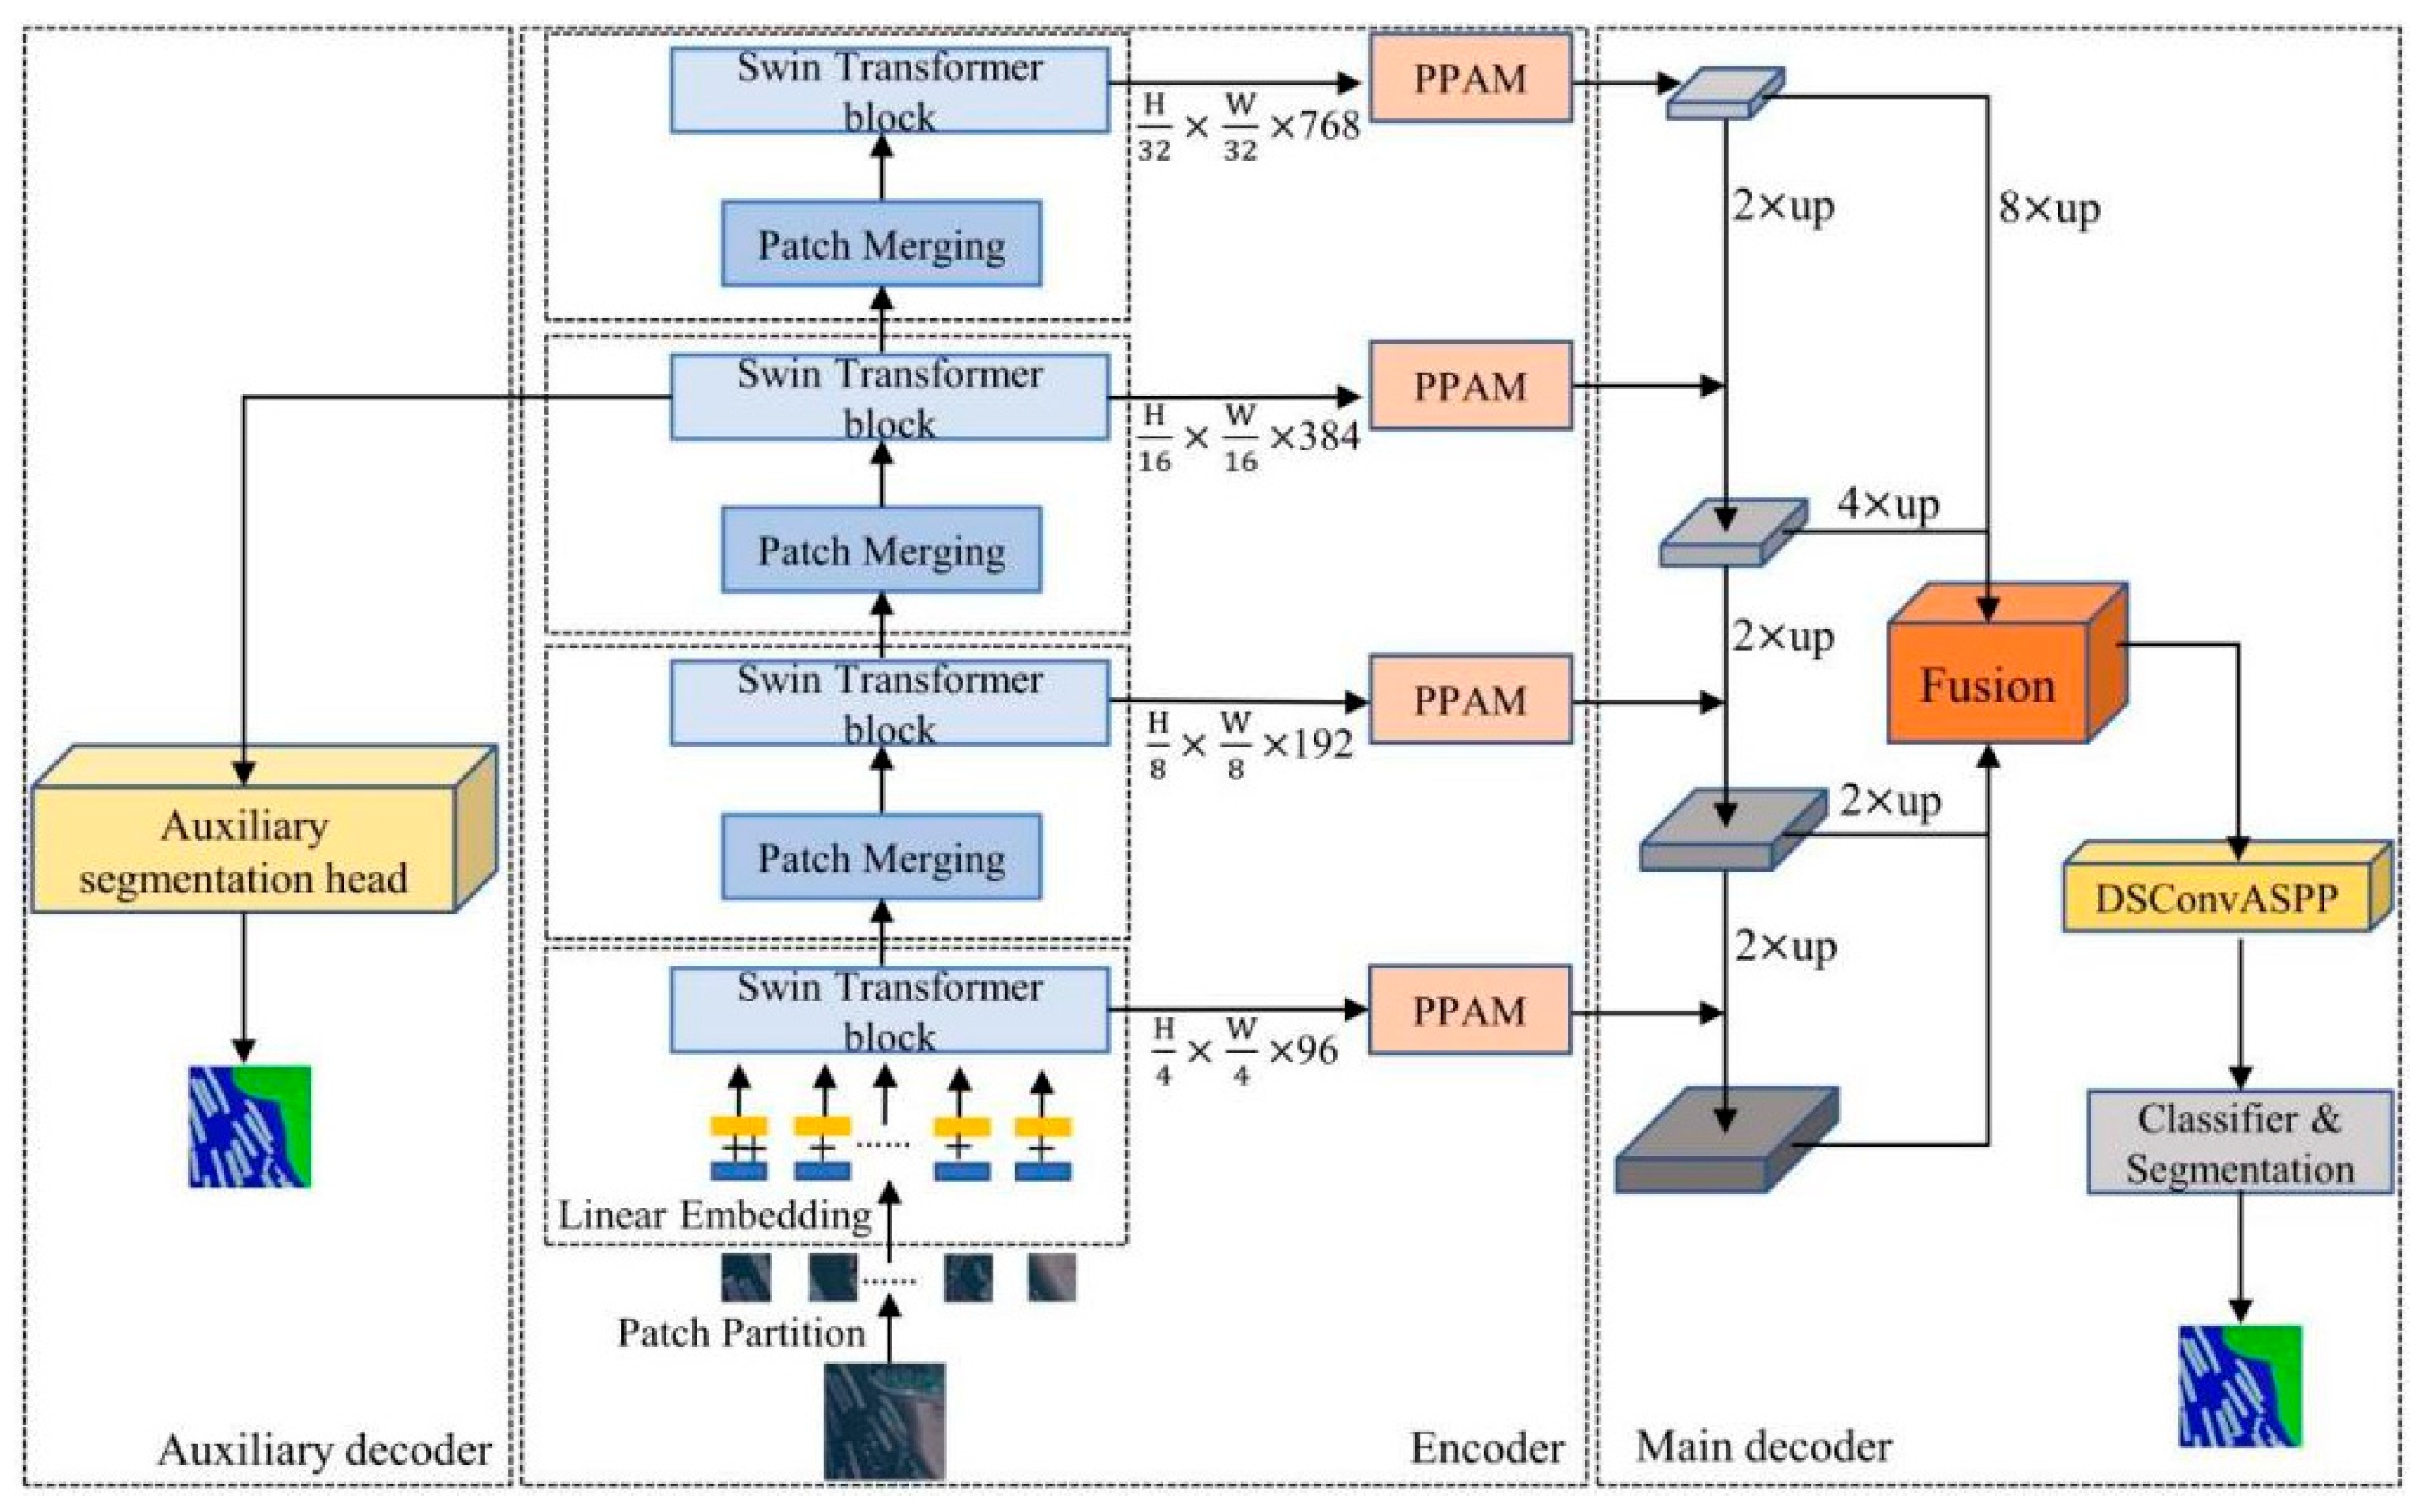
The multi-scale feature fusion-based semantic segmentation model SwinNet is shown in
Figure 3. There are three components in the proposed SwinNet structure, an attention-enhanced encoder based on Swin Transformer, a multi-scale feature fusion main decoder based on Feature Pyramid Network (FPN) and an auxiliary decoder based on residual structure. The Swin Transformer is used to extract multi-scale features from the input remote sensing imagery, and the Pooling Attention Module (PPAM) is used to draw the focus on aquatic regions in the global image and suppress the noise. The main decoder employs FPN for the fusion of multi-scale features to complement the detailed information of the aquaculture areas, where the DSConvASPP module is applied to eliminate the noise caused by the fusion operation. During the training stage, the auxiliary decoder utilizes the feature maps output by the encoder in phase 3 for segmentation, which does not require any computational cost during the deployment stage.
The combination of FPN and DSConvASPP significantly enhances the performance of semantic segmentation, particularly in noisy and complex backgrounds. The FPN structure fuses features from different levels to capture multi-scale information by constructing a pyramid. This approach maintains both global low-resolution features and detailed high-resolution features, thereby improving the recognition of small targets [
28,
43,
44]. DSConvASPP, on the other hand, uses Atrous convolution with varying sampling rates to capture multi-scale contextual information, expanding the receptive field without increasing computational complexity. This method comprehensively considers context information at multiple scales, enhancing segmentation accuracy and background noise suppression [
28,
43,
44]. By applying DSConvASPP after the FPN, the multi-scale context information in multi-level feature maps is further extracted, fully utilizing multi-scale features and context information to improve robustness and segmentation accuracy in complex and noisy environments.
4.2. Attention Enhanced Encoder Based on Swin Transformer and PPAM
The attention-enhanced encoder is comprised of four Swin Transformers and PPAMs, respectively, for the benefit of interference noise reduction in the remote sensing imagery [
45]. The backbone network in the encoder with Swin Transformers extracts multi-scale features from the input remote sensing imagery, and then the PPAMs perform feature filtering to enhance the weight of the target area and suppress the background and interference noise.
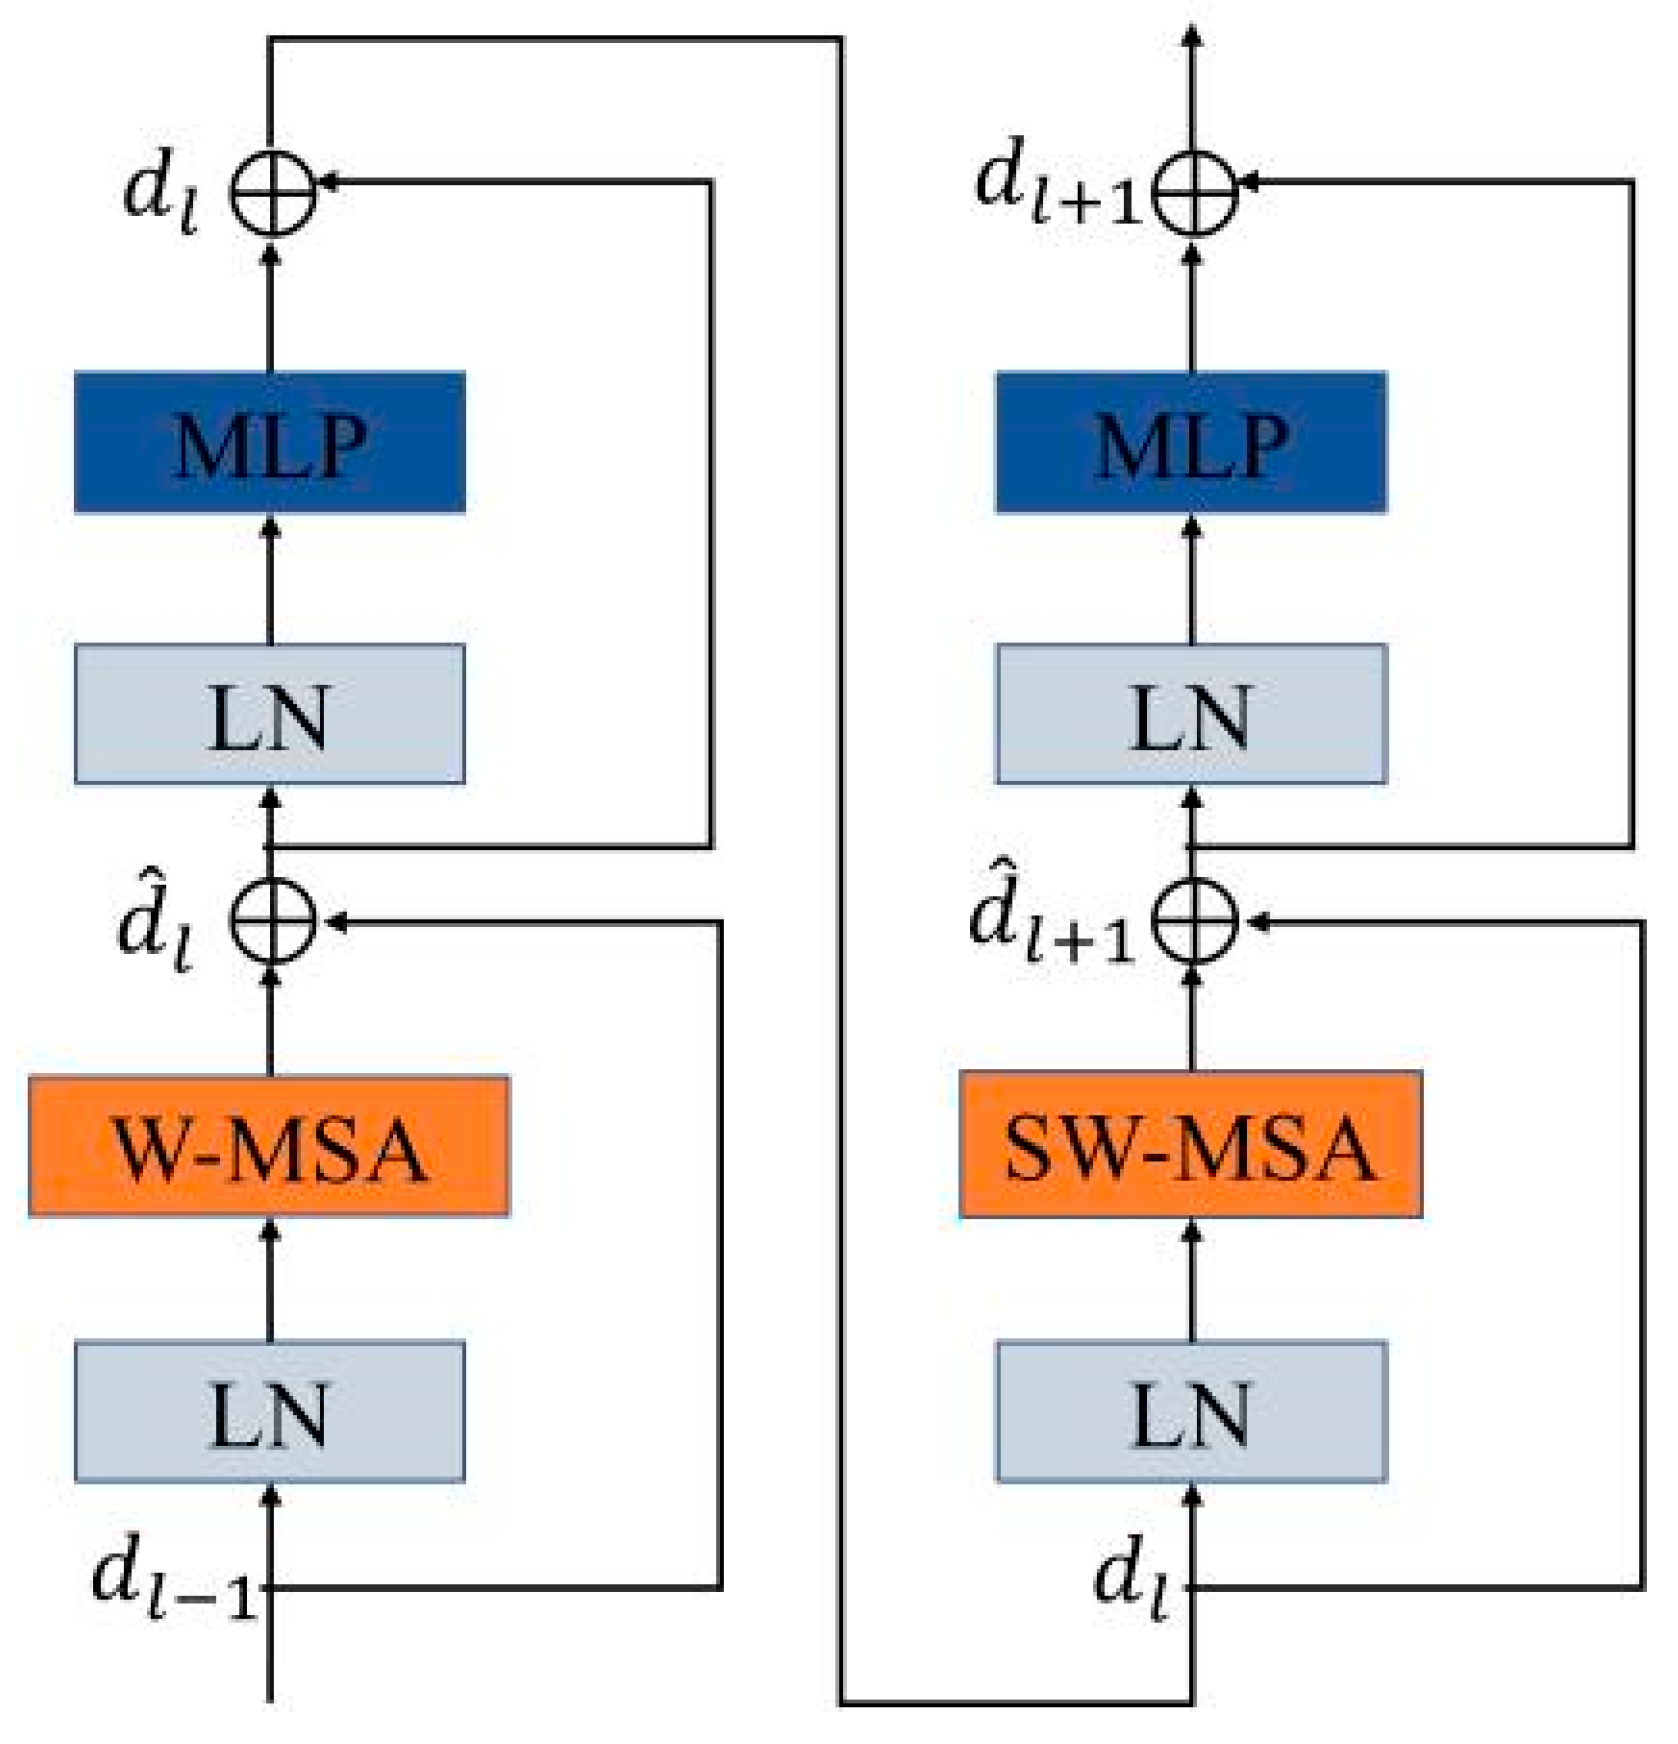
Figure 4 shows the detailed structure of the Swin Transformer Block containing the combination operations of Window Multi-heads Self-Attention (W-MSA) [
46] and Shifted Window Multi-Head Self-Attention (SW-MSA) [
47] in which the neighboring windows of filtering can interact with each other. Instead of applying convolution operation like the DCNN, Swin Transformer divides the input image into 4 × 4 fixed-size, non-overlapping blocks, and maps the image blocks into embedding vectors by Linear Embedding operation before extracting the vector features by using the self-attention mechanism. A patch merging operation is used without the pooling layer for window feature mapping and in this way, information loss can be avoided in the Swin Transformer. The feature maps with multiple scale resolutions are then output from the Swin Transformer.
The self-attention process is given in Equations (1)–(4) such that,
where
and
denote the features obtained from the W-MSA (SW-MSA) and the MLP in the
(
+ 1) module, respectively.
represents the output of the feature from the
− 1 block.
In the attention-enhanced encoder, the PPAM module performs target region enhancement and noise reduction on the feature maps obtained from the four stages of Swin Transformer, which includes the average pooled attention branch and the maximum pooled attention branch. The structure of the PPAM is shown in
Figure 5.
Assuming that there is an input feature map Z with the height, width and channel number of H, W and C, respectively, the global average feature compression value vector Cafs and the global maximum feature value vector Cmfs corresponding to each channel in Z are given in Equations (5) and (6), respectively, such that,
where
denotes the value on the feature map representing the global sensory range of the corresponding channel, and Fafs and Fmfs are the global average pooling operation and the global tie pooling operation, respectively.
In the fully connected layer FC, the correlation between different channels based on the extracted global features is applied with a sigmoid activation function, and the weight vector of the feature map is generated to mark the importance of each channel. Equations (7) and (8) express the FC processing such that,
where
is the ReLU activation function,
is the Sigmoid activation function, and
∈
are the parameters of the first and second FC layers, respectively, and r is the compression factor of the channel, which is set to r = 16 in this experiment. The number of channel C is adjusted to
after the first FC layer and then restored after the second FC layer [
23]. Then the weight values of each channel are calculated with the Sigmoid function, and the final output of the encoder can be obtained such that,
where
represents the product operation which adjusts the importance of each feature channel in the original feature map according to the evaluation results of the two attention branches, so that the features of important targets can be enhanced and the background noise can be suppressed.
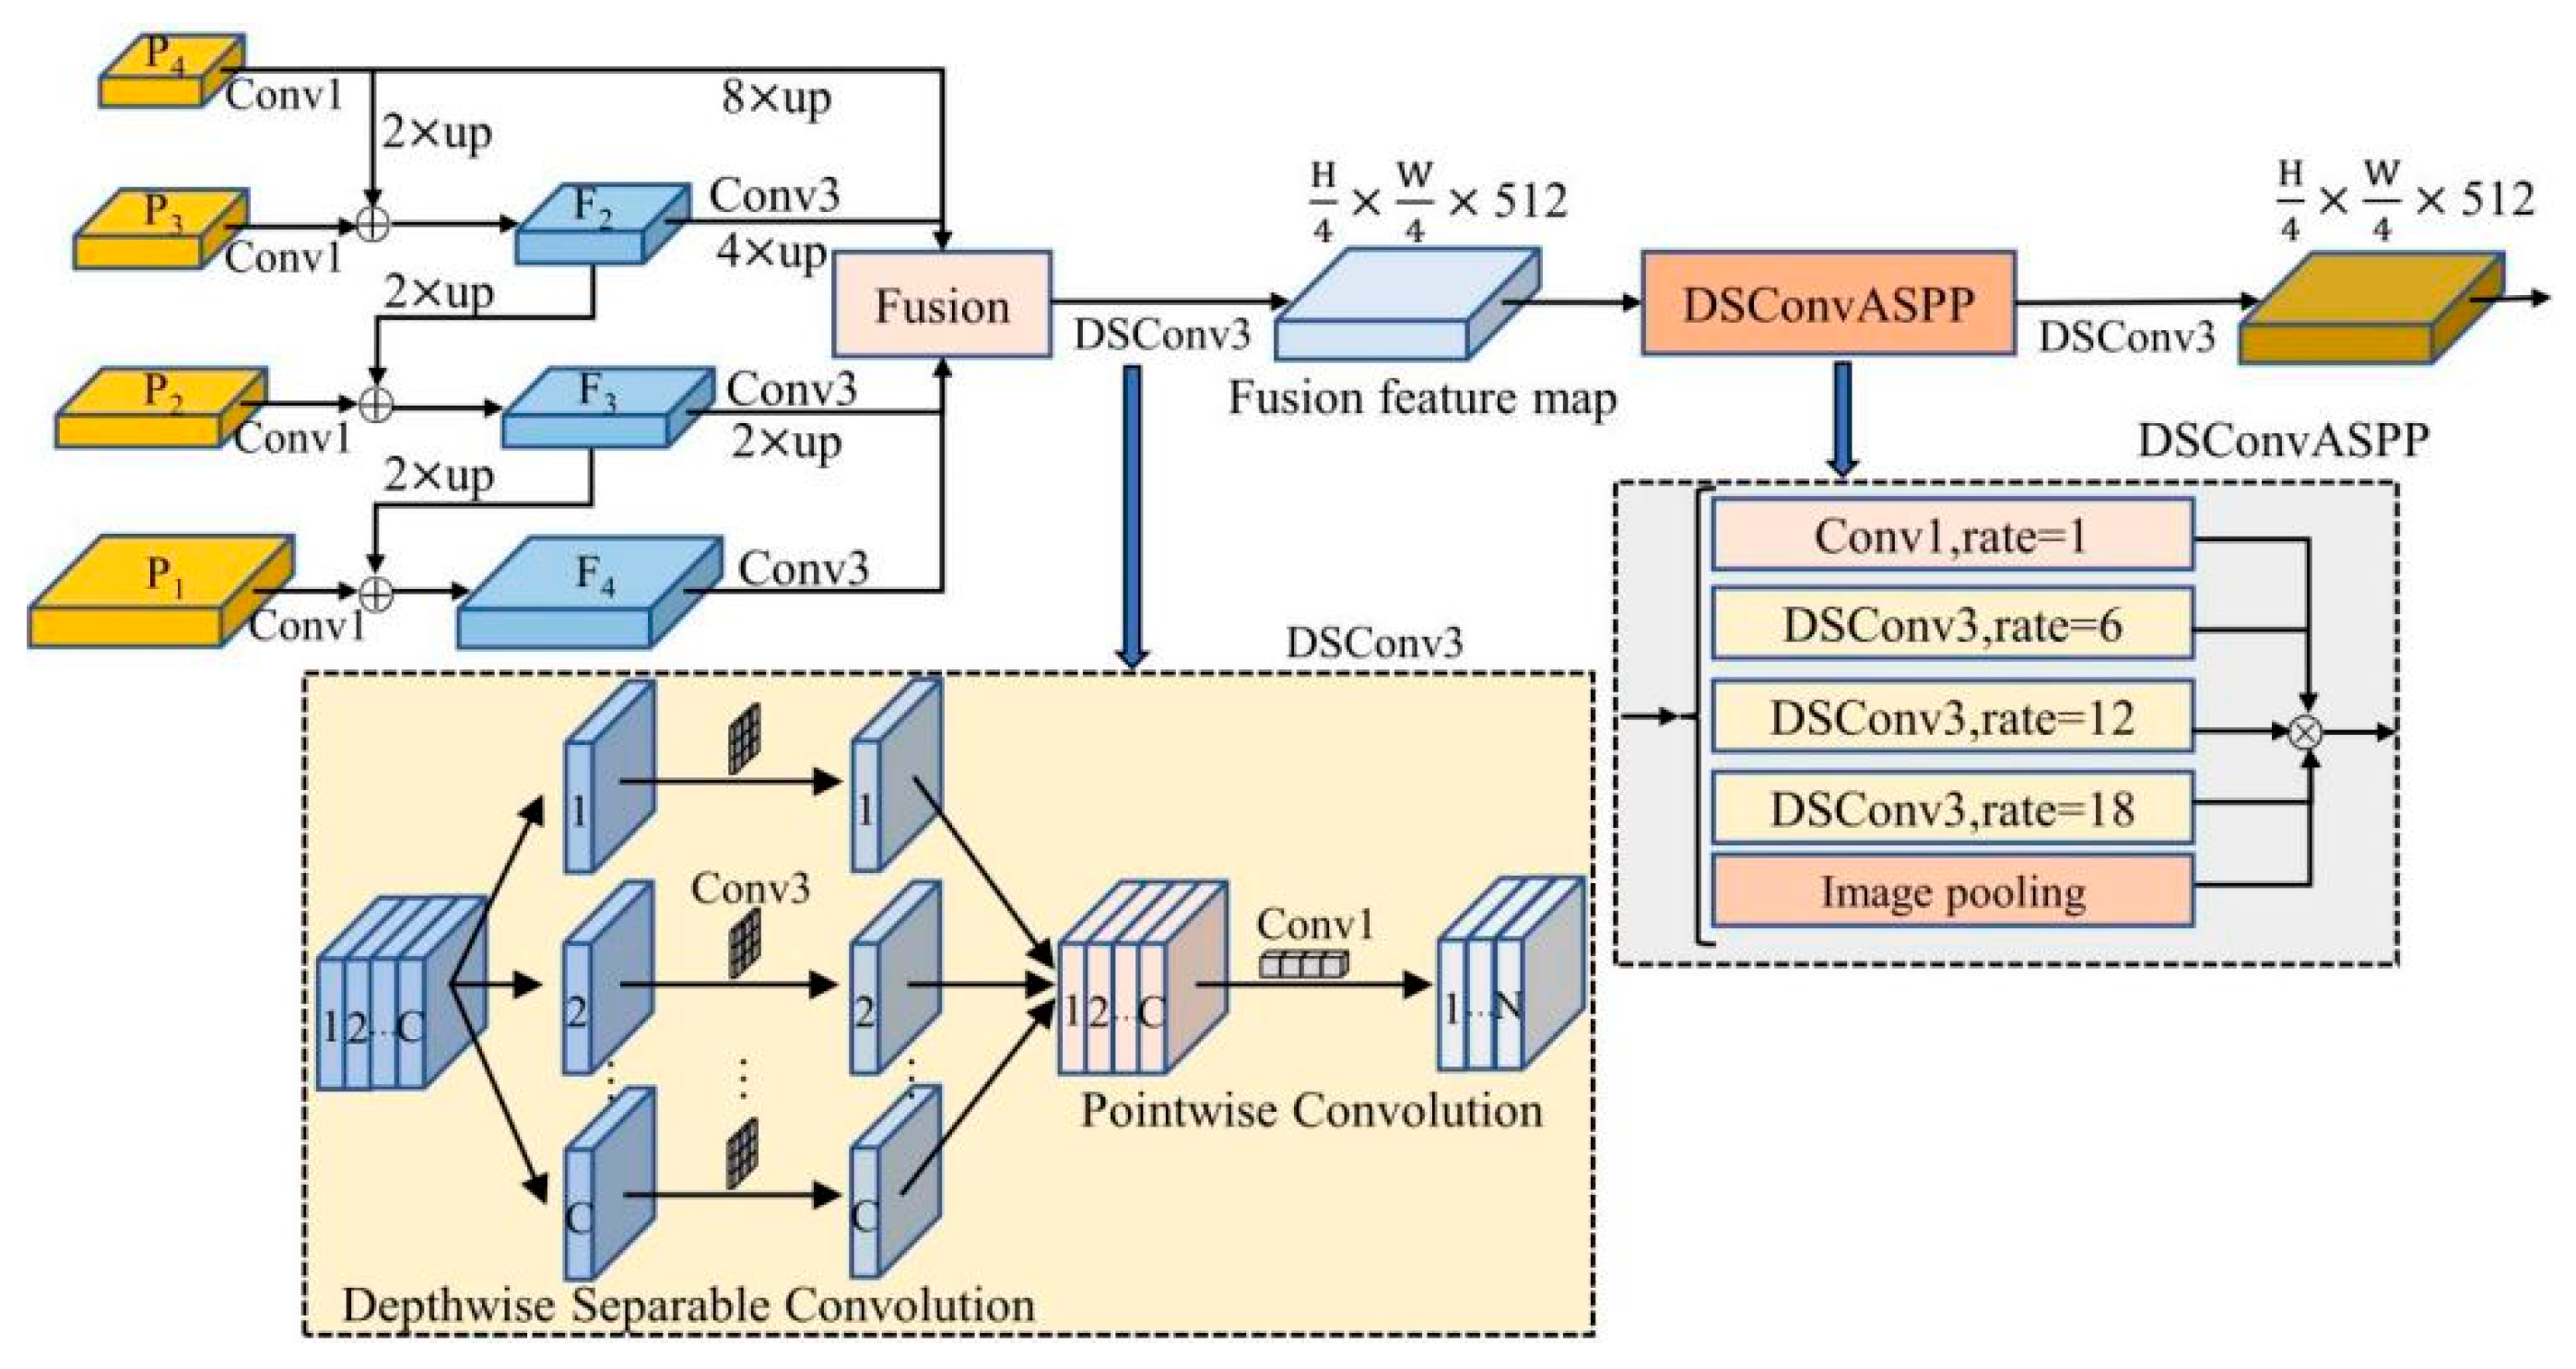
4.3. Main Decoder Based on FPN for Multi-Scale Feature Fusion
In order to address the problem of detail feature loss in aquaculture areas, a multi-scale feature fusion master decoder is designed in the SwinNet [
31], and
Figure 6 shows the structure of this encoder. The decoder utilizes FPN for the fusion of feature maps at different scales, and the denoising is performed by a null-space pyramid pooling (ASPP) module with Depthwise-Separable Convolution (DSConv) to improve the segmentation accuracy. DSConv is able to reduce the number of parameters and the computational effort in comparison to conventional convolution.
The input to the decoder is the multiscale features from the encoder such that P = {P1, P2, P3, P4}, with the resolutions of {1/4, 1/8, 1/16, 1/32} and the number of channels {96, 192, 384, 768} of the original input image, respectively. In the decoding process, the number of channels of P is firstly set to 512 using a 1 × 1 convolutional pair to achieve a fusion of features at different scales. Next, the low-resolution feature maps are up-sampled by a factor of 2 and summed element by element with the high-level feature maps to obtain F = {F2, F3, F4} through the top-down feature fusion channel. Then, the aliasing effect generated by element-by-element summation is eliminated by a 3 × 3 depth-separable convolution DSConv3. The outputs of each level of the FPN are fused with features at the upsampling rates of {8, 4, 2, 1}, respectively. The fused feature maps are then generated using a DSConv3 with a 3 × 3 depth-separable convolution kernel which includes Depthwise and Pointwise convolution, respectively, and the outputs of all the convolutions are stitched together.
The DSConvASPP module is designed to denoise the fused feature maps based on the ASPP module which contains one 1 × 1 convolution and three 3 × 3 depth-separable convolutions with expansion rates of 6, 12, and 18, respectively. The global context information is integrated into the feature map by pooling by recovering the sample after the average pooling operation. This process not only expands the sensory field of the network but also reduces the number of parameters and computational cost.
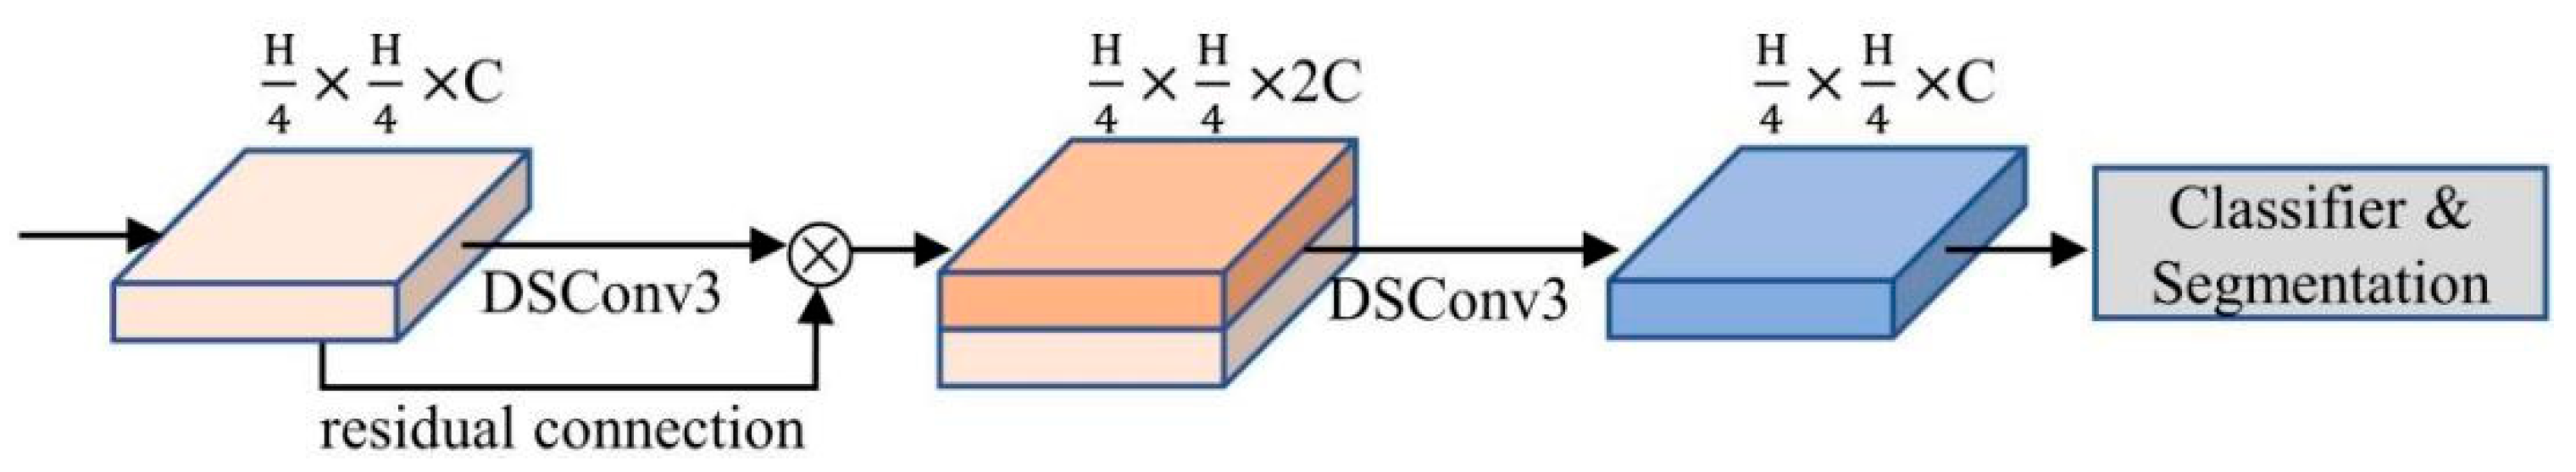
4.4. Auxiliary Decoder Based on Residual Connection
In the SwinNet, an auxiliary decoder based on residual linkage is designed to further improve the segmentation accuracy for aquaculture areas, and
Figure 7 shows the structure of the auxiliary decoder [
43,
48]. There are two DSConv3 processes in the auxiliary decoder with residual operation. The residual connection in this decoder transforms the feature channels by splicing before going through the DSConv3, in this way leading to the multiplexing of the features in the channel dimension [
49]. In practice, the auxiliary decoder helps to increase the gradient in the loss calculation during the training process and improve the model’s segmentation accuracy on the target, while it is not involved in the inference process.
4.5. The Loss Function
The purpose of this experiment is to perform semantic segmentation of the aquaculture areas in the remote sensing imagery and classify the oyster rafts, land, and background accordingly, and therefore the output of the proposed model is a predictive value image corresponding to the three categories. The output layer of SwinNet is activated with a Softmax function and uses cross entropy as the loss function. The final loss function includes the loss function of the main decoder and the loss function of the auxiliary decoder each of which is regularized, such that,
where
is the total loss function,
and
are the cross-entropy loss functions of the main decoder and the auxiliary decoder, respectively. α and β are the corresponding weighting factors and in this experiment α = 1.0, β = 0.4. N is the total number of samples, and (
i,
j) is the positional coordinates of the pixel.
{0, 1, 2} is the predicted value of the model for the location of (
i,
j). The notation of 0, 1, and 2 represent the background, aquaculture areas, and land, respectively, and
{0, 1} with 1 to be the true value of the label and 0 otherwise.
4.6. Evaluation Metrics
In this study, the metrics used to evaluate the segmentation performance of the proposed model include the Pixel Accuracy (PA), the mean PA (mPA), the Intersection over Union (IoU), the mean IoU (mIoU), Precision, Recall, F1-Score, and mean F1-Score (mF1), which are given, respectively, as,
where, it is assumed that the data contain a total of k + 1 categories (1 represents an extra class of the empty or background), TP denotes true positives, FP is false positives, TN represents true negatives and FN is false negatives. PA is the percentage of pixels correctly predicted by the model to the total number of pixels, and IoU denotes the ratio of intersection and concatenation between segmentation regions predicted by the model and the true segmentation regions, which is used to assess the degree of overlap of prediction results with the true labels. Precision is defined by the ratio of the number of pixel points correctly predicted by the model to the target number of pixel points to the total number of pixel points predicted as a target. The recall is the ratio of the total number of pixel points correctly predicted as a target by the model to the total number of pixel points that are true as a target, and F1-Score reflects the ability to recognize and differentiate between the target and the background. mPA, mIoU, and mF1 are the average values of PA, IoU, and F1 for all categories, respectively.
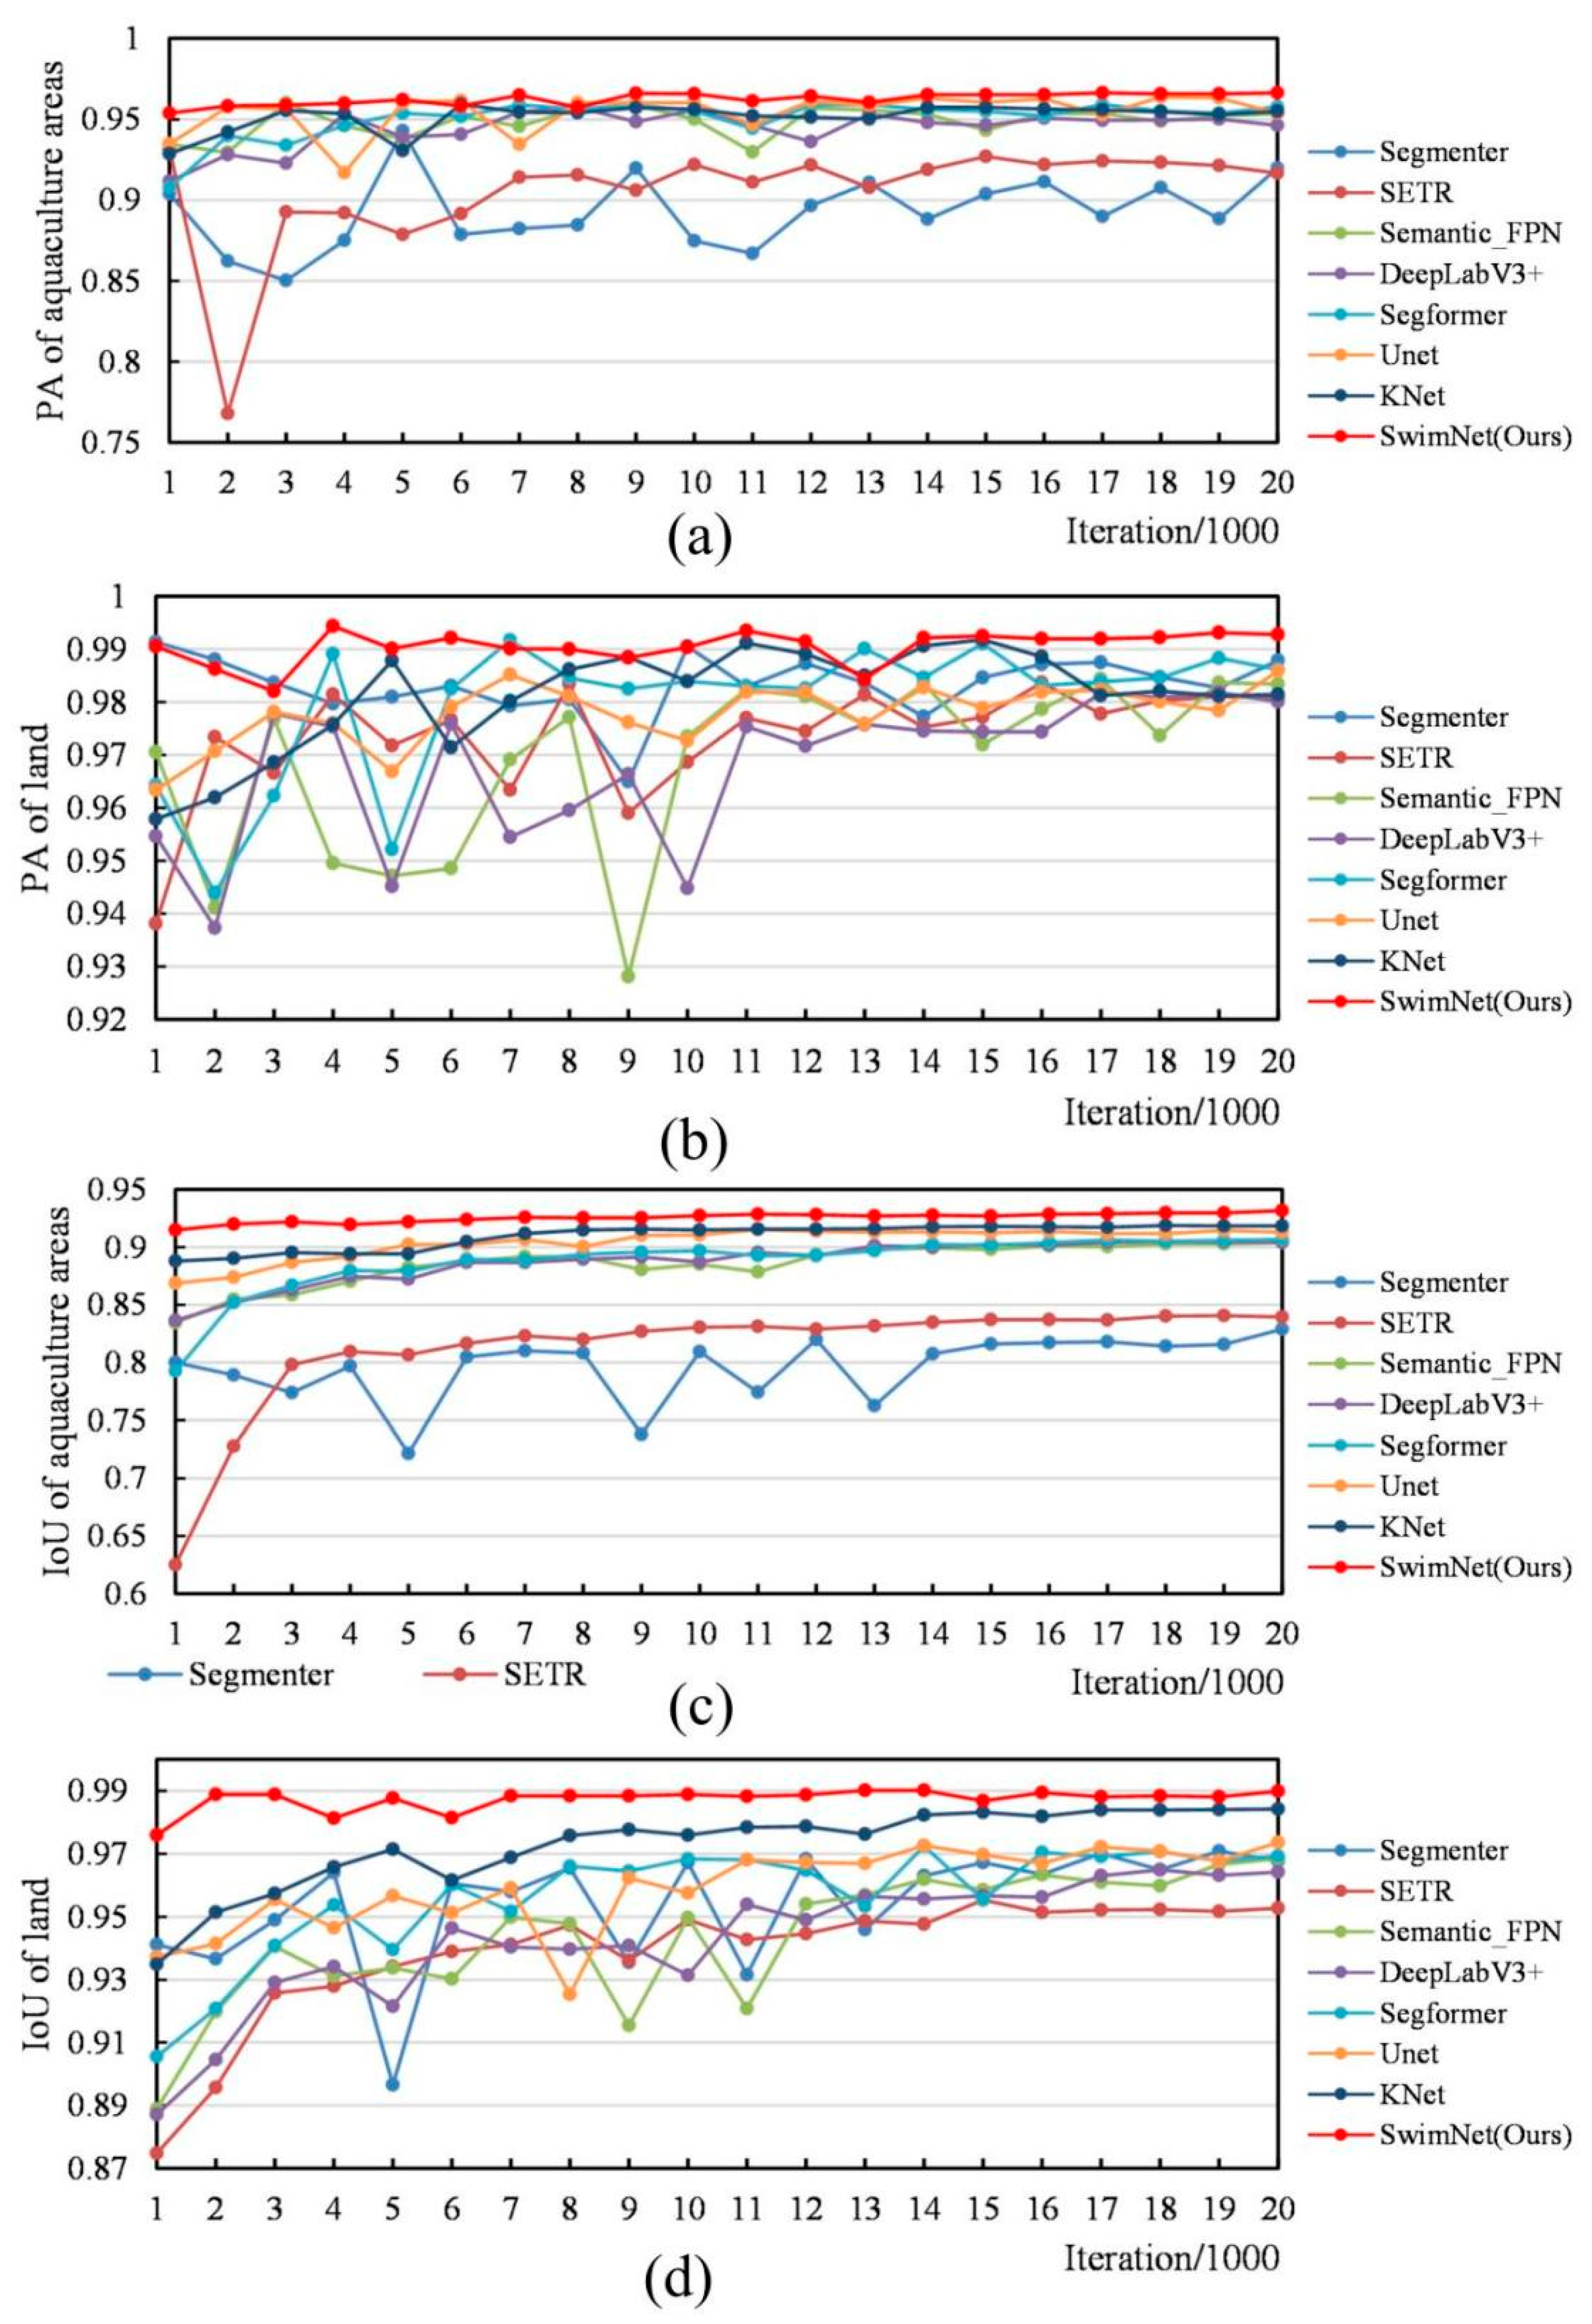
4.7. Comparison Experiment
In order to objectively evaluate the segmentation performance of the proposed SwinNet, some representative mainstream segmentation models are also tested on the aquaculture areas dataset, including the CNN-based methods such as UNet [
25], DeepLabV3+ [
29], Semantic_FPN [
31], KNet [
30,
32], SETR [
34], Segmenter [
35], SegFormer [
36] and other Transformer structure-based segmentation methods. The parameter configurations and environments are the same for all testing.
In order to rigorously validate the proposed SwinNet model’s effectiveness and superiority in the domain of remote sensing image segmentation, especially for aquaculture area delineation, this study undertakes a comprehensive comparative analysis against both CNN-based and Transformer-based algorithms. The CNN-based models selected for comparison include DeepLabV3+ [
29], renowned for its enhanced feature extraction through atrous convolution and adept handling of objects at various scales; UNet [
25], noted for its symmetric architecture that efficiently captures contextual information and achieves precise localization; Semantic FPN [
31], which utilizes a Feature Pyramid Network to integrate multi-scale features; and KNet [
30,
32], a recent advancement that introduces kernel predictors for dynamic convolution. Alongside these, Transformer-based algorithms such as SETR [
34], which pioneers the application of Transformers to semantic segmentation [
35]; Segmenter [
36], employing a Vision Transformer (ViT) as the encoder with a straightforward decoder; and SegFormer, combining a hierarchical Transformer encoder with a lightweight MLP decoder for a balance between accuracy and efficiency, are also analyzed for a holistic evaluation.
The proposed SwinNet leverages the Swin Transformer’s capabilities within a specialized network architecture designed for the efficient and precise segmentation of aquaculture areas in remote sensing imagery. By harnessing the hierarchical structure and shift window mechanism of the Swin Transformer, SwinNet excels in capturing both the global context and fine details essential for distinguishing aquaculture zones from complex backgrounds. This comparative study serves multiple purposes: benchmarking SwinNet’s performance to highlight its accuracy, efficiency, and adaptability; demonstrating its specific advantages over existing CNN-based and Transformer-based models in addressing the unique challenges of aquaculture area segmentation; and substantiating its superiority in terms of segmentation precision and generalization capabilities. Through this extensive analysis, we aim to provide a clear, evidence-based affirmation of SwinNet’s superior performance, underscoring its significant contribution to advancing the state-of-the-art in remote sensing image segmentation for aquaculture monitoring and showcasing its potential for widespread application in the remote sensing domain.
4.8. Training and Optimization
In this training process, the optimizer of AdamW is used for the optimization of the proposed model, which not only adapts to sparse gradients but also mitigates the gradient oscillation [
5,
19]. The Ploy dynamic learning rate adjustment strategy based on exponential transformation is applied and given in Equation (20) such that,
where the initial learning rate
is set to 0.0001,
ρ is set to 0.9, Iteration denotes the current training iteration batch, and
is set to 20,000 for the maximum number of iterations. The weight decay of this optimization is set to 0.0005.
The program of this experiment was implemented under the MMSegmentation (Pytorch 1.11.0, mmcv-full 1.7.1, Python 3.8) development framework, and the experimental environment was based on the Windows operating system running with an Intel(R) Xeon(R) Platinum 8255C (CPU) and an NVIDIA GeForce RTX 3090 (GPU) with 24 GB of video memory.
4.9. Aquaculture Areas Monitoring
In general, semantic segmentation achieves pixel-level classification with different semantic identifiers for remote sensing imagery to be segmented into regions. In this experiment, SwinNet is designed to semantically segment the remote sensing imagery of the Maowei Sea of Beibu Gulf, and by counting the total number of pixels classified as aquaculture area, the aquaculture farming scale can be calculated accurately. Combined with the spatial resolution of remote sensing imagery, the accurate estimation of aquaculture area can be obtained by Equations (21) and (22) such that,
where
is the total number of pixels classified as an aquaculture area. SR and SSR are the calibration constants representing the spatial resolution of the input image and the actual area of each pixel, respectively, and in this experiment SR = 0.593 m, SSR = 0.337417 m
2. S denotes the actual area of the aquaculture area. In addition, an error rate is also introduced to measure the estimation accuracy of the proposed model, which indicates the difference between the true value and the predicted value, such that,
where E is the error rate, and
represents the true value of the total number of pixels which belong to the aquaculture area. A small value of E means a higher prediction accuracy. In order to achieve this target, a dataset of aquaculture areas suitable for semantic segmentation using high-resolution remote sensing imagery of the Maowei Sea is created as training data, and then the trained SwinNet model to extract aquaculture areas from the remote sensing imagery and further count the area of aquaculture areas based on the segmentation results.
6. Discussion
6.1. Image Cuts and Small Drawings Are Labelled with Unique Identifiers
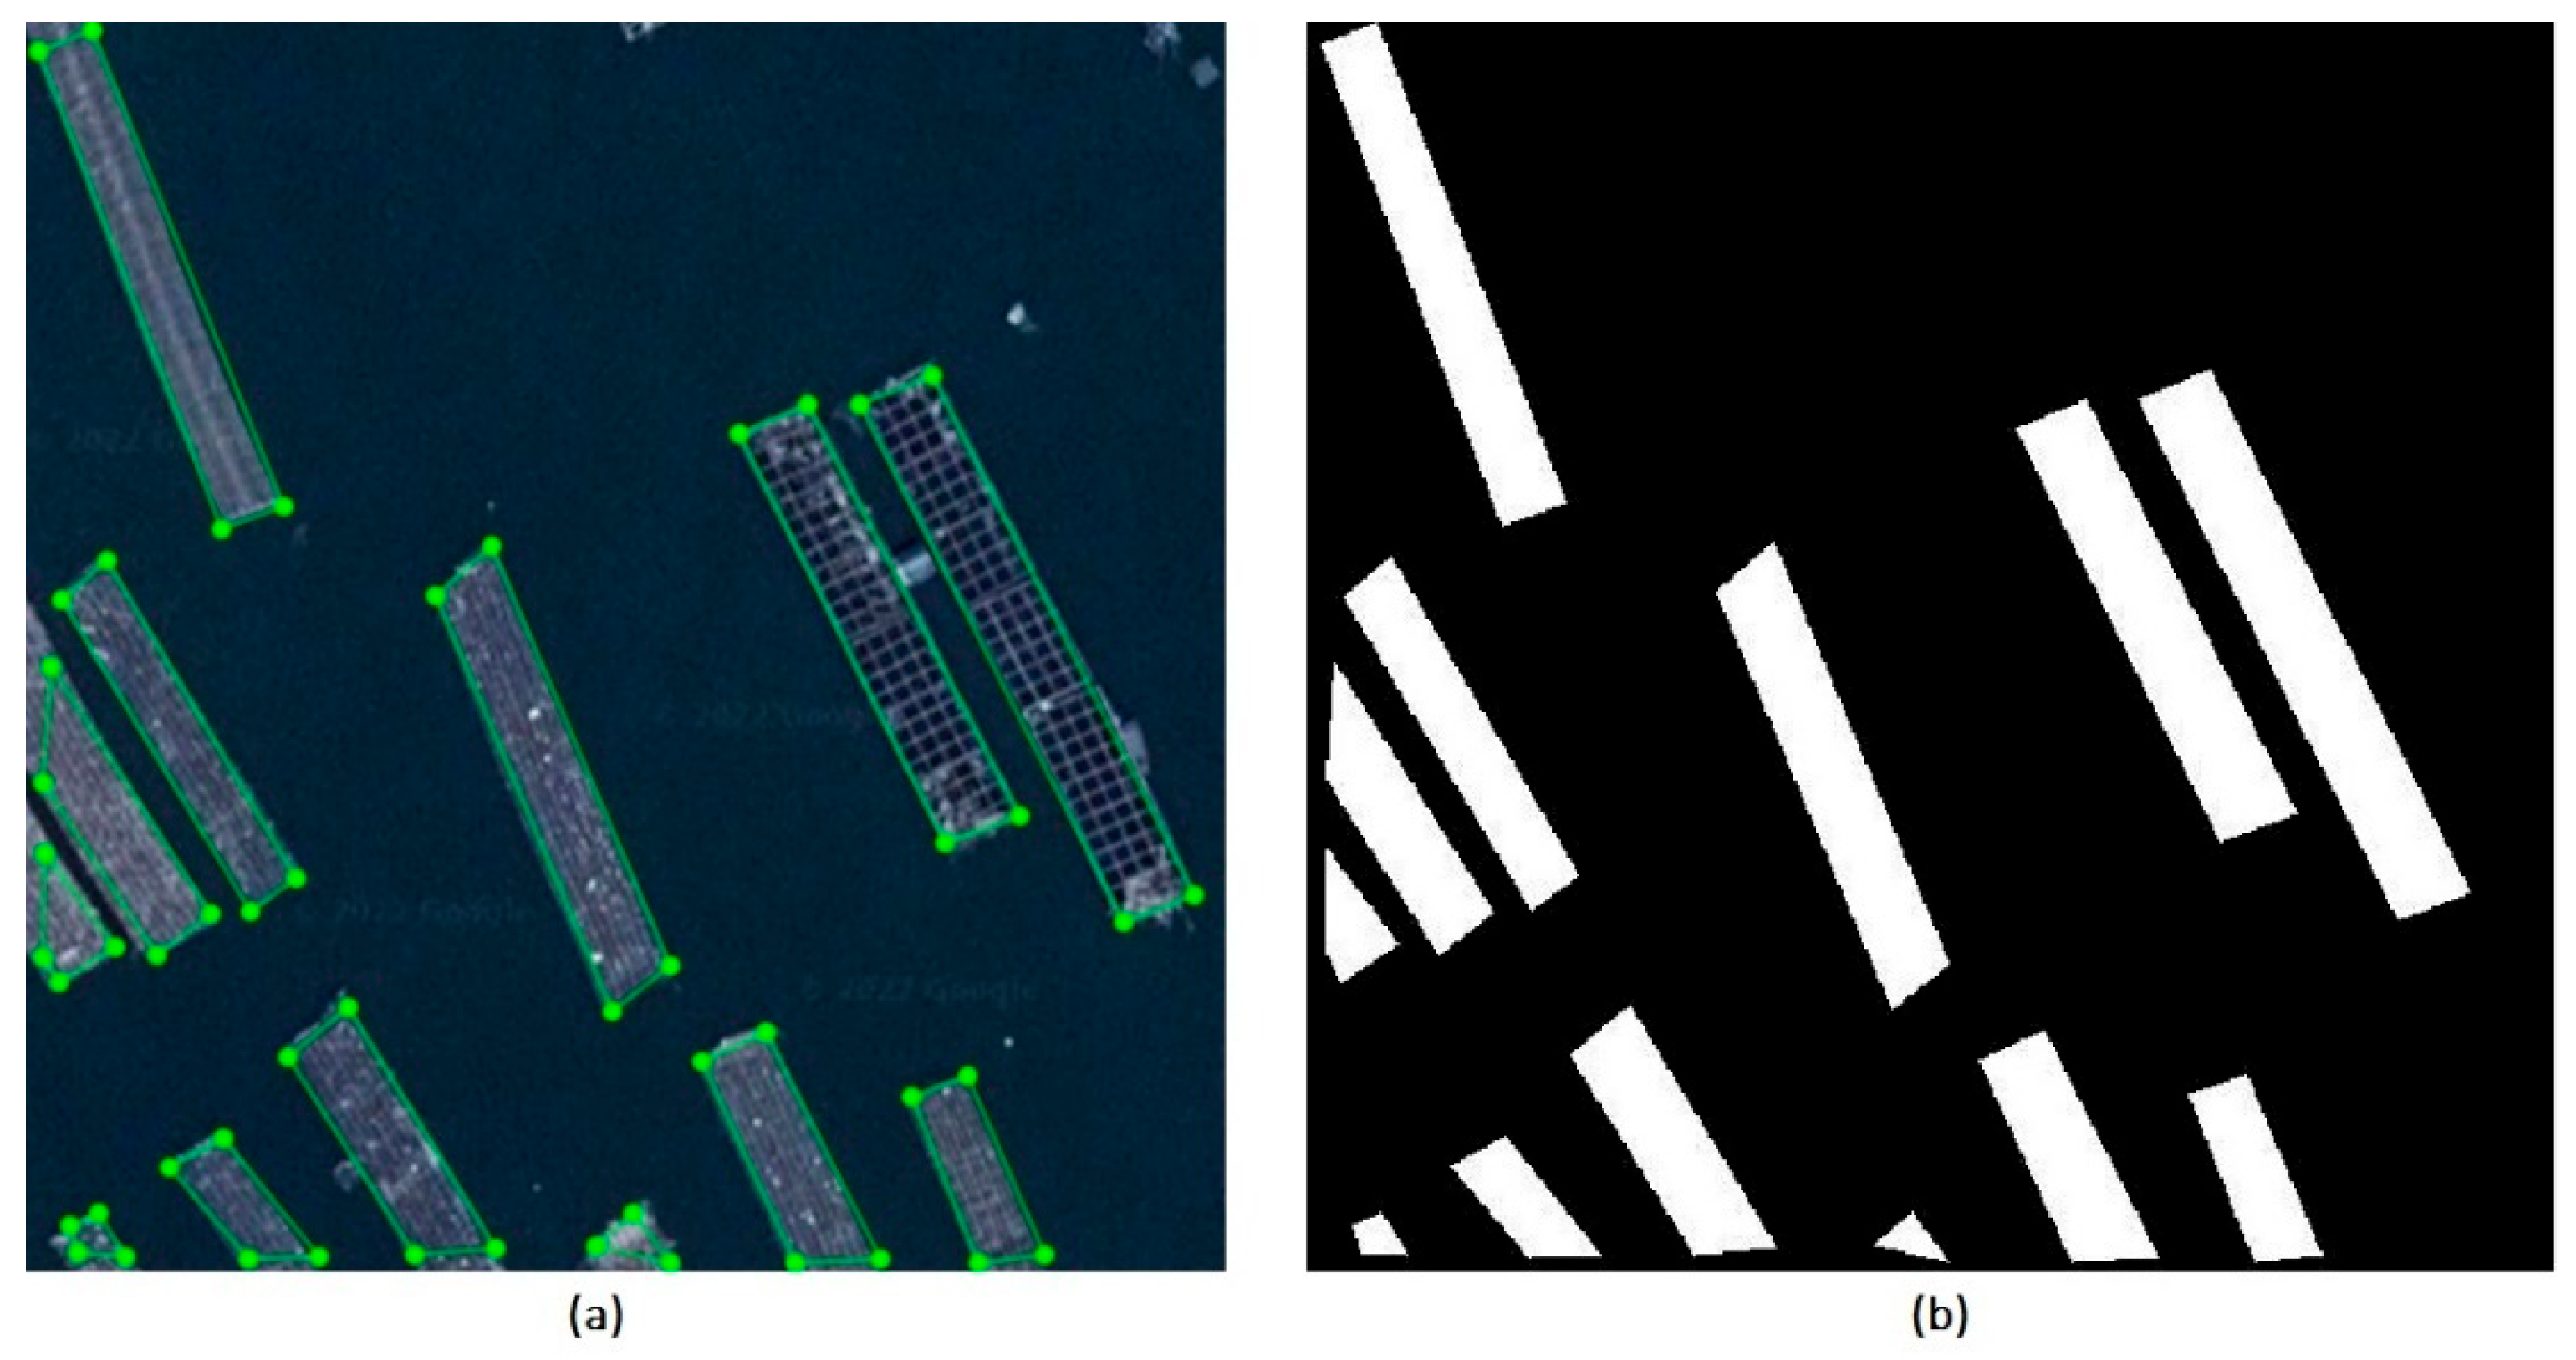
In the field of remote sensing image analysis, accurate data annotation is a key part of improving model performance. In this study, LabelMe V4.5.7 software was used to annotate remote sensing images to improve the recognition accuracy of farm breeding ponds. LabelMe’s ease of use and efficient support for large remote sensing images, especially its accurate image annotation capability, played a decisive role in ensuring high recognition accuracy in this study. However, the inconsistency of label data values becomes a significant challenge during the multi-participant annotation process, which may be caused by subtle differences in the judgment criteria of different annotators, thus affecting the consistency of label data and the accuracy of the final model. To address this issue, this study adopts the method of assigning Uniform Identification Codes (UICs) to objects, which reduces the inconsistency between annotations by ensuring that each annotated object has a unique identification code. In addition, to further improve the consistency and quality of annotation, this study developed detailed annotation guidelines and provided rigorous training to all annotators. These guidelines and training covered how to correctly identify farmed ponds from non-farmed ponds, how to assign an identification code to each labeled object, and how to use the LabelMe software for high-precision labeling. In addition, to ensure the accuracy of the labeling results, we have established an annotation review process and adopted a multi-person cross-validation method, which means that each annotated image will be independently reviewed by multiple annotators, and any inconsistencies in the annotation will be rechecked and corrected. These measures significantly improve the consistency and quality of the labeled data, laying a solid foundation for subsequent model training. Although the introduction of UICs and other quality control measures have increased the complexity of the annotation process, these steps are essential to ensure the accuracy of data annotation and further improve the precision of farm breeding pond identification. Going forward, with the development of automated annotation techniques, we expect to be able to further reduce the labor intensity required for manual annotation while maintaining or even improving the quality and consistency of data annotation.
Figure 11 shows an example of the labeling operation and the resulting annotation data from LabelMe software.
6.2. Discussion Based on the SwinNet Model Results
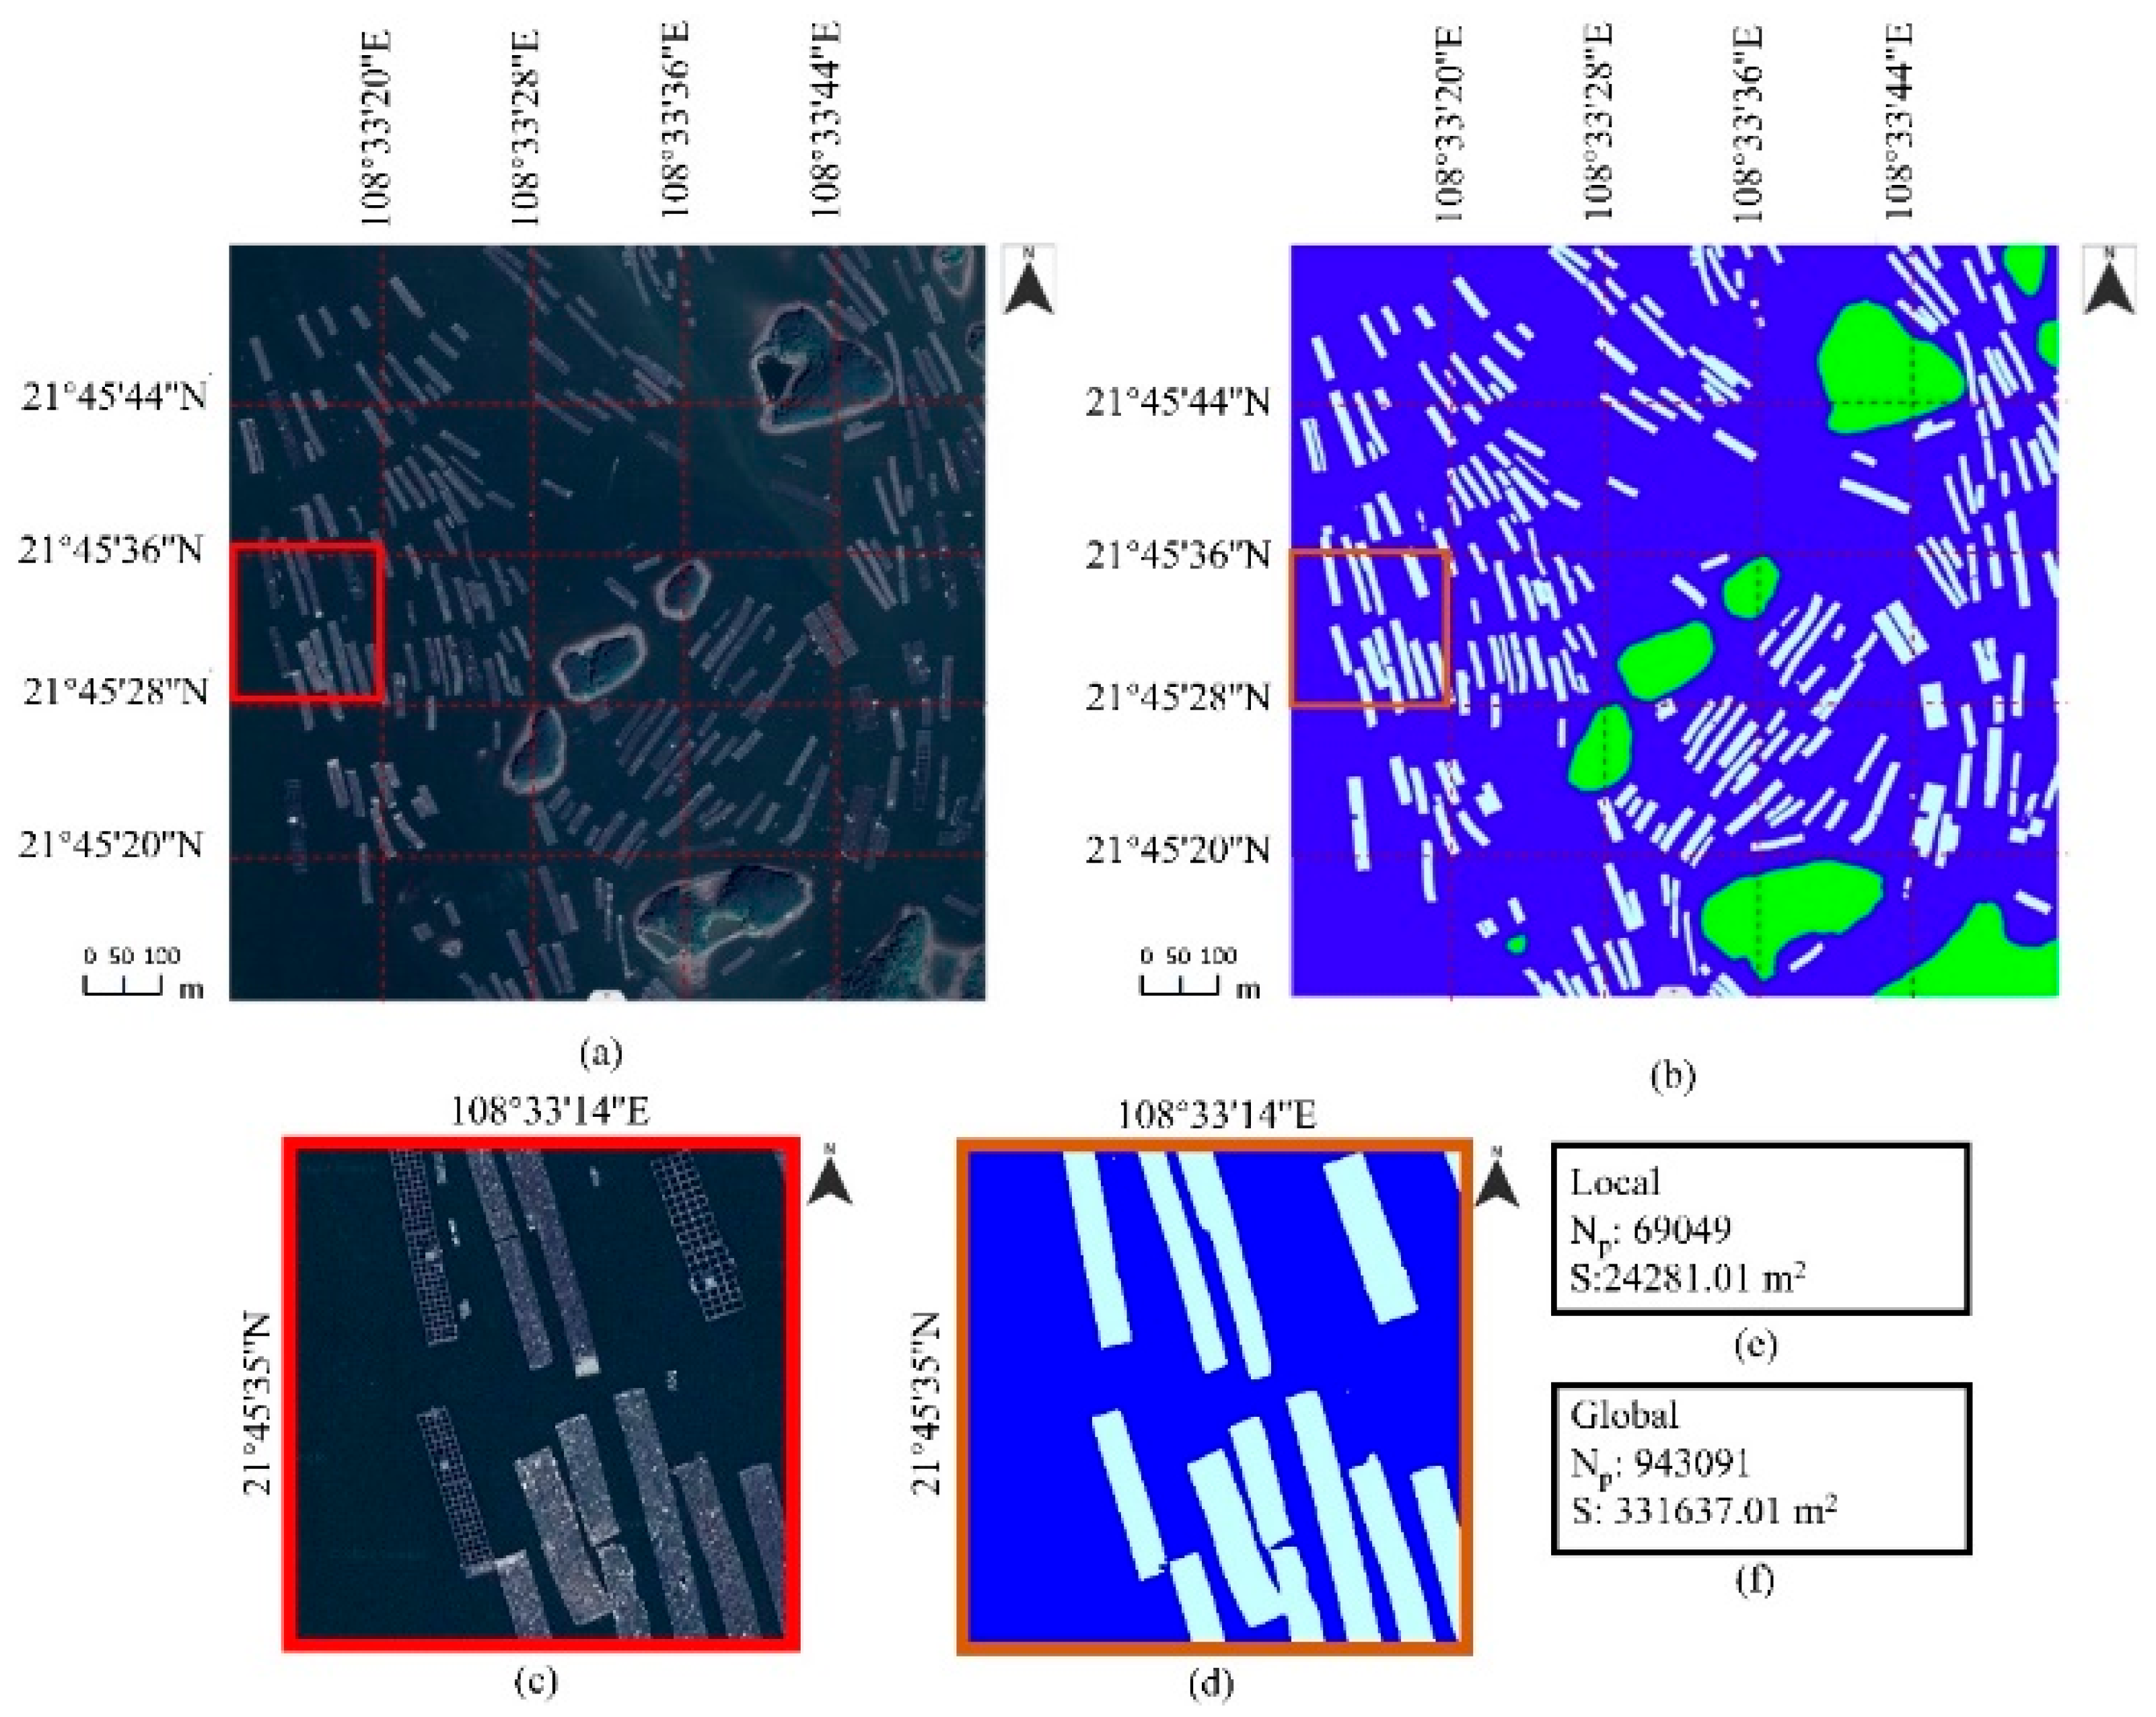
In the discussion of the results presented by our proposed SwinNet model, particularly as showcased in
Figure 12, the model’s capability to effectively segment large-size remote sensing imagery [
50] and accurately compute the area of aquaculture regions is of notable significance [
51]. The methodology employed—segmenting high-resolution remote sensing imagery of 2500 × 2500 into smaller 500 × 500 images for SwinNet processing—demonstrates the model’s adeptness not just in handling large datasets but also in maintaining precision at a granular level. The regions of Sipo Dun, Sanpo Dun, and Toupo Dun within the Maowei Sea area, as featured, underscore the model’s utility in real-world applications.
A critical observation from the segmented outputs, particularly the stitched images (
Figure 12b) and the detailed aquaculture region extraction (
Figure 12d), is SwinNet’s precision in delineating the aquaculture boundaries and its minimal artifact generation at the seams of stitched images. This outcome reinforces the model’s proficiency in extracting detailed features such as the edges of aquaculture areas, which is crucial for accurate area calculation and further applications in coastal aquaculture management. Moreover, the area statistics derived from the model’s predictions, illustrated in
Figure 12d,e, highlight the practical utility of SwinNet in providing tangible data for the aquaculture industry. The ability to translate pixel counts into real-world area measurements, as conducted for both local (approximately 24,281.01 m
2) and global predictions (approximately 331,637.01 m
2), offers an efficient and accurate method for managing and evaluating the scope of aquaculture operations.
The potential applications of SwinNet extend beyond single-time measurements. When historical remote sensing imagery data are available, SwinNet’s application can be expanded to track the development trends of aquaculture areas over time. This capability could provide invaluable insights into the sustainable development of the coastal aquaculture industry, allowing for the monitoring of expansion, contraction, or any changes in aquaculture practices. Such dynamic tracking aligns with the broader objectives of environmental sustainability and resource management, offering a tool not only for current operational assessment but also for future planning and conservation efforts.
Thus, SwinNet stands out not merely for its technical sophistication but for its practical implications, offering a robust solution for the challenges faced in large-scale aquaculture monitoring and management. The presented results and subsequent analysis affirm the model’s superiority and adaptability to various scales of operation, marking a significant advancement in the field of remote sensing applied to aquaculture.
6.3. Challenges and Scale to Large Datasets
The proposed SwinNet model has been validated in relatively small experimental areas, but scaling it up to larger areas may pose significant challenges, primarily due to computational power requirements. High-resolution remote sensing imagery of large study areas can be challenging to implement with SwinNet, as it is designed to run on a single PC with limited RAM. Handling large datasets necessitates more powerful computing resources and memory, such as those offered by distributed and cloud computing systems [
2]. Adapting the SwinNet model for distributed computing platforms will require redesign and optimization, potentially incurring additional costs. Large remote sensing imagery datasets also introduce complexity due to the inclusion of diverse surface characteristics beyond aquaculture areas, such as offshore industries and island facilities, which can generate additional noise. Therefore, SwinNet must be robust enough to handle these disturbances [
52,
53]. Additionally, large remote sensing imagery datasets are often composed of images captured at different times, meaning the target aquaculture areas may vary in size, shape, color, or texture due to seasonal changes and varying meteorological conditions, further challenging the model’s robustness. There are several potential solutions to improve the generality of the proposed SwinNet, including a larger and more diverse dataset [
54], data augmentation [
55], regularization of the model [
56] and early stopping [
57] et al.
However, in practical terms, oyster farming areas typically concentrate in designated offshore waters where conditions are favorable for breeding. Oyster farming in distant sea waters is not environmentally or economically feasible. Thus, large-scale application of the SwinNet model may not be necessary in most practical situations.
This study provides a foundation for remote sensing-based aquaculture monitoring using high-resolution imagery; however, several important future explorations can be considered. For example, enhancing the robustness and generalizability of the proposed model with validation across diverse aquaculture environments with varying geographic, ecological, and operational characteristics. The consideration of satellite imagery of varying resolutions and from different sources will be critical for broadening the proposed model’s practical applicability. While this work focuses on high-resolution images, extending the framework to medium- or low-resolution data would allow for integration with more widely available satellite platforms and facilitate regional or national-scale monitoring. The temporal dimension of aquaculture development—such as seasonal variability, farming cycles, and long-term structural changes—requires further investigation. Incorporating time-series analysis and multi-temporal imagery could significantly enhance the model’s capacity to detect and interpret temporal trends and transitions in aquaculture areas. Reducing the model’s computational expense without sacrificing accuracy remains an important challenge, particularly for deployment in real-time or resource-constrained environments. Future work should explore model compression techniques, lightweight architectures, and efficient inference strategies to support scalable implementation.
7. Conclusions
This study presents the development and application of the SwinNet model, a cutting-edge solution for the semantic segmentation of RSI, specifically designed to identify aquaculture areas within the Maowei Sea, part of the Beibu Gulf in China. At its core, SwinNet leverages a Swin Transformer to adeptly extract multi-scale features from RSI, addressing the critical need for high-precision aquaculture delineation. The introduction of PPAM within the encoder significantly boosts the model’s capability to discern nuanced features of aquaculture zones, enhancing the overall accuracy of feature extraction. To capitalize on the rich semantic information and intricate details present in both low and high-resolution features, a multi-scale feature decoder, inspired by the principles of FPN and the DSConvASPP module, is meticulously designed. This decoder architecture ensures the effective fusion of diverse feature scales, thereby enriching the model’s semantic segmentation output. Further augmenting SwinNet’s segmentation precision is an auxiliary decoder, incorporating a residual structure to refine the segmentation accuracy further. The performance of the SwinNet model is rigorously evaluated on a specially curated dataset, representing a diverse range of aquaculture areas. Through comprehensive experimental tests, SwinNet has demonstrated remarkable segmentation proficiency, achieving mean Pixel Accuracy (mPA) and mean Intersection over Union (mIoU) values of 97.82% and 95.77%, respectively. These metrics not only underscore SwinNet’s exceptional performance but also signify its superiority over existing mainstream segmentation models. SwinNet’s innovation extends beyond its technical prowess; it offers a pragmatic solution to the aquaculture industry. By facilitating the precise and convenient extraction of aquaculture areas from RSI, SwinNet enables the efficient management and statistical analysis of aquaculture operations. This capability holds significant implications for the sustainable and effective oversight of aquaculture practices, paving the way for enhanced productivity and environmental stewardship within the sector.


 ,
, 


