Review

A Review of Standardization in Mississippi’s Multidecadal Inland Fisheries Monitoring Program

by
Caleb A. Aldridge
1,*,† and
Michael E. Colvin
2,†
1
U.S. Fish and Wildlife Service, Lower Mississippi River Fish and Wildlife Conservation Office, Tupelo, MS 38804, USA
2
U.S. Geological Survey, Columbia Environmental Research Center, Columbia, MS 65201, USA
*
Author to whom correspondence should be addressed.
Much of this work was completed while the authors were affiliated with Mississippi State University, Department of Wildlife, Fisheries and Aquaculture, Starkville, MS 39762, USA.
Fishes 2025, 10(5), 235; https://doi.org/10.3390/fishes10050235
Submission received: 17 March 2025 / Revised: 8 May 2025 / Accepted: 15 May 2025 / Published: 18 May 2025
(This article belongs to the Section Fishery Economics, Policy, and Management)

Abstract

Standardizing data collection, management, and analysis processes can improve the reliability and efficiency of fisheries monitoring programs, yet few studies have examined the operationalization of these tasks within agency settings. We reviewed the Mississippi Department of Wildlife, Fisheries, and Parks, Fisheries Bureau’s inland recreational fisheries monitoring program—a 30+-year effort to standardize field protocols, data handling procedures, and automated analyses through a custom-built computer application, the Fisheries Resources Analysis System (FRAS). Drawing on quantitative summaries of sampling trends and qualitative interviews with fisheries managers, we identified key benefits, challenges, and opportunities associated with the Bureau’s standardization efforts. Standardized procedures improved sampling consistency, data reliability, and operational efficiency, enabling the long-term tracking of fish population and angler metrics across more than 270 managed waterbodies. However, challenges related to analytical transparency and spatiotemporal comparisons persist. Simulations indicated that under current conditions, 5.8, 22.9, and 37.1 years would be required to sample (boat electrofishing) 50%, 75%, and 95% of the Bureau’s waterbodies at least once, respectively; these figures should translate to other agencies, assuming similar resource availability per waterbody. The monitoring program has reduced manual processing effort and enhanced staff capacity for waterbody-specific management, yet several opportunities remain to improve efficiency and utility. These include expanding FRAS functionalities for trend visualization, integrating mobile field data entry to reduce transcription errors, linking monitoring results with management objectives, and enhancing automated report generation for management support. Strengthening these elements could not only streamline workflows but better position agencies to apply standardized data in adaptive management embedded into the monitoring program.
Key Contribution: This study presents a 30+-year review of how an inland fisheries monitoring program standardized sampling methods, data protocols, and automated analyses through a bespoke computer application. It highlights how standardized procedures can improve efficiency, consistency, and utility in fisheries management while identifying persistent challenges such as transparency and adaptability. The findings provide practical insights for agencies seeking to streamline monitoring programs, integrate decision-support tools, and promote adaptive management in support of long-term fisheries stewardship.

1. Introduction

Standardization in natural resource monitoring is of interest to natural resource management agencies. In the context of inland recreational fisheries, monitoring is defined as “the continuous or repeated observations, measurement, and evaluation of fish population parameters or indices” [1] and typically also includes angler interviews, creel surveys, and fish habitat measurements. Reliable and sustained data collection enables managers to compare parameters and indices over time and space, giving them indispensable information when assessing fisheries resources [2,3,4,5] and understanding “how management practices change fish communities, stocks, or other units of interest” [2]. In the United States of America (USA), inland fisheries management agencies focus significant efforts on monitoring popular sportfish taxa due, at least in part, to legislation like the Federal Aid in Sportfish Restoration Act and tenets of the public trust doctrine [6]. These efforts support sustainable fisheries used by millions of enthusiasts (e.g., anglers and guides) that generate billions of dollars, as in other countries [7,8,9,10,11,12].
A collaborative effort among inland fisheries professionals has sought to standardize inland fisheries sampling methods to increase comparison opportunities [5,8,13,14,15]. Likewise, inland fisheries science has helped develop “standard” methods for efficiently and reliably measuring various aspects of a fishery (e.g., fish lengths, angler effort, primary productivity) and converting these into parameters, dynamic rates, or indices that characterize the fishery (e.g., fish survival, harvest rates, carrying capacity) [1,16,17,18,19,20,21]. While standardization of sampling methods, measurements, and metrics is intertwined and depends on monitoring objectives, they are each components of the whole—standardizing sampling aims to reduce observation error and maximize efficiency, while standardizing measures and metrics aims to provide a means to assess status, evaluate action effectiveness, and increase scientific understanding [22,23]. Some metrics (and associated measures) are more commonly used in fisheries assessments than others [1,16,18,24]. Indeed, catch per effort (CPE; relative abundance), proportional size distribution (PSD; population structure), mean length at age (age structure and growth), and relative weight (Wr; condition) are among the most common population metrics [7,24,25,26,27,28]. Likewise, angler data, such as effort (f), catch (C), and harvest (H), and habitat measures, like water depth (m) and temperature (°C), are synthesized into metrics to evaluate system stressors and capacities [29,30]. Ensuring that measurements and metrics meet their intended purposes depends on clear procedures for data recording and management [3,31].
Data protocols serve multiple purposes, ensuring that critical information—including metadata—is consistently recorded while also providing processes for storing, maintaining, and archiving data from collection in the field to long-term use, as successful monitoring programs recognize that mishandling or mismanagement can compromise data reliability and validity [31,32,33]. One longstanding tool used in assuring data quality and control is standardized field sheets [31,33]; however, the extent of standardization is usually limited to within an agency or working group. Since the advent of computers, information from standardized field sheets has been entered into electronic tabular files (e.g., spreadsheets) with corresponding and coherent structures [33]. Some organizations even record data in-field on mobile devices to reduce copy errors [34], though new types of errors may arise, like incorrect programming or failures (bugs), file corruption and loss, record duplication, and network connectivity issues. Even simple quality assurance procedures like checking for typos and storing data in a stable file form (e.g., flat files or as a table in a relational database) are easier with computers, the importance of which cannot be overemphasized [32,33] since data are the legacy left to future generations [16,31,35].
Given that fisheries sampling methods, measures, and metrics, as well as data management, have undergone some extent of standardization, it is reasonable to presume these and other routine tasks can be further strengthened and streamlined [16,36,37]. A logical first step is to provide verified and validated tools for converting fisheries measures into fisheries metrics. An extensive effort has been made to provide fisheries scientists and managers with mathematical procedures that can be replicated by hand or in any standard statistical computer program (e.g., Guy and Brown [7]). Yet, errors may arise due to miscalculations. And though advances in computer applications and scientific programming languages have facilitated data keying or data upload to produce informative tables and graphs, there are drawbacks like software application license costs, time investments to learn or relearn programming languages, and multiple applications needed to calculate different metrics. Computer applications written using free and open-source software that is custom-made for a monitoring program is one approach to overcome these drawbacks [33,38].
In 1986, the Mississippi Department of Wildlife, Fisheries, and Parks (MDWFP), Fisheries Bureau (hereafter Bureau) adopted a standard approach to sampling methods, data handling and management protocols, and the calculation of fisheries metrics. To facilitate this, the Bureau developed a bespoke computer application to streamline data analysis and provide managers with results in comprehensible tables and graphics [13,38]. The Bureau’s case history provides an opportunity to understand the benefits and challenges of standardizing routine fisheries tasks and the utility of digital tools in managing inland recreational fisheries [39,40]. Because other organizations have monitoring programs with similar aims as the Bureau’s [41,42], the experiences of the Bureau are presumably helpful when adopting similar tools and protocols. In the next sections, we present the following:
  • A description of the Bureau’s standardized monitoring program.
  • Quantitative and qualitative analysis of the monitoring program.
  • Identification of the benefits and challenges of monitoring program standardization.
  • Outline of opportunities for improvement and further operationalization.

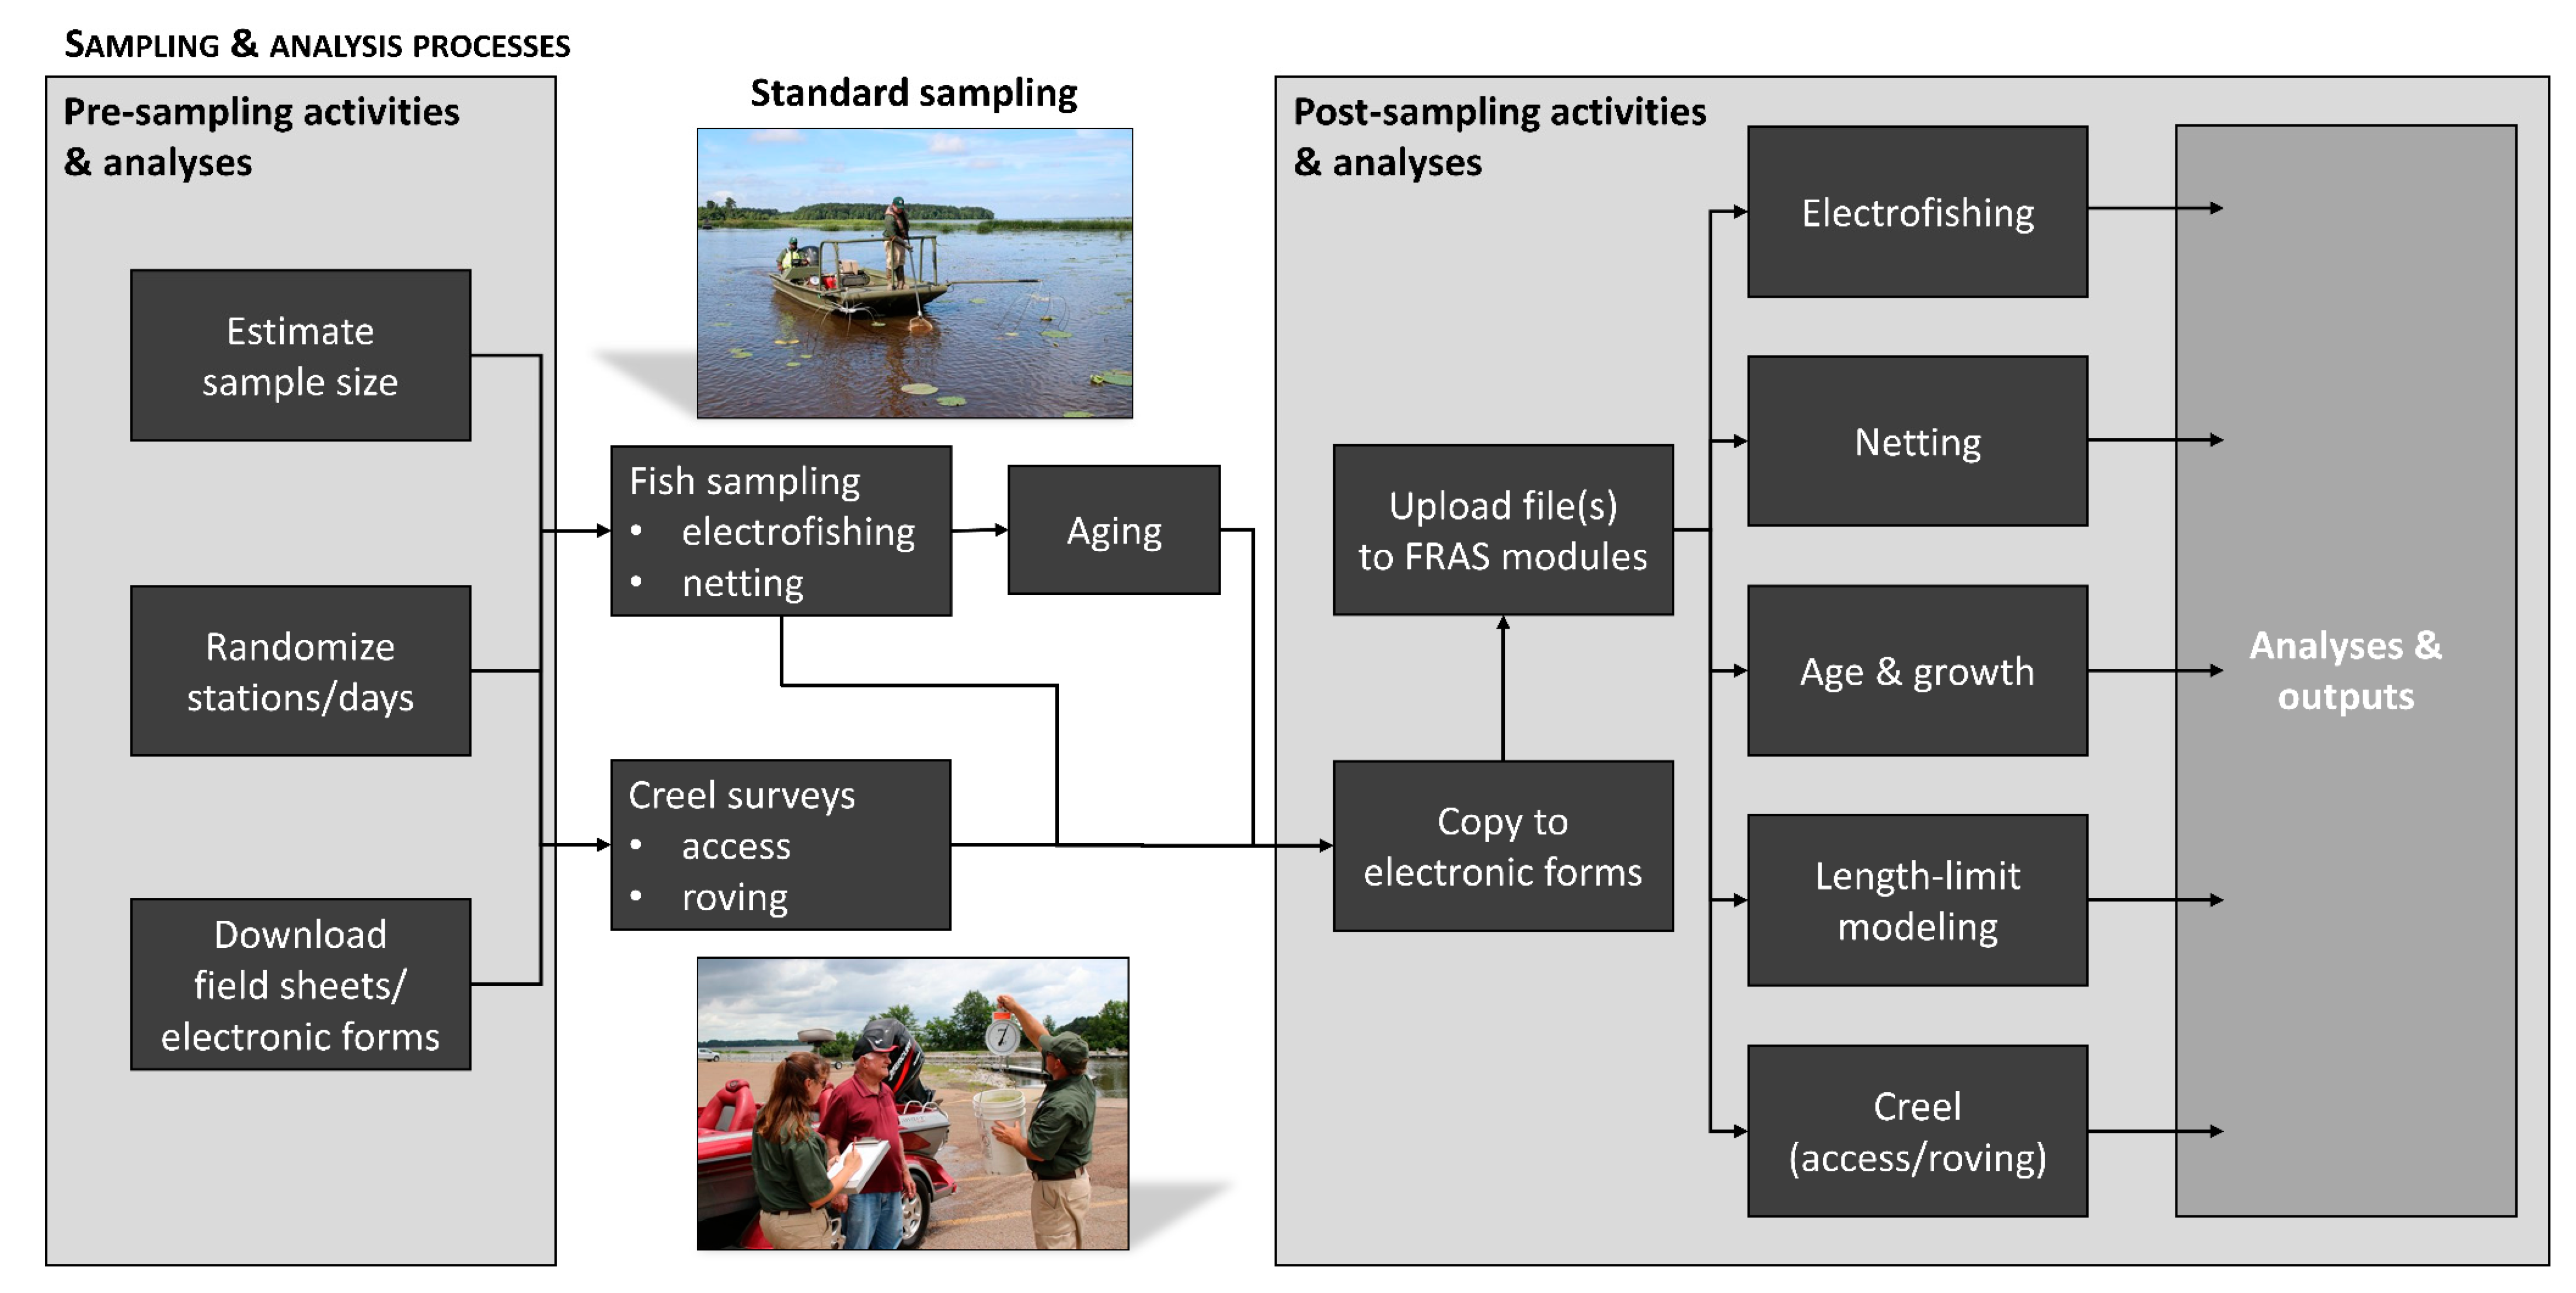
2. Overview of the Mississippi Inland Fisheries Monitoring Program

The Bureau manages Mississippi’s inland lotic and lentic fisheries. We focus here on the over 270 natural and artificial lentic waterbodies that range from 4 to 19,000 ha [43]. Generally, the Bureau balances yield and angler-oriented goals for these waterbodies [42]. Waterbodies in the Bureau’s five districts are categorized as primary, secondary, or tertiary depending on their perceived recreational significance and physical size (tertiary waterbodies are smaller, on average; Figure 1) [44]. Fish sampling and creel surveys in primary and secondary waterbodies are conducted at least once every 3 or 5 years, respectively, and tertiary waterbodies are sampled opportunistically [43,44]. All sampling follows standard operating procedures developed for the Bureau [44].
Boat electrofishing and netting with fyke and gill nets are the primary fish sampling methods used to monitor popular sportfish taxa like black basses Micropterus spp., sunfishes Lepomis spp., and crappies Pomoxis spp. [44,45,46]. From September to November, managers across districts conduct standardized fish surveys to assess population characteristics like relative abundance, size structure, growth, and mortality. On rare occasions, the sampling design and methods are adjusted to accommodate adverse weather or hydrological conditions, budget and time limitations, waterbody-specific objectives, and the desired precision of estimates.
Creel surveys—surveys of bank anglers and boat anglers at ramps or on the water—occur from March through July [44]. Angler data recorded includes the sportfish taxa targeted and catch success, catch rate, release rate, harvest rate, and average weight of fish harvested by taxa. Anglers are randomly interviewed in 6 h sampling periods selected according to week and weekend strata. Managers have two options for weighting strata: pre-weighting or post-weighting. Pre-weighting assigns a sample of week and weekend days in proportion to the total of each in the entire creel survey period. Alternatively, post-weighting fisheries metrics are weighted afterward, given stratum-specific observed effort, like the percentage of anglers fishing.
A computer application, the Fisheries Resources Analysis System (FRAS 1.0), with an accompanying user manual, was developed to support the Bureau’s adoption of standardized sampling protocols and regimented data handling, management, and analysis procedures [38]. As other monitoring program components (e.g., sampling methods) expanded or were revised, so too did FRAS. From 2003 to 2005, FRAS 1.0 and its user manual underwent revision and expansion to FRAS 2.0. FRAS 1.0 and 2.0 were installed and accessed on the local computers of managers in all districts of the Bureau. In 2018, FRAS 2.0 was reprogrammed in the R language [47] and moved to an online platform using the web application development package shiny [48,49]. Using R (v3.6) and shiny (v1.3) the application was deployed to an online server allowed the development team to quickly debug and enhance the application with minimal interruption to managers’ workflows. The current FRAS application is in version 3.1 and supports the pre- and post-sampling analyses of fish population surveys (e.g., electrofishing and gillnetting) and angler creel surveys at the waterbody level (Figure 2).

2.1. Pre-Sampling Activities and Analyses

In preparation for sampling, a sampling plan is written that outlines the sampling design and methods, identifies crew members and assigns responsibilities, and lists alternative sampling dates should adverse weather or hydrological conditions prohibit safe sampling [3,44]. An approach to sampling designs has been standardized to use aerial and bathymetric maps to identify potential fish sample stations (nearshore areas approximately 0.5 km in length). Stations are selected using a simple or stratified random design based on habitat heterogeneity (available in FRAS). Currently, this remains a two-stage procedure, as waterbody-specific stations have not been programmed into FRAS. Creel surveys use a random or stratified random design with stratification of day type into weekdays, weekends, or holidays. Additionally, standardized field sheets (Supplementary Material) used by district managers are available for download from the FRAS 3.1 web application.

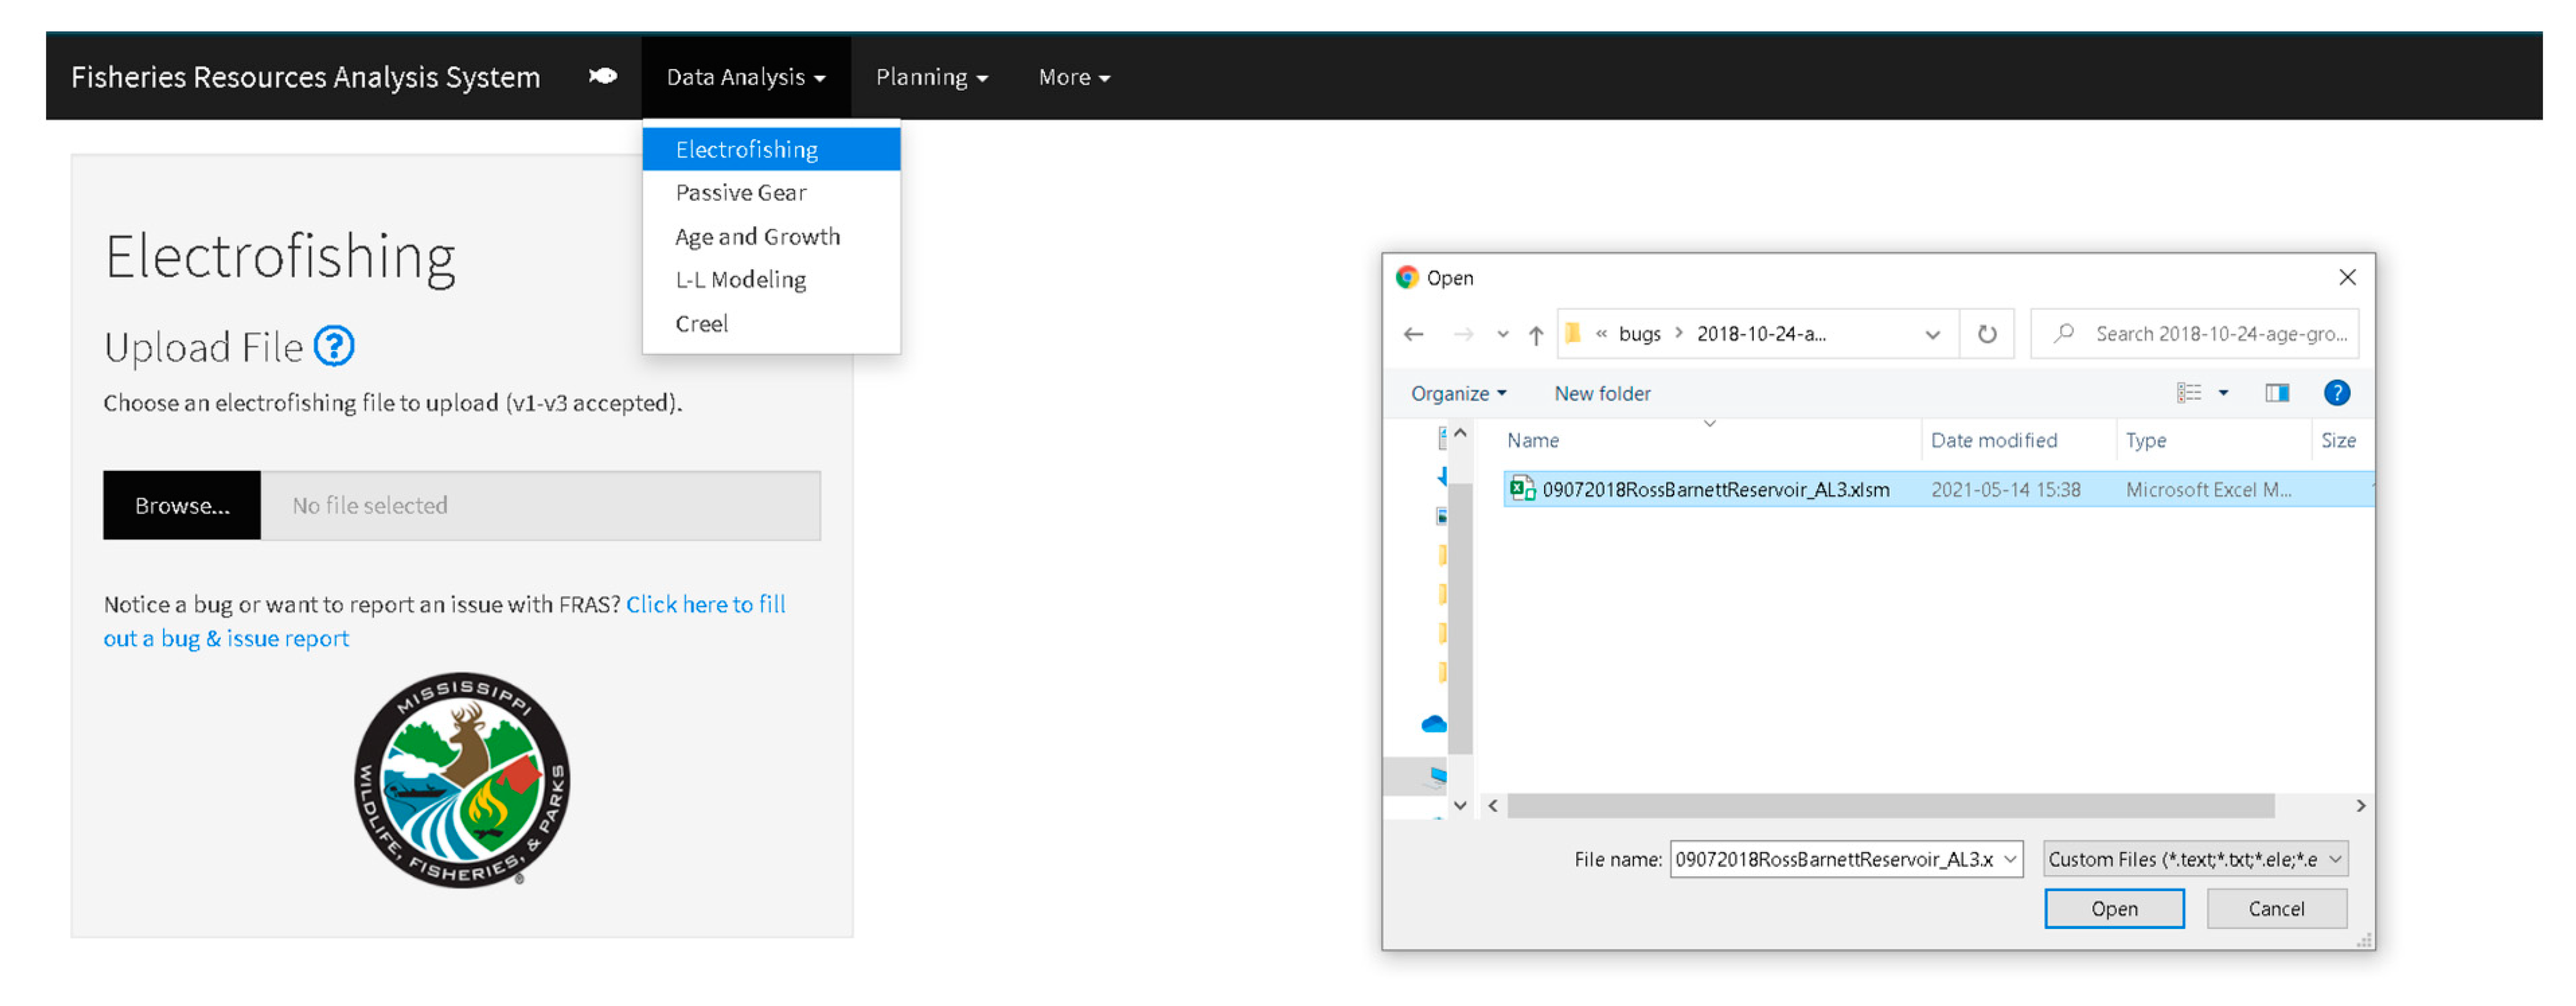
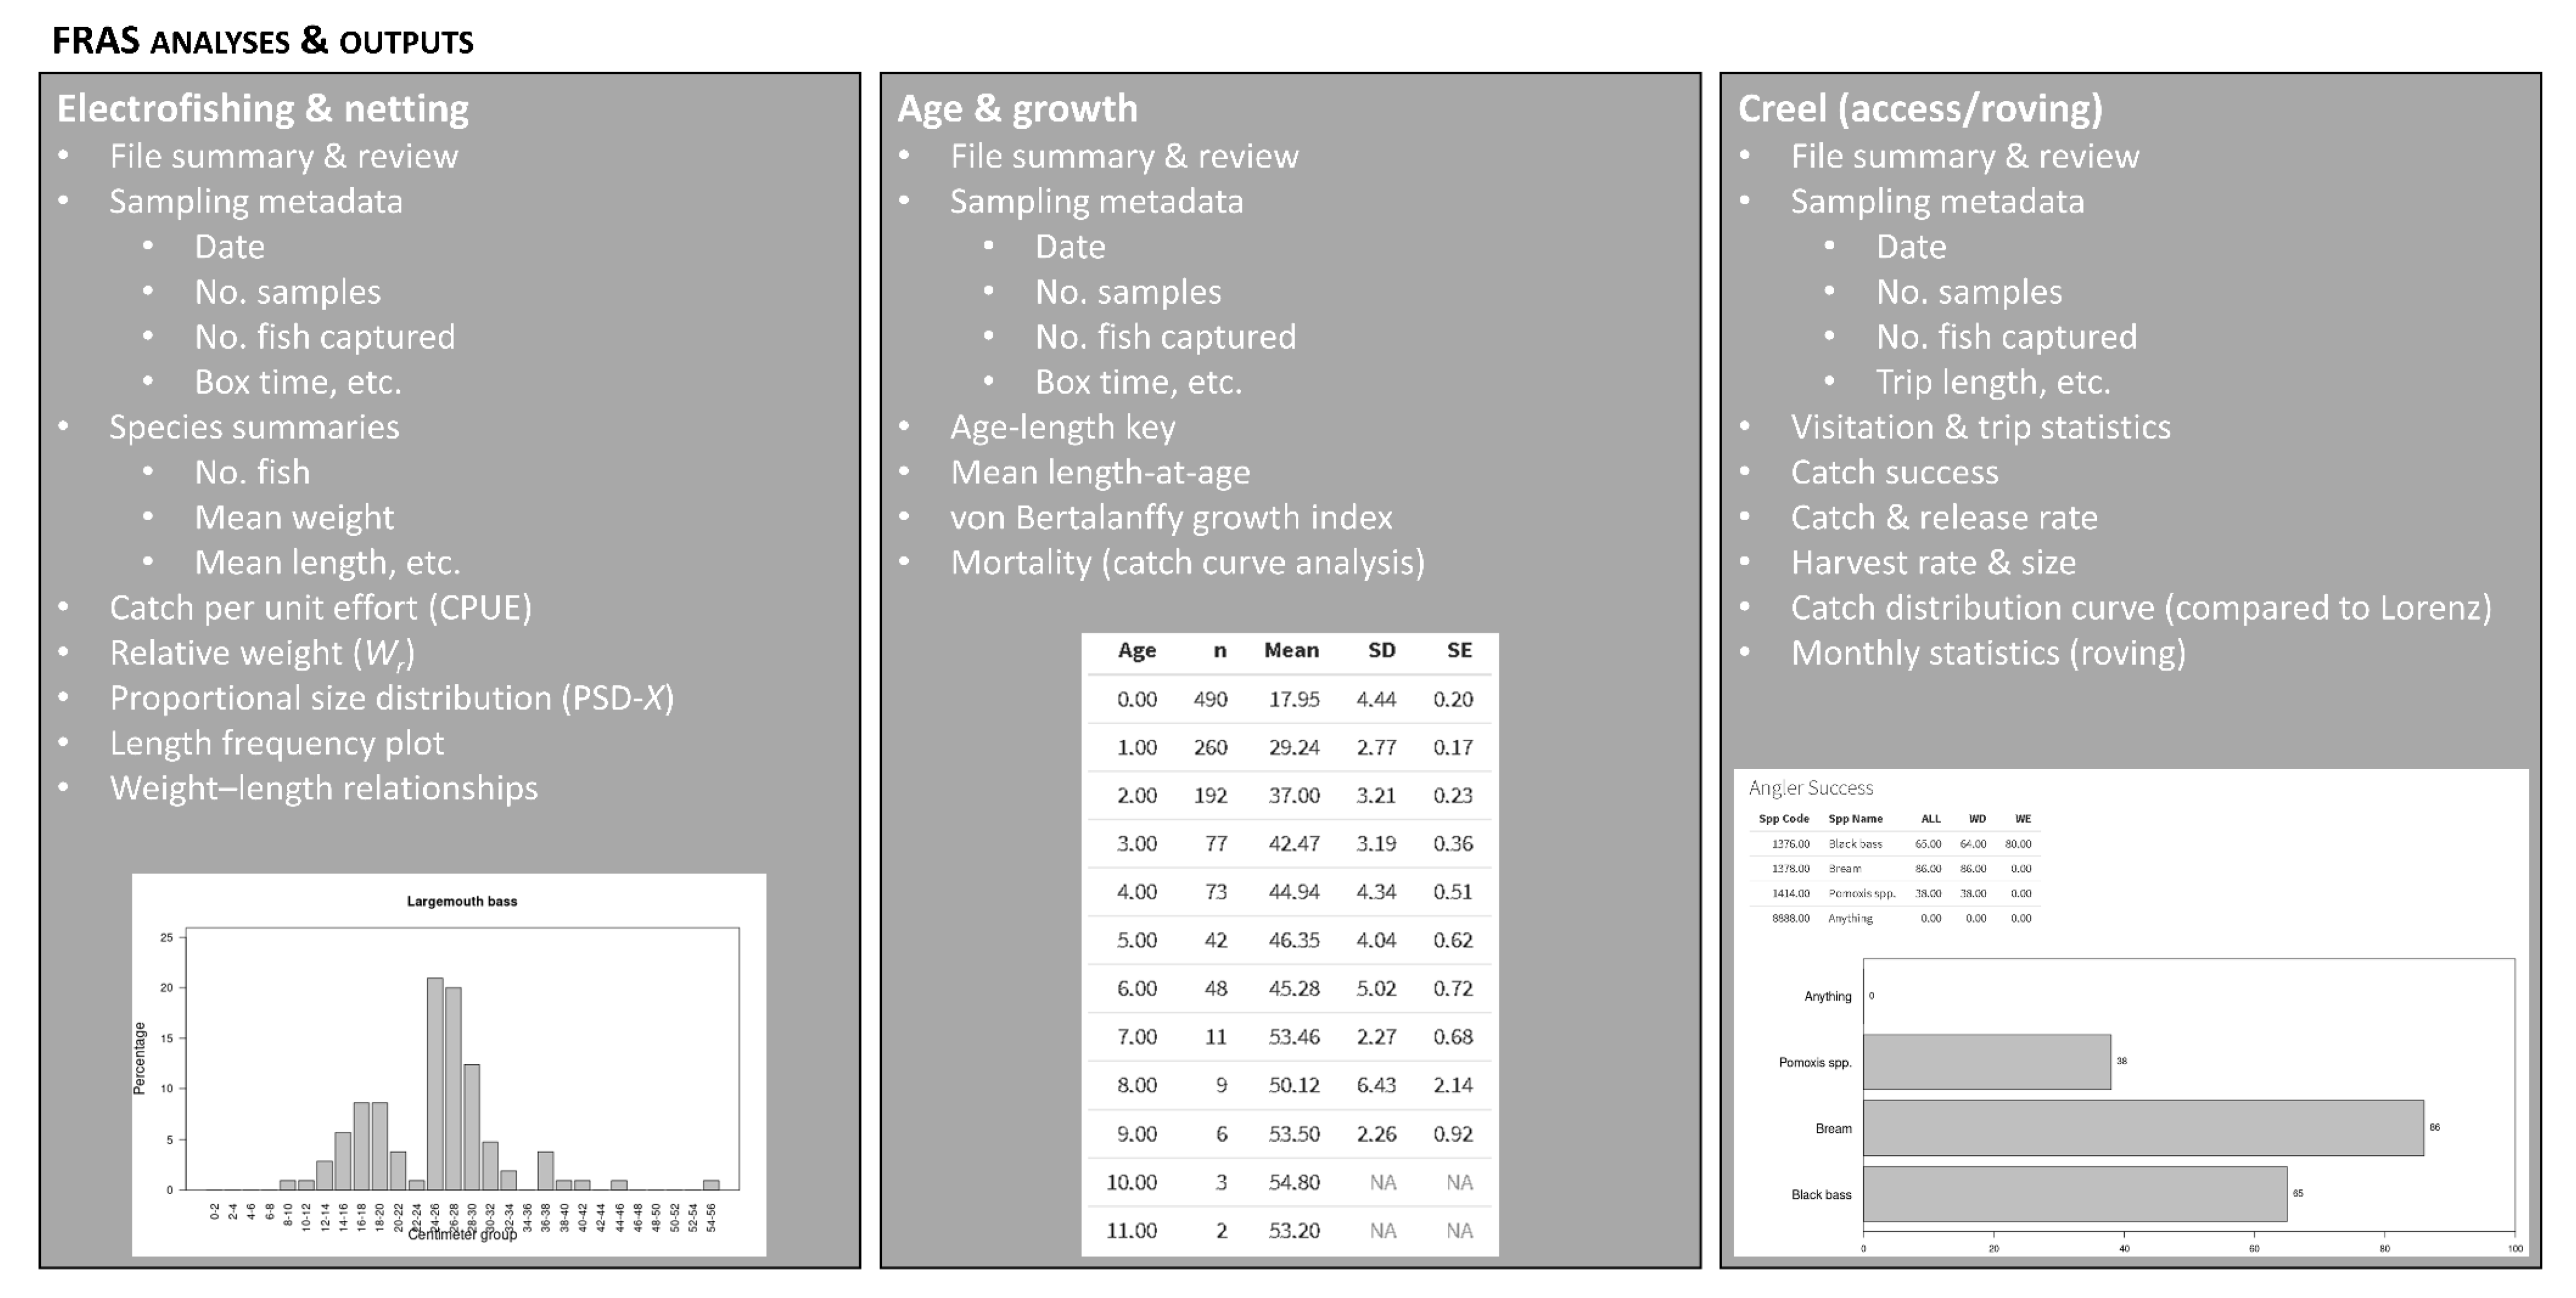
2.2. Post-Sampling Activities and Analyses

After sampling, managers check field sheets for legibility and completeness, a procedure maintained since the monitoring program’s inception and across all FRAS versions (Figure 3). Managers then transfer data from field sheets to electronic spreadsheets (available for download from the FRAS 3.1 web application). If erroneous field data entries (e.g., implausible taxa code) are present, they are not transferred to the electronic spreadsheet but are noted on field sheets.
Data entry is streamlined, and errors are minimized through a userform within a Microsoft Excel Macro-Enabled Workbook (XLSM; Excel 2016) spreadsheet with a data entry form programmed in Visual Basic for Application (VBA; Excel 2016). The data entry form mirrors field sheets to facilitate the transfer of data entries and has built-in features such as lookups, unit conversions, and data entry validation. Additionally, the userform automatically organizes data for automated analyses in FRAS 3.1. However, data entry forms do not wholly prevent errors and have only been used since 2018 (FRAS 3.0+)—managers sort and filter data as a last measure to identify any remaining errors. If any errors are identified, the corresponding entry in the field sheet is evaluated and corrected if possible. Field sheets are stored locally for at least three years, and electronic spreadsheets are saved locally on managers’ work computers as XLSM or Microsoft Excel Open Extensible Markup Language Spreadsheet (XLSX) files. Electronic copies are sent to the Bureau’s Main Office for archiving (see below). FRAS 3.1 can read XLSM and XLSX file types and custom text files generated by FRAS 1.0 and 2.0.
To analyze data in a standardized fashion, managers simply upload electronic forms to the appropriate FRAS module (Figure 4). Once uploaded, FRAS automatically calculates standardized fishery metrics and displays results in formatted tables and graphics, which can be downloaded for a uniform appearance in various documents (Figure 5). An overview of fisheries metrics calculated by FRAS is given in Figure 5, and the Supplementary Material provides additional details.

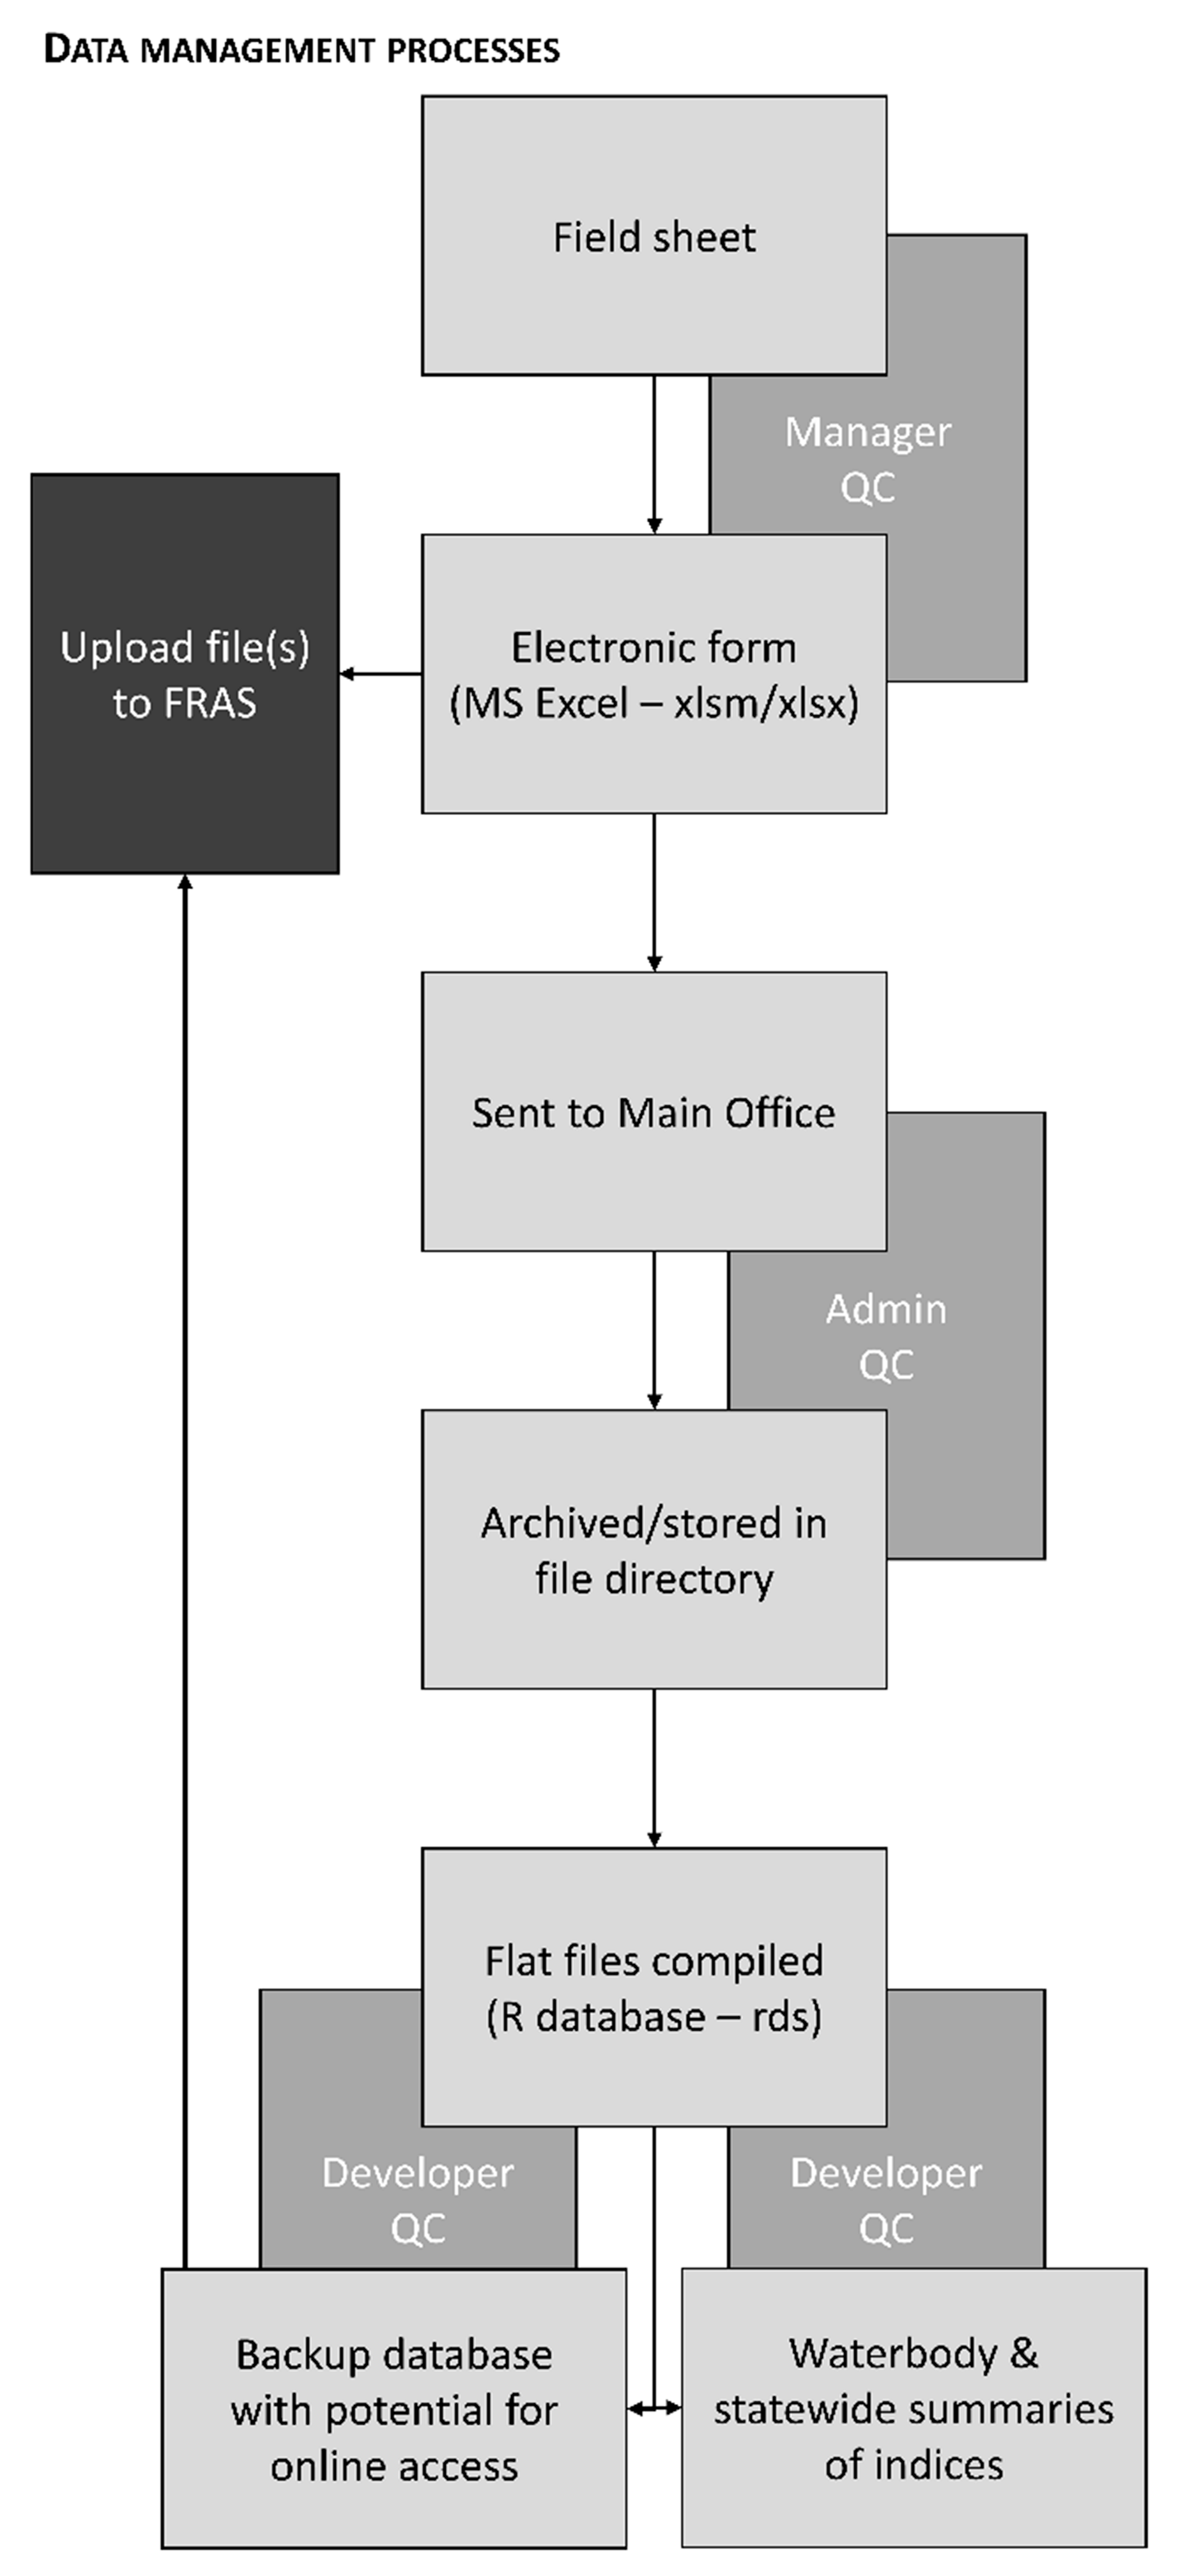
2.3. Central Archiving and Documentation

Copies of electronic spreadsheets are sent to the Main Office of the Bureau, where administrators randomly select files for data-quality checks and collate spreadsheets into waterbody-specific directories. The directory is shared with FRAS developers, who update a back-up database using a semi-automated process in R. This process includes additional quality checks, and any errors found are reported to the Main Office for resolution with the originating manager. Final, quality-controlled data are shared with all three parties. Data storage redundancy ensures at least three levels of protection: data are stored locally on managers’ work computers, a collated directory of individual data entry files is saved at the Main Office, and a compiled database is archived in the FRAS application development repository.

3. A Retrospective Look at the Monitoring Program

3.1. Quantitative Summary and Trends

From 1986 to 2019, the Bureau completed 1064 electrofishing surveys in 132 waterbodies, providing Bureau managers with reference statistics (Supplementary Material). The number of waterbodies electrofished by year increased at a rate of one per year (b = 1.01, df = 32, p < 0.01, R2 = 0.56; Figure 6a), with an average of 3.9 never-before-electrofished waterbodies added each year (Figure 6b). Variation in the number of electrofished and never-before-electrofished waterbodies is likely due to the 3- and 5-year sampling cycles of associated primary and secondary waterbodies, respectively. Spikes in Figure 6a,b most likely arise from waterbody acquisitions, Bureau reorganizations, and jurisdictional expansions [44]. Additionally, fluctuations can be attributed to opportunistic sampling of tertiary waterbodies via the Bureau’s Community Assistance Program, whereby local governments (e.g., community, city, county) enter a cooperative agreement with the Bureau to provide enhanced fishing opportunities and support food security.
Using largemouth bass (Micropterus nigricans) [50] and sunfishes (Lepomis spp.) as examples, we calculated the percentage of electrofishing surveys that met the Bureau’s sample size criteria for CPE (±20% of the mean at 80% confidence) [16,44,51,52] and PSD (±10% of the mean at 90% confidence) [44,53] (Supplementary Material, Equations S.9 and S.10). Overall, 92% of electrofishing surveys for largemouth bass were large enough to satisfy the Bureau’s CPE criteria; 84% for sunfishes. The percentage of satisfactory sample sizes for CPE varied annually for both sportfish taxa, but no clear trend over time was observed (Figure 6c). Likewise, 81% and 80% of sample sizes for largemouth bass and sunfishes satisfied the Bureau’s PSD sample size criteria. Again, the percentage of satisfactory sample sizes for PSD varied annually, with no clear temporal trend observed (Figure 6d).
We also tested for relationships between the percentage of satisfactory CPE and PSD sample sizes (both taxa) and the number of waterbodies electrofished annually. While only weakly negative, statistically insignificant relationships existed for largemouth bass (CPE: Pearson’s r = −0.16 [0.19, −0.47], t = −0.93, df = 32, p-value = 0.36; PSD: Pearson’s r = −0.11 [0.23, −0.44], t = −0.65, df = 32, p-value = 0.52), there were stronger negative, statistically significant relationships for sunfishes (CPE: Pearson’s r = −0.56 [−0.29, −0.76], t = −3.98, df = 32, p-value = <0.01; PSD: Pearson’s r = −0.53 [−0.24, −0.74], t = −3.55, df = 32, p-value = <0.01). While more closely inspecting the data, we noted that many samples that did not satisfy the Bureau’s CPE criteria were from tertiary waterbodies, and we note that several factors likely contributed to annual fluctuations, including logistical, resource, organizational, and environmental challenges.
From 1986 to 2019, the Bureau completed 470 creel surveys in 66 waterbodies. We regressed the number of creel surveys by year, estimating an increase in the number of surveys at a rate of about one every two years (b = 0.60, df = 31, p < 0.01, R2 = 0.52; Figure 7a) with an average of two never-before-surveyed waterbodies added each year (Figure 7b). There was a marked increase in never-before-surveyed waterbodies from 1998 to 2005 due to the expansion of the waterbodies monitored using creel surveys, including state park lakes [44].
The Bureau has not yet established sample size criteria for creel surveys. However, we used a sample size estimator (Supplementary Material, Equation (S11)) [31] with ±20% of the mean at 80% confidence for anglers’ catch per hour (CPH) and harvest per hour (HPH). We focused on largemouth bass, as it is the most popular sportfish statewide. Only 37% and 5% of creel surveys had sample sizes that met or exceeded the estimated sample size needed for CPH and HPH, respectively. Of note, only 12 creel surveys were conducted from 1994 to 1997 when the Bureau expanded its management responsibilities to include state park lakes, and managers’ efforts focused on conducting electrofishing surveys in these new waterbodies (Figure 6b and Figure 7). As an anecdote, when analyzing the data, we noticed that waterbodies in more populous areas of the state appeared to meet the sample size criteria more often than waterbodies in more rural areas. Like electrofishing surveys, similar factors likely contributed to lower creel survey sample sizes.

3.2. Qualitative Reflections and Perspectives

To understand the perspective of users of the monitoring program procedures, i.e., Bureau managers and administrators, we interviewed key personnel within the Bureau [15,54,55,56,57]. Through the Bureau’s Central Office, we contacted all personnel who oversee fisheries sampling, data collection, management, analysis, archiving, and documentation. Approximately 40% of personnel responded and participated in our survey. Among those we interviewed, 67% were fisheries managers (n = 4) and 33% were administrators (n = 2). In addition to interviews, we drew upon the experience of available monitoring program collaborators and computer application architects. Lastly, we reviewed a sample of past Bureau documents (i.e., reports, management plans, protocols, and manuals) to help identify or clarify aspects of the monitoring program and versions of FRAS.
We used a semi-structured interview approach to evaluate specific and general components of the Bureau’s inland fisheries monitoring program [55,57,58,59,60,61,62]. Our survey questions were score-based (3- and 5-point Likert scale) and open-ended (Table 1 and Table 2). Interviews were conducted via telephone in 2020–2021, as COVID-19 risks and restrictions prevented in-person interviews. Follow-up questions and discussions were made via telephone calls and emails.
The respondents’ years of experience in the fisheries profession ranged from 5 to 36 years (median = 18.5 years). Most respondents had worked for at least two inland fisheries agencies (min–max = 1–3). The year respondents began working for the Bureau ranged from 1986 to 2019, with more than half of the respondents having used at least two versions of the monitoring program and FRAS. When asked about the degree of change in sampling protocols (Q1, Table 1), routine fisheries analyses (Q2), and reporting and documentation (Q3) over their career, 50%, 60%, and 50% of respondents said there had been little to no change for each category, respectively (Figure 8). The degree of change indicated by respondents in each category correlated (Spearman ρ) with years of experience (sampling: ρ = 0.81; analyses: ρ = 0.77; reporting: ρ = 0.99) and starting date with the Bureau (sampling: ρ = −0.84; analyses: ρ = −0.83; reporting: ρ = −0.82).
Respondents either agreed or completely agreed with the statement that current sampling protocols are easy to use (Q4a), and 83% agreed that they capture reliable data (Q4b). Only 33% of respondents completely agreed that the current sampling protocols were transferable from waterbody to waterbody (Q4c; 50% neutral). As one respondent explained, “A lot of our state lakes, park lakes have shorelines which are extremely shallow, and we don’t, I feel like we don’t, get a good look at the overall population with fall electro[fishing] in some of those lakes” (Q5; Table 2).
When asked about the interpretability and clarity of FRAS outputs, respondents were neutral (17%) or agreed to completely agreed (83%) that FRAS outputs were easy to interpret (Q6a). Respondents were either neutral (33%) or agreed (67%) that FRAS enabled clear communication with others (Q6b). Oddly, 83% of respondents indicated that FRAS allowed for comparisons through space and time (Q6c), but currently, FRAS only analyzes and reports outputs from a single sampling event. After follow-up, we suspect respondents interpreted our question to mean that FRAS provides outputs that can be compared to past outputs in reports and fisheries management plans (see Q9 and Q10e below). Indeed, respondents agreed or completely agreed (100%) that past survey reports and fisheries management plans “clearly documents the historical conditions and management of waterbodies” (Q10e). Additionally, respondents agreed to a lesser degree when asked more specifically about FRAS’s capacity to enable spatial and temporal comparisons (Q8f), and only 50% of respondents agreed that the monitoring program, referring to both the standard sampling and analysis, provides a “big picture” perspective (Q10j).
Regarding standard analyses in FRAS, respondents mostly agreed (50%+) with statements Q8a–Q8f, which were about the usefulness and usability of the computer application (Figure 8). The highest-rated characteristics of FRAS were that it has a high utility, and the number and coverage of analyses were satisfactory (Table 1; 83% agree in both statements). Additionally, respondents scored the FRAS system as easy to use and providing clear, interpretable results (Q8d). The most distressing aspect of FRAS is that 50% of respondents were uncertain as to whether FRAS outputs were reliable or could be trusted (Q8e). When following up with some respondents, we understood that some respondents perceive FRAS as a “black box” program that may produce different outputs from hand calculations, which may arise from using different procedures, e.g., different methods to estimate mortality, or miscalculation.
Respondents tended to agree or completely agree (50%, both Qs) that their management process is made more efficient (Q10a) and effective (Q10b) by the monitoring program overall (Figure 8). Half of the respondents indicated that the monitoring program had helped them improve their knowledge of the biology/ecology of the waterbodies they manage (Q10c), and 67% of respondents had become more aware of stakeholder values in the waterbodies they manage (Q10d). Forty percent of respondents were neutral on whether the monitoring program enabled them to distinguish which management actions are most effective to meet objectives (Q10f and Q10g; 60% agreed or completely agreed for both questions).
Bureau personnel indicated that the monitoring program has helped them make objectives more specific, measurable, achievable, and realistic (Q11a–Q11d; Figure 8). When asked about the most common objectives in their fisheries management plans, respondents listed objectives related to fish relative abundance and angler’s catch rate, fish population structure and angler’s catch size, and fish habitat quality and availability (Table 2). The commonality of fisheries objectives is likely influenced by interactions that respondents have with Bureau colleagues and administrators and by the mission of the Bureau [42]. However, respondents were largely unaware of whether objectives from across the Bureau were consistent (80% replied “maybe”; Q11e) with their own (100% replied that objectives are consistent in the waterbodies they manage; Q11f). This is likely due to the organization and planning process of the Bureau; managers tailor management plans for waterbodies within their district and largely do not consult other managers.

4. Benefits, Challenges, and Opportunities of Monitoring Program Standardization

Standardization in the Bureau’s monitoring program has provided a foundation for consistent data collection, management, and analysis across the Mississippi’s diverse lentic waterbodies. A key outcome has been the development of a comprehensive database that enables the calculation of fish population and angler metrics at multiple spatial and temporal scales. This allows managers to generate summary statistics ranging from individual waterbodies in a single year to district- and statewide over the program’s life, facilitating transparent, data-informed planning [4,15,35,63] (Supplementary Material, Tables S1 and S2).
The steady implementation of standardized procedures has supported the data reliability of fish population metrics, particularly for high-priority sportfish taxa such as largemouth bass. Despite increased sampling intensity over time, analyses indicate that data reliability has been maintained in most waterbodies. This consistency is attributed to integrating standardized sampling methods, clear data protocols, and automated metric calculations in FRAS. As a result, managers have been able to prioritize sportfish taxa of the greatest recreational importance when capacity is limited, often focusing on largemouth bass over lower-priority taxa such as sunfishes [35,52]. While this prioritization reflects stakeholder interests, it highlights tradeoffs inherent in multi-taxa monitoring. Providing managers with reference points, sample size estimators, and automated analysis tools, such as those in FRAS, can help mitigate capacity challenges by promoting efficiency in routine fisheries management tasks.
Nonetheless, achieving consistent monitoring across all waterbodies and taxa remains challenging. Although primary and secondary waterbodies are scheduled at 3- and 5-year cycles, resource constraints, organizational changes, and environmental variability can disrupt this practice. To help gauge long-term monitoring expectations, we estimated the time required to achieve electrofishing sampling across the Bureau’s 273 managed waterbodies. Simulations suggest that, under the current conditions and protocols, it would take approximately 5.8 years to sample 50% of waterbodies, 22.9 years to reach 75%, and 37.1 years to achieve 95% coverage (Supplementary Material). These figures should translate for other agencies, assuming similar resources per waterbody. These findings underscore the need for strategic planning and demonstrate how standardized protocols facilitate tracking progress toward comprehensive monitoring goals.
Respondents highlighted the clear benefits of standardization, including improved efficiency, reduced manual errors, and enhanced capacity for developing management plans. The combination of standardized data management, analysis procedures, and documentation protocols powered by FRAS has provided a reliable and communicable framework for routine assessments. As noted by one participant, “Having data in the same format is invaluable when explaining changes in the fishery.” This sentiment aligns with broader recognition that standardized approaches improve assessment capacity and operational efficiency [4,5,8,15,64], granting managers more time to address emerging issues.
However, challenges persist. Respondents expressed concerns about FRAS functioning as a “black box,” particularly regarding limited flexibility and transparency in generating spatiotemporal comparisons. While effective for facilitating individual assessments, FRAS lacks integrated tools for synthesizing broader trends, constraining managers’ ability to contextualize data within broader Bureau goals. This limitation reduces opportunities to support adaptive management strategies and hinders the development of SMART (specific, measurable, achievable, realistic, and time-bound) objectives [65]. Additionally, the inability to validate outputs against alternative methods (e.g., calculations in spreadsheets) compounds concerns regarding trust in the automated analyses’ outputs. Moreover, in the absence of continuous refinement and clear communication of the rationale behind standardized procedures, there is a risk that protocols become rigid and disconnected from changing management needs or priorities [5].
As mentioned, respondents were concerned about the limited capacity of FRAS to visualize and interpret trends across space and time. This represents a missed opportunity to support holistic, large-scale fisheries management and organizational learning [66,67,68]. Establishing a formal adaptive management framework—where standardized monitoring serves as a foundation for iterative learning—could help address these deficiencies [66,67,68]. Without such frameworks, transforming data into actionable insights depends on individual managers’ institutional knowledge, risking discontinuity with personnel changes.
While standardization has enhanced data consistency, reliability, and operational efficiency within the Bureau’s monitoring program, addressing challenges related to flexibility, transparency, and comprehensive data utilization is critical. The continued development of analytical tools, fostering adaptive management frameworks, and the purposeful refinement of standardization processes will be essential for supporting sustainable inland recreational fisheries management in Mississippi.

5. Conclusions and Future Directions

Monitoring programs are essential for inland fisheries agencies to assess fish populations, habitats, and angler dynamics over space and time [2,3]. Standardizing data collection, management, and analysis enhances the ability to steward public resources effectively and efficiently. While the standardization of sampling methods and fisheries metrics has been emphasized for decades [8,14,15,16,31], less attention has been given to standardizing the process of data management and analysis within inland fisheries agencies.
The Bureau’s data management and analysis approach demonstrates how sound data protocols and consistent, automated analyses can generate reliable, long-term datasets supporting fisheries management at multiple scales [43]. Despite concerns regarding sampling consistency and trust in automated analyses, Bureau personnel recognize the value of standardized procedures in improving management efficiency and effectiveness.
With continuous advancements in technology, it seems that further improvements to data protocols could be adopted. Using computer tablets to enter field data into electronic forms directly has the potential to reduce errors in transcription from paper data sheets [34]. This would likely minimize copy errors and save time for the Bureau, as errors could be flagged upon entry, allowing corrections to be made while in the field. Furthermore, mobile device applications can be developed to sync with a centralized database(s) over cellular networks for immediate data storage and near real-time updating of FRAS.
Several opportunities exist to minimize the “black box” concerns of FRAS; we highlight two here. The first would be to increase the understanding and transparency of analyses in FRAS. For instance, application developers could host workshops or provide videos comparing and contrasting analysis outputs from multiple programs. Additionally, literature references, equations, and code for calculations could be linked within FRAS so managers can inspect the underlying calculations. Second, enhancing FRAS with integrated spatiotemporal summaries and visualizations would enable managers to assess fisheries across time and space without relying on external data retrieval or manual re-analysis. The web application development package shiny, in which FRAS 3.0+ was reprogrammed, is flexible and can accommodate a diversity of static and dynamic plots for spatiotemporal comparisons [49,69].
In addition to streamlining data protocols and analyses, there is ample opportunity to improve data and analysis reporting for management planning. Currently, managers must download individual tables, charts, and plots from FRAS. However, R packages, such as knitr [70] and officer [71], can enable comprehensive and selected data summary and analysis reports. Combined with dynamic spatiotemporal capacities, this could enable better “big picture” thinking of fisheries management within the state in a few ways. First, managers can use reference points and retrospective comparisons to better contextualize the current status of the fishery and help craft fishery objectives [4,69,72]. Ideally, FRAS will be enhanced to provide managers with such information with just a few clicks or keystrokes.
Second, monitoring data could be explicitly linked with the management objectives and outcomes of prior actions. This would help the managers better identify successful or unsuccessful management actions through adaptive management and improve the Bureau’s ability to implement successful management actions, even when institutional knowledge is lost. However, measures to “standardize” management objectives need exploration to overcome perceived differences [42,65,73,74]. These objectives could be prioritized by frequency and ranking in fisheries management plans, presuming that objectives that appear more often and earlier in management plans are of higher priority [74,75,76,77]. Likewise, a list of potential actions linked to objectives based on collective Bureau experience and literature could be made available. This list would allow managers to select objectives considering the status of a waterbody’s fisheries and then select potential actions linked to selected objectives, thus combining monitoring data with objectives and actions. This would allow for better retrospective analyses to estimate the effect of management, a foundation for continuous updating (i.e., learning), and enable better prediction of outcomes during management planning [66,67,68,73,74,76,78,79,80,81,82,83,84,85,86].
Inland recreational fisheries remain economically and societally significant [11,12]. In response to evolving technology, environmental challenges, and sociocultural pressures, inland fisheries agencies are refining their management frameworks [32,41,42,76,83,84,87]. However, the lack of standardization among agency monitoring program processes and analysis tools poses a challenge. Our study examined how the Mississippi Department of Wildlife, Fisheries, and Parks, Fisheries Bureau tackled this issue, highlighting both the benefits and challenges of implementing standard data management and analysis procedures. Our findings can inform agencies’ refinement of data protocols, including computer applications [32,33,41,42]. Additionally, they can guide developers in creating regional or national applications that can evaluate the merits and drawbacks of bottom-up frameworks that describe management objectives and actions and top-down frameworks that prescribe objectives and actions for inland fisheries. Ultimately, integrating standardized monitoring with adaptive management frameworks will better position agencies to transform data into actionable information, sustain institutional knowledge, and enhance long-term fisheries stewardship.

Supplementary Materials

Supporting information can be downloaded at: https://www.mdpi.com/article/10.3390/fishes10050235/s1. Figure S1. Field sampling form for electrofishing sampling, front. Includes blanks to record metadata and fish measures [13,44]. Figure S2. Field sampling form for electrofishing sampling, back. Includes reference tables for common fish species codes and target power outputs when electrofishing [13,44]. Figure S3. Electronic form for electrofishing data [48]. Figure S4. Field sampling form for creel surveys [13,44]. Includes blanks to record metadata and angler responses. Figure S5. Electronic form for creel survey data. Pop-up box displays the macro-enabled userform for data entry into spreadsheet [48]. Figure S6. Sketch of generic sagittal otolith illustrating annuli and location of nucleus and margin. Table S1. Summary statistics (1986–2019) of recreational angling metrics for popular sportfish species groups in Mississippi waterbodies—black bass species (largemouth bass Micropterus nigricans and spotted bass M. punctulatus), sunfish species (bluegill Lepomis macrochirus, redear sunfish L. microlophus, and longear sunfish L. megalotis), and crappie species (black crappie Pomoxis nigromaculatus and white crappie P. annularis). Statistics include the mean and standard deviation (SD). Table S2. Summary statistics (1986–2019) for metrics of population characteristics of popular sportfish species in Mississippi waterbodies—largemouth bass Micropterus nigricans, bluegill Lepomis macrochirus, redear sunfish L. microlophus, white crappie Pomoxis annularis, and black crappie P. nigromaculatus. Statistics include the mean, standard deviation (SD), and interquartile range (IQR, 25th–75th percentiles). Table S3. List of selected fisheries software. Additional references in supplementary material [88,89,90,91,92,93,94,95,96].

Author Contributions

Conceptualization, C.A.A. and M.E.C.; methodology, C.A.A. and M.E.C.; software, M.E.C. and C.A.A.; formal analysis, C.A.A.; investigation, C.A.A.; resources, M.E.C.; data curation, M.E.C. and C.A.A.; writing—original draft preparation, C.A.A.; writing—review and editing, C.A.A. and M.E.C.; visualization, C.A.A.; supervision, M.E.C.; project administration, M.E.C.; funding acquisition, M.E.C. All authors have read and agreed to the published version of the manuscript.

Funding

This work was funded by the Mississippi Department of Wildlife, Fisheries, and Parks under Sport Fish Restoration Grant # F19AF00638-04.

Institutional Review Board Statement

The study was conducted in accordance with the Declaration of Helsinki and approved by the Mississippi State University Human Research Protection Program/Internal Review Board guidelines for programmatic assessment and classified as exempt.

Informed Consent Statement

Though classified as exempt by the Mississippi State University Human Research Protection Program/Internal Review Board, informed consent was obtained from all participants in the study.

Data Availability Statement

Data were generated by the Mississippi Department of Wildlife, Fisheries, and Parks. Derived data supporting the findings of this study are available from the corresponding author upon request and approval by the Mississippi Department of Wildlife, Fisheries, and Parks.

Acknowledgments

Any use of trade, firm, or product names is for descriptive purposes only and does not imply endorsement by the U.S. Government. The findings and conclusions in this article are those of the authors and do not necessarily represent the views of the U.S. Fish and Wildlife Service. Much of this research was conducted while both authors were affiliated with Mississippi State University, Department of Wildlife, Fisheries, and Aquaculture. This publication is a contribution of the Forest and Wildlife Research Center at Mississippi State University. We appreciate the participation of current and former Mississippi Department of Wildlife, Fisheries, and Parks, Fisheries Bureau managers and administrators in our interviews and who made time to provide us access to data. We also thank Andrew Shamaskin and Larry Bull for their work programming and testing, respectfully, earlier versions of the FRAS web application. Finally, we sincerely thank Leandro (Steve) Miranda for supporting the Mississippi Department of Wildlife, Fisheries, and Parks inland fisheries monitoring program over the decades and for providing helpful insights and comments on an earlier version of this manuscript.

Conflicts of Interest

The authors declare no conflicts of interest.

Abbreviations

The following abbreviations are used in this manuscript:
COVID-19Coronavirus disease 2019
CPECatch per effort
CPHAnglers’ catch per hour
CSVComma-Separated Values
CVCoefficient of variation
fEffort
FRASFisheries Resources Analysis System
HHarvest
HPHAnglers’ harvest per hour
MDWFPMississippi Department of Wildlife, Fisheries, and Parks
MSMicrosoft
PSDProportional size distribution
Q#Question number
QCQuality control
SDStandard deviation
SMARTSpecific, measurable, achievable, relevant, time-bound
USAUnited States of America
WrRelative weight
XLSMMicrosoft Excel Macro-Enabled Workbook
XLSXMicrosoft Excel Open Extensible Markup Language Spreadsheet

References

  1. Pope, K.L.; Lochmann, S.E.; Young, M.K. Methods for Assessing Fish Populations. In Inland Fisheries Management in North America; Hubert, W.A., Quist, M.C., Eds.; American Fisheries Society: Bethesda, MD, USA, 2010; pp. 325–351. ISBN 978-1-934874-16-5. [Google Scholar]
  2. Noble, R.L.; Austen, D.J.; Pegg, M.A. Fisheries Management Study Design Considerations. In Analysis and Interpretation of Freshwater Fisheries Data; Guy, C.S., Brown, M.L., Eds.; American Fisheries Society: Bethesda, MD, USA, 2007; pp. 31–49. [Google Scholar]
  3. Bonar, S.A.; Contreras-Balderas, S.; Iles, A.C. An Introduction to Standardized Sampling. In Standard Methods for Sampling North American Freshwater Fishes; Bonar, S.A., Hubert, W.A., Willis, D.W., Eds.; American Fisheries Society: Bethesda, MD, USA, 2009; pp. 1–12. [Google Scholar]
  4. Lester, N.P.; Sandstrom, S.; de Kerckhove, D.T.; Armstrong, K.; Ball, H.; Amos, J.; Dunkley, T.; Rawson, M.; Addison, P.; Dextrase, A.; et al. Standardized Broad-Scale Management and Monitoring of Inland Lake Recreational Fisheries: An Overview of the Ontario Experience. Fisheries 2020, 46, 107–118. [Google Scholar] [CrossRef]
  5. Bonar, S.A.; Hubert, W.A. Standard Sampling of Inland Fish: Benefits, Challenges, and a Call for Action. Fisheries 2002, 27, 10–17. [Google Scholar] [CrossRef]
  6. USFWS Congressional and Legislative Affairs Federal Aid in Sport Fish Restoration Act. Available online: https://www.fws.gov/law/federal-aid-sport-fish-restoration-act-1950 (accessed on 5 December 2019).
  7. Analysis and Interpretation of Freshwater Fisheries Data; Guy, C.S., Brown, M.L., Eds.; American Fisheries Society: Bethesda, MD, USA, 2007; ISBN 978-1-888569-77-3. [Google Scholar]
  8. Standard Methods for Sampling North American Freshwater Fishes; Bonar, S.A., Hubert, W.A., Willis, D.W., Eds.; American Fisheries Society: Bethesda, MD, USA, 2009; ISBN 978-1-934874-10-3. [Google Scholar]
  9. Inland Fisheries Management in North America; Hubert, W.A., Quist, M.C., Eds.; American Fisheries Society: Bethesda, MD, USA, 2010; ISBN 978-1-934874-16-5. [Google Scholar]
  10. Fisheries Techniques; Zale, A.V., Parrish, D.L., Sutton, T.M., Eds.; American Fisheries Society: Bethesda, MD, USA, 2012; ISBN 978-1-934874-29-5. [Google Scholar]
  11. Allen, T.; Olds, E.; Southwick, R.; Scuderi, B.; Caputo, L.; Howlett, D. Sportfishing in America: An Economic Force; American Sportfishing Association: Alexandria, VA, USA, 2018. [Google Scholar]
  12. Recreational Boating; Fishing Foundation; The Outdoor Foundation. 2018 Special Report on Fishing; Recreational Boating & Fishing Foundation and the Outdoor Foundation: Alexandria, VA, USA; Washington, DC, USA, 2018. [Google Scholar]
  13. Mississippi Department of Wildlife Conservation. Guidelines for Standard Lake and Reservoir Surveys; Mississippi Department of Wildlife Conservation: Jackson, MS, USA, 1986. [Google Scholar]
  14. Gabelhouse, D.; Anderson, R.; Aggus, L.; Austen, D.; Bruch, R.; Dean, J.; Doherty, F.; Dunning, D.; Green, D.; Hoeft, M.; et al. Fish Sampling and Data Analysis Techniques Used by Conservation Agencies in the U.S. and Canada; Fisheries Techniques Standardization Committee, Fisheries Management Section, American Fisheries Society: Bethesda, MD, USA, 1992; p. 118. [Google Scholar]
  15. Smith, B.J.; Blackwell, B.G. Adoption of AFS Standard Methods: The South Dakota Experience. Fisheries 2019, 44, 567–575. [Google Scholar] [CrossRef]
  16. Quist, M.C.; Bonvechio, K.I.; Allen, M.S. Statistical Analysis and Data Management. In Standard Methods for Sampling North American Freshwater Fishes; Bonar, S.A., Hubert, W.A., Willis, D.W., Eds.; American Fisheries Society: Bethesda, MD, USA, 2009; pp. 171–194. [Google Scholar]
  17. Quist, M.C.; Pegg, M.A.; DeVries, D.R. Age and Growth. In Fisheries Techniques; Zale, A.V., Parrish, D.L., Sutton, T.M., Eds.; American Fisheries Society: Bethesda, MD, USA, 2012; pp. 677–732. [Google Scholar]
  18. Neumann, R.M.; Guy, C.S.; Willis, D.W. Length, Weight, and Associated Indicies. In Fisheries Techniques; Zale, A.V., Parrish, D.L., Sutton, T.M., Eds.; American Fisheries Society: Bethesda, MD, USA, 2012; pp. 637–676. [Google Scholar]
  19. Allen, M.S.; Hightower, J.E. Fish Population Dynamics: Mortality, Growth, and Recruitment. In Inland Fisheries Management in North America; American Fisheries Society: Bethesda, MD, USA, 2010; pp. 43–80. [Google Scholar]
  20. Odum, E.P. Fundamentals of Ecology; W. B. Saunders Company: Philadelphia, PA, USA, 1953. [Google Scholar]
  21. McMahon, T. Size and Shape in Biology. Science 1973, 179, 1201–1204. [Google Scholar] [CrossRef]
  22. Nichols, J.D.; Williams, B.K. Monitoring for Conservation. Trends Ecol. Evol. 2006, 21, 668–673. [Google Scholar] [CrossRef]
  23. Conroy, M.J.; Peterson, J.T. Integrating Management, Research, and Monitoring: Balancing the 3-Legged Stool. Gamebird 2006, 6, 2–10. [Google Scholar]
  24. Brouder, M.J.; Iles, A.C.; Bonar, S.A. Length Frequency, Condition, Growth, and Catch per Effort Indices for Common North American Fishes. In Standard Methods for Sampling North American Freshwater Fishes; Bonar, S.A., Hubert, W.A., Willis, D.W., Eds.; American Fisheries Society: Bethesda, MD, USA, 2009; pp. 231–282. [Google Scholar]
  25. Schneider, J.C. Michigan Manual of Fisheries Survey Methods II: With Periodic Updates; Michigan Department of Natural Resources, Fisheries Special Report 25: Ann Arbor, MI, USA, 2000; p. 395. [Google Scholar]
  26. Bryan, S.D. Standard Fish Sampling Protocol for State of Arizona Waters; Arizona Game and Fish Department: Phoenix, AZ, USA, 2004. [Google Scholar]
  27. Oakley, C.; Dorsey, L. Data Collection & Analysis Guidelines for the Piedmont Region; North Carolina Wildlife Resources Commission, Federal Aid in Sport Fish Restoration: Raleigh, NC, USA, 2013; pp. 1–6. [Google Scholar]
  28. Marteney, R.; Aberson, L.; Bever, C.; Lynott, S.; Reinke, J.; Shaw, M. Standard Fish Survey Techniques for Small Lakes and Reservoirs; Kansas Department of Wildlife and Parks: Shawnee, KS, USA, 2010. [Google Scholar]
  29. Fisher, W.L.; Bozek, M.A.; Vokoun, J.C.; Jacobson, R.B. Freshwater Aquatic Habitat Measurements. In Fisheries Techniques; Zale, A.V., Parrish, D.L., Sutton, T.M., Eds.; American Fisheries Society: Bethesda, MD, USA, 2012; pp. 101–161. [Google Scholar]
  30. Jones, C.M.; Pollock, K.H. Recreational Survey Methods: Estimation of Effort, Harvest, and Released Catch. In Fisheries Techniques; Zale, A.V., Parrish, D.L., Sutton, T.M., Eds.; American Fisheries Society: Bethesda, MD, USA, 2012; pp. 883–919. [Google Scholar]
  31. Brown, M.L.; Allen, M.S.; Beard, T.D. Data Management and Statistical Techniques. In Fisheries Techniques; Zale, A.V., Parrish, D.L., Sutton, T.M., Eds.; American Fisheries Society: Bethesda, MD, USA, 2012; pp. 17–28. [Google Scholar]
  32. Clark, R.D., Jr.; Garling, D.L.; Lackey, R.T. Computer Use in Freshwater Fisheries Management. Fisheries 1977, 2, 21–23. [Google Scholar] [CrossRef]
  33. Bayley, P.B.; Austen, D.J. Fisheries Analysis System: Data Management and Analysis for Fisheries Management and Research. In Mathematical Analysis of Fish Stock Dynamics; American Fisheries Society: Bethesda, MD, USA, 1989; pp. 199–205. [Google Scholar]
  34. Seigel, R.A. Applicability of “Tablet” Computers for Use by Field Biologists. Herpetol. Rev. 2013, 44, 82–85. [Google Scholar]
  35. Bonvechio, K.I.; Paudyal, R.; Crandall, C.; Carlson, A.K. Survey Evaluation of Florida’s Freshwater Fisheries Long-Term Monitoring Program. Fishes 2023, 8, 216. [Google Scholar] [CrossRef]
  36. Schnute, J.T. A General Framework for Developing Sequential Fisheries Models. Can. J. Fish. Aquat. Sci. 1994, 51, 1676–1688. [Google Scholar] [CrossRef]
  37. Schnute, J.T.; Richards, L.J. Stock Assessment for the 21st Century. Fisheries 1994, 19, 10–16. [Google Scholar] [CrossRef]
  38. Miranda, L.E. Fisheries Resource Analysis System; Mississippi Department of Wildlife, Fisheries and Parks: Jackson, MS, USA, 1990. [Google Scholar]
  39. Holder, P.E.; Jeanson, A.L.; Lennox, R.J.; Brownscombe, J.W.; Arlinghaus, R.; Danylchuk, A.J.; Bower, S.D.; Hyder, K.; Hunt, L.M.; Fenichel, E.P.; et al. Preparing for a Changing Future in Recreational Fisheries: 100 Research Questions for Global Consideration Emerging from a Horizon Scan. Rev. Fish Biol. Fish. 2020, 30, 137–151. [Google Scholar] [CrossRef]
  40. Miranda, L.E.; Coppola, G.; Boxrucker, J. Reservoir Fish Habitats: A Perspective on Coping with Climate Change. Rev. Fish. Sci. Aquac. 2020, 28, 478–498. [Google Scholar] [CrossRef]
  41. Jentoft, S. Institutions in Fisheries: What They Are, What They Do, and How They Change. Mar. Policy 2004, 28, 137–149. [Google Scholar] [CrossRef]
  42. Aldridge, C.A.; Miranda, L.E.; Colvin, M.E. Themes of Contemporary Inland Fisheries Goals. Fisheries 2021, 46, 34–39. [Google Scholar] [CrossRef]
  43. Miranda, L.E.E.; Bull, L.A.A.; Colvin, M.E.E.; Hubbard, W.D.D.; Pugh, L.L.L. Segmentation of Mississippi’s Natural and Artificial Lakes. Lake Reserv. Manag. 2018, 34, 376–397. [Google Scholar] [CrossRef]
  44. Miranda, L.E. Monitoring Protocols for Inland Fisheries; Mississippi Wildlife, Fisheries & Parks: Jackson, MS, USA, 2005; p. 314. [Google Scholar]
  45. Miranda, L.E.; Boxrucker, J. Warmwater Fish in Large Standing Waters. In Standard Methods for Sampling North American Freshwater Fishes; Bonar, S.A., Hubert, W.A., Willis, D.W., Eds.; American Fisheries Society: Bethesda, MD, USA, 2009; pp. 29–42. [Google Scholar]
  46. Miranda, L.E. Standardizing Electrofishing Power for Boat Electrofishing. In Standard Methods for Sampling North American Freshwater Fishes; American Fisheries Society: Bethesda, MD, USA, 2009; pp. 223–230. [Google Scholar]
  47. R Core Team. R: A Language and Environment for Statistical Computing; R Foundation for Statistical Computing: Vienna, Austria, 2019. [Google Scholar]
  48. Miranda, L.E.; Colvin, M.E.; Shamaskin, A.; Aldridge, C.A. Review, Revision and Development of New Monitoring Protocols to Facilitate the Meeting of Goals and Objectives of Freshwater Fisheries Management in Mississippi; Mississippi Department of Wildlife, Fisheries and Parks: Jackson, MS, USA, 2019. [Google Scholar]
  49. Chang, W.; Cheng, J.; Allaire, J.; Sievert, C.; Schloerke, B.; Xie, Y.; Allen, J.; McPherson, J.; Dipert, A.; Borges, B. Shiny: Web Application Framework for R. 2023. Available online: https://CRAN.R-project.org/package=shiny (accessed on 14 May 2025).
  50. Kim, D.; Taylor, A.T.; Near, T.J. Phylogenomics and Species Delimitation of the Economically Important Black Basses (Micropterus). Sci. Rep. 2022, 12, 9113. [Google Scholar] [CrossRef]
  51. Miranda, L.E.; Hubbard, W.D.; Sangare, S.; Holman, T. Optimizing Electrofishing Sample Duration for Estimating Relative Abundance of Largemouth Bass in Reservoirs. N. Am. J. Fish. Manag. 1996, 16, 324–331. [Google Scholar] [CrossRef]
  52. Bonvechio, K.I.; Sawyers, R.E.; Leone, E.; Crawford, S. Increasing the Efficiency of Florida’s Freshwater Fisheries Long-Term Monitoring Program. J. Southeast. Assoc. Fish Wildl. Agencies 2014, 1, 7–14. [Google Scholar]
  53. Miranda, L.E. Sample Sizes for Estimating and Comparing Proportion-Based Indices. N. Am. J. Fish. Manag. 1993, 13, 383–386. [Google Scholar] [CrossRef]
  54. Hayes, D.; Baker, E.; Bednarz, R.; Borgeson, D.; Braunscheidel, J.; Breck, J.; Bremigan, M.; Harrington, A.; Hay, R.; Lockwood, R.; et al. Developing a Standardized Sampling Program: The Michigan Experience. Fisheries 2003, 28, 18–25. [Google Scholar] [CrossRef]
  55. Barclay, K.; Voyer, M.; Mazur, N.; Payne, A.M.; Mauli, S.; Kinch, J.; Fabinyi, M.; Smith, G. The Importance of Qualitative Social Research for Effective Fisheries Management. Fish. Res. 2017, 186, 426–438. [Google Scholar] [CrossRef]
  56. Morales, N.A.; Martin, A. Evaluating a Stakeholder-Driven Bass Regulation Change in Florida: Agency Staff and Stakeholder Perspectives. Fisheries 2018, 43, 361–367. [Google Scholar] [CrossRef]
  57. Young, J.C.; Rose, D.C.; Mumby, H.S.; Benitez-Capistros, F.; Derrick, C.J.; Finch, T.; Garcia, C.; Home, C.; Marwaha, E.; Morgans, C.; et al. A Methodological Guide to Using and Reporting on Interviews in Conservation Science Research. Methods Ecol. Evol. 2018, 9, 10–19. [Google Scholar] [CrossRef]
  58. Born, S.M.; Genskow, K.D.; Filbert, T.L.; Hernandez-Mora, N.; Keeper, M.L.; White, K.A. Socioeconomic and Institutional Dimensions of Dam Removals: The Wisconsin Experience. Environ. Manag. 1998, 22, 359–370. [Google Scholar] [CrossRef]
  59. Austin, Z.; Sutton, J. Qualitative Research: Getting Started. Can. J. Hosp. Pharm. 2014, 67, 436–440. [Google Scholar] [CrossRef]
  60. Sutton, J.; Austin, Z. Qualitative Research: Data Collection, Analysis, and Management. Can. J. Hosp. Pharm. 2015, 68, 226–231. [Google Scholar] [CrossRef]
  61. Jentoft, S. Beyond Fisheries Management: The Phronetic Dimension. Mar. Policy 2006, 30, 671–680. [Google Scholar] [CrossRef]
  62. Bresee, L.C. An Introduction to Developing Surveys for Pharmacy Practice Research. Can. J. Hosp. Pharm. 2014, 67, 286–291. [Google Scholar] [CrossRef]
  63. Drexler, J.Z.; Raine, H.; Harrington, C.L.; Winter, K.B.; Fraiola, K.; Browning, J.; Burgett, J.; Burney, D.A.; Falinski, K.; Fisher, S.; et al. The Scientific Benefits of a Statewide, Standardized, Coastal Wetland Monitoring Program in Hawa‘i. Ecol. Evol. 2025, 15, e71293. [Google Scholar] [CrossRef]
  64. Bonar, S.A.; Mercado-Silva, N.; Hubert, W.A.; Beard, T.D.; Dave, G.; Kubečka, J.; Graeb, B.D.S.S.; Lester, N.P.; Porath, M.; Winfield, I.J.; et al. Standard Methods for Sampling Freshwater Fishes: Opportunities for International Collaboration. Fisheries 2017, 42, 150–156. [Google Scholar] [CrossRef]
  65. Aldridge, C.A.; Colvin, M.E. Writing SMART Objectives for Natural Resource and Environmental Management. Ecol. Solut. Evid. 2024, 5, e12313. [Google Scholar] [CrossRef]
  66. Walters, C.J.; Hilborn, R. Ecological Optimization and Adaptive Management. Annu. Rev. Ecol. Syst. 1978, 9, 157–188. [Google Scholar] [CrossRef]
  67. Conroy, M.; Peterson, J. Decision Making in Natural Resource Management: A Structured, Adaptive Approach; Wiley-Blackwell: Hoboken, NJ, USA, 2013; ISBN 978-1-118-50623-3. [Google Scholar]
  68. Walters, C.J.; Holling, C.S. Large-Scale Management Experiments and Learning by Doing. Ecology 1990, 71, 2060–2068. [Google Scholar] [CrossRef]
  69. Anderson, S.C.; Keppel, E.A.; Edwards, A.M. Reproducible Visualization of Raw Fisheries Data for 113 Species Improves Transparency, Assessment Efficiency, and Monitoring. Fisheries 2020, 45, 535–543. [Google Scholar] [CrossRef]
  70. Xie, Y.H. Dynamic Documents with R and knitr, 2nd ed.; Chapman and Hall/CRC: London, UK, 2015; ISBN 978-1498716963. [Google Scholar]
  71. Gohel, D.; Moog, S.; Heckermann, M. Officer: Manipulation of Microsoft Word and PowerPoint Documents. 2025. Available online: https://github.com/davidgohel/officer (accessed on 14 May 2025).
  72. Regular, P.M.; Robertson, G.J.; Rogers, R.; Lewis, K.P. Improving the Communication and Accessibility of Stock Assessment Using Interactive Visualization Tools. Can. J. Fish. Aquat. Sci. 2020, 77, 1592–1600. [Google Scholar] [CrossRef]
  73. McMullin, S.L.; Pert, E. The Process of Fisheries Management. In Inland Fisheries Management in North America; Hubert, W.A., Quist, M.C., Eds.; American Fisheries Society: Bethesda, MD, USA, 2010; pp. 133–155. [Google Scholar]
  74. Barber, W.E.; Taylor, J.N. The Importance of Goals, Objectives, and Values in the Fisheries Management Process and Organization: A Review. N. Am. J. Fish. Manag. 1990, 10, 365–373. [Google Scholar] [CrossRef]
  75. Drucker, P. The Practice of Management; Harper & Row: New York, NY, USA, 1954; ISBN 0-08-094236-9. [Google Scholar]
  76. Bennett, D.H.; Hampton, E.L.; Lackey, R.T. Current and Future Fisheries Management Goals: Implications for Future Management. Fisheries 1978, 3, 10–14. [Google Scholar] [CrossRef]
  77. Anderson, S.H. Managing Our Wildlife Resources; Prentice-Hall: Upper Saddle River, NJ, USA, 2002; ISBN 978-0-13-019577-7. [Google Scholar]
  78. Runge, M.C.; Grand, J.B.; Mitchell, M.S. Structured Decision Making. In Wildlife Management and Conservation: Contemporary Principles and Practices; Krausman, P.R., Cain, J.W., Eds.; The John Hopkins University Press: Baltimore, MD, USA, 2013; pp. 51–72. ISBN 978-1-4214-0987-0. [Google Scholar]
  79. Gregory, R.; Failing, L.; Harstone, M.; Long, G.; McDaniels, T.; Ohlson, D. Structured Decision Making: A Practical Guide to Environmental Management Choices; John Wiley & Sons: West Sussex, UK, 2012; ISBN 1-4443-9853-9. [Google Scholar]
  80. Bain, M.B. Structured Decision Making in Fisheries Management: Trout Fishing Regulations on the Au Sable River, Michigan. N. Am. J. Fish. Manag. 1987, 7, 475–481. [Google Scholar] [CrossRef]
  81. Powers, J.E.; Lackey, R.T.; Zuboy, J.R. Decision-Making in Recreational Fisheries Management: An Analysis. Trans. Am. Fish. Soc. 1975, 104, 630–634. [Google Scholar] [CrossRef]
  82. Powers, J.E.; Lackey, R.T. A Multiattribute Utility Function for Management of a Recreational Resource. Va. Jouranl Sci. 1976, 27, 191–198. [Google Scholar]
  83. Lackey, R.T. Fisheries Management: Integrating Societal Preference, Decision Analysis, and Ecological Risk Assessment. Environ. Sci. Policy 1998, 1, 329–335. [Google Scholar] [CrossRef]
  84. Larkin, P.A. An Epitaph for the Concept of Maximum Sustained Yield. Trans. Am. Fish. Soc. 1977, 106, 1–11. [Google Scholar] [CrossRef]
  85. Walters, C.J.; Hilborn, R. Adaptive Control of Fishing Systems. J. Fish. Res. Board Can. 1975, 33, 145–159. [Google Scholar] [CrossRef]
  86. Aldridge, C. Towards Structured Planning and Learning at the State Fisheries Agency Scale. Ph.D. Thesis, Mississippi State University, Stakville, MS, USA, 2022. [Google Scholar]
  87. Lackey, R.T. Fisheries: History, Science, and Management. In Water Encyclopedia: Surface and Agricultural Water; Lehr, J.H., Keeley, J., Eds.; John Wiley and Sons: New York, NY, USA, 2005; pp. 121–129. [Google Scholar]
  88. Reynolds, J.B.; Kolz, A.L. Electrofishing. In Fisheries Techniques; Zale, A.V., Parrish, D.L., Sutton, T.M., Eds.; American Fisheries Society: Bethesda, MD, USA, 2012; pp. 305–361. [Google Scholar]
  89. Dolan, C.R.; Miranda, L.E. Immobilization Thresholds of Electrofishing Relative to Fish Size. Trans. Am. Fish. Soc. 2003, 132, 969–976. [Google Scholar] [CrossRef]
  90. Dolan, C.R.; Miranda, L.E. Injury and Mortality of Warmwater Fishes Immobilized by Electrofishing. N. Am. J. Fish. Manag. 2004, 24, 118–127. [Google Scholar] [CrossRef]
  91. Quist, M.C.; Isermann, D.A. Age and Growth of Fishes: Principles and Techniques; American Fisheries Society: Bethesda, MD, USA, 2017. [Google Scholar]
  92. Bonds, C.C.; Van Zee, B. Pitfalls of Relying Solely on Size Structure Indices and Catch per Unit Effort for Management Decisions. In Inland Fisheries Management in North America; Hubert, W.A., Quist, M.C., Eds.; American Fisheries Society: Bethesda, MD, USA, 2010; pp. 332–335. [Google Scholar]
  93. Gabelhouse, D.W. A Length-Categorization. North Am. J. Fish. Manag. 1984, 4, 273–285. [Google Scholar] [CrossRef]
  94. Wege, G.J.; Anderson, R.O. Relative Weight (Wr): A New Index of Condition for Largemouth Bass. In AFS Special Publication 5; Novinger, G., Dillard, J., Eds.; American Fisheries Society: Bethesda, MD, USA, 1978; pp. 79–91. [Google Scholar]
  95. Arlinghaus, R.; Cooke, S.J.; Lyman, J.; Policansky, D.; Schwab, A.; Suski, C.; Sutton, S.G.; Thorstad, E.B. Understanding the Complexity of Catch-and-Release in Recreational Fishing: An Integrative Synthesis of Global Knowledge from Historical, Ethical, Social, and Biological Perspectives. Rev. Fish. Sci. 2007, 15, 75–167. [Google Scholar] [CrossRef]
  96. Sass, G.G.; Gaeta, J.W.; Allen, M.S.; Suski, C.D.; Shaw, S.L. Effects of Catch-and-Release Angling on a Largemouth Bass (Micropterus salmoides) Population in a North Temperate Lake, 2001–2005. Fish. Res. 2018, 204, 95–102. [Google Scholar] [CrossRef]
Figure 1. Map of primary (rose), secondary (cobalt), and tertiary (olive) natural and artificial waterbodies managed by the Mississippi Department of Wildlife, Fisheries, and Parks, Fisheries Bureau in its five districts: Coastal, Central, Delta, Northwest (NW), and Northeast (NE). Blue lines indicate major rivers.
Fishes 10 00235 g001
Figure 2. Overview of workflow by Mississippi Department of Wildlife, Fisheries, and Parks, Fisheries Bureau managers using standard sampling protocols and the Fisheries Resources Analysis System version 3.1. Photo credits: MDWFP.
Fishes 10 00235 g002
Figure 3. The data management process, from recording in the field to archiving within the Mississippi Department of Wildlife, Fisheries, and Parks, Fisheries Bureau. QC = quality control, MS = Microsoft, XLSM = Macro-Enabled Workbook, XLSX = Extensible Markup Language Spreadsheet, and FRAS = Fisheries Resources Analysis System.
Fishes 10 00235 g003
Figure 4. An example data analysis module page within the Fisheries Resources Analysis System version 3.1. The dropdown menu shows modules available to Mississippi Department of Wildlife, Fisheries, and Parks, Fisheries Bureau managers. The pop-up window shows a File Explorer window for selecting Microsoft Excel Macro-Enabled Workbook (XLSM), Microsoft Excel Extensible Markup Language Spreadsheet (XLSX), or legacy custom text files used in earlier versions.
Fishes 10 00235 g004
Figure 5. Lists of analyses and outputs that are available in the Fisheries Resources Analysis System (FRAS) version 3.1, with example outputs displayed in the computer application. CPUE = catch per unit effort, Wr = relative weight, PSD-X = proportional size distribution, n = number of samples, SD = standard deviation, SE = standard error, WD = weekday, and WE = weekend.
Fishes 10 00235 g005
Figure 6. Trends in the number of waterbodies electrofished ((a); dashed lines = prediction intervals), the number of new or never-before-electrofished waterbodies (b), the percent of samples meeting the catch per effort (CPE) reliability index (c), and the percent of samples meeting the proportional size distribution (PSD) reliability index (d) from 1986 to 2019.
Fishes 10 00235 g006
Figure 7. Trends in the number of waterbodies surveyed using creel surveys ((a); dashed lines = prediction intervals) and the number of new or never-before-surveyed waterbodies (b) from 1986 to 2019.
Fishes 10 00235 g007
Figure 8. Distribution of respondents’ score-based responses. Question IDs displayed on left correspond to questions in Table 1. The sample size for questions can be found in Table 1.
Fishes 10 00235 g008
Table 1. Score-based questions asked to key Bureau personnel—question responses are represented in Figure 8. Greek letters indicate the response scale: α = 5-pt. scale (1 = no change, 3 = moderate change, 5 = complete change); β = 5-pt. scale (1 = completely disagree, 3 = neutral, 5 = completely agree); and γ = 3-pt. scale (1 = no, 3 = maybe, 5 = yes).
IDQuestionnMean Score (SD)
Q1αHow much change in sampling methods has occurred over your career?62.2 (1.0)
Q2 α How much change in routine fisheries analyses has occurred over your career?52.0 (1.0)
Q3 αHow much change in reporting and documentation (i.e., survey reports and fisheries management plans) has occurred over your career?43.3 (2.1)
Q4aβThe current sampling protocols are easy to use.64.5 (0.5)
Q4bβThe current sampling protocols capture reliable data.63.7 (0.8)
Q4cβThe current sampling protocols are transferable from waterbody to waterbody.63.5 (1.2)
Q6aβFRAS outputs are easy to interpret.64.3 (0.8)
Q6bβFRAS outputs enable clear communication.64.2 (0.8)
Q6cβFRAS outputs allow for comparisons through space and time.63.8 (0.8)
Q8aβFRAS has a high utility in your fisheries management process.64.2 (0.8)
Q8bβFRAS covers the appropriate or necessary analyses.64.0 (0.6)
Q8cβFRAS is easy to use or intuitive.64.0 (1.5)
Q8dβFRAS outputs are clear, understandable, or easy to interpret.64.0 (1.1)
Q8eβFRAS outputs are reliable or can be trusted.63.5 (0.5)
Q8fβFRAS provides an adequate scope for spatial and temporal comparisons.63.3 (1.6)
Q10aβThe monitoring program* has increased your management efficiency.43.8 (1.0)
Q10bβThe monitoring program has increased your management effectiveness.43.8 (1.0)
Q10cβThe monitoring program has increased your biological and ecological knowledge of the waterbodies you manage.43.5 (1.7)
Q10dβThe monitoring program has increased your awareness of stakeholder values in the waterbodies you manage.33.0 (1.8)
Q10eγThe monitoring program clearly documents the historical conditions and management of waterbodies.54.8 (0.4)
Q10fγThe monitoring program has allowed for learning of which management actions work to meet objectives.54.0 (1.0)
Q10gγThe monitoring program has improved waterbody-specific management.54.2 (1.1)
Q10hγThe monitoring program supports sustainable recreational fisheries.64.3 (1.0)
Q10iβThe monitoring program makes you feel like you contribute to the higher societal goals of the Bureau.44.3 (1.0)
Q10jβThe monitoring program help maintain a “big picture” perspective.43.8 (1.5)
Q11aObjectives in your fisheries management plans have become more specific through use of the monitoring program.54.2 (0.4)
Q11bObjectives in your fisheries management plans have become more measurable (i.e., linked to metrics) through use of the monitoring program.44.3 (1.0)
Q11cObjectives in your fisheries management plans have become more achievable through use of the monitoring program.54.0 (1.0)
Q11dObjectives in your fisheries management plans have become more realistic through use of the monitoring program.34.0 (1.0)
Q11eObjectives for the waterbodies you manage are consistent (within zone) through use of the monitoring program.55.0
Q11fObjectives between the waterbodies you manage and waterbodies other manage are consistent (statewide) through use of the monitoring program.53.4 (0.9)
Note: Monitoring program is defined here as protocols for program components (i.e., sampling, analysis, and documentation) and integrating new technologies (e.g., sampling methods, metrics, and analysis software).
Table 2. Open-ended questions asked to key Bureau personnel.
IDQuestionNVerbatim ExamplesSynthesis
Q5Is there anything about the current sampling protocols that are or are not working well for you?5
“Data quality is heavily dependent on who collects it.”
“A lot of our state lakes, park lakes have shorelines which are extremely shallow, and we don’t, I feel like we don’t, get a good look at the overall population with fall electro[fishing] in some of those lakes.”
Most sampling methods work well, but validating, updating, or expanding them, especially in ways that accommodate difficult-to-access areas, would increase confidence in reliability.
Q7Is there anything about the current routine fisheries analyses in FRAS that are or are not working well for you?4
“Post-sample weighting module within the access creel has been very beneficial, just from a scheduling standpoint.”
“In FRAS 3 you have to save about 15 different Excel files, instead of having just one printout.”
“There are still some things I collect that I pull into Excel and do.”
FRAS provides a quick and efficient way to conduct routine fisheries analyses, but a “black box” approach to data analysis seeds some skepticism. However, further automation is not completely unwelcome, e.g., the compilation of outputs into a standardized report.
Q9Do you think the monitoring program—protocols for program components (i.e., sampling, analysis, and documentation)—and integrating new technologies (i.e., sampling methods, metrics, analysis software) has better equipped you to address angler questions, concerns, complaints, and expectations?5
“Yes, because it allows me to show hard data on the state of the fishery, health of the fish, etc. to either counter or support anecdotal evidence from individual anglers.”
“Having data in the same format is invaluable when explaining changes in the fishery.”
“It’s a much more streamlined report that specifically addresses objectives in the fisheries management plans.”
Proper data management, analysis, and documentation enhanced by technology, like computer applications, provides managers with trustworthy and communicable information needed to manage both fish and angler populations.
Q12Do you think the monitoring program—protocols for program components (i.e., sampling, analysis, and documentation)—and integrating new technologies (i.e., sampling methods, metrics, analysis software) has helped you clarify objectives for fisheries management plans?4
“It took me several years of experience before I got a handle for what was a sustainable harvest per hour in creel and what was a good catch per hour in electrofishing… I just had to kind of figure it out on my own.”
“It definitely gives clearly defined objectives that easily allow me to determine how effectively our management efforts are working, or not working.”
The monitoring program has provided managers with quantitative ranges of common fisheries metrics. The process for constructing and clarifying objectives may be improved by using SMART criteria (i.e., specific, measurable, achievable, realistic, and time-bound).
Q13What are the most common objectives included in your fisheries management plans?5
“Catch rate [or relative abundance] and size structure [PSD] from electrofishing.”
“Maintain fish [relative] abundance and size structure [PSD] of fish. Both vary dependent on the lake, but usually either in the 75 percentile of Mississippi lakes or the median of Mississippi lakes.”
“[Anglers’] Catch rate and age structure [mean length at age] on angler harvest.”
“Maintain angler[s’] catch rates of a certain size or abundance, dependent upon the waterbody.”
“Type and number of habitat structures in reservoirs.”
“Maintaining quality habitat, whether it’s adding fish attractors at state and state park lakes or attempting to ensure habitat is maintained in waterbodies as they age.”
Objectives, generally, are similar for respondents and waterbodies, but are often only implicitly tied to metrics and remain one-dimensional (i.e., no objective hierarchy). A common pool of objectives linked to metrics could potentially streamline the selection of and standardize objectives.
Disclaimer/Publisher’s Note: The statements, opinions and data contained in all publications are solely those of the individual author(s) and contributor(s) and not of MDPI and/or the editor(s). MDPI and/or the editor(s) disclaim responsibility for any injury to people or property resulting from any ideas, methods, instructions or products referred to in the content.

