Article

eDNA Metabarcoding Reveals the Depth-Structured Variation of Coral Reef Fish

1
College of Fisheries, Huazhong Agricultural University, Wuhan 430070, China
2
Guangdong Provincial Key Laboratory of Fishery Ecology and Environment, Key Laboratory of South China Sea Fishery Resources Exploitation & Utilization, Ministry of Agriculture and Rural Affairs, South China Sea Fisheries Research Institute, Chinese Academy of Fishery Sciences, Observation and Research Field Station of Pearl River Estuary Ecosystem, Guangzhou 510300, China
3
Scientific Observation and Research Station of Xisha Island Reef Fishery Ecosystem of Hainan Province, Sanya Tropical Fisheries Research Institute, Sanya 572018, China
4
Key Laboratory of Utilization and Conservation for Tropical Marine Bioresources, Yazhou Bay Innovation Institute, Hainan Tropical Ocean University, Ministry of Education, Sanya 572018, China
*
Authors to whom correspondence should be addressed.
Fishes 2025, 10(5), 209; https://doi.org/10.3390/fishes10050209
Submission received: 1 April 2025 / Revised: 25 April 2025 / Accepted: 1 May 2025 / Published: 2 May 2025
(This article belongs to the Special Issue Conservation and Population Genetics of Fishes)

Abstract

Global coral reef ecosystems face various levels of disturbance pressure. Understanding the depth-structured variation in coral reef fish communities can help us to better grasp and predict the adaptive changes of the ecosystem under different stressors. This study applied eDNA metabarcoding technology to analyze the spatial distribution of the coral reef fish at various depths (0 m, 5 m, 10 m, 15 m, 20 m, 30 m, 40 m, 50 m, and 60 m) within the Xisha Islands of China. The results indicated that the eDNA technology detected a total of 213 amplicon sequence variants (ASVs), including 33 species that were not identified using traditional methods. Herbivorous fish generally dominated in relative abundance across different depths. Moreover, the similarity among depth groups was largely absent, and significant differences existed in fish assemblages across depth gradients, consistent with the unique depth preferences of fish microhabitats. Importantly, our findings revealed distinct depth-structured variation among different functional groups of coral reef fish. Large carnivorous fish initially increased and then decreased along the depth gradient from 0 to 60 m, with a turning point around 20 m, while large herbivorous fish displayed the opposite trend. Small carnivorous and small herbivorous fish consistently declined along the same depth gradient. Additionally, the Margalef index (D) and Function richness (FRic) both displayed a consistent downward trend with increasing depth, while the Shannon–Wiener index (H′), Pielou index (J′), Quadratic entropy (RaoQ), Functional dispersion (FDis), and Functional evenness (FEve) initially increased and then decreased, peaking around 20 m. This study revealed that eDNA metabarcoding is an effective tool for evaluating coral reef fish biodiversity, community composition, and spatial distribution. It enhances our understanding of distribution dynamics and offers valuable insights for coral reef conservation and restoration efforts.
Key Contribution: This investigation substantiates the efficacy of environmental DNA (eDNA) metabarcoding methodologies for characterizing multidimensional ecological parameters in reef ecosystems, including ichthyofauna biodiversity patterns, taxonomic predominance, assemblage architecture, and bathymetric depth-structured variation dynamics. It enhances our understanding of coral reef fish distribution patterns and underscores the urgency of conserving these ecosystems.

1. Introduction

Reef ecosystems, frequently characterized as marine biodiversity hotspots analogous to terrestrial rainforests, represent global epicenters of marine speciation. Current ecological assessments estimate that approximately 34% of marine teleost taxa exhibit obligate association with coral reefs during critical life cycle phases, highlighting their fundamental role in sustaining marine trophic complexity [1,2]. Coral reefs also provide essential social, economic, and ecological functions, directly or indirectly supporting the food and economic livelihoods of billions of people [2,3]. Coral reefs are essential for marine nutrient cycling and energy flow, protecting the ecological security of coastal regions [4,5]. In recent decades, coral reef ecosystems have faced great health and stability pressures [6,7]. Reef degradation has reduced coral structures’ natural complexity, risking permanent loss of their ability to support marine life and maintain biodiversity [8].
Coral reef ecosystems possess complex structures in which biological processes, abiotic processes, and stochastic processes interact among different ecological communities, forming natural environmental gradients in biophysical resources [9,10,11]. Research has confirmed the presence of predictable ecological zonation patterns associated with water depth gradients in tropical coral reef ecosystems [12,13]. Different depths exhibit distinct biophysical conditions, such as light availability [14], food availability [15], temperature [16], salinity [17], wave action, and sedimentation [18,19]. Organisms within coral reefs have developed various traits to adapt to survival in different depth habitats [15,20,21]. Fish play crucial roles as both prey and predators in coral reef ecosystems, significantly influencing material cycling, ecological functions, and resilience [22,23,24]. Although fish inhabit a broad range of depths within coral reef ecosystems, certain patterns exist within their complex distribution [11,25]. Studies have confirmed that the depth distribution patterns of fish align with those of benthic communities, with notable regularities in their biodiversity, functional diversity, and functional groups as depth increases [23,26,27]. Additionally, research indicates that coral reef fishes’ depth-related distribution is predictable without local human populations, but this pattern may alter or vanish on modern coral reef islands with dense populations [28]. Efficient biodiversity monitoring and precise spatial distribution data are critical for tracking ecosystem changes due to their implications for economic, ecological, and security interests [2,4,29]. However, the patterns of depth distribution among coral reef fish remain unclear, with significant variability under different environmental conditions. A comprehensive assessment of coral reef fish spatial distribution is vital for better understanding amid various environmental changes [30,31].
Often, traditional methods for surveying coral reef fish communities have limitations. For instance, net gear can severely damage coral reefs, while underwater spearfishing and underwater visual surveys (UVC) are not only extremely time-consuming and expensive but also have poor detection capabilities for cryptic species within the reefs [32,33,34]. In this context, environmental DNA (eDNA) technology offers a new perspective. eDNA technology relies on capturing free DNA fragments that dissociate from organisms in the environment, including those found in scales, mucus, tissues, or feces [35,36]. This DNA is then amplified, sequenced, and compared against databases to reconstruct local biological community compositions and geographical patterns [37,38]. The application of eDNA technology in marine habitats has become increasingly widespread, proving effective in capturing DNA information from microorganisms to large mammals [39,40] and accurately assessing fish community structures and biodiversity [41,42]. Additionally, eDNA technology has shown remarkable results in studying the spatial distribution of marine organisms. Horizontally, researchers have utilized eDNA and UVC to investigate the spatial distribution of vertebrate communities in kelp forest ecosystems, with both methods revealing consistent spatial distributions; eDNA was able to differentiate samples located just 60 m apart into distinct communities [43]. Canals et al. [44] analyzed eDNA samples from the Bay of Biscay continental slope (depth: 5–1000 m) and found that deep-sea fish richness and abundance increase with depth. At a smaller scale, Jeunen et al. [45] used eDNA to survey fish communities in fjords, discovering vertical distribution changes of fish only 4 m apart. These studies indicate that eDNA technology can effectively determine the spatial distribution of fish in marine environments, opening a promising avenue for marine ecosystem research. Furthermore, these efforts can advance three-dimensional (3D) conservation planning for fish biodiversity metrics, supporting the achievement of the marine 30 × 30 conservation target [46,47]. Recent advances in biodiversity monitoring leverage environmental DNA (eDNA) alongside geospatial predictive modeling (e.g., MaxEnt integrated with GIS) to offer broader insights into species distribution patterns [48,49,50]. These integrative approaches offer a scalable complement for landscape-scale conservation planning [50,51]. Moreover, studies assessing the spatial distribution characteristics of coral reef fish using eDNA metabarcoding technology remain emerging [52,53,54].
This study utilized eDNA technology to assess the depth-structured variation in coral reef fishes in China’s Xisha Islands (0–60 m), analyzing the composition, dominant species, functional groups, and biodiversity differences and trends across various depth levels. Investigating coral reef fish depth-structured variation enhanced our comprehension of the dynamic biological communities, fish behavior, and aggregation patterns within coral reef ecosystems. This knowledge is crucial for ecosystem protection and fish resource management, contributing to the development of more scientific and effective management strategies.

2. Materials and Methods

2.1. Sample Collection and Preparation

The Xisha Islands of China (15°46′–17°80′ N, 111°11′–112°54′ E) are characterized by high biodiversity and abundant biological resources and constitute the largest archipelago in this region [55,56]. Sampling was conducted from 28 March to 6 April 2023. The sampling area primarily covers North Reef, East Island, Huaguang Reef, Langhua Reef, Panshiyu Island, Qilianyu Islands, Yongle Islands, and Yuzhuo Reef. All sampling was uniformly arranged between 7:00 and 9:00 daily to minimize the impact of sampling time differences and strong ultraviolet radiation on the samples. The sampling covered nine different depths. The research team was divided into two sampling groups, which simultaneously advanced sampling work from both sides of the coral reef toward the deep-water area. During sampling, a portable fathometer (SM-5) was used to measure the depth of the coral reef area. Upon reaching the target depth, a 5 L water sampler with appropriate weights was used to collect bottom water samples without touching the seabed or coral reef. At each target depth, samples were collected from three random locations. The water sampler underwent a strict decontamination protocol between samples: First, the sampling equipment was sterilized using a 30% commercial bleach solution containing <3% sodium hypochlorite to ensure aseptic conditions. Subsequently, the device was thoroughly rinsed with ultrapure water after each sampling event [52,57]. Through this standardized sampling procedure, a total of 54 water samples were obtained (2 sampling groups × 9 depths × 3 sampling positions). Collected water samples were promptly stored in sterilized disposable sampling bags and placed in a cooler maintained at −4 °C, ensuring transport back to the research vessel within one hour.
Immediately upon returning to the research vessel, water samples were processed via vacuum filtration through a 47 mm diameter, 0.2 µm polycarbonate membrane to capture eDNA [41,52]. The filtered membranes were then transferred to 2 mL cryovials and preserved in liquid nitrogen at −80 °C. The vacuum filtration equipment was thoroughly cleaned with pure water three times both prior to and following each sample processing session, and personnel changed gloves when handling different samples to prevent cross-contamination. For each sample group, identical equipment and procedures were used, with the same volume of pure water filtered at the same time as a negative control. To ensure the integrity of eDNA samples and prevent cross-contamination, strict adherence to the sampling and filtration protocols was mandatory.

2.2. DNA Extraction and PCR Amplification

The PowerWater DNA Isolation Kits (Qiagen, Redwood City, CA, USA) were employed to extract DNA from the filter membranes. All DNA extractions included triplicate negative controls (sterile water) processed alongside samples to monitor contamination. The integrity of the resulting DNA was evaluated via 1% agarose gel electrophoresis, and its concentration and purity were quantified using NanoDrop and Qubit. The eDNA solutions were stored at −20 °C until PCR amplification. For the PCR step, we used the MiFish-U/E primers (F: 5′-GTYGGTAAAWCTCGTGCCAGC-3′, R: 5′-CATAGTGGGGTATCTAATCCYAGTTTG-3′) [58]. The 20 μL PCR reaction mixture contained 2 μL of template DNA (10 ng/μL), 0.8 μL of each primer (forward and reverse, 10 μmol/L), 2 μL of dNTPs, 4 μL of 5 × FastPfu buffer, 0.4 μL of FastPfu polymerase, and 10 μL of ddH2O. The PCR program was as follows: initial denaturation at 95 °C for 5 min; 27 cycles of denaturation at 95 °C for 30 s, annealing at 55 °C for 30 s, and extension at 72 °C for 45 s; and a final extension at 72 °C for 10 min. Each PCR reaction included ddH2O as a negative control. Each sample was amplified in triplicate, and the PCR products of the same sample were pooled and analyzed using 2% agarose gel electrophoresis. Each PCR plate included a negative control (ddH2O template) to monitor contamination during amplification. No target bands were observed in any negative controls during gel electrophoresis. The PCR products were purified using a 1:1 magnetic bead cleanup method, and the volume for each sample was determined based on Qubit measurements. Equal volumes of PCR products from each sample were then pooled for sequencing on the Illumina NovaSeq 6000 platform (Illumina, San Diego, CA, USA).

2.3. Sequence Analysis

The sequencing reads were initially processed using Fastp software (v0.12.4) for quality control, which included removing adapters, filtering out low-quality reads, and removing low-frequency reads (<0.001%). Following this, the assembled sequences from all samples were merged and clustered at a similarity threshold of 98%. The resulting ASV sequences were then compared against the MitoFish database (https://mitofish.aori.u-tokyo.ac.jp, accessed on 10 July 2023) using BLAST (v2.2.31). The species classification level was assigned based on a 98% similarity threshold [59]. Additionally, to validate the presence of detected fish species, we compiled historical species composition data spanning nearly 70 years from the Xisha Islands to cross-reference and confirm the identified species [57,60]. All field samples were screened for unreasonable detections (e.g., non-marine or geographically implausible species). No such detections were observed, further supporting data quality.

2.4. Functional Group

The grouping methods for different functional groups of coral reef fish in this study refer to Peter [61] and Wang et al. [62]. The categories include herbivores, carnivores, and omnivores based on feeding habits, and small (<35 cm), medium (35–65 cm), and large (≥65 cm) fish based on size. Consequently, we identified eight functional groups: large carnivores (L-Carnivore), large herbivores (L-Herbivore), medium carnivores (M-Carnivore), medium herbivores (M-Herbivore), medium omnivores (M-Omnivore), small carnivores (S-Carnivore), small herbivores (S-Herbivore), and small omnivores (S-Omnivore). Information on the fish’s trophic levels and sizes was obtained through anatomical analysis and referenced from FishBase (https://www.fishbase.se/search.php, accessed on 10 March 2024).

2.5. Functional Diversity

This study selected 11 functional trait indicators, including dietary habits, body size, and 9 functional traits related to fish morphological ecology (Table S1) [63]. The morphological and ecological data for fish were obtained from FishBase, where images of fish bodies were measured using ImageJ v1.52a software to derive the morphological metrics. Morphological metrics were derived from standardized lateral-view images of adult individuals (n = 3 per species) sourced from the FishBase Database. Only images meeting the following criteria were analyzed: (1) fish fully visible in a straight, lateral posture; (2) no obstructions (e.g., corals, conspecifics) overlapping the body; (3) confirmed adult status based on species-specific size-at-maturity thresholds from FishBase. Individual size was quantified as total length (TL), and scale calibration was based on reference objects (e.g., grid rulers) included in original images. For fish species without available images, functional trait data were referenced from related species within the same genus.

2.6. Data Analysis

The Pearson correlation analysis was chosen if the data met the assumptions; otherwise, Spearman’s correlation analysis was used. IBM SPSS (v24.0) was used to analyze correlations between fish functional groups and depth. Linear regression assessed the relationship between functional groups and depth. Functional diversity indices (FD) were computed with the dbFD function in the “FD” R package [64]. Data analyses were normalized by sequence read abundance. Analysis and plotting were conducted using IBM SPSS 24.0, R 4.3.1, and Origin 2021.
The degree of similarity in species between different depth groups was quantified using the Jaccard similarity coefficient (Js). The formula for calculating the Jaccard similarity coefficient is as follows [65]:
J s = c a + b c
In Equation (1), a represents the relative abundance of fish species at depth a, b represents the relative abundance of fish species at depth b, and c represents the relative abundance of species common to both depths.
The Margalef index quantifies species richness. We applied this index to assess how depth gradients influence the raw count of fish species. The calculation formula for the Margalef index (D) is as follows [66]:
D = S 1 L n N
The Shannon–Wiener index quantifies species diversity. We applied this index to assess how depth gradients influence the species diversity of fish species. The calculation formula for the Shannon–Wiener diversity index (H′) is as follows [67]:
H = i = 1 S P i L n P i
The Pielou index quantifies species evenness. We applied this index to assess how depth gradients influence the species evenness of fish species. The calculation formula for the Pielou index (J′) is as follows [68]:
J = H L n S
In Equations (2)–(4), S denotes the number of species, N is the total relative abundance, and Pi is the proportion of the i-th species’ relative abundance to N.
The Function richness quantifies the ecological space occupied by species in a community, indicating their ecological space utilization efficiency. The Function richness is highly sensitive to changes in fish species richness. The calculation formula for the Function richness (FRic) is as follows [69]:
F R i c = S F C i R c
In Equation (5), SFCi indicates the ecological niche space occupied by species in a community, Rc is the total niche space occupied by trait c across all communities, and FRic represents the functional richness index of trait c in community i.
Functional dispersion measures the distribution of species’ functional trait abundance within the functional space, indicating the degree of niche variation among species in the community. The calculation formula for the Functional dispersion (FDis) is as follows [70]:
c = w j · x i k w j
F D i s = w j · z j w j
In Equations (6) and (7), c is the weighted centroid, wj is species j’s relative abundance, xik is the value of trait k for species i, and zj is the weighted distance from species j to centroid c.
The Functional evenness quantifies the evenness of species’ functional trait abundance distribution in functional space, reflecting species’ resource use. The calculation formula for the Functional evenness (FEve) is as follows [69]:
F E v e = L = 1 s 1 min ( PEW L , 1 S 1 ) 1 S 1 1 1 S 1
P E W L = E W L L = 1 S 1 E W L
E W L = d i s t ( i , j ) w i + w j
In Equations (8)–(10), S is the number of species, EWL is the evenness weight, dist(i,j) is the Euclidean distance between species i and j, and wi is the relative abundance of species i. L is the branch length, and PEWL is the branch length weight.
The Quadratic entropy metric systematically quantifies both taxonomic diversity and phylogenetic divergence within biotic communities, providing an integrated measure of ecosystem resistance-resilience dynamics through its dual quantification of biodiversity components; this index effectively captures community-level adaptive capacity in disturbance mitigation potential. The calculation formula for the Quadratic entropy (RaoQ) is as follows [69]:
R a o Q = i 1 s 1 j = i + 1 s 1 d i j p i p j
In Equation (11), dij is the functional space Euclidean distance between species i and j, and pi and pj are the relative abundances of species i and j, respectively.

3. Results

3.1. Fish Composition and Community Assembly

A total of 3,267,811 reads were obtained from the eDNA samples collected in the 0–60 m range of the Xisha Islands. After filtering, we retained 2,224,815 reads and identified 213 amplicon sequence variants (ASVs). These ASVs represented 213 species across 12 orders and 45 families, belonging to two classes. The class Actinopterygii included 211 species, representing 11 orders of fish, predominantly the order Perciformes, which accounted for 158 species, or 74.18% of the total. The next most represented orders were Tetraodontiformes (13 species), Beryciformes (12 species), Anguilliformes (12 species), and Beloniformes (7 species). Additionally, the orders Myctophiformes, Clupeiformes, and Scorpaeniformes each contained only two species, while Gasterosteiformes, Pleuronectiformes, and Gadiformes had just one species each. The class Chondrichthyes included two species from one order, Myliobatiformes, representing 0.01% of the total species recorded (Figure 1, Table S2). Notably, a marked disparity in species richness was detected among major fish families, highlighting distinct taxonomic dominance patterns across surveyed reef zones, with Labridae, Acanthuridae, Pomacentridae, Holocentridae, Scaridae, Muraenidae, and Serranidae being the most diverse, while the remaining families each had fewer than 10 species. Additionally, a comparison with historical traditional method results found that 85% of species detected by eDNA were the same as those from historical traditional methods, and the dominant families of fish were identical [60,71].

3.2. Distinguish Fish Communities by Depth

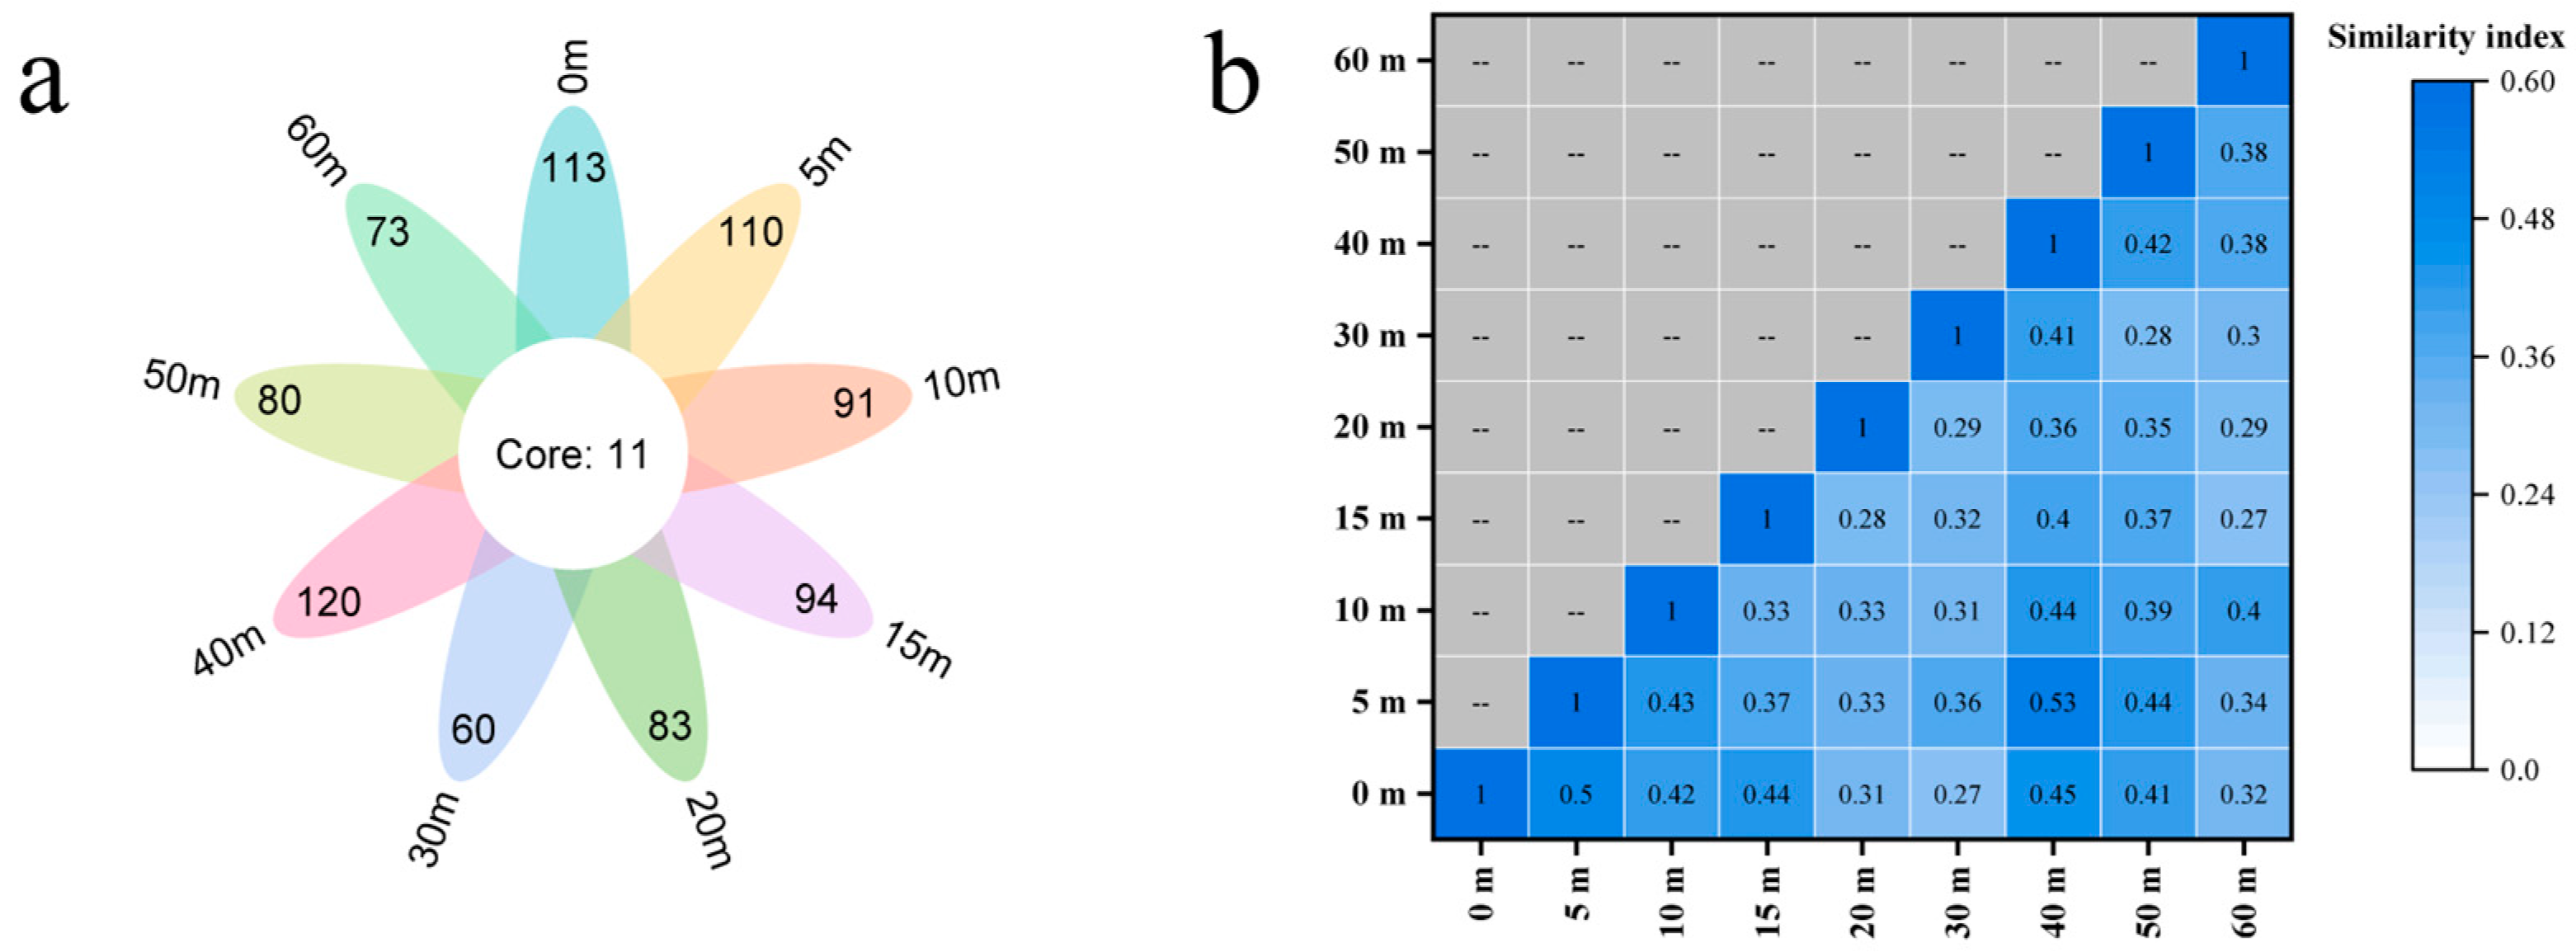
The number of fish species differed among depth sites, with few species shared across locations. Among the nine different depth groups, only 11 species were common, including Chlorurus spilurus, Ctenochaetus striatus, Lethrinus obsoletus, and Naso lituratus (Figure 2a). Furthermore, in the analysis of species composition similarity among different depths, only two depth groups exhibited moderate similarity, specifically the 0–5 m and 5–40 m groups, with similarity indices of 0.50 and 0.53, respectively. The species compositions of other depth pairs showed low similarity, with indices less than 0.5 (Figure 2b).

3.3. Dominant and Special Species at Different Depths

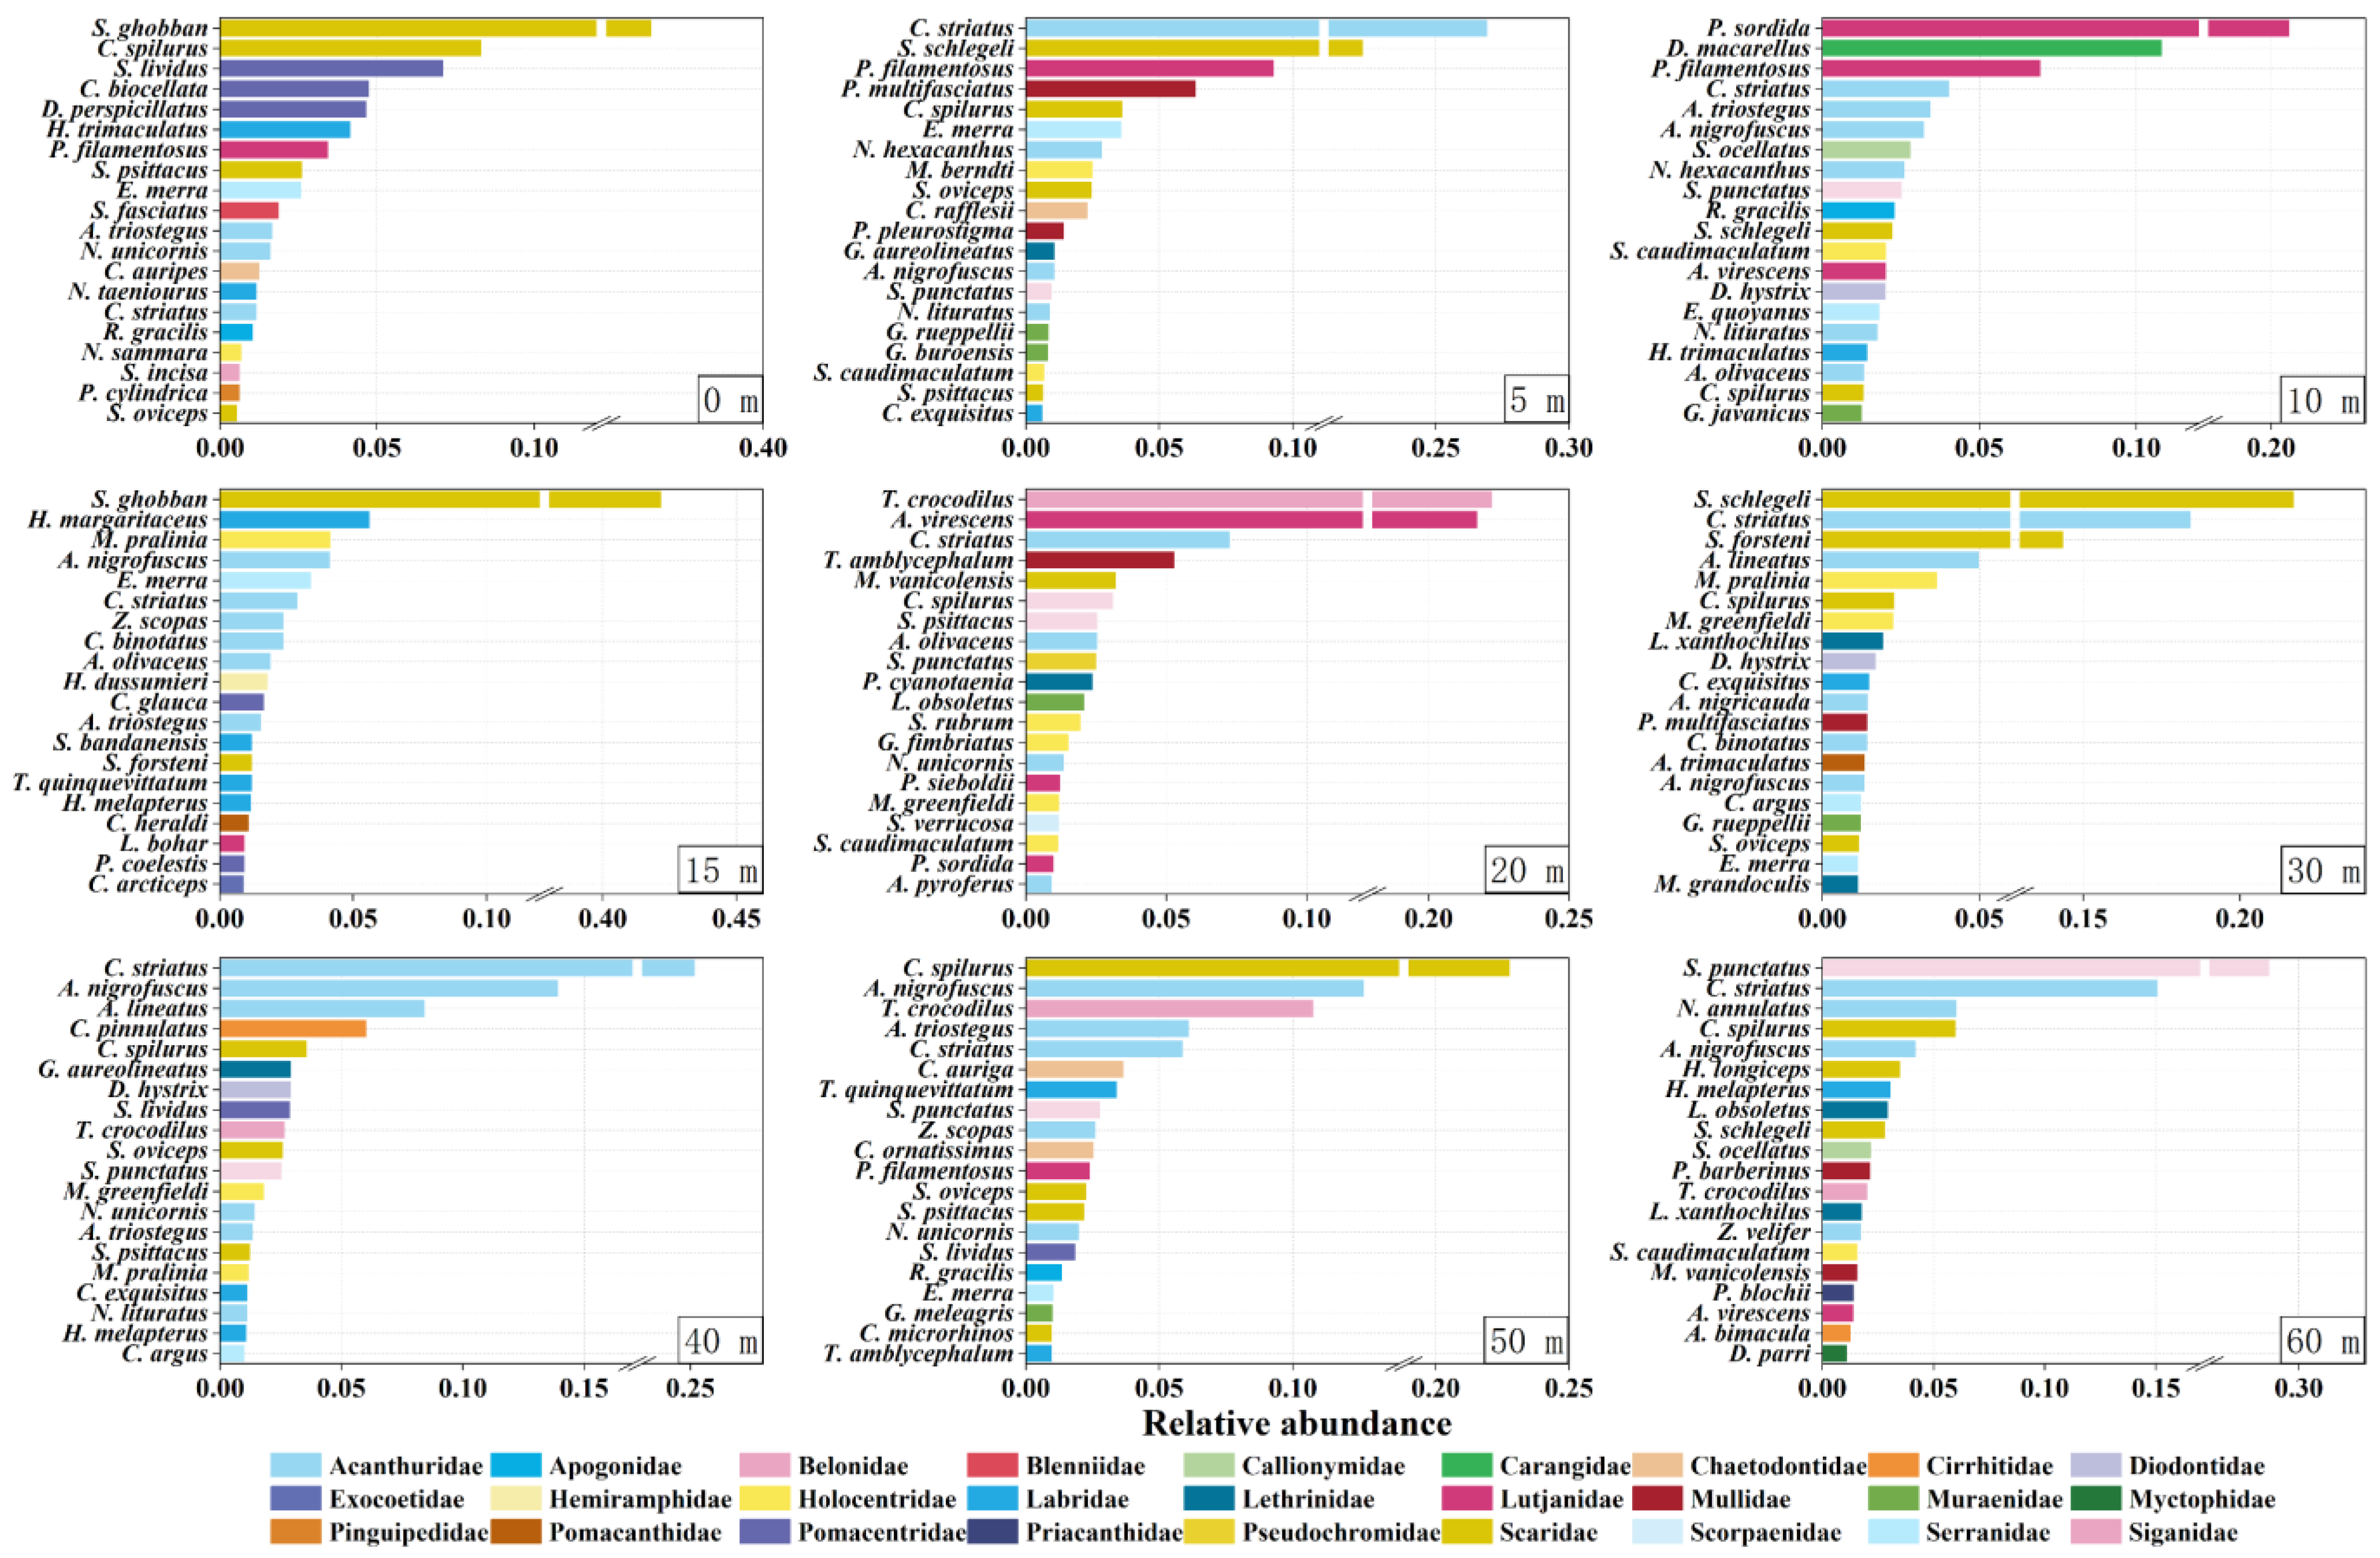
The dominant fish assemblages exhibited pronounced depth-dependent structuring, with the relative abundance rankings of the 20 most prevalent taxa showing distinct vertical depth-structured variation across bathymetric gradients. Within the 0–60 m range, herbivorous fish predominated, with species from the families Scaridae and Acanthuridae ranking among the top five. In the 10–20 m range, however, carnivorous fish gradually gained dominance, with members of the families Belonidae, Lutjanidae, and Holocentridae increasing from the top 10 to the top 5 (Figure 3).
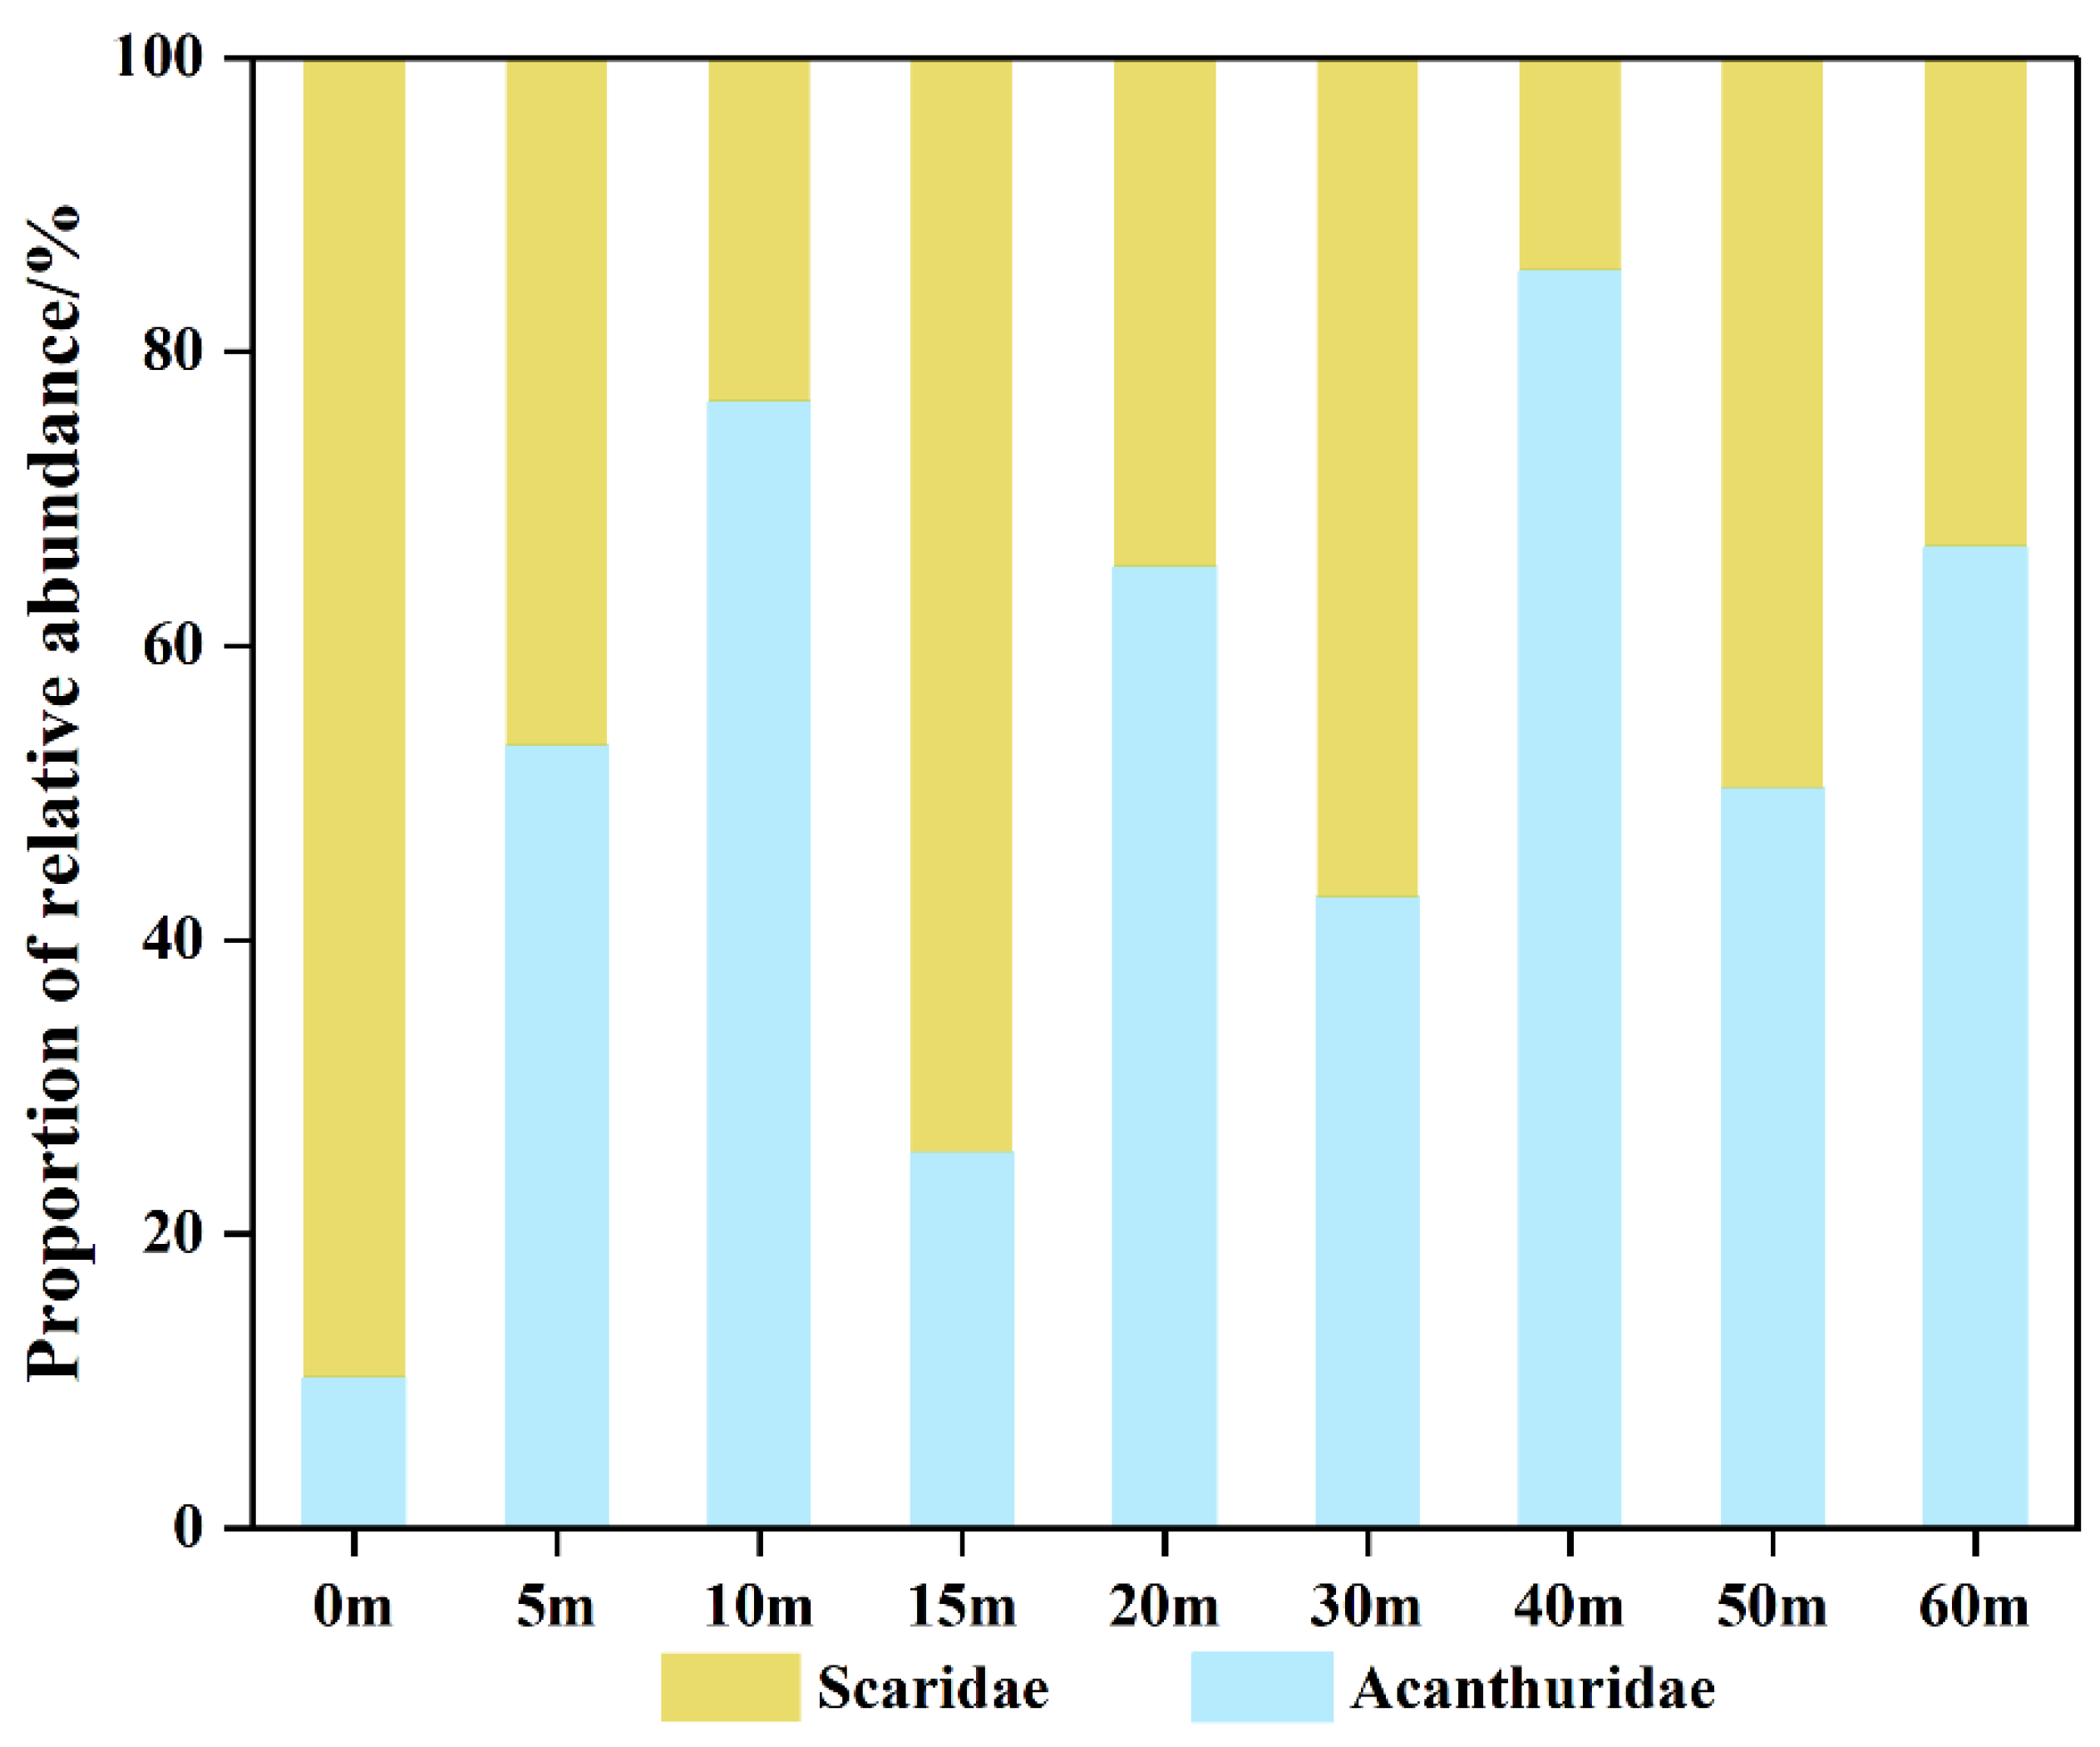
Although the dominant species varied with depth, both Scaridae and Acanthuridae consistently appeared among the top 20 fish species across the 0–60 m range. Notably, Acanthuridae was the most diverse, comprising 14 species, while Scaridae included 8 species. Further analysis of these families showed that, with increasing depth, Scaridae exhibited a declining trend, whereas Acanthuridae displayed an increasing trend (Figure 4).
Additionally, the eDNA survey detected a unique species from the family Myctophidae, Diaphus parri, which was only found at a depth of 60 m, representing 1.4% of the relative abundance.

3.4. Depth Gradient Variation of Functional Group Structure

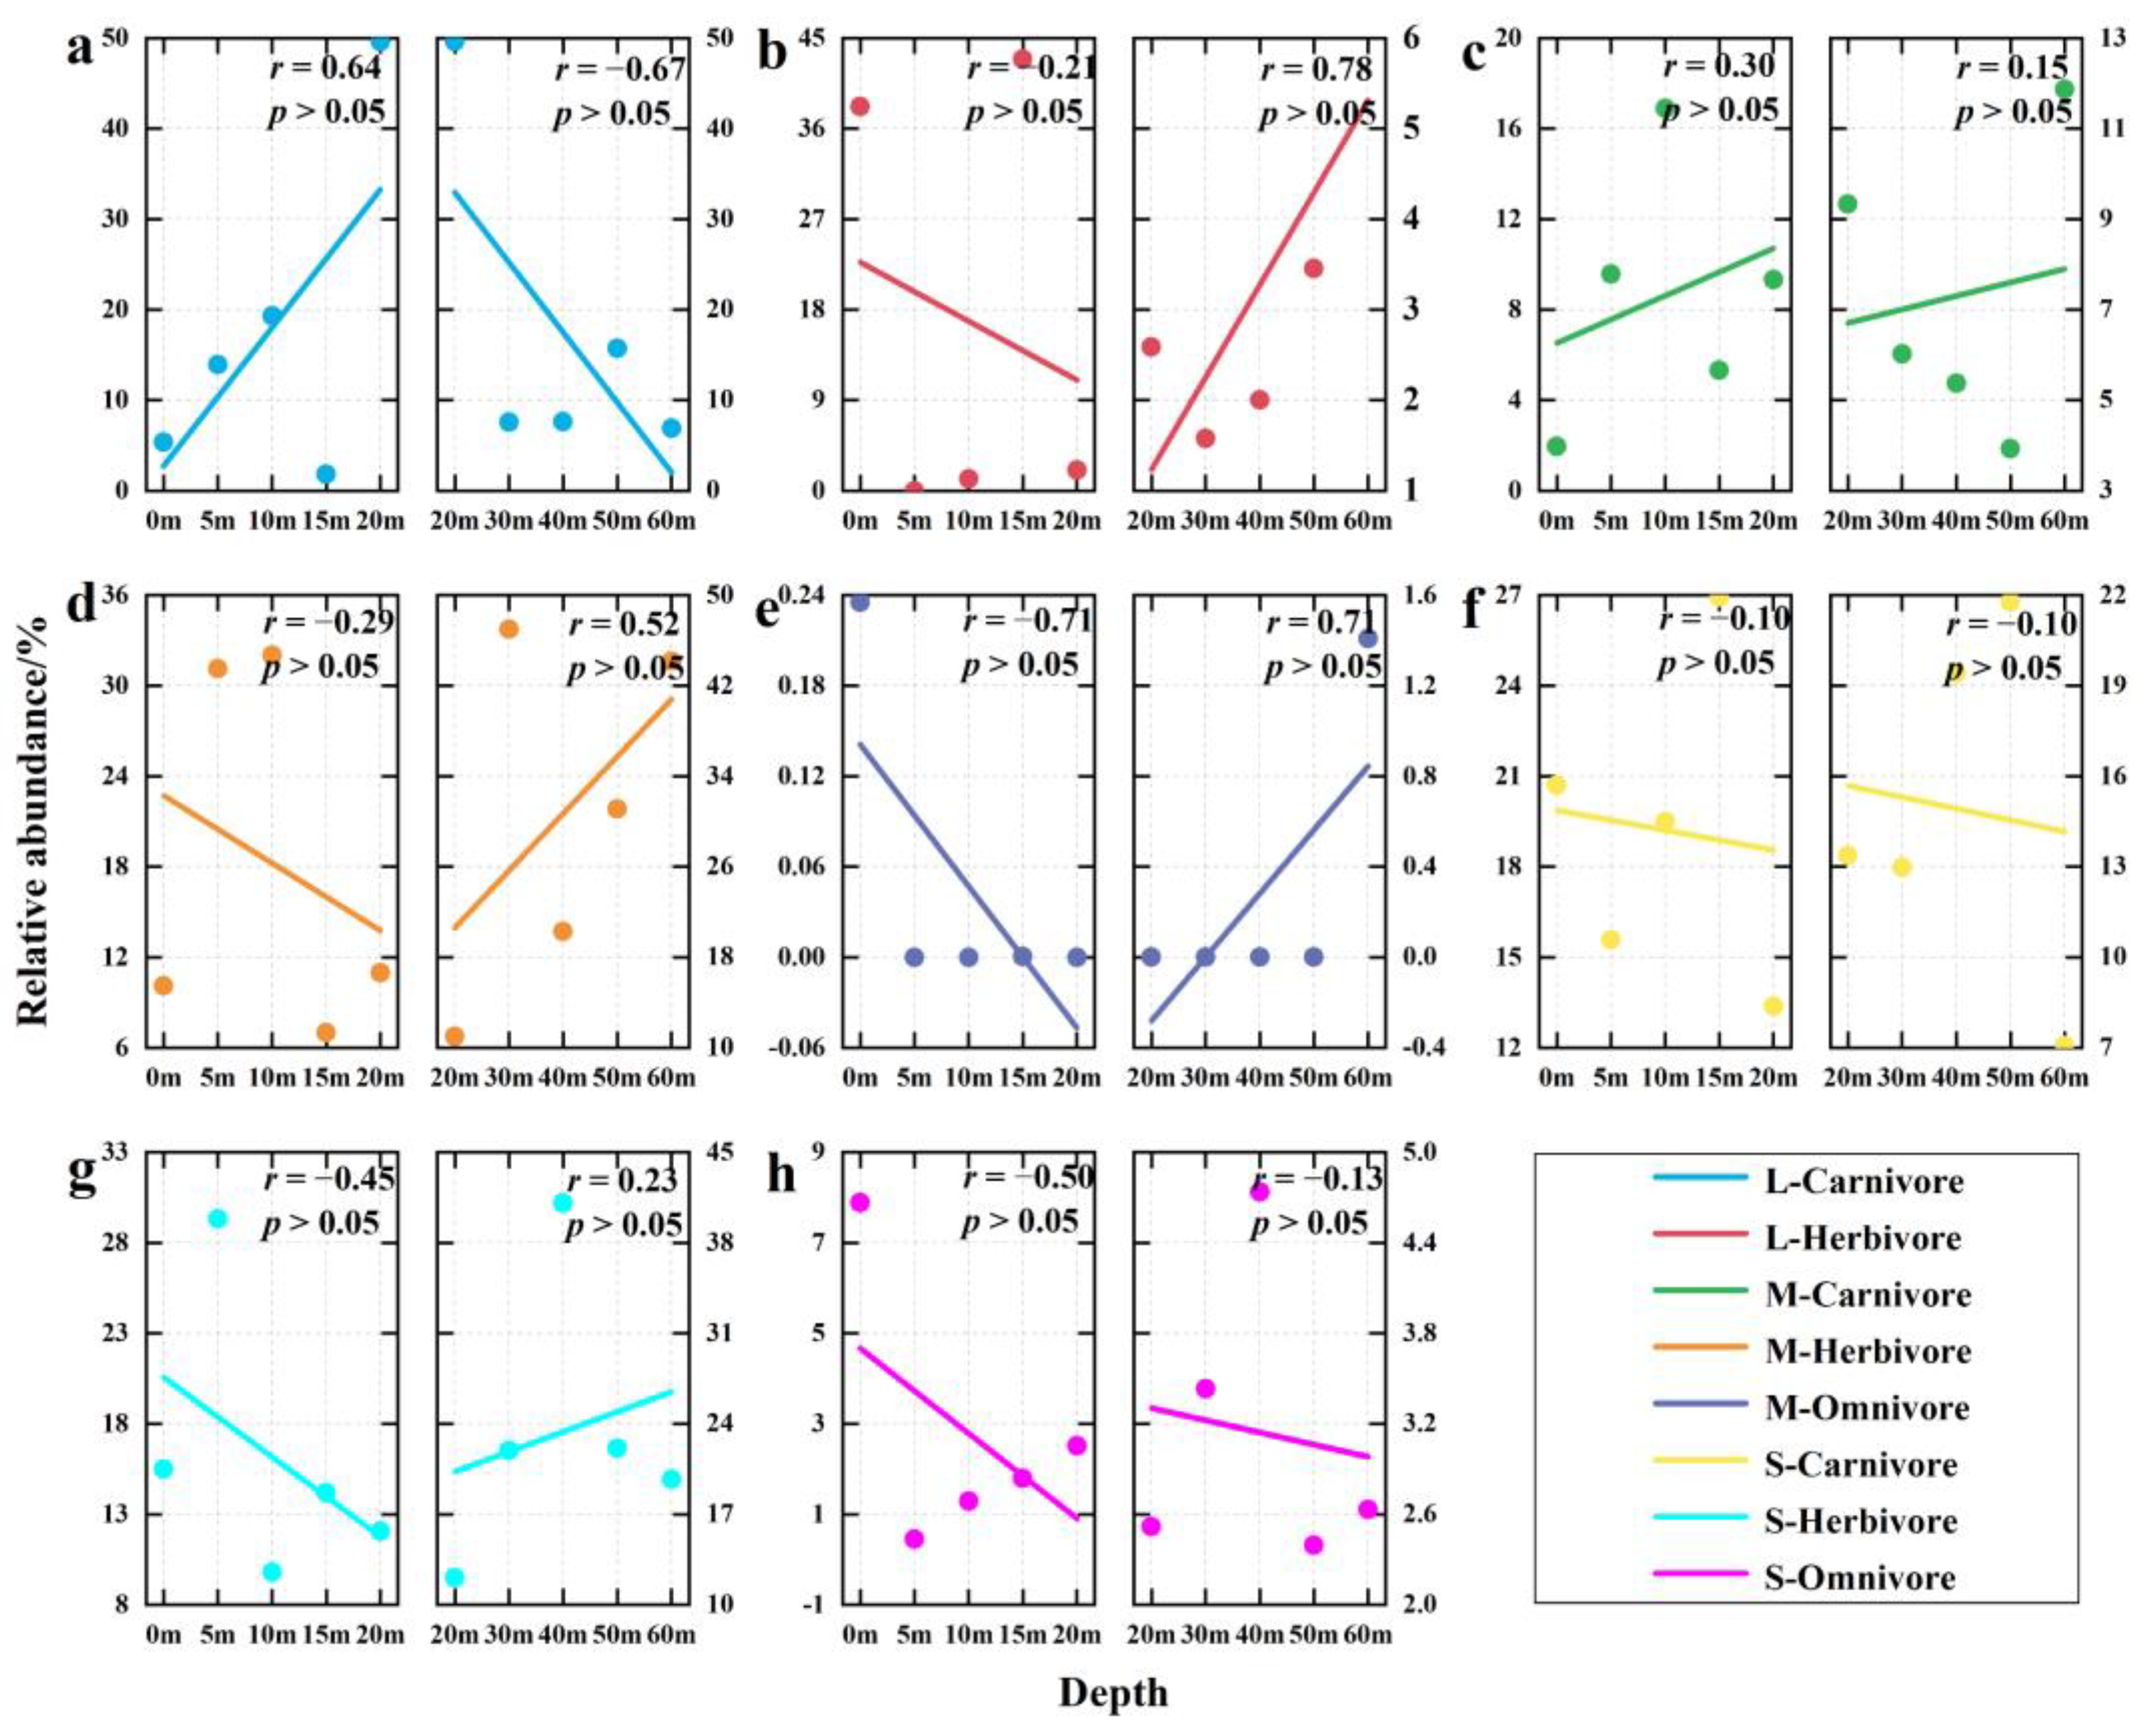
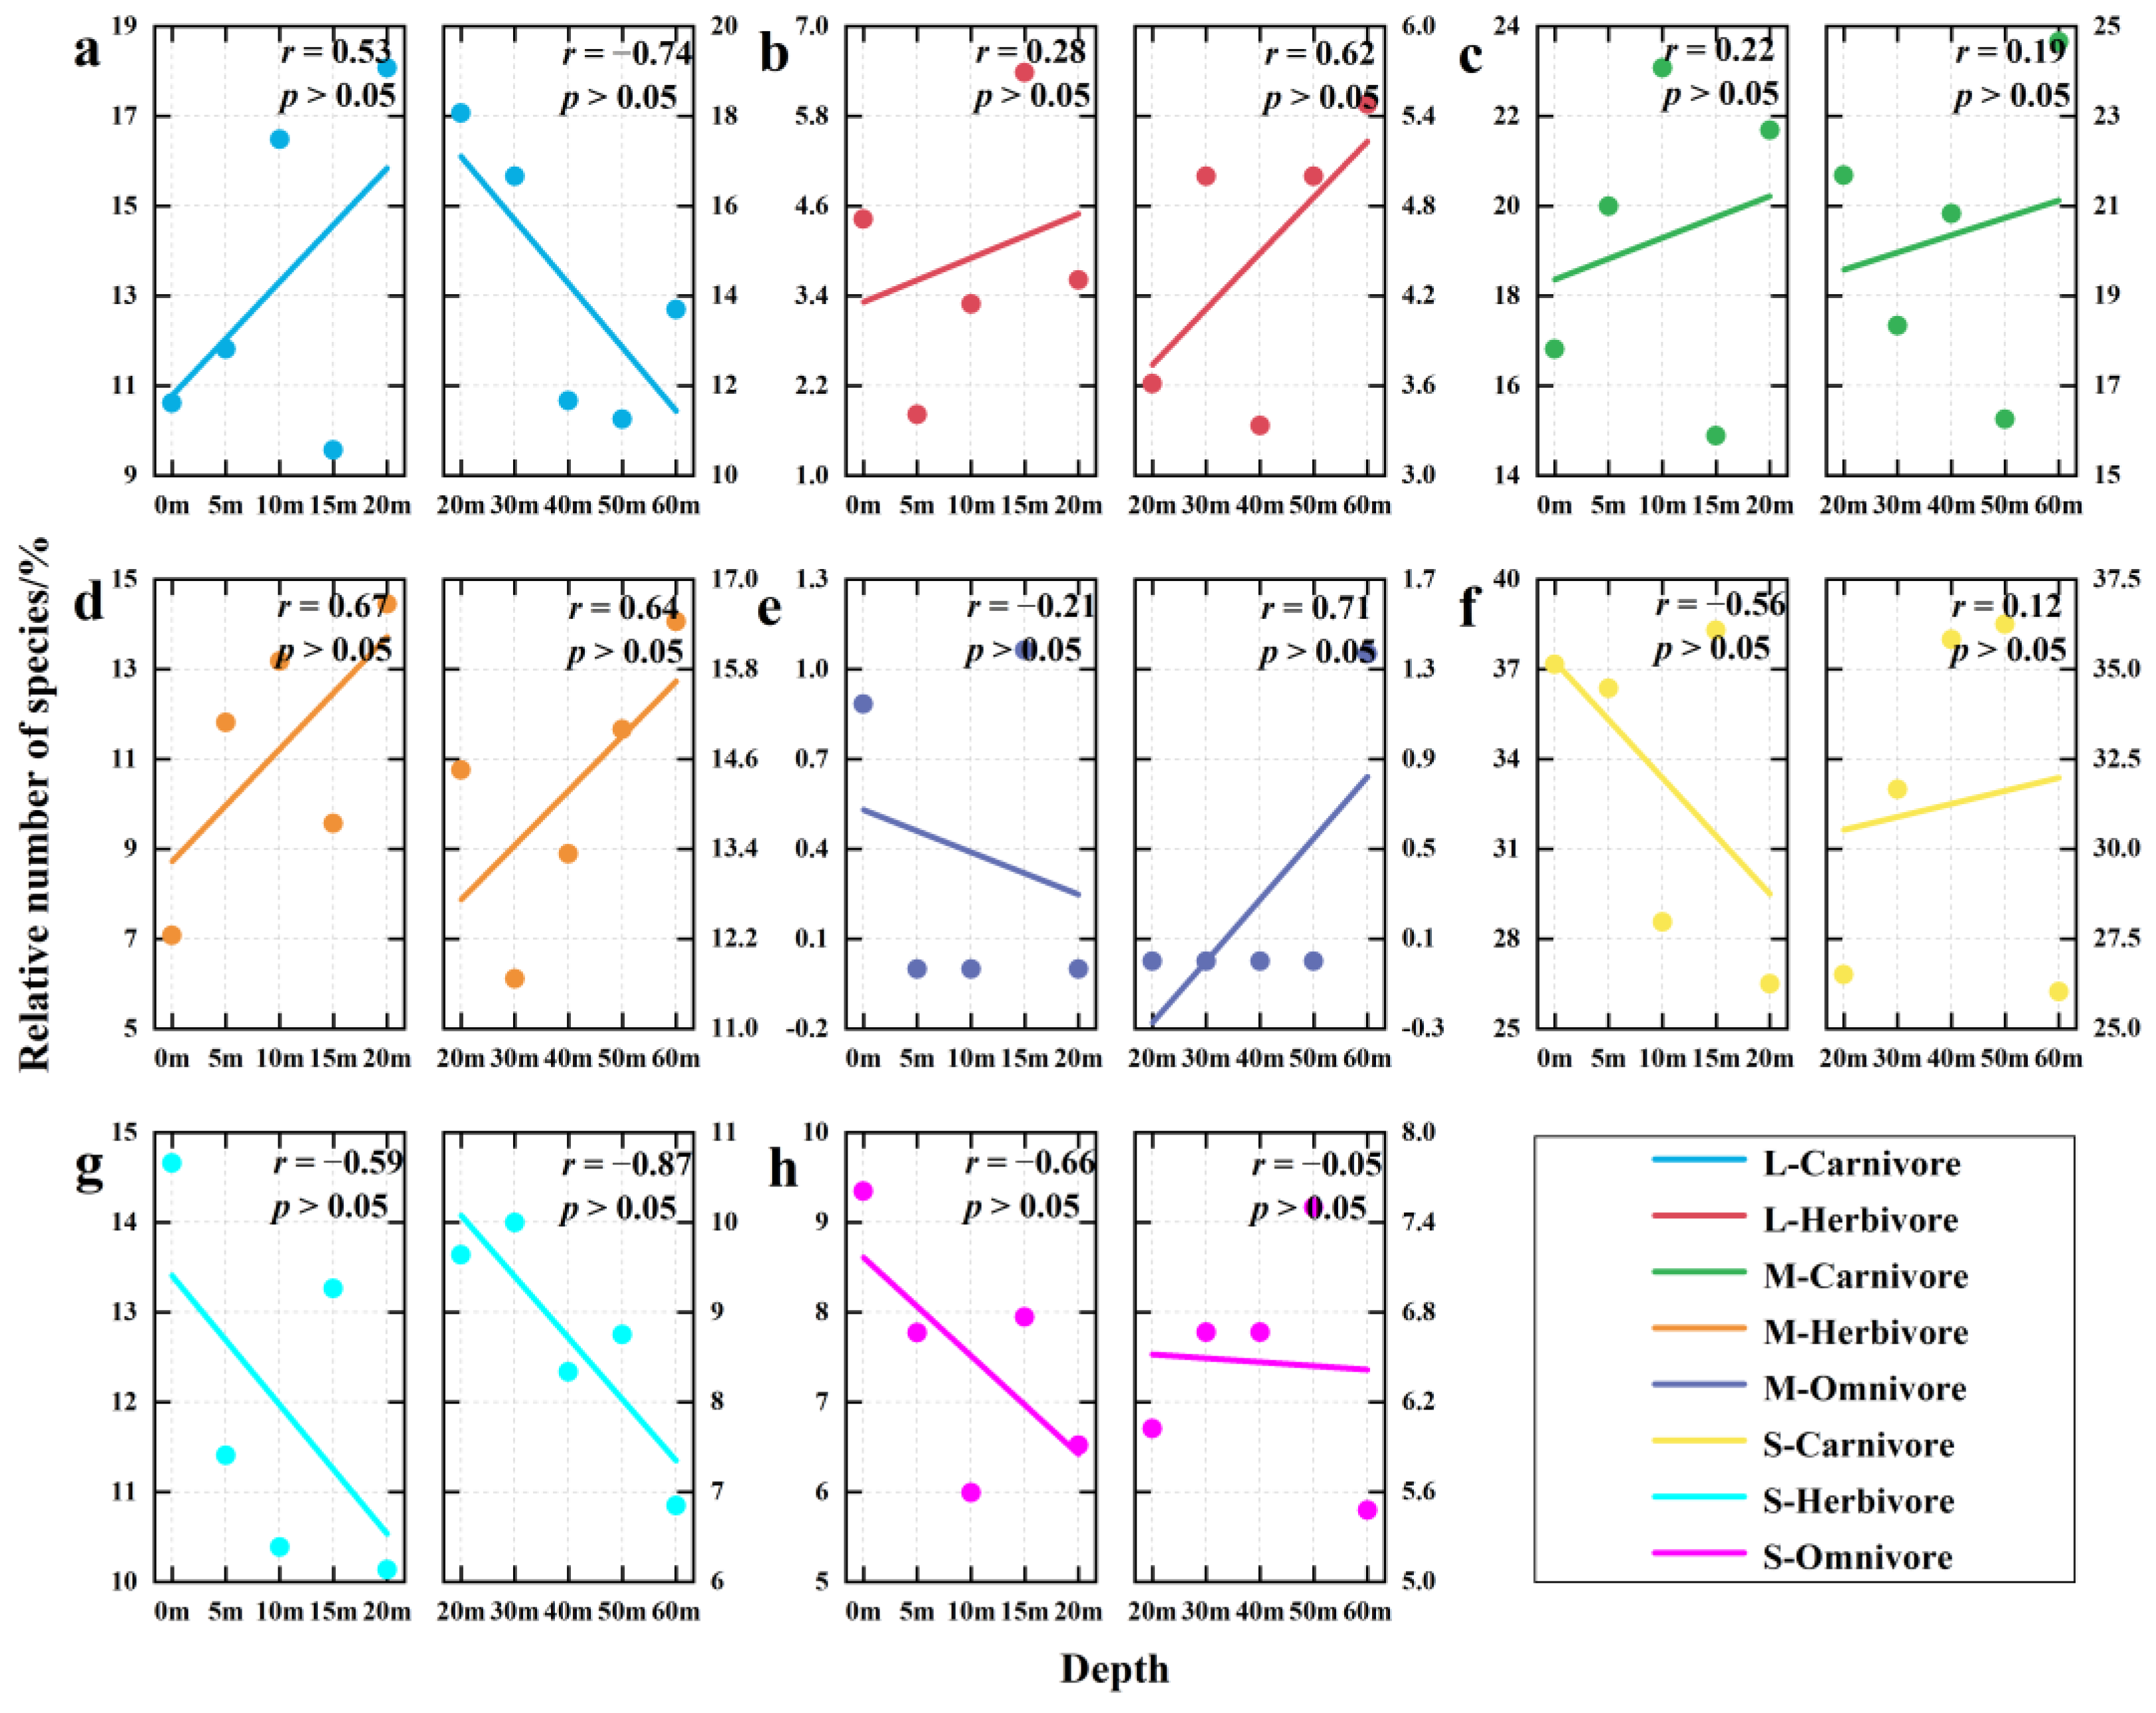
The relative abundance and species richness of large carnivorous fish exhibited unimodal distribution patterns across depth strata, peaking at mesophotic depths (20 m) before declining in deeper reef zones (20–60 m). In contrast to apex piscivores, medium-sized carnivorous fish assemblages demonstrated monotonic increases in both abundance and richness across the full bathymetric gradient (0–60 m). For small carnivorous fish, both relative abundance and species richness decreased from 0 to 20 m, with minimal changes observed from 20 to 60 m; however, small carnivorous fish maintained the highest species richness throughout the 0–60 m range.
The shallow reef zone (0–20 m depth) displayed contrasting patterns for herbivorous fish communities: larger-sized herbivorous fish showed progressively lower relative abundance with increasing depth, whereas species richness demonstrated an opposite trend, reaching maximum values at the deeper end of this bathymetric range. Small herbivorous fish exhibited declines in both relative abundance and species richness. Between 20 m and 60 m, both large and medium-sized herbivorous fish showed increases in relative abundance and species richness, while small herbivorous fish demonstrated an increase in relative abundance but a decrease in species richness. Furthermore, changes in omnivorous fish across different depths were negligible (Figure 5 and Figure 6, Tables S3 and S4).

3.5. Depth Gradient Variation of Biological Diversity

The reef fish community exhibited unimodal diversity distributions, with both Shannon–Wiener (H′) and Pielou (J′) indices peaking at intermediate depths (20 m) before declining in deeper zones (20–60 m) (Figure 7a,b). In contrast, the Margalef index (D) decreased significantly from 0 to 20 m (r = −0.94, p < 0.05) and continued to decline gradually from 20 to 60 m (Figure 7c).

3.6. Depth Gradient Variation of Functional Diversity

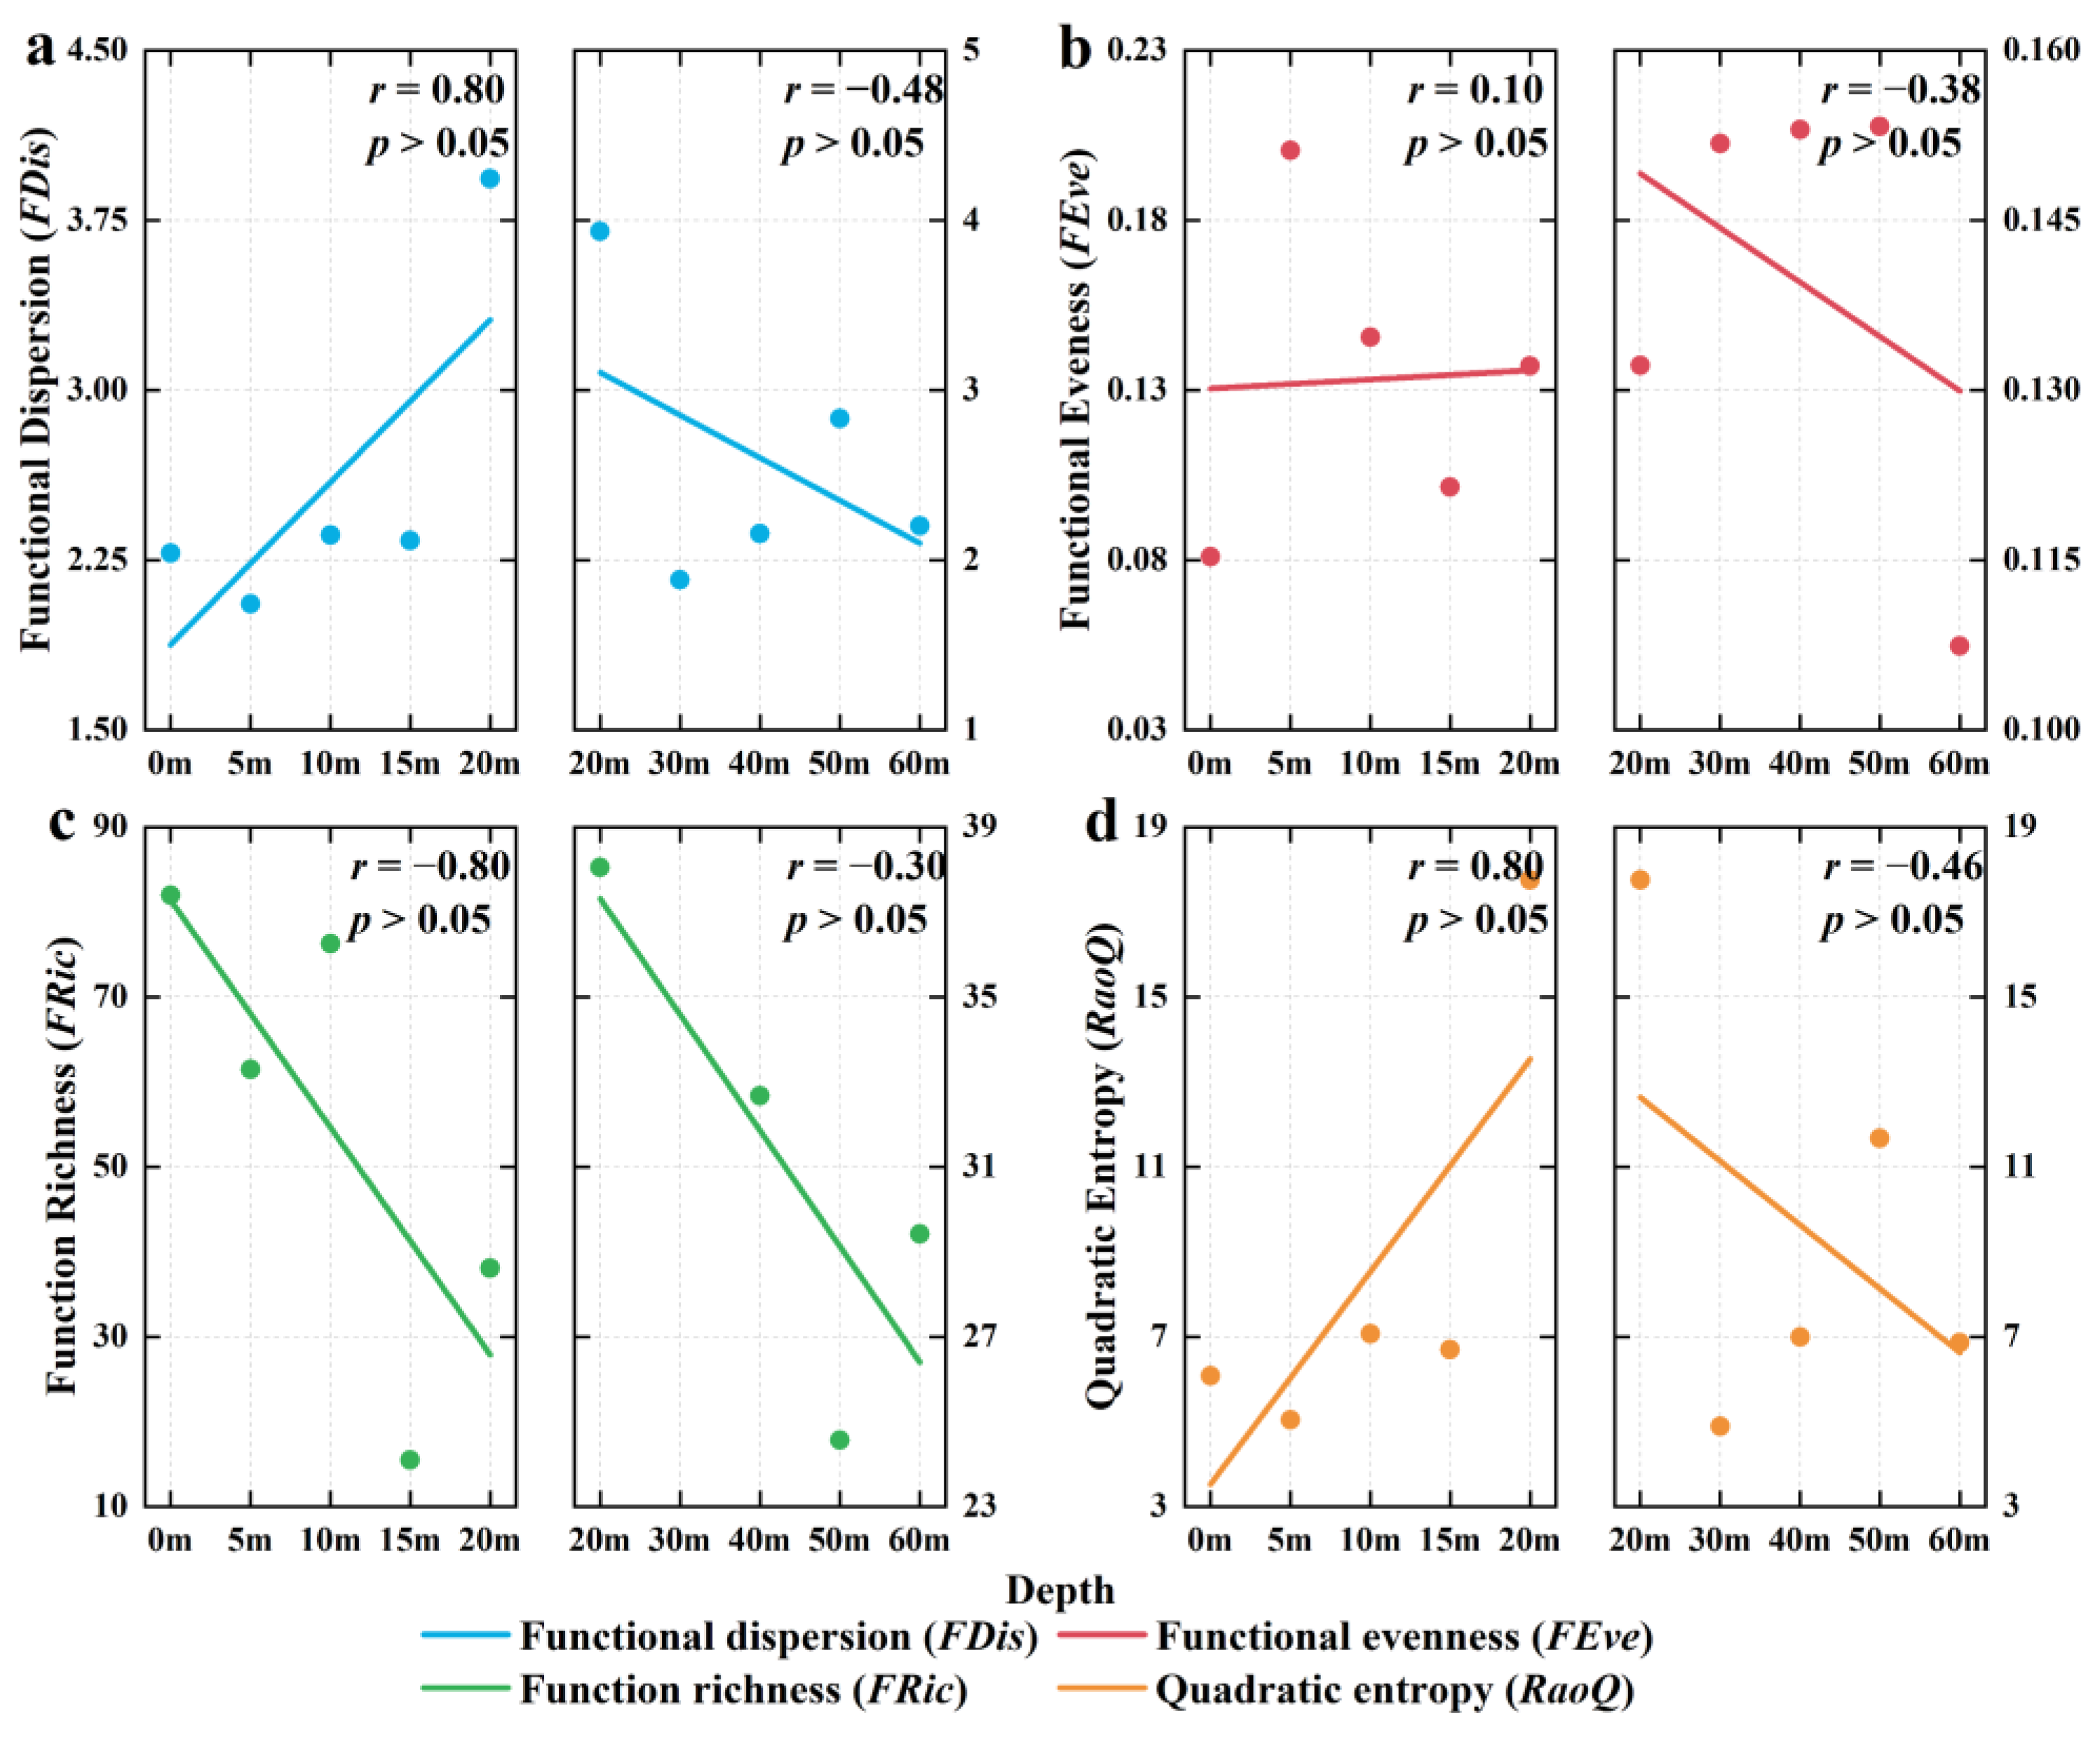
Functional diversity indices (RaoQ, FDis, FEve) of coral reef fish increased from 0 to 20 m, then decreased from 20 to 60 m (Figure 8a–c). Additionally, the Function richness (FRic) demonstrated a decreasing trend across the entire depth gradient from 0 m to 60 m (Figure 8d).

4. Discussion

4.1. eDNA Metabarcoding Plays a Positive Role in Understanding Biodiversity

This study analyzed coral reef fish communities using environmental DNA (eDNA) technology and revealed a depth-stratified pattern in community structure, functional groups, biodiversity, and functional diversity. This depth-related zonation pattern not only underscores the distinct characteristics of coral reef ecosystems across various depths but also offers novel insights into the adaptive strategies employed by fish communities [12,13]. Comprehending these depth-dependent variations in coral reef fish assemblages improves our capacity to forecast ecosystem responses to disturbances and informs the development of targeted conservation strategies [2,4,29]. Furthermore, these findings offer a scientific foundation for three-dimensional marine biodiversity conservation planning and provide new perspectives and methodologies for promoting the sustainable development of coral reef ecosystems [46,47].
Understanding the biodiversity of complex coral reef ecosystems without impacting the ecosystem itself is both important and challenging [72,73]. Traditional biological monitoring methods often require higher costs and can potentially harm the ecosystem, while their detection capabilities for cryptic species are often limited [32,33,34]. Against this backdrop, the emergence of eDNA technology offers multiple advantages for assessing the complex biodiversity of reef ecosystems [44,74,75]. eDNA is a cutting edge technology that surpasses traditional methods’ limitations. It is excellent for biodiversity monitoring, especially for cryptic species and taxa in complex environments [76,77,78]. Our results supplement the survey of coral reef fishery resources in the Xisha Islands. The high similarity of species and dominant species compositions detected by traditional surveys and eDNA analysis supports the results’ validity [60,71]. This shows a more dynamic and comprehensive view of coral reef ecosystem biodiversity. It also highlights the reliability and potential of eDNA technology as a valuable biodiversity assessment tool [41,42,54,79].
Environmental DNA (eDNA) analyses conducted in the coral reef ecosystems of the Xisha Islands demonstrate distinct variations in ichthyofauna assemblages across vertical depth gradients. The study observed notably low levels of community overlap between distinct bathymetric zones, revealing pronounced stratification in marine biodiversity distribution. Moreover, the depth gradient distribution of fish detected by eDNA aligns with their specific depth preferences. For example, Pomacentridae (Stegastes lividus, Plectroglyphidodon leucozonus, and Stegastes nigricans) usually feed on algae in shallow waters within 10 m in depth [80,81]. Conversely, the detection of Diaphus parri, a mesopelagic species, likely reflects these situations. (1) Diel Vertical Migration: Sampling occurred at dawn (07:00–09:00), coinciding with the ascent of mesopelagic species into shallow waters during nighttime feeding. This behavior is documented in related lanternfishes (Myctophidae) in reefs [82,83]; (2) Feeding behavior: Studies have found that Diaphus kapalae and Myctophum sp. are active in coral reef areas at depths of 30–70 m. The concentration of small prey (equivalent to spheres with a diameter of 250 to 1000 μm) in this area is as high as 50% [84]; (3) Trophic Linkages: Myctophids serve as prey for reef-associated predators, suggesting potential eDNA transfer via predation or fecal matter [85]. We conservatively retain it in Supplementary Materials to inform future cross-ecosystem studies. These findings largely reflect the preferences of coral reef fish for different depth microhabitats and demonstrate the sensitivity of eDNA in monitoring fish communities at a fine scale [86,87]. Future eDNA research on mobile fish species should focus on integrating behavioral data, such as diel vertical migration patterns and feeding behaviors, to enhance the interpretation of species presence [86,87]. Additionally, implementing sampling across multiple time points and depths is essential for providing a more accurate representation of fish community structure. Furthermore, utilizing advanced statistical and modeling techniques, such as geospatial predictive modeling or machine learning algorithms, can help to disentangle the effects of fish mobility on eDNA detection [48,49,50]. These methods can provide more nuanced insights into the presence and distribution of mobile species, ultimately improving the reliability and applicability of eDNA-based research in dynamic marine environments [50,51].
Although eDNA metabarcoding offers a transformative approach to biodiversity assessment, its results must be interpreted with caution. The challenges of false positives and false negatives stem from methodological limitations and the complexity of ecological environments. This study mitigated some of these risks through experimental design; however, the absence of negative control sequencing may have affected data purity. Future research should enhance the reliability of eDNA in coral reef ecosystem monitoring through deep sequencing of negative controls, multi-method validation, and primer optimization [88,89].

4.2. Fish Community Structure Reflects Habitat Status

Contemporary observations indicate widespread phase shifts in reef ecosystems worldwide, with accelerating transitions from scleractinian coral predominance to macroalgal dominance driven by synergistic anthropogenic and environmental stressors [2,90,91,92]. Concomitant with these ecosystem changes, fish assemblages have undergone structural reorganization, characterized by declining piscivore biomass and increasing herbivore dominance [92,93]. This investigation documented trophic structure patterns in the Xisha reef ecosystem consistent with initial phases of global reef degradation, where herbivorous taxa constituted the predominant functional group throughout all surveyed depth strata (0–60 m). These trophic shifts potentially reflect ongoing degradation processes within the Xisha Islands’ reef ecosystems, as evidenced by the characteristic herbivore-dominated assemblage structure. In recent decades, coral reef ecosystems have experienced escalating pressures from both climatic stressors and anthropogenic disturbances, particularly from Acanthaster planci, resulting in a decline in coral cover from 70% in 2005 to less than 20% in 2019. This habitat degradation probably resulted in alterations to fish community structures and created nutritional imbalances [94,95], which may have created favorable conditions for the increase in herbivorous fish populations [96]. Research indicated that after bleaching events, Hawaiian coral reefs transitioned from coral-dominated habitats to algae-dominated habitats, which subsequently drove the growth in herbivorous fish communities [97]. Research conducted across 22 discrete reef sites within the Great Barrier Reef reveals a consistent positive correlation between coral degradation intensity and herbivorous fish proliferation. This dynamic arises as diminishing coral cover facilitates algal proliferation, thereby enhancing resource availability for herbivore populations through bottom-up control mechanisms [98,99]. This study indicates that fish community structures can mirror habitat conditions, thus underscoring the significance of conducting fish resource surveys for the conservation of coral reef ecosystems.
Furthermore, this study identified that the most representative herbivorous fish families in the Xisha Islands were the parrotfish (Scaridae) and surgeonfish (Acanthuridae), both of which exhibited dominance in terms of relative abundance and species richness. These families were regarded as crucial for coral reef health and balance. They controlled fast-growing algae through top-down regulation, which became even more vital amid widespread coral reef degradation [100,101]. The parrotfish (Scaridae) primarily targeted turf algae and the EAM on coral reefs, scraping or excavating turf algae from coral surfaces and thereby creating space for coral settlement [102]. Surgeonfish (Acanthuridae) primarily consume larger fleshy algae. They have thick-walled, pouch-like stomachs that enable them to process these algae effectively [103]. For instance, species such as Acanthurus coeruleus, Acanthurus chirurgus, and Naso unicornis showed a strong preference for larger fleshy and calcifying algae [103,104]. The feeding preferences of both families helped explain their distribution patterns along depth gradients. This may have been related to the spatial distribution of algae, as shallow areas received more light, favoring the photosynthesis of turf algae. Deeper areas had lower light availability, while larger algae more effectively absorb and utilize available light [105,106]. These findings underscore the vital role of diverse herbivorous fish assemblages in degraded coral reef habitats. Different herbivorous fish combinations can control algal growth more effectively and promote healthy coral reef development [100,101].

4.3. eDNA Metabarcoding Reveals the Depth-Structured Variation of Fish

The distribution patterns of biological communities in coral reef ecosystems are shaped by complex biophysical processes that differ across various temporal and spatial scales [10,11]. Consequently, coral reef ecosystems display significant heterogeneity across various scales, which sustains their remarkable biodiversity [8,61]. Nevertheless, predictable and patterned depth zonation can be observed within coral reef ecosystems across depth gradients [11]. Our analysis revealed marked differences in the distribution patterns of major functional groups of coral reef fish between shallow (0–20 m) and deep (20–60 m) waters. In shallow reef habitats (0–20 m depth), herbivorous fish assemblages exhibited concurrent declines in both numerical dominance (relative abundance) and taxonomic diversity (species richness), likely mediated by limiting resource dynamics. In shallow waters, coral and algal resources are subjected to intense light, high temperatures, and wave action, leading to a high coral mortality rate [107,108]. Studies show that turf algae and the epilithic algal matrix (EAM) are more prevalent in shallow reef environments but decline with diminishing light levels [11,109]. This may explain the observed distribution patterns of abundant herbivorous and excavating fish in shallow waters of the Xisha Islands. In the 20–60 m depth range, small herbivorous fish continued to decline, while medium- to large-sized ones increased. This small herbivorous fish decline with depth likely resulted from reduced food resources (turf algae and EAM) and more predators [109,110]. However, in deeper waters, coral and algal morphologies exhibited larger leaf and surface areas due to reduced light, enhancing light capture and optimizing photosynthesis [11,20]. Additionally, the larger and more complex structures of corals provided space for various symbionts, such as phototrophic dinoflagellates [111]. Thus, many large corals and algae in deeper waters displayed heterotrophic characteristics, maximizing primary productivity and better adapting to low-light conditions [111,112]. Furthermore, these large species served as a food source for medium to large herbivorous fish, supporting their increased relative abundance [103,104].
In addition to resource availability being a primary driver of biological behavior, human activities, especially selective fishing pressure on large carnivorous species, significantly influence the depth gradient stratification of large carnivorous fish [15,113]. The exceptional water clarity characteristic of coral reef ecosystems appears to drive bathymetric displacement of apex predators, with larger piscivorous species exhibiting depth preferences that minimize anthropogenic harvesting pressure [110]. This behavioral adaptation likely explains the observed positive correlation between depth and predator diversity metrics in shallow reef zones (0–20 m). The mesophotic reef zone (20–60 m depth) exhibits an inverse relationship between bathymetric gradients and apex predator diversity metrics, potentially driven by depth-dependent reductions in trophic resource supply [15]. Large carnivorous fish are attracted to areas with a high abundance of target fish species, which often possess complex structures and habitat characteristics, such as the transitional zones of benthic communities within coral reefs [11,25]. Overall, fish behavior is shaped by the combined impact of numerous interacting elements [12,13].
The investigation documented a negative correlation between bathymetric gradients and the species richness index (D) for reef-associated ichthyofauna in the Xisha Islands. This aligns with most coral reef fish depth-distribution research, like those in the Philippines (8–35 m) [114], Kimbe Bay (1–40 m) [115], and the Red Sea (0–65 m) [26], where species richness dropped with increasing depth. This investigation documented a progressive compression of Function richness (FRic) in Xisha’s reef ichthyofauna along bathymetric gradients (0–60 m). Research conducted on offshore reef systems in northwestern Australia demonstrated a pronounced depth-related decrease in the functional diversity of herbivorous fish communities [116]. Other research analyzed the biodiversity of coral reef fish across 12 regions and six biogeographic areas in the Pacific and Atlantic, generally finding that functional richness declined with increasing coral reef depth, potentially related to species composition and nutritional strategies in deeper reefs [23]. Notably, our analysis identified a unimodal distribution pattern in both biodiversity and functional diversity metrics across the Xisha reef system, with optimal values occurring at intermediate depths. This indicated that fish community niche differentiation was highest at approximately 20 m, leading to more comprehensive resource utilization and peak biodiversity and functional diversity [69,70]. Similar turning point phenomena were observed in other coral reef studies; for instance, underwater video research in the Red Sea revealed that fish species alpha diversity peaked at 30 m [26]. In the Hawaiian Islands, remote underwater stereo video surveys from 0 to 100 m showed a distinct transitional zone as fish communities moved from shallow to mesophotic depths [117]. This ecological pattern aligns with vertical zonation patterns documented in reef-associated benthic organisms, with comparative analyses indicating marked disparities in distributional abundance and community structure across photic gradients. For instance, taxonomic dominance shifts are evident between neritic zones (5–10 m depth) and mesophotic ranges (20–25 m), particularly in algal coverage patterns, scleractinian coral assemblages, and poriferan biomass distribution [11]. This result further corroborated the depth-structured variation in reef fish in the Xisha Islands. Overall, the depth gradient variation patterns exhibited by most functional groups of coral reef fish were consistent with their behavior, highlighting the potential of eDNA in reflecting marine fish behavioral patterns [87]. However, site variability remains an inherent challenge in studying depth-related patterns in coral reef ecosystems. While this study employed composite sampling to minimize these effects, residual variability may still influence results. Several critical issues warrant attention in future research: (1) Expanding sampling coverage (in different regions and seasons), refining statistical models, and incorporating multi-parameter monitoring in future studies will further reduce variability and enhance result reliability and generalizability. (2) Future studies employing integrated approaches (such as eDNA-GIS-UVS) could offer broader insights into species distribution patterns within ecosystems. These integrative methodologies have proven especially enlightening in freshwater and tropical environments, encompassing the control of invasive or cryptic species [48,49,51]. (3) While the 12S marker is widely utilized, its taxonomic coverage remains incomplete for certain groups. Incorporating multiple markers (e.g., COI+16S) would enhance resolution. Reference database gaps for tropical Chinese reef species remain a challenge, potentially affecting taxonomic assignments. These factors represent important directions for methodological refinement [118,119].

5. Conclusions

This investigation substantiates the efficacy of environmental DNA (eDNA) metabarcoding methodologies for characterizing multidimensional ecological parameters in reef ecosystems, including ichthyofauna biodiversity patterns, taxonomic predominance, assemblage architecture, and bathymetric depth-structured variation dynamics. The technique demonstrates superior resolution in reconstructing marine trophic networks compared with conventional monitoring approaches, particularly in detecting cryptobenthic taxa and transient pelagic species that are frequently underestimated by visual census techniques. Importantly, our results revealed the depth zonation patterns of coral reef fish and elucidated their variations along the depth gradient. Furthermore, in the context of significant contemporary environmental changes, it is essential to incorporate the depth gradient variation patterns of fish communities into coral reef ecosystem studies, as this is crucial for inferring and predicting how coral reef ecosystems may respond to increasing disturbances. In summary, eDNA metabarcoding offers high taxonomic resolution for monitoring fish in coral reef ecosystems. It enhances our understanding of coral reef fish distribution patterns and underscores the urgency of conserving these ecosystems.

Supplementary Materials

The following supporting information can be downloaded at: https://www.mdpi.com/article/10.3390/fishes10050209/s1. Table S1: Functional traits of fish; Table S2: Composition of fish species at different depth groups; Table S3: The variation in relative abundance of different functional groups along the depth gradient; Table S4: The variation in relative species numbers of different functional groups along a depth gradient.

Author Contributions

Conceptualization, J.Z., T.W., and J.S.; Data curation, J.Z., L.L., Y.L. (Yong Liu), T.W., and J.S.; Methodology, J.Z., T.W., and J.S.; Formal analysis, J.Z., L.L., Y.L. (Yong Liu), T.W., and J.S.; Writing—original draft, J.Z., T.W., and J.S.; Writing—review and editing, J.Z., L.L., Y.L. (Yong Liu), T.W., Y.L. (Yu Liu), Y.X., J.S., H.X., H.H., and Q.H.; Funding acquisition, J.Z., L.L., Y.L. (Yong Liu), T.W., and J.S.; Resources, L.L., Y.L. (Yong Liu), T.W., Y.L. (Yu Liu), Y.X., J.S., H.X., H.H., and Q.H.; Supervision, J.Z., T.W., and J.S. All authors have read and agreed to the published version of the manuscript.

Funding

This research was funded by the Science and Technology Fundamental Resources Investigation Program (2022FY100602); National Natural Science Foundation of China (32473161); Hainan Provincial Natural Science Foundation (323MS124, 322CXTD530); Financial Fund of the Ministry of Agriculture and Rural Affairs, P. R. of China (NHZX2024); The Nan-Fan Aquaculture Joint Open Fund Project, Hainan Tropical Ocean University (No. 2023SCNFKF06); Central Public-interest Scientific Institution Basal Research Fund, CAFS (2023TD16); and Central Public-interest Scientific Institution Basal Research Fund, South China Sea Fisheries Research Institute, CAFS (2021SD04 and 2019TS28).

Institutional Review Board Statement

The animal study protocol was approved by the Ethics Committee of the South China Sea Fisheries Research Institute, Chinese Academy of Fishery Sciences (protocol code nhdf2024-11).

Informed Consent Statement

Not applicable.

Data Availability Statement

Data are contained within the article and available from the corresponding author upon reasonable request.

Conflicts of Interest

The authors declare no conflicts of interest.

References

  1. Fisher, R.; O’Leary, R.A.; Low-Choy, S.; Mengersen, K.; Knowlton, N.; Brainard, R.E.; Caley, M.J. Species Richness on Coral Reefs and the Pursuit of Convergent Global Estimates. Curr. Biol. 2015, 25, 500–505. [Google Scholar] [CrossRef] [PubMed]
  2. Hughes, T.P.; Barnes, M.L.; Bellwood, D.R.; Cinner, J.E.; Cumming, G.S.; Jackson, J.B.C.; Kleypas, J.; van de Leemput, I.A.; Lough, J.M.; Morrison, T.H.; et al. Coral reefs in the Anthropocene. Nature 2017, 546, 82–90. [Google Scholar] [CrossRef] [PubMed]
  3. Coker, D.J.; Wilson, S.K.; Pratchett, M.S. Importance of live coral habitat for reef fishes. Rev. Fish Biol. Fish. 2014, 24, 89–126. [Google Scholar] [CrossRef]
  4. Robinson, J.P.W.; Wilson, S.K.; Robinson, J.; Gerry, C.; Lucas, J.; Assan, C.; Govinden, R.; Jennings, S.; Graham, N.A.J. Productive instability of coral reef fisheries after climate-driven regime shifts. Nat. Ecol. Evol. 2019, 3, 183–190. [Google Scholar] [CrossRef]
  5. Shi, J.; Li, C.H.; Wang, T.; Zhao, J.F.; Liu, Y.; Xiao, Y.Y. Distribution Pattern of Coral Reef Fishes in China. Sustainability 2022, 14, 15107. [Google Scholar] [CrossRef]
  6. Cheal, A.J.; Macneil, M.A.; Emslie, M.J.; Sweatman, H. The threat to coral reefs from more intense cyclones under climate change. Glob. Change Biol. 2017, 23, 1511–1524. [Google Scholar] [CrossRef]
  7. Perry, C.T.; Alvarez-Filip, L.; Graham, N.A.; Mumby, P.J.; Wilson, S.K.; Kench, P.S.; Manzello, D.P.; Morgan, K.M.; Slangen, A.; Thomson, D.P. Loss of coral reef growth capacity to track future increases in sea level. Nature 2018, 558, 396–400. [Google Scholar] [CrossRef]
  8. Alvarez-Filip, L.; Dulvy, N.K.; Gill, J.A.; Côté, I.M.; Watkinson, A.R. Flattening of Caribbean coral reefs: Region-wide declines in architectural complexity. Proc. R. Soc. B Biol. Sci. 2009, 276, 3019–3025. [Google Scholar] [CrossRef]
  9. Des Roches, S.; Post, D.M.; Turley, N.E.; Bailey, J.K.; Hendry, A.P.; Kinnison, M.T.; Schweitzer, J.A.; Palkovacs, E.P. The ecological importance of intraspecific variation. Nat. Ecol. Evol. 2018, 2, 57–64. [Google Scholar] [CrossRef]
  10. Brandl, S.J.; Rasher, D.B.; Côté, I.M.; Casey, J.M.; Darling, E.S.; Lefcheck, J.S.; Duffy, J.E. Coral reef ecosystem functioning: Eight core processes and the role of biodiversity. Front. Ecol. Environ. 2019, 17, 445–454. [Google Scholar] [CrossRef]
  11. Pilly, S.S.; Richardson, L.E.; Turner, J.R.; Roche, R.C. Atoll-dependent variation in depth zonation of benthic communities on remote reefs. Mar. Environ. Res. 2022, 173, 105520. [Google Scholar] [CrossRef] [PubMed]
  12. Karisa, J.F.; Obura, D.O.; Chen, C.A. Spatial heterogeneity of coral reef benthic communities in Kenya. PLoS ONE 2020, 15, e0237397. [Google Scholar] [CrossRef] [PubMed]
  13. Pilly, S.S.; Roche, R.C.; Richardson, L.E.; Turner, J.R. Depth variation in benthic community response to repeated marine heatwaves on remote Central Indian Ocean reefs. R. Soc. Open Sci. 2024, 11, 231246. [Google Scholar] [CrossRef] [PubMed]
  14. Cooper, T.F.; Uthicke, S.; Humphrey, C.; Fabricius, K.E. Gradients in water column nutrients, sediment parameters, irradiance and coral reef development in the Whitsunday Region, central Great Barrier Reef. Estuar. Coast. Shelf Sci. 2007, 74, 458–470. [Google Scholar] [CrossRef]
  15. Nash, K.L.; Graham, N.A.; Wilson, S.K.; Bellwood, D.R. Cross-scale habitat structure drives fish body size distributions on coral reefs. Ecosystems 2013, 16, 478–490. [Google Scholar] [CrossRef]
  16. Cyronak, T.; Takeshita, Y.; Courtney, T.A.; DeCarlo, E.H.; Eyre, B.D.; Kline, D.I.; Martz, T.; Page, H.; Price, N.N.; Smith, J.; et al. Diel temperature and pH variability scale with depth across diverse coral reef habitats. Limnol. Oceanogr. Lett. 2020, 5, 193–203. [Google Scholar] [CrossRef]
  17. Liaño-Carrera, F.; Camarena-Luhrs, T.; Gómez-Barrero, A.; Martos-Fernández, F.J.; Ramírez-Macias, J.I.; Salas-Monreal, D. New coral reef structures in a tropical coral reef system. Lat. Am. J. Aquat. Res. 2019, 47, 270–281. [Google Scholar] [CrossRef]
  18. Radice, V.Z.; Hoegh-Guldberg, O.; Fry, B.; Fox, M.D.; Dove, S.G. Upwelling as the major source of nitrogen for shallow and deep reef-building corals across an oceanic atoll system. Funct. Ecol. 2019, 33, 1120–1134. [Google Scholar] [CrossRef]
  19. Schlaefer, J.A.; Tebbett, S.B.; Bowden, C.L.; Collins, W.P.; Duce, S.; Hemingson, C.R.; Huertas, V.; Mihalitsis, M.; Morais, J.; Morais, R.A.; et al. A snapshot of sediment dynamics on an inshore coral reef. Mar. Environ. Res. 2022, 181, 105763. [Google Scholar] [CrossRef]
  20. Titlyanov, E.; Titlyanova, T. Reef-building corals—Symbiotic autotrophic organisms: 2. Pathways and mechanisms of adaptation to light. Russ. J. Mar. Biol. 2002, 28, S16–S31. [Google Scholar] [CrossRef]
  21. Duckworth, A.; Giofre, N.; Jones, R. Coral morphology and sedimentation. Mar. Pollut. Bull. 2017, 125, 289–300. [Google Scholar] [CrossRef]
  22. Darling, E.S.; Côté, I.M. Seeking resilience in marine ecosystems. Science 2018, 359, 986–987. [Google Scholar] [CrossRef] [PubMed]
  23. Pinheiro, H.T.; MacDonald, C.; Quimbayo, J.P.; Shepherd, B.; Phelps, T.A.; Loss, A.C.; Teixeira, J.B.; Rocha, L.A. Assembly rules of coral reef fish communities along the depth gradient. Curr. Biol. 2023, 33, 1421–1430. [Google Scholar] [CrossRef]
  24. Robinson, J.P.W.; Benkwitt, C.E.; Maire, E.; Morais, R.; Schiettekatte, N.M.D.; Skinner, C.; Brandl, S.J. Quantifying energy and nutrient fl uxes in coral reef food webs. Trends Ecol. Evol. 2024, 39, 467–478. [Google Scholar] [CrossRef] [PubMed]
  25. Osuka, K.E.; Stewart, B.D.; Samoilys, M.; McClean, C.J.; Musembi, P.; Yahya, S.; Hamad, A.R.; Mbugua, J. Depth and habitat are important drivers of abundance for predatory reef fish off Pemba Island, Tanzania. Mar. Environ. Res. 2022, 175, 105587. [Google Scholar] [CrossRef] [PubMed]
  26. Brokovich, E.; Einbinder, S.; Shashar, N.; Kiflawi, M.; Kark, S. Descending to the twilight-zone: Changes in coral reef fish assemblages along a depth gradient down to 65 m. Mar. Ecol. Prog. Ser. 2008, 371, 253–262. [Google Scholar] [CrossRef]
  27. Cooper, A.M.; MacDonald, C.; Roberts, T.E.; Bridge, T.C.L. Variability in the functional composition of coral reef fish communities on submerged and emergent reefs in the central Great Barrier Reef, Australia. PLoS ONE 2019, 14, e0216785. [Google Scholar] [CrossRef]
  28. Richardson, L.E.; Williams, G.J. Depth zonation of reef fish is predictable but disrupted on contemporary coral reefs. Nat. Ecol. Evol. 2023, 7, 1759–1760. [Google Scholar] [CrossRef]
  29. DiBattista, J.D.; Reimer, J.D.; Stat, M.; Masucci, G.D.; Biondi, P.; De Brauwer, M.; Bunce, M. Digging for DNA at depth: Rapid universal metabarcoding surveys (RUMS) as a tool to detect coral reef biodiversity across a depth gradient. Peer J 2019, 7, e6379. [Google Scholar] [CrossRef]
  30. Feary, D.A.; McCormick, M.I.; Jones, G.P. Growth of reef fishes in response to live coral cover. J. Exp. Mar. Biol. Ecol. 2009, 373, 45–49. [Google Scholar] [CrossRef]
  31. Sheppard, C.E.; Williams, G.J.; Exton, D.A.; Keith, S.A. Co-occurrence of herbivorous fish functional groups correlates with enhanced coral reef benthic state. Glob. Ecol. Biogeogr. 2023, 32, 435–449. [Google Scholar] [CrossRef]
  32. Valentini, A.; Taberlet, P.; Miaud, C.; Civade, R.; Herder, J.; Thomsen, P.F.; Bellemain, E.; Besnard, A.; Coissac, E.; Boyer, F. Next-generation monitoring of aquatic biodiversity using environmental DNA metabarcoding. Mol. Ecol. 2016, 25, 929–942. [Google Scholar] [CrossRef] [PubMed]
  33. Hansen, B.K.; Bekkevold, D.; Clausen, L.W.; Nielsen, E.E. The sceptical optimist: Challenges and perspectives for the application of environmental DNA in marine fisheries. Fish Fish. 2018, 19, 751–768. [Google Scholar] [CrossRef]
  34. Halperin, A.A.; Lichowski, F.; Morioka, J.; O’Brien, K.; Suka, R.; Huntington, B. Coral cover remains suppressed three years after derelict net removal in a remote shallow water coral reef ecosystem. Mar. Pollut. Bull. 2023, 188, 114703. [Google Scholar] [CrossRef]
  35. Gilbey, J.; Carvalho, G.; Castilho, R.; Coscia, I.; Coulson, M.W.; Dahle, G.; Derycke, S.; Francisco, S.M.; Helyar, S.J.; Johansen, T. Life in a drop: Sampling environmental DNA for marine fishery management and ecosystem monitoring. Mar. Policy 2021, 124, 104331. [Google Scholar] [CrossRef]
  36. Veilleux, H.D.; Misutka, M.D.; Glover, C.N. Environmental DNA and environmental RNA: Current and prospective applications for biological monitoring. Sci. Total Environ. 2021, 782, 146891. [Google Scholar] [CrossRef]
  37. Stat, M.; Huggett, M.J.; Bernasconi, R.; DiBattista, J.D.; Berry, T.E.; Newman, S.J.; Harvey, E.S.; Bunce, M. Ecosystem biomonitoring with eDNA: Metabarcoding across the tree of life in a tropical marine environment. Sci. Rep. 2017, 7, 12240. [Google Scholar] [CrossRef]
  38. Tsuji, S.; Shibata, N.; Inui, R.; Nakao, R.; Akamatsu, Y.; Watanabe, K. Environmental DNA phylogeography: Successful reconstruction of phylogeographic patterns of multiple fish species from cups of water. Mol. Ecol. Resour. 2023, 23, 1050–1065. [Google Scholar] [CrossRef]
  39. Bohmann, K.; Evans, A.; Gilbert, M.T.P.; Carvalho, G.R.; Creer, S.; Knapp, M.; Douglas, W.Y.; De Bruyn, M. Environmental DNA for wildlife biology and biodiversity monitoring. Trends Ecol. Evol. 2014, 29, 358–367. [Google Scholar] [CrossRef]
  40. Oladi, M.; Leontidou, K.; Stoeck, T.; Shokri, M.R. Environmental DNA-based profiling of benthic bacterial and eukaryote communities along a crude oil spill gradient in a coral reef in the Persian Gulf. Mar. Pollut. Bull. 2022, 184, 114143. [Google Scholar] [CrossRef]
  41. DiBattista, J.D.; Coker, D.J.; Sinclair-Taylor, T.H.; Stat, M.; Berumen, M.L.; Bunce, M. Assessing the utility of eDNA as a tool to survey reef-fish communities in the Red Sea. Coral Reefs 2017, 36, 1245–1252. [Google Scholar] [CrossRef]
  42. Gelis, E.R.E.; Kamal, M.M.; Subhan, B.; Bachtiar, I.; Sani, L.M.I.; Madduppa, H. Environmental biomonitoring of reef fish community structure with eDNA metabarcoding in the Coral Triangle. Environ. Biol. Fishes 2021, 104, 887–903. [Google Scholar] [CrossRef]
  43. Port, J.A.; O’Donnell, J.L.; Romero-Maraccini, O.C.; Leary, P.R.; Litvin, S.Y.; Nickols, K.J.; Yamahara, K.M.; Kelly, R.P. Assessing vertebrate biodiversity in a kelp forest ecosystem using environmental DNA. Mol. Ecol. 2016, 25, 527–541. [Google Scholar] [CrossRef] [PubMed]
  44. Canals, O.; Mendibil, I.; Santos, M.; Irigoien, X.; Rodríguez-Ezpeleta, N. Vertical stratification of environmental DNA in the open ocean captures ecological patterns and behavior of deep-sea fishes. Limnol. Oceanogr. Lett. 2021, 6, 339–347. [Google Scholar] [CrossRef]
  45. Jeunen, G.J.; Lamare, M.D.; Knapp, M.; Spencer, H.G.; Taylor, H.R.; Stat, M.; Bunce, M.; Gemmell, N.J. Water stratification in the marine biome restricts vertical environmental DNA (eDNA) signal dispersal. Environ. DNA 2020, 2, 99–111. [Google Scholar] [CrossRef]
  46. Mathon, L.; Baletaud, F.; Lebourges-Dhaussy, A.; Lecellier, G.; Menkes, C.; Bachelier, C.; Bonneville, C.; Dejean, T.; Dumas, M.; Fiat, S. Three-dimensional conservation planning of fish biodiversity metrics to achieve the deep-sea 30 × 30 conservation target. Conserv. Biol. 2024, 39, e14368. [Google Scholar] [CrossRef]
  47. Doxa, A.; Almpanidou, V.; Katsanevakis, S.; Queirós, A.M.; Kaschner, K.; Garilao, C.; Kesner-Reyes, K.; Mazaris, A.D. 4D marine conservation networks: Combining 3D prioritization of present and future biodiversity with climatic refugia. Glob. Change Biol. 2022, 28, 4577–4588. [Google Scholar] [CrossRef]
  48. Dali, M.Z.M.; Nasir, M.; Khaleel, A.G.; Chun, L.M.; Gan, H.M.; Wan, N.; Umar, R.; Kamarudin, A.S. Predicting Cherax quadricarinatus Habitat Distribution Patterns Through the Usage of GIS and eDNA Analysis in Terengganu, Malaysia. Sains Malays. 2023, 52, 343–354. [Google Scholar] [CrossRef]
  49. Dali, M.Z.M.; Umar, R.; Ismail, N.; Juahir, H.; Nasir, M.; Khaleel, A.G.; Madiran, N.A.; Kari, Z.A.; Wei, L.S.; Tahiluddin, A.B.; et al. Detection and Management of Freshwater Invasive Alien Species through Environmental DNA Analysis and Geographic Information Systems: A Review. Sustainability 2023, 15, 9497. [Google Scholar] [CrossRef]
  50. Wiggins, J.J.; Tobias, V.D.; Holcombe, E.F.; Karpenko, K.; Huber, E.R.; Goodman, A.C. Leveraging environmental DNA (eDNA) to optimize targeted removal of invasive fishes. J. Freshw. Ecol. 2024, 39, 2378841. [Google Scholar] [CrossRef]
  51. Kasai, A.; Yamazaki, A.; Ahn, H.; Yamanaka, H.; Kameyama, S.; Masuda, R.; Azuma, N.; Kimura, S.; Karaki, T.; Kurokawa, Y.; et al. Distribution of Japanese Eel Anguilla japonica Revealed by Environmental DNA. Front. Ecol. Evol. 2021, 9, 621461. [Google Scholar] [CrossRef]
  52. Bessey, C.; Depczynski, M.; Goetze, J.S.; Moore, G.; Fulton, C.J.; Snell, M.; Parsons, S.K.; Berry, O.; Wilson, S. Cryptic biodiversity: A portfolio-approach to coral reef fish surveys. Limnol. Oceanogr. Methods 2023, 21, 594–605. [Google Scholar] [CrossRef]
  53. Hoban, M.L.; Bunce, M.; Bowen, B.W. Plumbing the depths with environmental DNA (eDNA): Metabarcoding reveals biodiversity zonation at 45–60 m on mesophotic coral reefs. Mol. Ecol. 2023, 32, 5590–5608. [Google Scholar] [CrossRef] [PubMed]
  54. Mathon, L.; Marques, V.; Mouillot, D.; Albouy, C.; Andrello, M.; Baletaud, F.; Borrero-Perez, G.H.; Dejean, T.; Edgar, G.J.; Grondin, J.; et al. Cross-ocean patterns and processes in fish biodiversity on coral reefs through the lens of eDNA metabarcoding. Proc. R. Soc. B—Biol. Sci. 2022, 289, 20220162. [Google Scholar] [CrossRef]
  55. Li, Y.Z.; Jia, X.P.; Chen, G.B. Coral Reef Fish Stocks in the South China Sea; Ocean Press: Beijing, China, 2007; pp. 1–446. [Google Scholar]
  56. Huang, H.; Dong, Z.J.; Lian, J.S. Establishment of nature reserve of coral reef ecosystem on the Xisha Islands. Trop. Geogr. 2008, 28, 540–544. [Google Scholar]
  57. Gu, S.S.; Deng, Y.; Wang, P.Y.; Li, C.H.; Shi, D.J.; Wang, S.P. Assessing riverine fish community diversity and stability by eDNA metabarcoding. Ecol. Indic. 2023, 157, 111222. [Google Scholar] [CrossRef]
  58. Miya, M.; Sato, Y.; Fukunaga, T.; Sado, T.; Poulsen, J.Y.; Sato, K.; Minamoto, T.; Yamamoto, S.; Yamanaka, H.; Araki, H.; et al. MiFish, a set of universal PCR primers for metabarcoding environmental DNA from fishes: Detection of more than 230 subtropical marine species. R. Soc. Open Sci. 2015, 2, 150088. [Google Scholar] [CrossRef]
  59. Iwasaki, W.; Fukunaga, T.; Isagozawa, R.; Yamada, K.; Maeda, Y.; Satoh, T.P.; Sado, T.; Mabuchi, K.; Takeshima, H.; Miya, M.; et al. MitoFish and MitoAnnotator: A Mitochondrial Genome Database of Fish with an Accurate and Automatic Annotation Pipeline. Mol. Biol. Evol. 2013, 30, 2531–2540. [Google Scholar] [CrossRef]
  60. Zhao, J.; Wang, T.; Li, C.; Shi, J.; Xie, H.; Luo, L.; Xiao, Y.; Liu, Y. Seven decades of transformation: Evaluating the dynamics of coral reef fish communities in the Xisha Islands, South China Sea. Rev. Fish Biol. Fish. 2024, 34, 1261–1281. [Google Scholar] [CrossRef]
  61. Peter, F.S. The Ecology of Fishes on Coral Reefs; Academic Press: New York, NY, USA, 1991; pp. 47–51. [Google Scholar]
  62. Wang, T.; Liu, Y.; Li, C.H.; Xiao, Y.Y.; Lin, L.; Li, C.R.; Xie, Y.F.; Wu, P. Characteristics of fish community structure in coral reefs adjacent to yongxing island of xisha islands. Acta Hydrobiol. Sin. 2023, 47, 674–683. [Google Scholar]
  63. Toussaint, A.; Charpin, N.; Brosse, S.; Villéger, S. Global functional diversity of freshwater fish is concentrated in the Neotropics while functional vulnerability is widespread. Sci. Rep. 2016, 6, 22125. [Google Scholar] [CrossRef] [PubMed]
  64. Petchey, O.L.; Gaston, K.J. Functional diversity (FD), species richness and community composition. Ecol. Lett. 2002, 5, 402–411. [Google Scholar] [CrossRef]
  65. Zintzen, V.; Anderson, M.J.; Roberts, C.D.; Diebel, C.E. Increasing variation in taxonomic distinctness reveals clusters of specialists in the deep sea. Ecography 2011, 34, 306–317. [Google Scholar] [CrossRef]
  66. Margalef, R. Perspectives in Ecological Theory; University of Chicago Press: Chicago, IL, USA, 1968; pp. 121–127. [Google Scholar]
  67. Pielou, E.C. The measurement of diversity in different types of biological collections. J. Theor. Biol. 1966, 13, 131–144. [Google Scholar] [CrossRef]
  68. Pielou, E. The use of information theory in the study of ecological succession. J. Theor. Biol. 1966, 10, 370–383. [Google Scholar] [CrossRef] [PubMed]
  69. Villéger, S.; Mason, N.W.; Mouillot, D. New multidimensional functional diversity indices for a multifaceted framework in functional ecology. Ecology 2008, 89, 2290–2301. [Google Scholar] [CrossRef] [PubMed]
  70. Laliberté, E.; Legendre, P. A distance-based framework for measuring functional diversity from multiple traits. Ecology 2010, 91, 299–305. [Google Scholar] [CrossRef]
  71. Zhu, Y.; Zhang, C.; Cheng, Q.; Zhang, Y.; Wang, C.; Tian, M.; Yang, W.; Sun, B.; Zheng, W.; Zheng, B. Fishes of the South China Sea; Science Press: Beijing, China, 1962; pp. 1–1184. [Google Scholar]
  72. Donovan, M.K.; Friedlander, A.M.; Lecky, J.; Jouffray, J.B.; Williams, G.J.; Wedding, L.M.; Crowder, L.B.; Erickson, A.L.; Graham, N.A.J.; Gove, J.M.; et al. Combining fish and benthic communities into multiple regimes reveals complex reef dynamics. Sci. Rep. 2018, 8, 16943. [Google Scholar] [CrossRef]
  73. Hemingson, C.R.; Mihalitsis, M.; Bellwood, D.R. Are fish communities on coral reefs becoming less colourful? Glob. Change Biol. 2022, 28, 3321–3332. [Google Scholar] [CrossRef]
  74. Kelly, R.P.; Port, J.A.; Yamahara, K.M.; Martone, R.G.; Lowell, N.; Thomsen, P.F.; Mach, M.E.; Bennett, M.; Prahler, E.; Caldwell, M.R. Harnessing DNA to improve environmental management. Science 2014, 344, 1455–1456. [Google Scholar] [CrossRef]
  75. Evans, N.T.; Shirey, P.D.; Wieringa, J.G.; Mahon, A.R.; Lamberti, G.A. Comparative Cost and Effort of Fish Distribution Detection via Environmental DNA Analysis and Electrofishing. Fisheries 2017, 42, 90–99. [Google Scholar] [CrossRef]
  76. Ji, Y.; Ashton, L.; Pedley, S.M.; Edwards, D.P.; Tang, Y.; Nakamura, A.; Kitching, R.; Dolman, P.M.; Woodcock, P.; Edwards, F.A. Reliable, verifiable and efficient monitoring of biodiversity via metabarcoding. Ecol. Lett. 2013, 16, 1245–1257. [Google Scholar] [CrossRef] [PubMed]
  77. Gómez-Buckley, M.C.; Gallego, R.; Arranz, V.; Halafihi, T.; Stone, K.; Erdmann, M.; Tornabene, L.M. Comparing anesthetic stations and environmental DNA sampling to determine community composition of cryptobenthic coral reef fishes of Vava’u, Kingdom of Tonga. Coral Reefs 2023, 42, 785–797. [Google Scholar] [CrossRef]
  78. Chen, X.Y.; Li, S.; Zhao, J.D.; Yao, M. Passive eDNA sampling facilitates biodiversity monitoring and rare species detection. Environ. Int. 2024, 187, 108706. [Google Scholar] [CrossRef]
  79. West, K.M.; Stat, M.; Harvey, E.S.; Skepper, C.L.; DiBattista, J.D.; Richards, Z.T.; Travers, M.J.; Newman, S.J.; Bunce, M. eDNA metabarcoding survey reveals fine-scale coral reef community variation across a remote, tropical island ecosystem. Mol. Ecol. 2020, 29, 1069–1086. [Google Scholar] [CrossRef]
  80. Blanchette, A.; Ely, T.; Zeko, A.; Sura, S.A.; Turba, R.; Fong, P. Damselfish Stegastes nigricans increase algal growth within their territories on shallow coral reefs via enhanced nutrient supplies. J. Exp. Mar. Biol. Ecol. 2019, 513, 21–26. [Google Scholar] [CrossRef]
  81. MacDonald, C.; Tauati, M.I.; Jones, G.P. Depth patterns in microhabitat versatility and selectivity in coral reef damselfishes. Mar. Biol. 2018, 165, 138. [Google Scholar] [CrossRef]
  82. Ross, S.W.; Quattrini, A.M.; Roa-Varón, A.Y.; McClain, J.P. Species composition and distributions of mesopelagic fishes over the slope of the north-central Gulf of Mexico. Deep-Sea Res. Part II—Top. Stud. Oceanogr. 2010, 57, 1926–1956. [Google Scholar] [CrossRef]
  83. Sassa, C.; Kawaguchi, K.; Hirota, Y.; Ishida, M. Distribution depth of the transforming stage larvae of myctophid fishes in the subtropical-tropical waters of the western North Pacific. Deep-Sea Res. Part I—Oceanogr. Res. Pap. 2007, 54, 2181–2193. [Google Scholar] [CrossRef]
  84. Rissik, D.; Suthers, I.M. Enhanced feeding by pelagic juvenile myctophid fishes within a region of island-induced flow disturbance in the Coral Sea. Mar. Ecol. Prog. Ser. 2000, 203, 263–273. [Google Scholar] [CrossRef]
  85. Flynn, A.J.; Paxton, J.R. Spawning aggregation of the lanternfish Diaphus danae (family Myctophidae) in the north-western Coral Sea and associations with tuna aggregations. Mar. Freshw. Res. 2012, 63, 1255–1271. [Google Scholar] [CrossRef]
  86. Srinivasan, M. Depth distributions of coral reef fishes: The influence of microhabitat structure, settlement, and post-settlement processes. Oecologia 2003, 137, 76–84. [Google Scholar] [CrossRef] [PubMed]
  87. Monuki, K.; Barber, P.H.; Gold, Z. eDNA captures depth partitioning in a kelp forest ecosystem. PLoS ONE 2021, 16, e0253104. [Google Scholar] [CrossRef]
  88. Beng, K.C.; Corlett, R.T. Applications of environmental DNA (eDNA) in ecology and conservation: Opportunities, challenges and prospects. Biodivers. Conserv. 2020, 29, 2089–2121. [Google Scholar] [CrossRef]
  89. Antinero, A.T.; Balaba, M.P.; Leopardas, V.E.; Aspe, N.M.; Kajita, T. Is it really there? Addressing Inadequate Sampling and False Detection in Environmental DNA Metabarcoding. J. Environ. Sci. Manag. 2024, 27, 61–76. [Google Scholar] [CrossRef]
  90. Norström, A.V.; Nyström, M.; Lokrantz, J.; Folke, C. Alternative states on coral reefs: Beyond coral–macroalgal phase shifts. Mar. Ecol. Prog. Ser. 2009, 376, 295–306. [Google Scholar] [CrossRef]
  91. Bell, J.J.; Davy, S.K.; Jones, T.; Taylor, M.W.; Webster, N.S. Could some coral reefs become sponge reefs as our climate changes? Glob. Change Biol. 2013, 19, 2613–2624. [Google Scholar] [CrossRef]
  92. Bellwood, D.R.; Hughes, T.P.; Folke, C.; Nyström, M. Confronting the coral reef crisis. Nature 2004, 429, 827–833. [Google Scholar] [CrossRef]
  93. Noble, M.M.; van Laake, G.; Berumen, M.L.; Fulton, C.J. Community Change within a Caribbean Coral Reef Marine Protected Area following Two Decades of Local Management. PLoS ONE 2013, 8, e54069. [Google Scholar] [CrossRef]
  94. Li, Y.C.; Wu, Z.J.; Liang, J.L.; Chen, S.Q.; Zhao, J.M. Analysis on the outbreak period and cause of Acanthaster planci in Xisha Islands in recent 15 years. Chin. Sci. Bull. 2019, 64, 3478–3484. [Google Scholar]
  95. Wang, T.; Shi, J.; Yu, Y.F.; Zhao, J.F.; Xiao, Y.Y.; Liu, Y.; Li, C.H. Research progress and conservation suggestions of coral reef fishes in the Xisha Islands. Chin. J. Ecol. 2023, 42, 1755–1763. [Google Scholar] [CrossRef]
  96. Mumby, P.J.; Steneck, R.S.; Adjeroud, M.; Arnold, S.N. High resilience masks underlying sensitivity to algal phase shifts of Pacific coral reefs. Oikos 2016, 125, 644–655. [Google Scholar] [CrossRef]
  97. Kapur, M.R.; Franklin, E.C. Simulating future climate impacts on tropical fisheries: Are contemporary spatial fishery management strategies sufficient? Can. J. Fish. Aquat. Sci. 2017, 74, 1974–1989. [Google Scholar] [CrossRef]
  98. Lindahl, U.; Öhman, M.C.; Schelten, C.K. The 1997/1998 mass mortality of corals:: Effects on fish communities on a Tanzanian coral reef. Mar. Pollut. Bull. 2001, 42, 127–131. [Google Scholar] [CrossRef]
  99. Cheal, A.J.; Wilson, S.K.; Emslie, M.J.; Dolman, A.M.; Sweatman, H. Responses of reef fish communities to coral declines on the Great Barrier Reef. Mar. Ecol. Prog. Ser. 2008, 372, 211–223. [Google Scholar] [CrossRef]
  100. Bonaldo, R.M.; Hoey, A.S.; Bellwood, D.R. The ecosystem roles of parrotfishes on tropical reefs. Oceanogr. Mar. Biol. Annu. Rev. 2014, 52, 81–132. [Google Scholar]
  101. Cramer, K.L.; O’Dea, A.; Clark, T.R.; Zhao, J.-x.; Norris, R.D. Prehistorical and historical declines in Caribbean coral reef accretion rates driven by loss of parrotfish. Nat. Commun. 2017, 8, 14160. [Google Scholar] [CrossRef]
  102. Bonaldo, R.; Krajewski, J.; Bellwood, D. Relative impact of parrotfish grazing scars on massive Porites corals at Lizard Island, Great Barrier Reef. Mar. Ecol. Prog. Ser. 2011, 423, 223–233. [Google Scholar] [CrossRef]
  103. Ferreira, C.E.L.; Gonçalves, J.E.A. Community structure and diet of roving herbivorous reef fishes in the Abrolhos Archipelago, south-western Atlantic. J. Fish Biol. 2006, 69, 1533–1551. [Google Scholar] [CrossRef]
  104. Streit, R.; Hoey, A.; Bellwood, D. Feeding characteristics reveal functional distinctions among browsing herbivorous fishes on coral reefs. Coral Reefs 2015, 34, 1037–1047. [Google Scholar] [CrossRef]
  105. Nugues, M.M.; Bak, R.P.M. Long-term dynamics of the brown macroalga Lobophora variegata on deep reefs in Curacao. Coral Reefs 2008, 27, 389–393. [Google Scholar] [CrossRef]
  106. Brokovich, E.; Ayalon, I.; Einbinder, S.; Segev, N.; Shaked, Y.; Genin, A.; Kark, S.; Kiflawi, M. Grazing pressure on coral reefs decreases across a wide depth gradient in the Gulf of Aqaba, Red Sea. Mar. Ecol. Prog. Ser. 2010, 399, 69–80. [Google Scholar] [CrossRef]
  107. Sheppard, C.; Harris, A.; Sheppard, A. Archipelago-wide coral recovery patterns since 1998 in the Chagos Archipelago, central Indian Ocean. Mar. Ecol. Prog. Ser. 2008, 362, 109–117. [Google Scholar] [CrossRef]
  108. Marcelino, L.A.; Westneat, M.W.; Stoyneva, V.; Henss, J.; Rogers, J.D.; Radosevich, A.; Turzhitsky, V.; Siple, M.; Fang, A.; Swain, T.D. Modulation of light-enhancement to symbiotic algae by light-scattering in corals and evolutionary trends in bleaching. PLoS ONE 2013, 8, e61492. [Google Scholar] [CrossRef] [PubMed]
  109. Marlow, J.; Haris, A.; Jompa, J.; Werorilangi, S.; Bates, T.; Bennett, H.; Bell, J.J. Spatial variation in the benthic community composition of coral reefs in the Wakatobi Marine National Park, Indonesia: Updated baselines and limited benthic community shifts. J. Mar. Biol. Assoc. United Kingd. 2020, 100, 37–44. [Google Scholar] [CrossRef]
  110. Loiseau, N.; Villéger, S.; Le Bozec, C.; Gimenez, M.; Kawahara, S.L.; Claverie, T. Mesophotic reefs are not refugia for neither taxonomic nor functional diversity of reef fishes. Coral Reefs 2023, 42, 63–75. [Google Scholar] [CrossRef]
  111. Li, S.; Yu, K.; Shi, Q.; Chen, T.; Zhao, M.; Zhao, J. Interspecies and spatial diversity in the symbiotic zooxanthellae density in corals from northern South China Sea and its relationship to coral reef bleaching. Chin. Sci. Bull. 2008, 53, 295–303. [Google Scholar] [CrossRef]
  112. Houlbrèque, F.; Ferrier-Pagès, C. Heterotrophy in tropical scleractinian corals. Biol. Rev. 2009, 84, 1–17. [Google Scholar] [CrossRef]
  113. Friedlander, A.M.; Brown, E.K.; Jokiel, P.L.; Smith, W.R.; Rodgers, K.S. Effects of habitat, wave exposure, and marine protected area status on coral reef fish assemblages in the Hawaiian archipelago. Coral Reefs 2003, 22, 291–305. [Google Scholar] [CrossRef]
  114. Quimpo, T.J.R.; Cabaitan, P.C.; Olavides, R.D.D.; Dumalagan, E.E.; Munar, J.; Siringan, F.P. Spatial variability in reef-fish assemblages in shallow and upper mesophotic coral ecosystems in the Philippines. J. Fish Biol. 2019, 94, 17–28. [Google Scholar] [CrossRef]
  115. MacDonald, C.; Bridge, T.C.L.; Jones, G.P. Depth, bay position and habitat structure as determinants of coral reef fish distributions: Are deep reefs a potential refuge? Mar. Ecol. Prog. Ser. 2016, 561, 217–231. [Google Scholar] [CrossRef]
  116. Cure, K.; Currey-Randall, L.; Galaiduk, R.; Radford, B.; Wakeford, M.; Heyward, A. Depth gradients in abundance and functional roles suggest limited depth refuges for herbivorous fishes. Coral Reefs 2021, 40, 365–379. [Google Scholar] [CrossRef]
  117. Asher, J.; Williams, I.D.; Harvey, E.S. Mesophotic Depth Gradients Impact Reef Fish Assemblage Composition and Functional Group Partitioning in the Main Hawaiian Islands. Front. Mar. Sci. 2017, 4, 98. [Google Scholar] [CrossRef]
  118. Levy, N.; Simon-Blecher, N.; Ben-Ezra, S.; Yuval, M.; Doniger, T.; Leray, M.; Karako-Lampert, S.; Tarazi, E.; Levy, O. Evaluating biodiversity for coral reef reformation and monitoring on complex 3D structures using environmental DNA (eDNA) metabarcoding. Sci. Total Environ. 2023, 856, 159051. [Google Scholar] [CrossRef]
  119. Alexander, J.B.; Bunce, M.; White, N.; Wilkinson, S.P.; Adam, A.A.S.; Berry, T.; Stat, M.; Thomas, L.; Newman, S.J.; Dugal, L.; et al. Development of a multi-assay approach for monitoring coral diversity using eDNA metabarcoding. Coral Reefs 2020, 39, 159–171. [Google Scholar] [CrossRef]
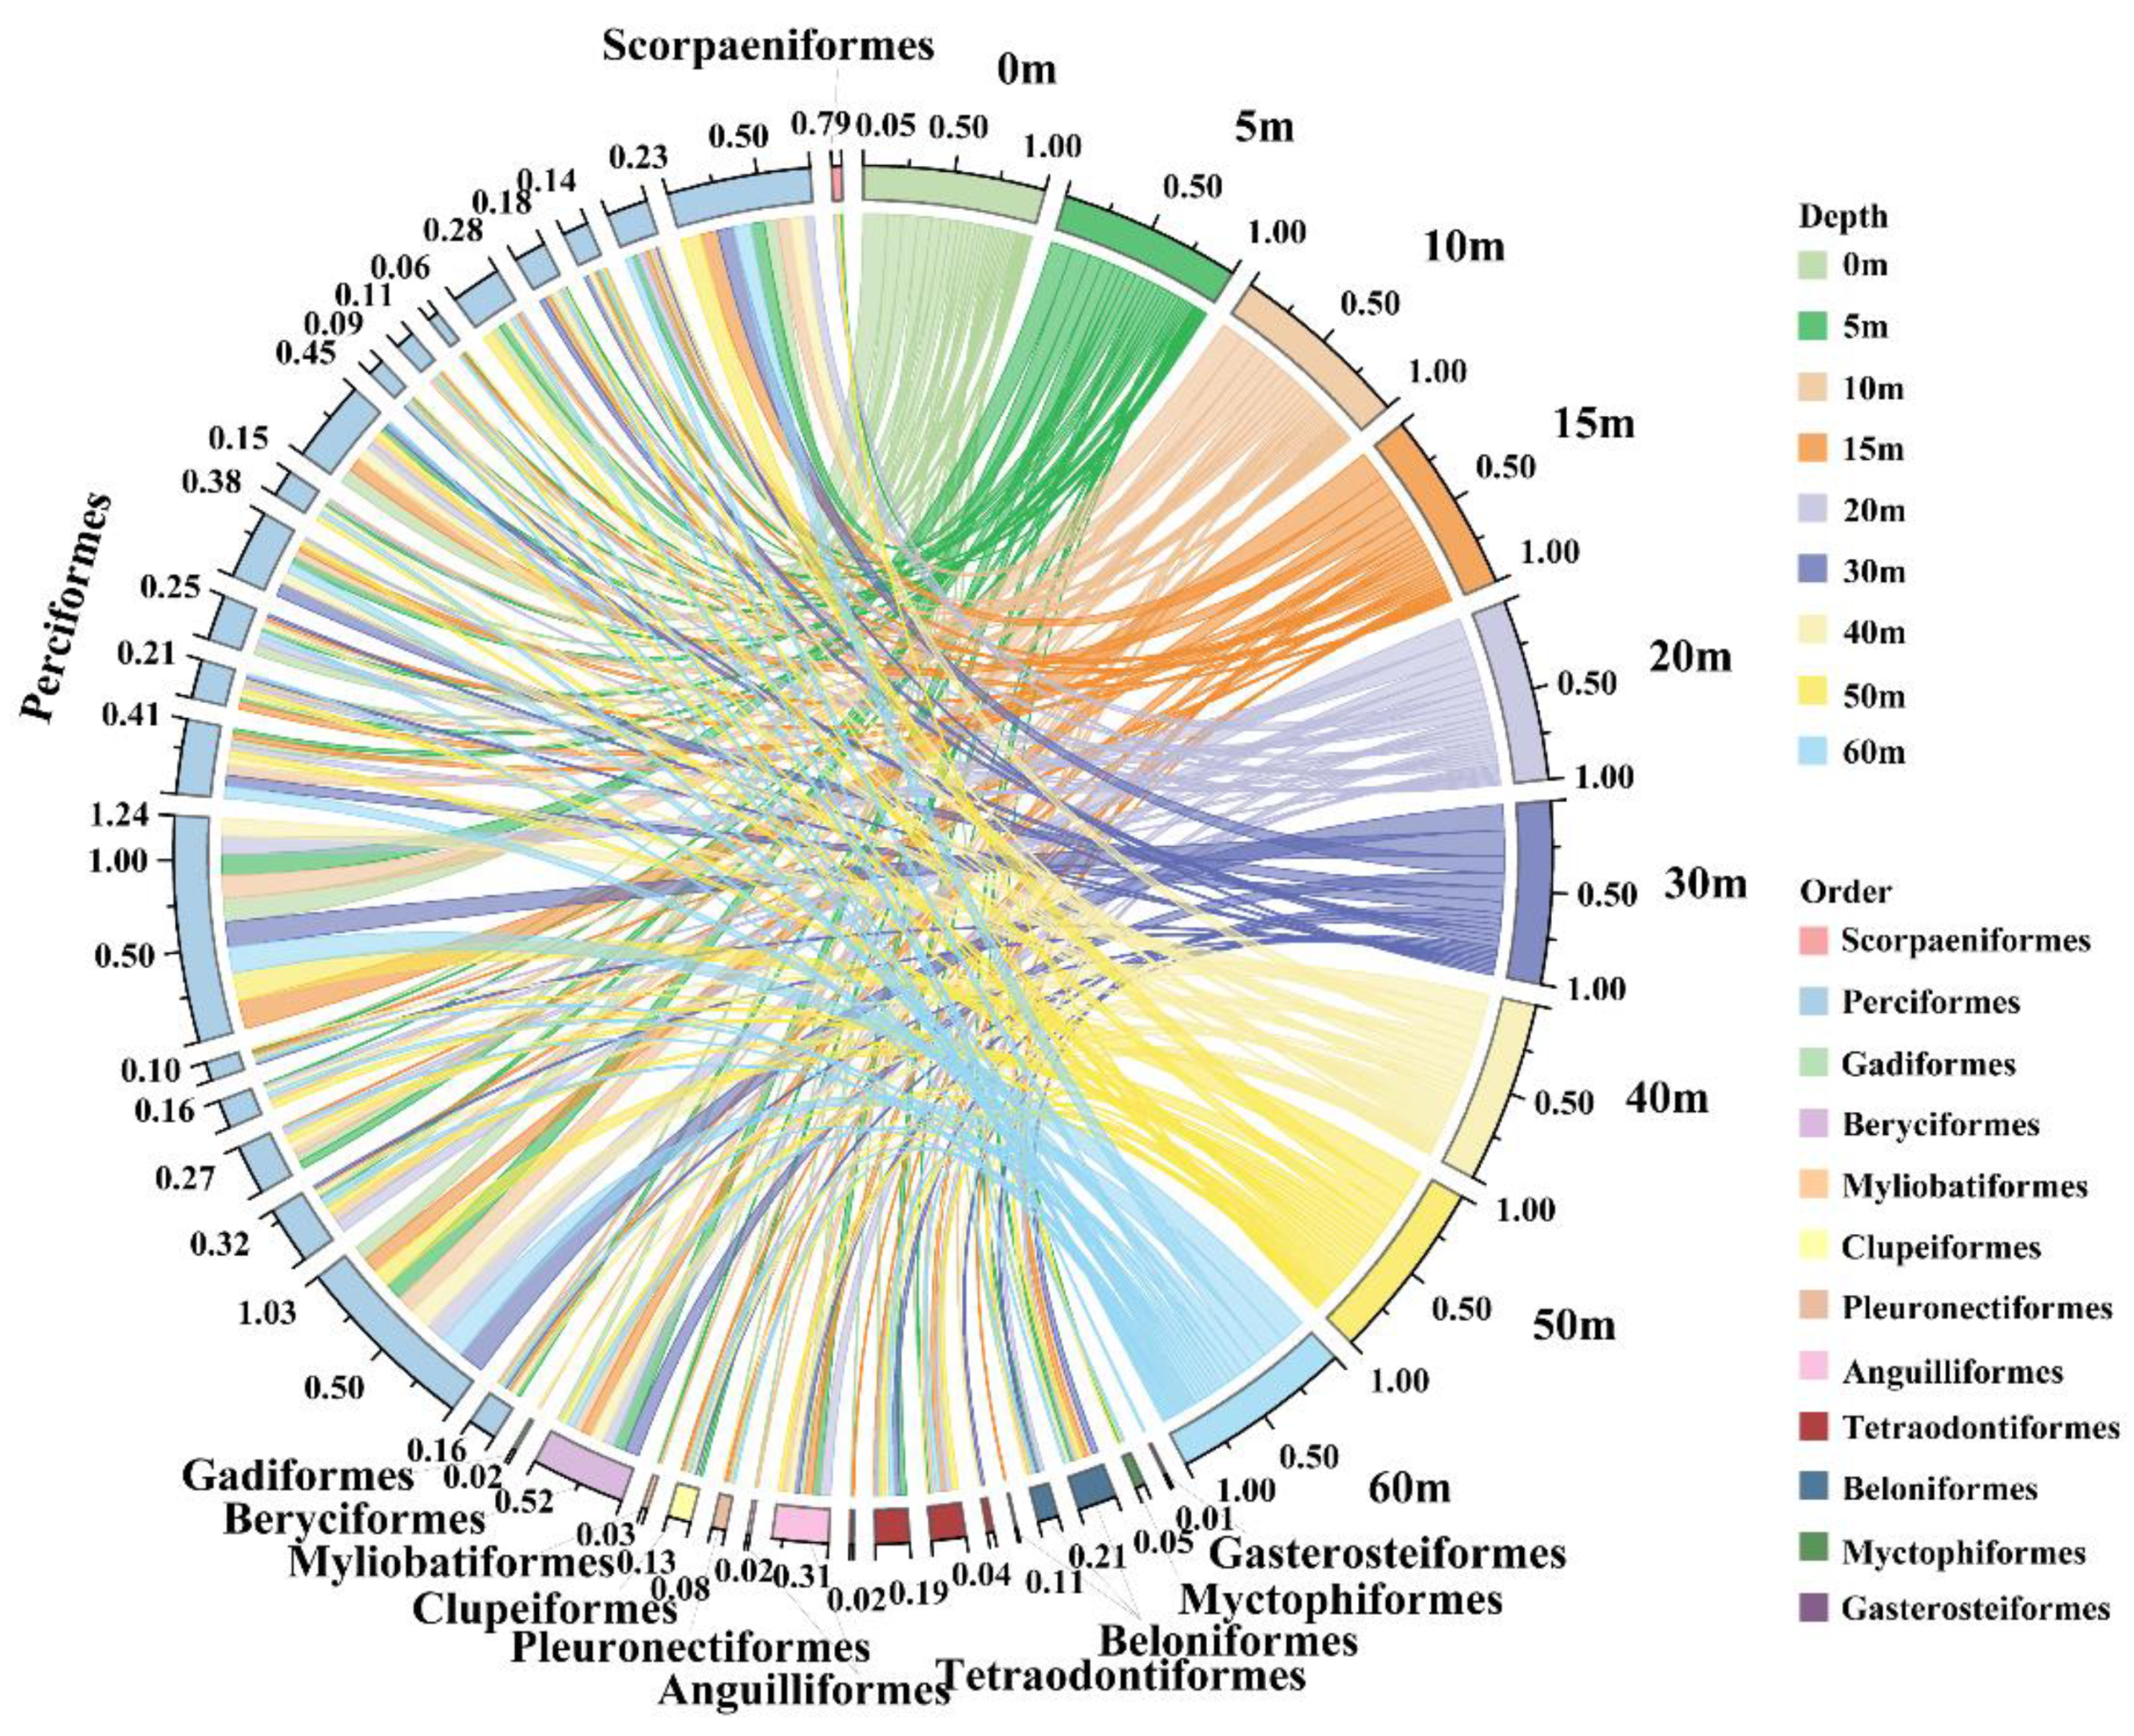
Figure 1. Composition of fish species at different depths groups.
Fishes 10 00209 g001
Figure 2. The similarities and differences in the composition of fish species in different depth groups. (a) The number of species shared between different depth groups. (b) The similarity level between different depth groups.
Fishes 10 00209 g002
Figure 3. The composition of the top 20 fish species with relative abundance in different depth groups. Different colors represent different families.
Fishes 10 00209 g003
Figure 4. Proportion of relative abundance of Scaridae and Acanthuridae in different depth groups.
Fishes 10 00209 g004
Figure 5. The variations in relative abundance of different functional groups along the depth gradient. (a) large carnivores (L-Carnivore), (b) large herbivores (L-Herbivore), (c) medium carnivores (M-Carnivore), (d) medium herbivores (M-Herbivore), (e) medium omnivores (M-Omnivore), (f) small carnivores (S-Carnivore), (g) small herbivores (S-Herbivore), and (h) small omnivores (S-Omnivore).
Fishes 10 00209 g005
Figure 6. The variations in relative species numbers of different functional groups along a depth gradient. (a) large carnivores (L-Carnivore), (b) large herbivores (L-Herbivore), (c) medium carnivores (M-Carnivore), (d) medium herbivores (M-Herbivore), (e) medium omnivores (M-Omnivore), (f) small carnivores (S-Carnivore), (g) small herbivores (S-Herbivore), and (h) small omnivores (S-Omnivore).
Fishes 10 00209 g006
Figure 7. The variations in fish biological diversity along a depth gradient. (a) Shannon–Wiener index (H′), (b) Pielou index (J′), (c) Margalef index (D). “*” indicates significant correlation.
Fishes 10 00209 g007
Figure 8. The variations in fish functional diversity along a depth gradient. (a) Functional dispersion (FDis), (b) Functional evenness (FEve), (c) Function richness (FRic), (d) Quadratic entropy (RaoQ).
Fishes 10 00209 g008
Disclaimer/Publisher’s Note: The statements, opinions and data contained in all publications are solely those of the individual author(s) and contributor(s) and not of MDPI and/or the editor(s). MDPI and/or the editor(s) disclaim responsibility for any injury to people or property resulting from any ideas, methods, instructions or products referred to in the content.