Article

Physiological and Transcriptome Analyses of Gill and Hepatopancreas of Potamocorbula ustulata Under Ammonia Exposure

1
School of Marine Sciences, Ningbo University, Ningbo 315211, China
2
Ninghai Institute of Mariculture Breeding and Seed Industry, Zhejiang Wanli University, Ningbo 315604, China
3
College of Biological & Environmental Sciences, Zhejiang Wanli University, Ningbo 315100, China
4
College of Advanced Agricultural Sciences, Zhejiang Wanli University, Ningbo 315101, China
*
Authors to whom correspondence should be addressed.
Fishes 2025, 10(5), 200; https://doi.org/10.3390/fishes10050200
Submission received: 28 February 2025 / Revised: 15 April 2025 / Accepted: 23 April 2025 / Published: 27 April 2025
(This article belongs to the Section Genetics and Biotechnology)

Abstract

Excessive ammonia accumulation poses a significant threat to aquatic species. Potamocorbula ustulata, known for its burrowing behavior and high population density, may experience elevated ammonia levels in its environment. However, its ammonia stress response mechanisms remain unclear. This study investigates the physiological and molecular responses of P. ustulata to acute ammonia exposure. Antioxidant enzyme activity was significantly altered in the gills and hepatopancreas, with GS, GDH, and ARG levels markedly increasing in the hepatopancreas. Transcriptome analysis revealed that after 24 h of exposure, differentially expressed genes (DEGs) were enriched in apoptosis and inflammation-related pathways (MAPK, NF-kB, NOD-like receptor signaling). By 96 h, DEGs in the gills were associated with nitrogen metabolism and transport, while those in the hepatopancreas were linked to oxidative phosphorylation and amino acid metabolism. Key ammonia transport and excretion genes, including V-type H+-ATPase, Ammonium transporter Rh, and Na+/K+-ATPase, were significantly upregulated in the gills, while glutamine synthetase and glutamate dehydrogenase were upregulated in the hepatopancreas (p < 0.05). These findings suggest that ammonia stress disrupts antioxidant defense, triggers inflammation and apoptosis, and enhances ammonia tolerance through excretion, glutamine conversion, and urea synthesis. This study provides insights into the molecular mechanisms underlying ammonia tolerance in bivalves.
Key Contribution: (1) Under ammonia stress, we observed an initial increase in antioxidant enzyme activity in P. ustulata, followed by a decline, indicating an insufficient antioxidant defense system against prolonged high ammonia stress. (2) The elevated expression of key ammonia metabolism enzymes (GS, GDH, and ARG) and their genes highlighted the role of glutamine and urea synthesis in mitigating endogenous ammonia, providing a foundation for further research on molluscan ammonia tolerance.

1. Introduction

Ammonia is a widespread pollutant in aquatic environments and has emerged as a significant stressor for aquatic animals. Typically, ammonia in water exists in two forms: ammonium ions (NH4+) and non-ionized ammonia (NH3) [1]. In aquatic settings, the ratio of these forms is predominantly influenced by temperature and pH, with higher temperatures and pH levels corresponding to an increase in the NH3 concentration [2]. NH3 is more toxic than NH4+ and can permeate the gill membrane through infiltration and absorption, entering the bloodstream and causing elevated blood ammonia levels [3]. Accumulation of ammonia beyond a specific threshold in aquatic animals can trigger oxidative stress, inflammatory response, and tissue damage [4]. Elevated concentrations of ammonia disrupt osmotic regulation within the organism’s environment, leading to cell damage in various tissues, including the nervous system, alteration in mitochondrial permeability, and disruption of ion gradients [5,6]. This process also impairs ion transporters, ultimately resulting in cellular dysfunction and tissue damage [7]. Given the omnipresent concern over ammonia levels in aquaculture, research focusing on the toxic effects of ammonia on aquatic animals and strategies for ammonia detoxification holds critical significance.
Existing research on the tolerance mechanisms of aquatic animals to ammonia nitrogen primarily focuses on fish and crustacean species, whereas investigations related to mollusks are comparatively limited. Nevertheless, earlier studies have already provided some preliminary insights. For instance, studies have shown that NH4+/NH3 and H+ transporters in the gill of Sinonovacula constricta work synergistically to lower ammonia levels in the body under high ammonia stress conditions. Moreover, ammonia metabolism-related genes like GS and ARG are upregulated in the hepatopancreas of these shellfish, suggesting that they can mitigate ammonia toxicity by producing glutamine and urea [8]. Similar findings have emerged from studies involving Hyriopsis cumingii and Cyclina sinensis. H. cumingii has been found to metabolize ammonia into glutamine, alanine, and aspartic acid [9]. In the case of C. sinensis, the levels of GS and GDH significantly increased in the gill and hepatopancreas under chronic ammonia nitrogen stress [10]. Collectively, these studies indicate that bivalve mollusks can undertake ammonia metabolism through various pathways, although the associated molecular response mechanisms remain underexplored.
P. ustulata is a small economically significant shellfish species in China, widely distributed in the Liaohe River Delta, the West Sea of South Korea, and the Yangtze River estuary, often dominating certain areas [11,12]. The population density of P. ustulata can reach exceptionally high levels in nature, with densities of up to 3402 individuals per square meter [13]. This high-density population results in an accumulation of ammonia nitrogen in their habitat, primarily due to fecal deposition and ammonia excretion. In a previous study, it was observed that the 96 h LC50 of ammonia nitrogen for P. ustulata was 222 mg/L. This finding suggests the potential presence of a robust ammonia nitrogen tolerance and detoxification mechanism in P. ustulata.
This study focused on P. ustulata to investigate the response to ammonia stress in both the gill and hepatopancreas of the species. Through a comprehensive analysis that combined physiology and transcriptomics, the study systematically assessed the impact of high concentrations of ammonia nitrogen stress. These findings enhance our comprehension of ammonia toxicity, metabolism, and molecular regulatory mechanisms in mollusks.

2. Materials and Methods

2.1. Clam Culture and Sample Collection

The clams utilized in the experiment (shell length 20.18 ± 1.21 mm, wet weight 1.16 ± 0.24 g) were procured from Lulin Market in Ningbo, China. Prior to the experiment, the clams were housed in indoor tanks for a week. The water tank held 20 L of seawater with a salinity of 20.0 psu and a pH ranging between 7.75 and 8.05, while maintaining a water temperature of 24.0 ± 0.5 °C. Throughout the acclimation period, the clams were fed once daily with a diet consisting of microalgae Chaetoceros muelleri. The seawater was completely refreshed daily with 24 h of aeration.
In this study, the median lethal concentration of ammonia nitrogen (222 mg/L, 96 h LC50) was chosen for the exposure experiment. The total ammonia nitrogen (TNA) concentration was adjusted using a stock solution with a 1000 mg/L concentration of ammonia nitrogen (NH4Cl, GR grade, Sangon Biotech, Shanghai, China, ACS reagent, >99.8%). Following acclimation, 600 clams were randomly divided into three groups, each containing 200 clams. These groups were then exposed to a 222 mg/L ammonia nitrogen concentration in 20 L of seawater for 96 h. The clams were categorized into seven groups based on exposure duration (0, 6, 12, 24, 48, 72, and 96 h), with five clams randomly selected from each group in triplicate. During the experiment, no feed was provided. The seawater was changed every 12 h, and ammonium chloride was added to maintain the ammonia nitrogen concentration. At the end of the experiment, the clams were rapidly euthanized in liquid nitrogen, followed by the dissection of gill and hepatopancreas tissues, which were then flash-frozen in liquid nitrogen and stored in cryopreservation tubes at −80 °C.

2.2. Physiological Parameters Determination

Five gills and hepatopancreas samples were randomly selected at 0, 6, 12, 24, 48, 72, and 96 h, followed by the addition of nine volumes of normal saline for tissue homogenization. Subsequently, the homogenates were centrifuged at 4 °C at 3500 revolutions per minute for 15 min, and the resulting supernatant was used to determine the enzyme activity levels.
The impact of ammonia on the metabolic activities of antioxidant enzymes in both the gills and hepatopancreas was examined by assessing the activities of catalase (CAT), superoxide dismutase (SOD), and glutathione peroxidase (GSH-Px), in addition to measuring the levels of malondialdehyde (MDA). Furthermore, the influence of ammonia on the functionality of enzymes concerning ammonia metabolism was investigated through the analysis of enzymes such as glutamine synthase (GS), glutamate dehydrogenase (GDH), and arginase (ARG), as well as the urea levels in the hepatopancreas. The activity of SOD and the concentration of MDA were determined using assay kits (Nanjing Jiancheng Bioengineering Institute, Nanjing, China), while the activities of CAT, GSH-Px, and ARG were assessed with Elisa assay kits (Jiangsu Meike Biotechnology Co., Ltd., Suzhou, China). Additionally, the activities of GS and GDH, along with the urea levels, were measured using assay kits (Shanghai Enzyme-linked Biotechnology Co., Ltd., Shanghai, China).

2.3. Transcriptome Analysis

2.3.1. RNA Extraction and Transcriptome Sequencing

The gill and hepatopancreas tissues from four clams (four biological replicates each) were selected randomly from samples collected at 0 h, 24 h, and 96 h. The tissues were then grouped as D0G, D1G, D4G for gill samples and D0H, D1H, D4H for hepatopancreas samples, with D0G and D0H serving as control groups. Tissue samples were homogenized using a homogenizer (Roche, Basel, Switzerland), and total RNA was extracted with TRIzol reagent (Omega Bio-Tek, Cambridge, MA, USA). The concentration and purity of the RNA were assessed with Nanodrop2000 (Thermo, Waltham, MA, USA), while the quantity and integrity of the RNA were verified using the Agilent 2100 (Agilent Technologies, Santa Clara, CA, USA). Following quality assessment, Illumina NovaSeq 6000 sequencing (Illumina, San Diego, CA, USA)was conducted.

2.3.2. Transcriptome Assembly and Differential Expression Analysis

Clean reads were obtained by removing reads containing adapter, reads containing N base, and low-quality reads from raw data. Then, Q20, Q30, and GC content were calculated. After the clean reads was obtained, the Trinity software (v2.6.6) was used to assemble the clean reads for the reference sequence obtained after the continued analysis.
To determine the transcriptomic differences of P. ustulata under ammonia nitrogen stress, gene expression levels for each sample were calculated using RSEM. The FPKM method was applied to quantify gene expression while correcting for sequencing depth. Differential expression analysis of two groups was performed using the DESeq2 R package (1.20.0), including D0G and D1G, D0G and D4G, D0H and D1H, D0H and D4H. |log2 (Fold Change)| > 1 & padj < 0.05 was used as the screening criteria for DEGs.

2.3.3. Functional Annotation and Enrichment of Differentially Expressed Genes

Gene function was annotated using various databases, namely NR, NT, Pfam, KOG/COG, Swiss-Prot, KEGG, and GO. The GOseq (version 1.10.0) method was employed to conduct a GO enrichment analysis on differentially expressed genes (DEGs) to identify significantly associated biological functions. Additionally, KEGG functional enrichment analysis of DEGs was performed utilizing KOBAS software (version 2.0.12) to identify the key biochemical metabolic pathways and signal transduction pathways involved in DEGs (p < 0.05).

2.4. Statistical Analyses

The data were analyzed using IBM SPSS Statistics 19.0 through a one-way ANOVA with LSD post hoc test for significance analysis (p < 0.05), and the general linear model was used for effect size analysis. Image processing was conducted using GraphPad Prism 8.0.1.244.

3. Results

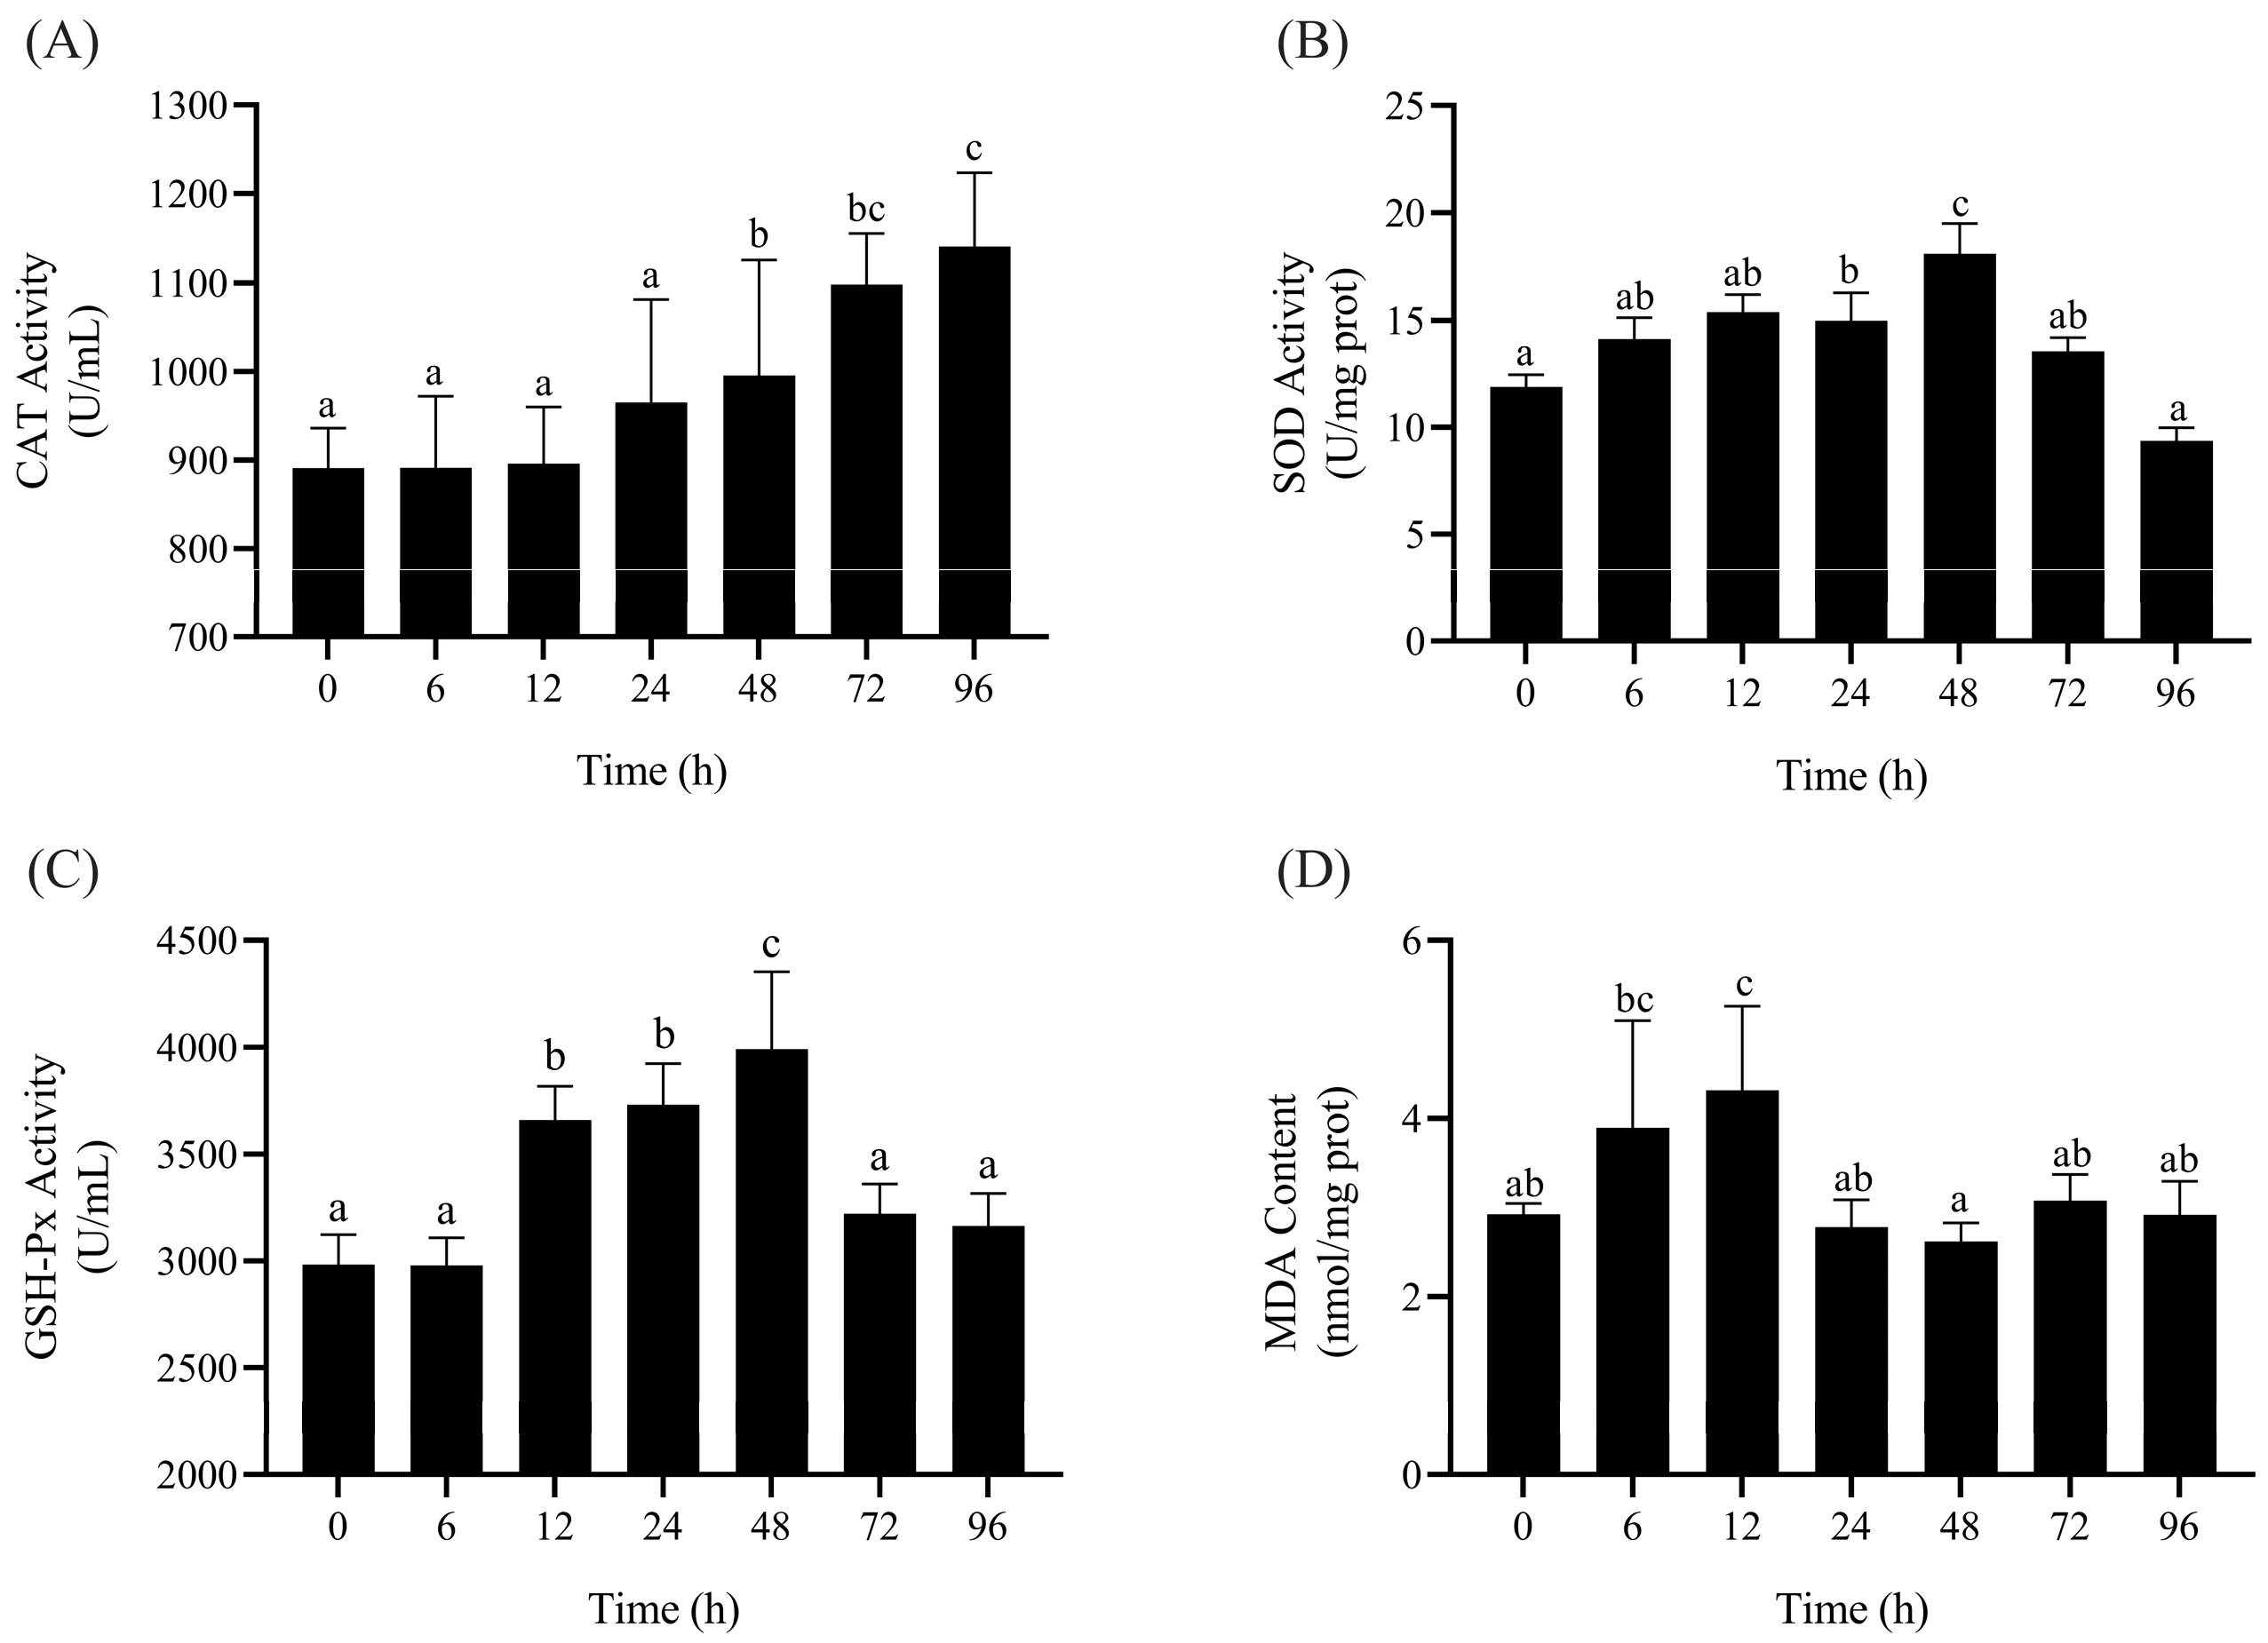
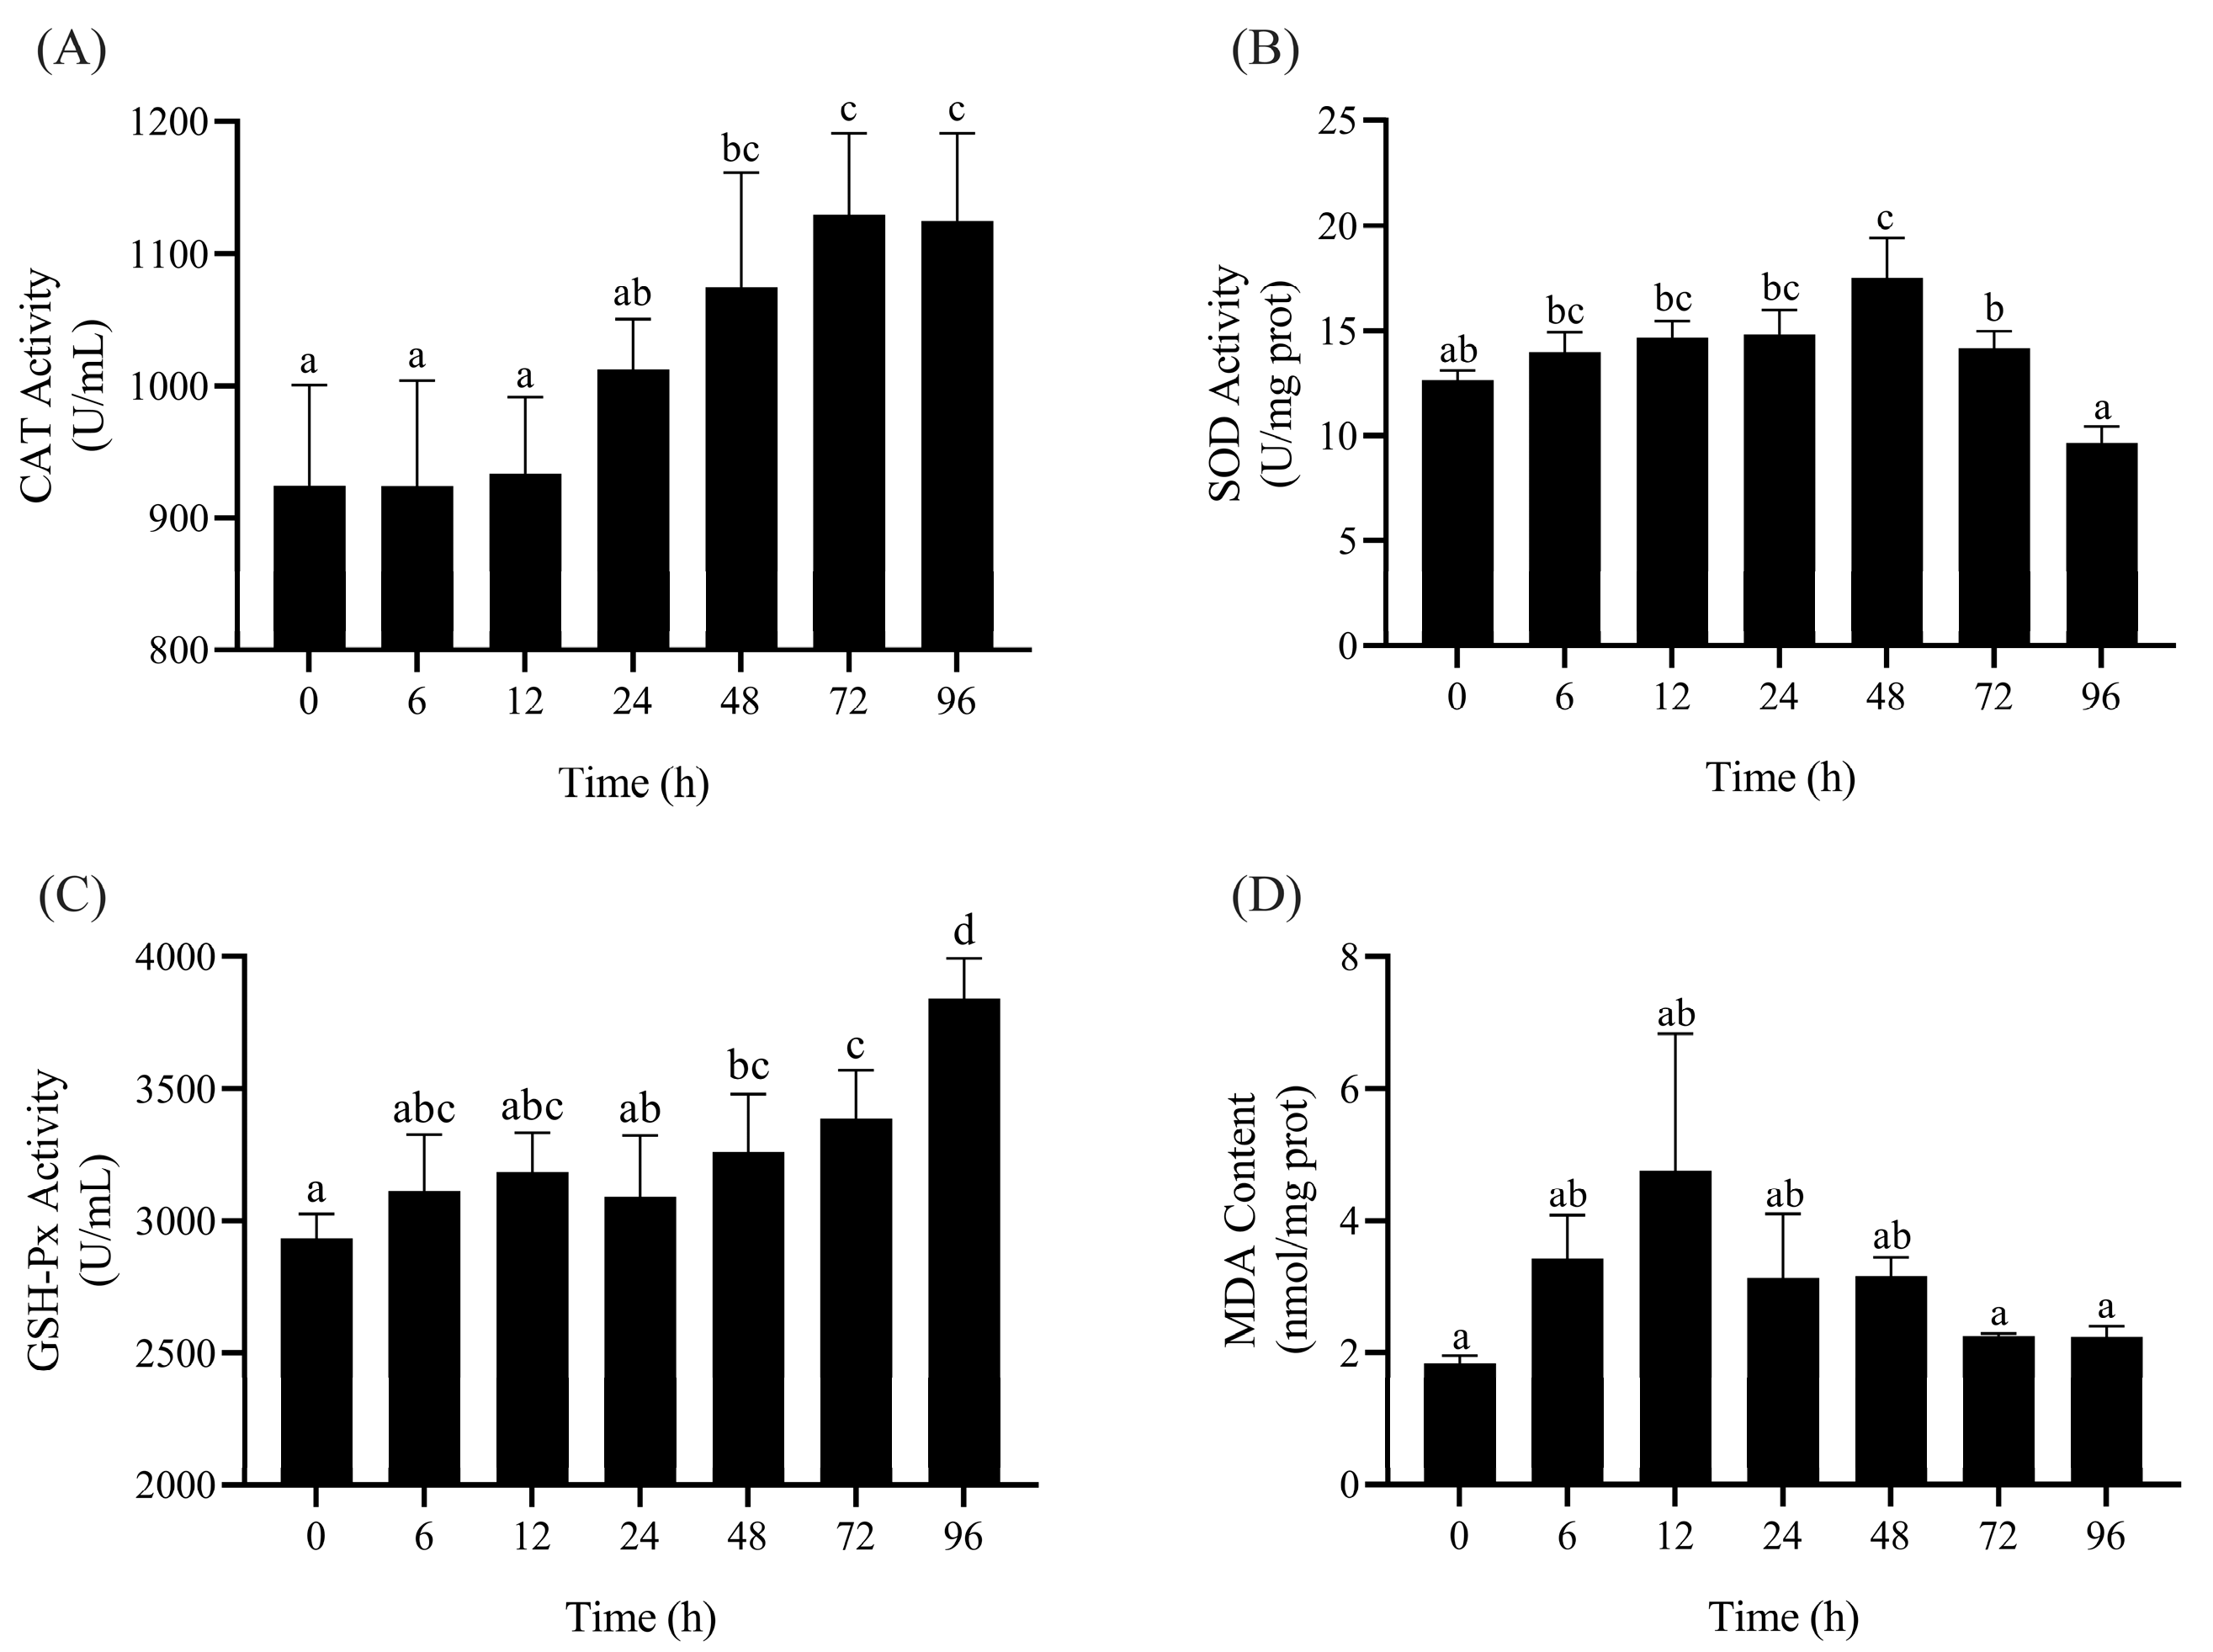
3.1. Enzyme Activity Determination

In this study, the effect size results of all enzyme activities detected are shown in Table 1. According to the criteria proposed by Cohen J. [14], 0.01 was a small effect, 0.06 was a moderate effect, and 0.14 was a large effect. In this experiment, the effect size (η2) of enzyme activity in each tissue was greater than 0.14, so it could be considered that the treatment group in this experiment had a large effect size.
Exposure to ammonia had a significant impact on the antioxidant enzyme activity in P. ustulata (p < 0.05). The CAT activity in the gills was induced with the increasing stress time, being notably higher than that of the control group after 48 h. The SOD activity exhibited a pattern of initial induction followed by inhibition during the stress period, peaking at 48 h. GSH-Px activity increased markedly after a 12 h period, reaching its peak at 48 h, before gradually returning to a level not significantly different from that of the control group. The MDA content showed a significant increase at 12 h, with no notable differences observed during other time periods (Figure 1).
The trends in CAT and SOD activities in the hepatopancreas mirrored those observed in the gills (Figure 2). GSH-Px activity significantly increased up to 48 h, after which, at 72 h, it was not significantly different from that of the control group. From 6 to 48 h, the MDA content was significantly higher than that of the control group, with no noteworthy differences during other time periods. These findings suggest that high levels of ammonia exposure can enhance antioxidant enzyme activity in the gills and hepatopancreas of P. ustulata. However, SOD and GSH-Px displayed a decreasing trend in the later stages, indicating that prolonged exposure to ammonia may lead to damage in the gills, hepatopancreas, and other tissues.
Figure 3 demonstrates the changes in concentrations of GS, GDH, ARG, and urea in the hepatopancreas of P. ustulata under ammonia-induced stress. Following exposure to ammonia, there was an initial increase in GS and GDH activity in the hepatopancreas, which were subsequently followed by a decline. GS activity peaked at 6 h and then decreased, remaining significantly higher than the control group (p < 0.05). GDH activity reached its highest level at 12 h before decreasing after 48 h, showing no significant difference compared to the control group (p > 0.05). ARG activity increased significantly with the duration of stress, while urea content was consistently higher than in the control group during the stress period (p < 0.05).

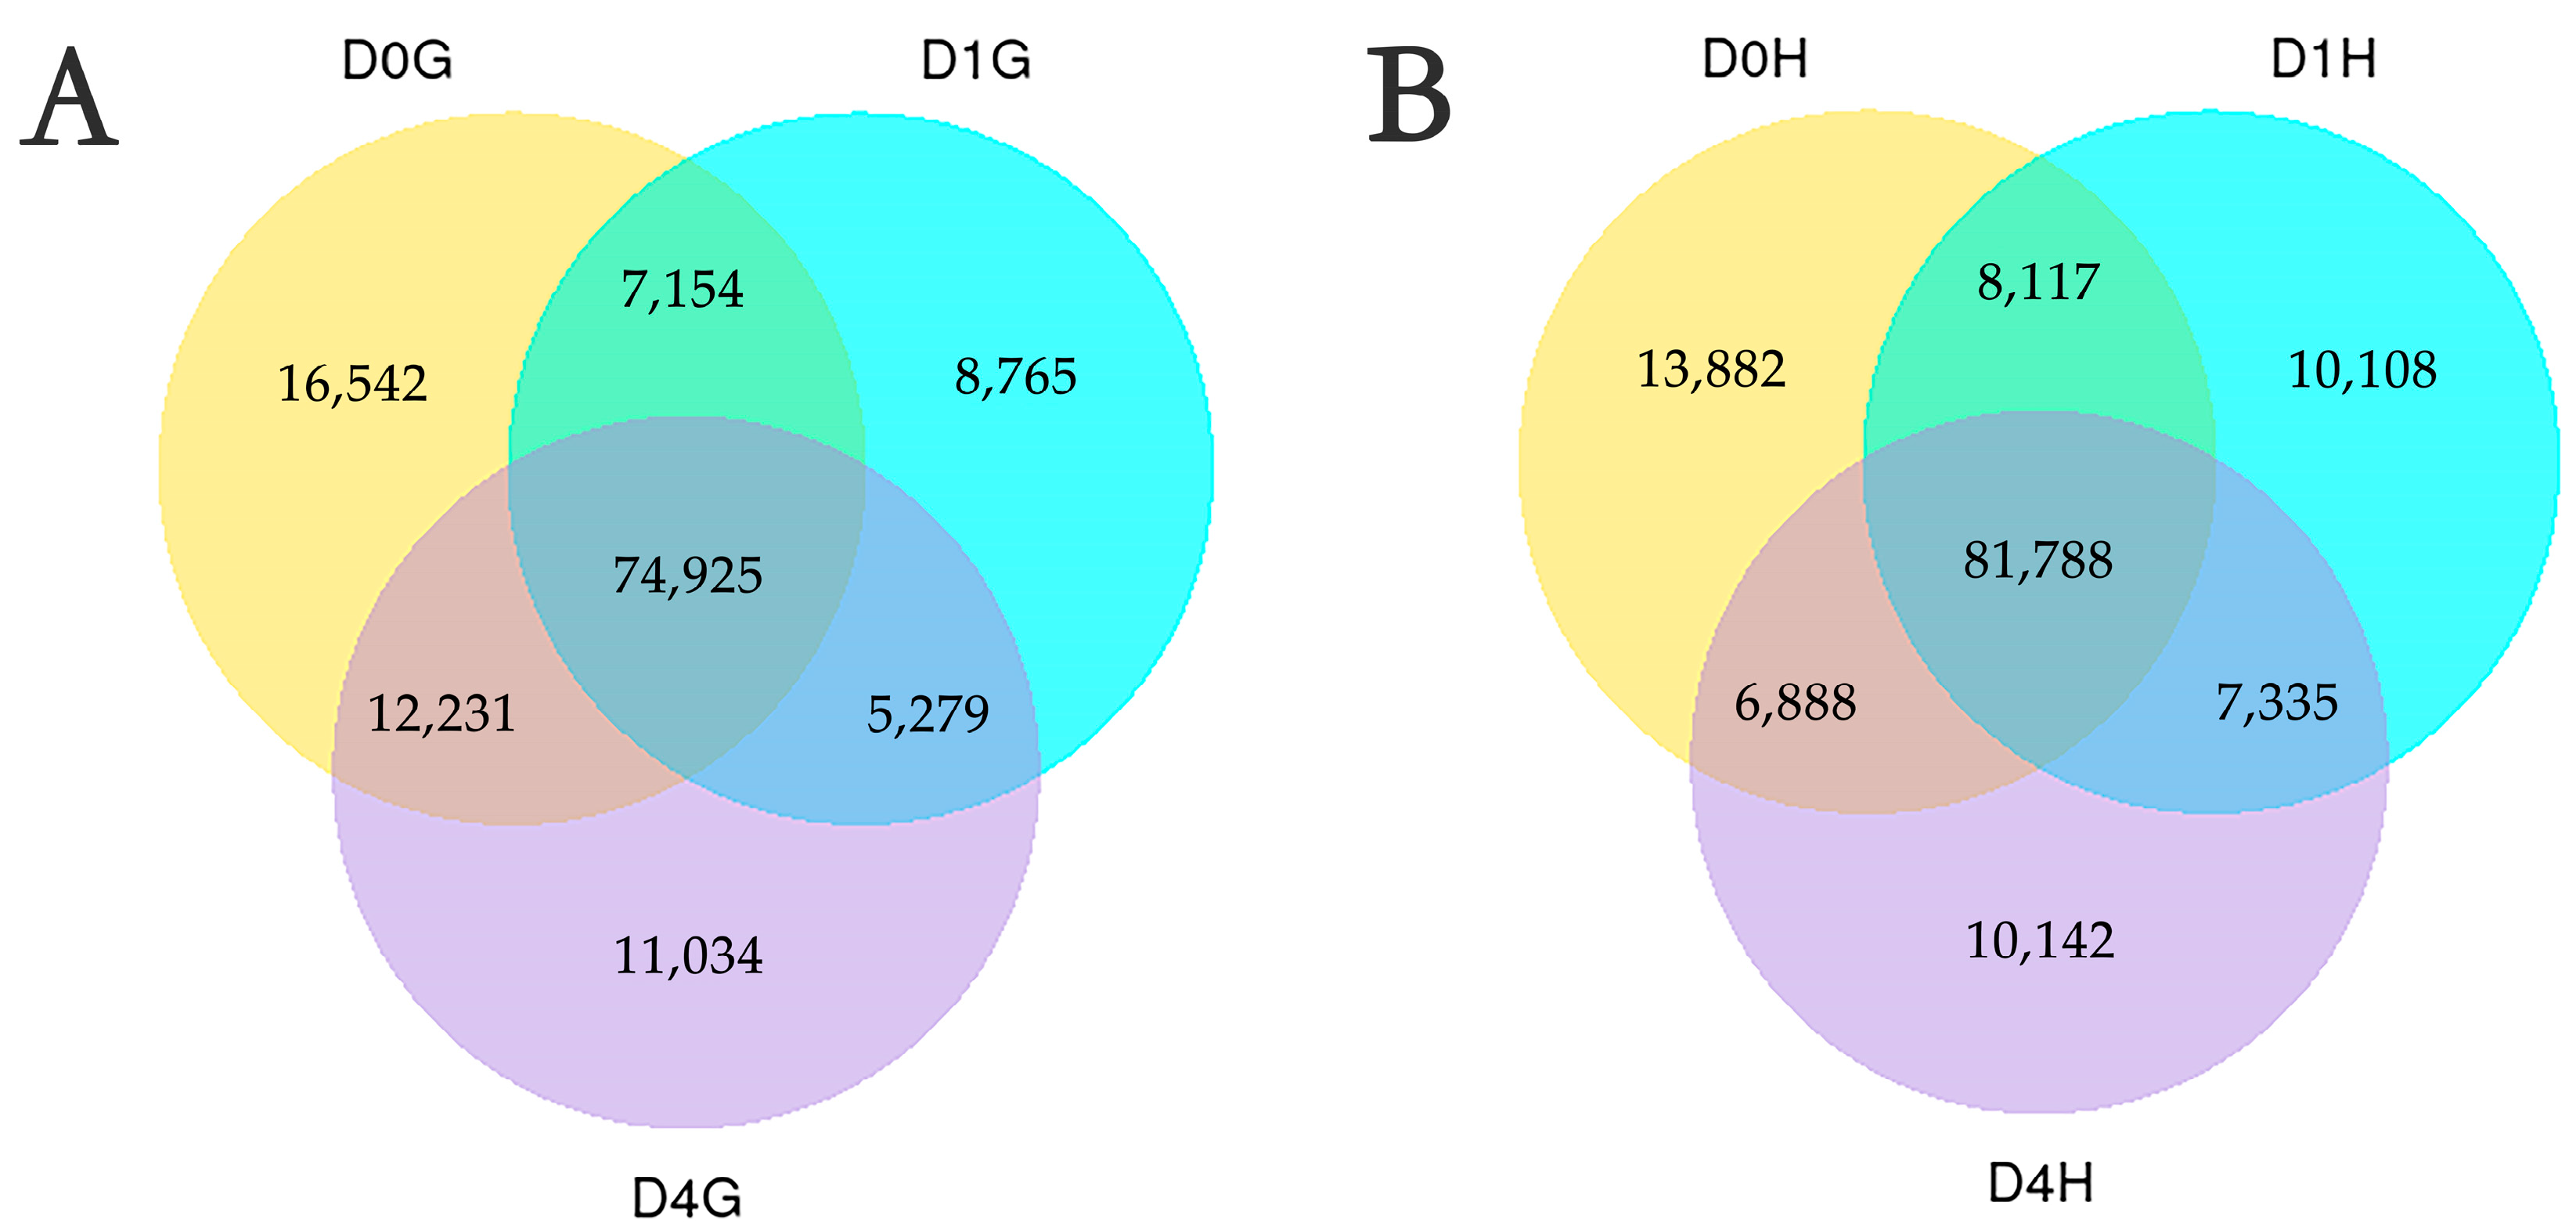
3.2. Characterization of Transcriptome Data

The transcriptome data details for each sample are outlined in Table 2. Following Illumina sequencing, a total of 144 Gb of clean data were acquired through the elimination of reads with adapters, N bases, and low quality from the raw data. The percentages of Q30 and Q20 bases exceeded 91.5% and 96.76%, respectively, while the base error rates were below 0.03%. Pearson correlation analysis revealed high reproducibility between biological replicates (Figure 4), confirming the reliability of the experimental data.

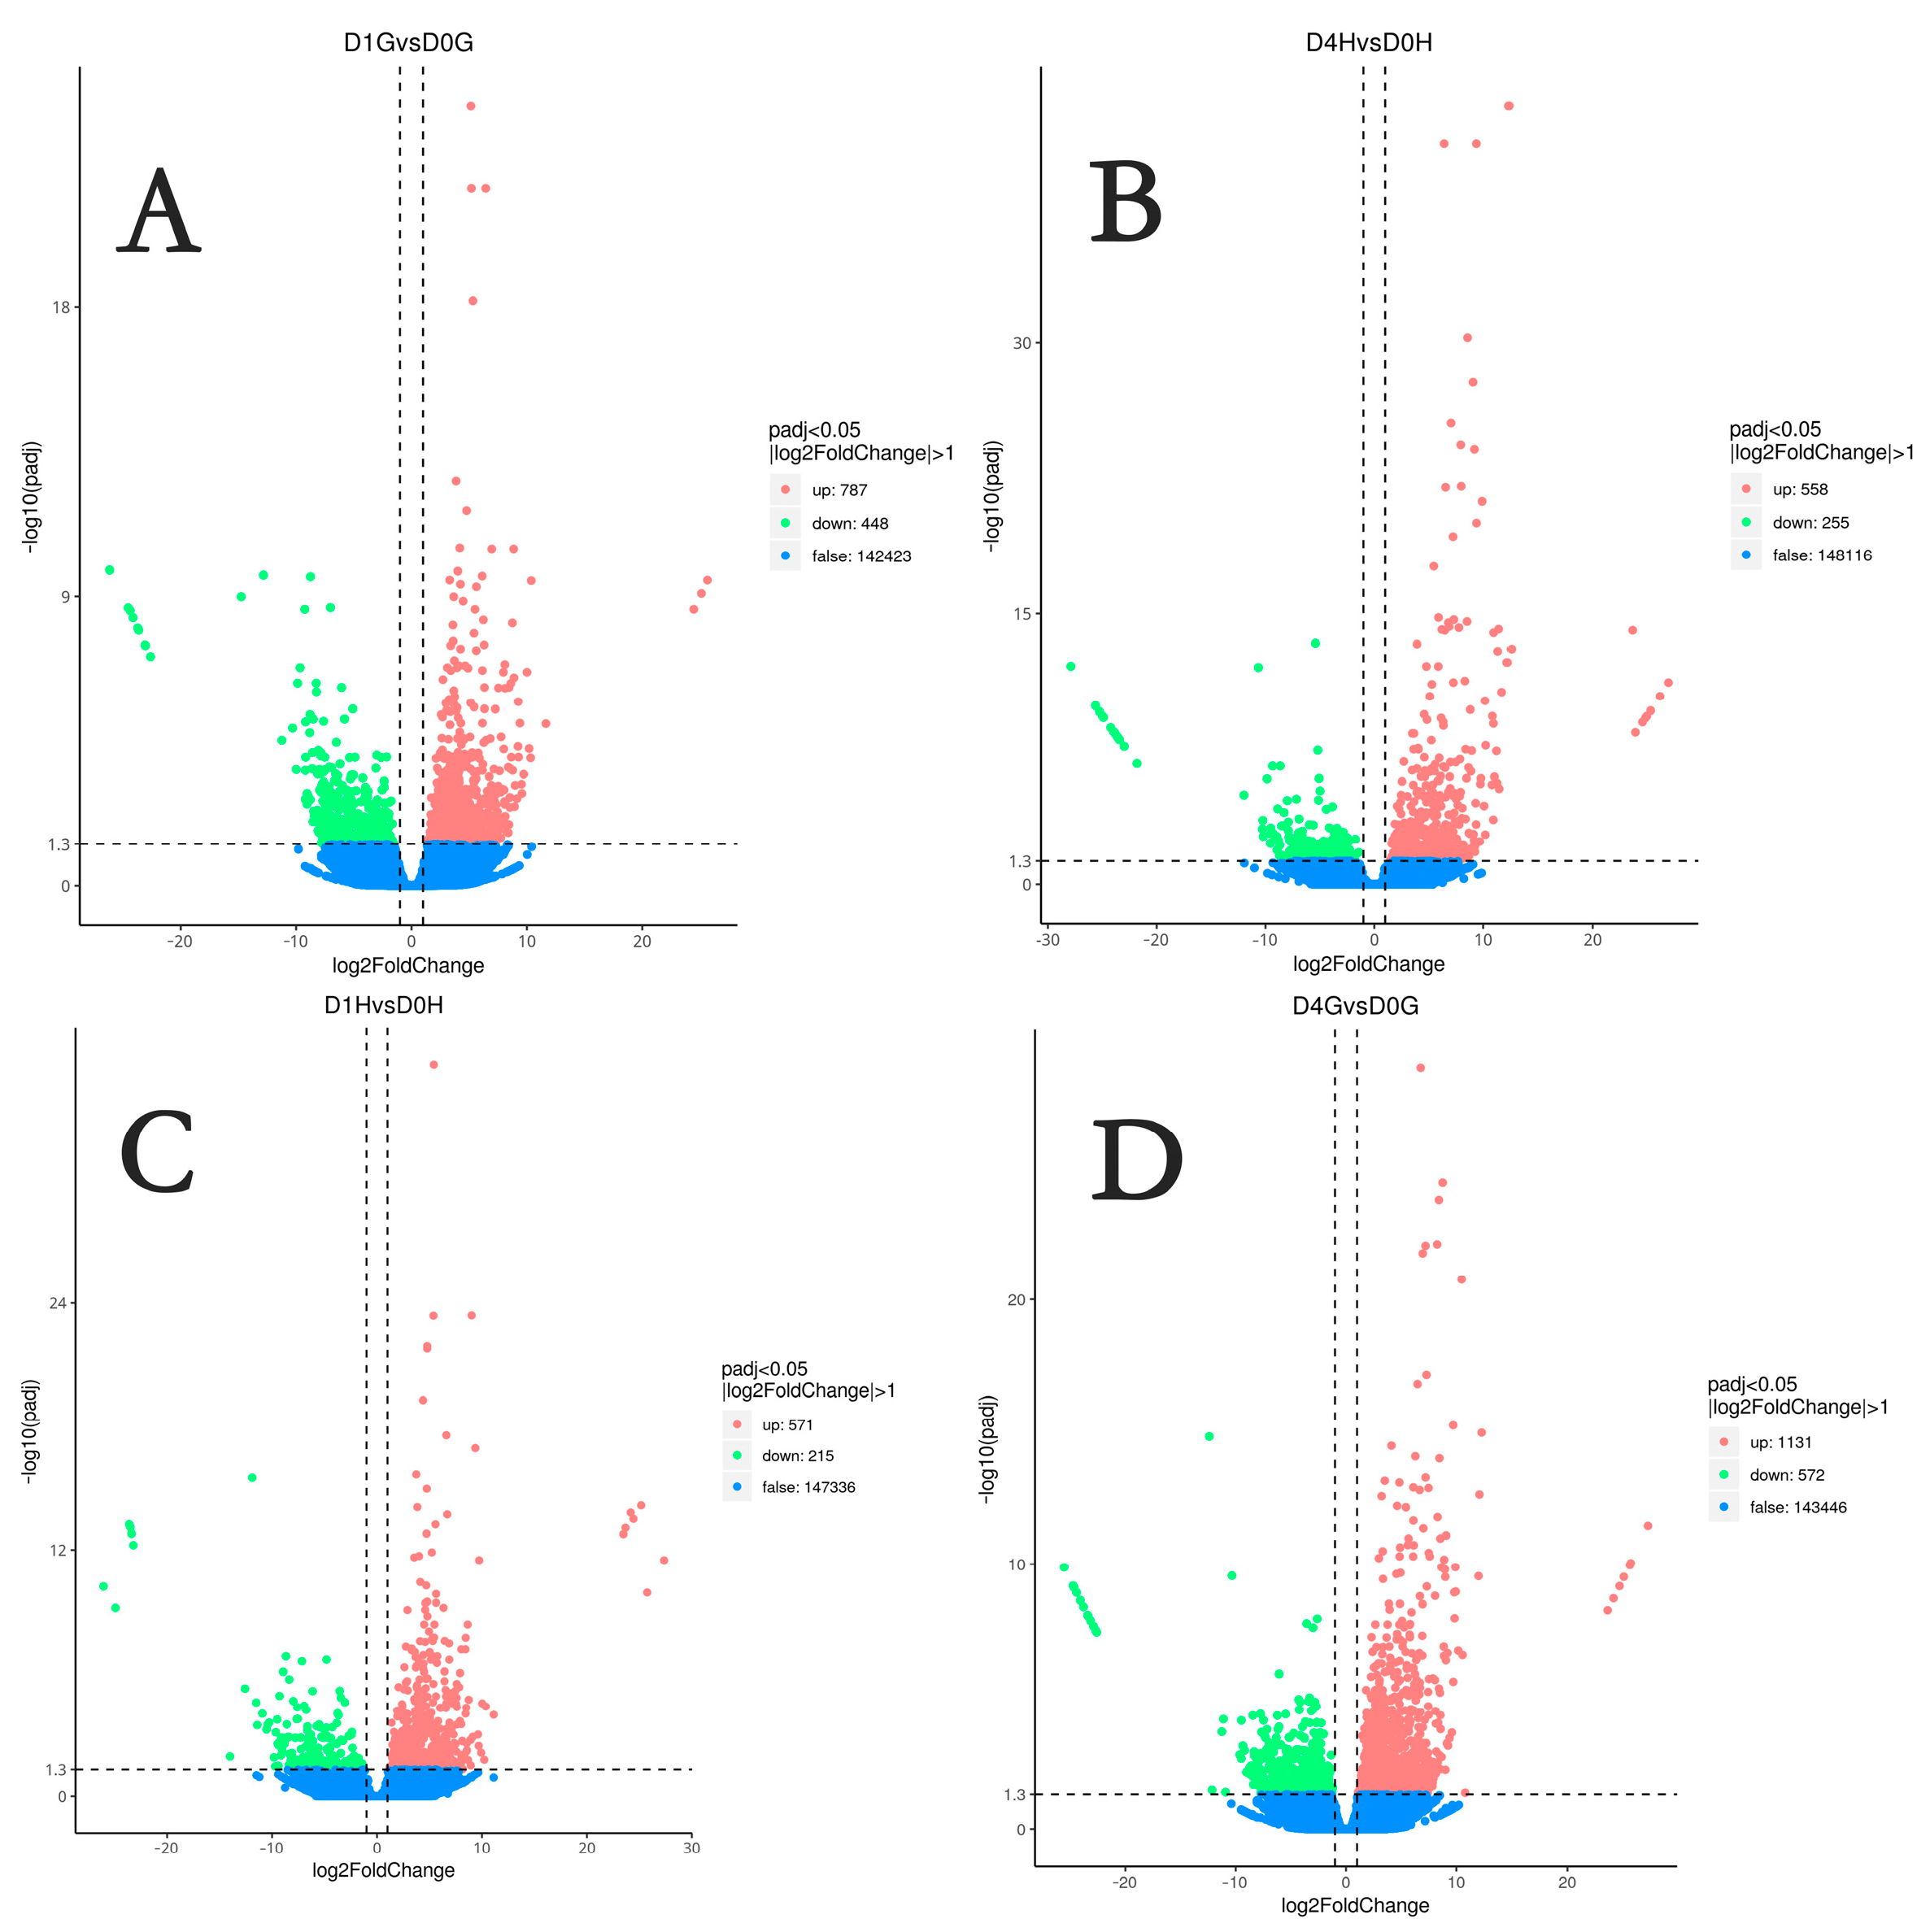
3.3. Analysis of DEGs

Using the criteria of a padj < 0.05 and fold change of expression level > 2, we identified 786 DEGs in the hepatopancreas after 24 h of ammonia exposure, comprising 571 upregulated genes and 215 downregulated genes. In parallel, 1235 DEGs were detected in the gill, with 787 upregulated genes and 448 downregulated genes. After 96 h, there were 813 DEGs in the hepatopancreas, including 558 upregulated genes and 255 downregulated genes. Similarly, the gill exhibited 1703 DEGs, consisting of 1131 upregulated genes and 572 downregulated genes. Visualization of the DEGs in the two compared tissues is demonstrated in the volcano plot (Figure 5) and Venn diagram (Figure 6).

3.4. Functional Annotation of Unigenes

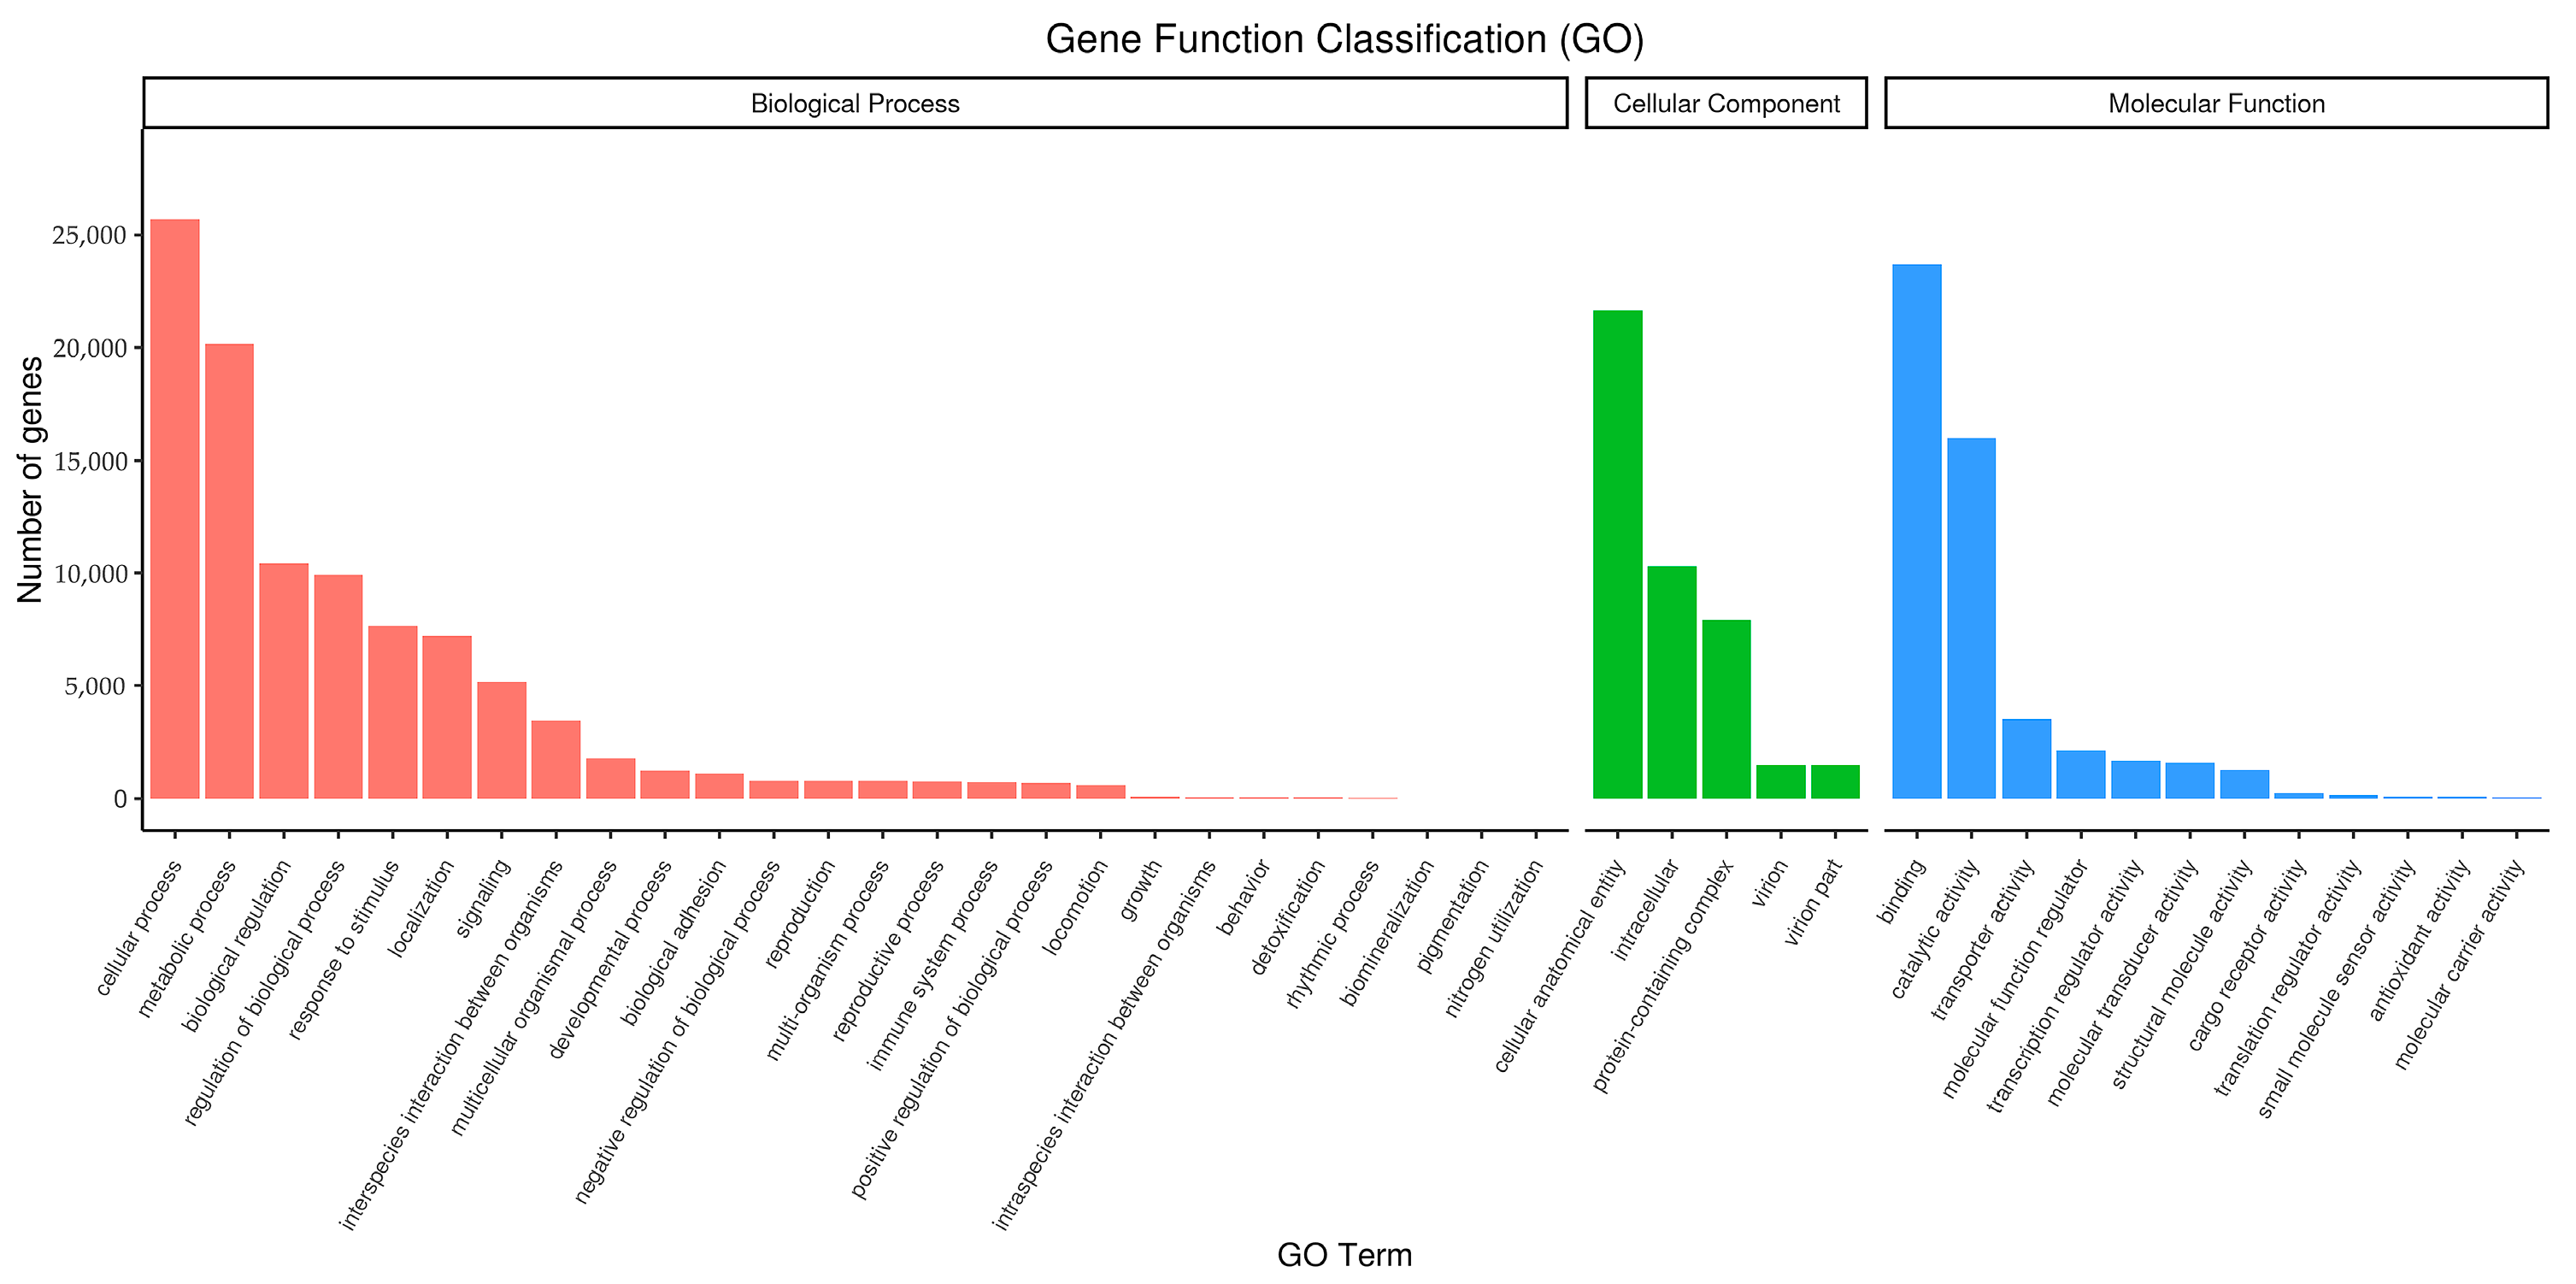
3.4.1. GO Functional Annotation

Based on GO terms, a total of 46,612 unigenes were categorized into three primary functional classifications: Biological Process (BP), Cellular Component (CC), and Molecular Function (MF) as depicted in Figure 7. The CC category was predominantly enriched with cellular anatomical entity, intracellular, and protein-containing complex (50.6%, 24.1%, and 18.4% of genes, respectively). Notably, the BP category demonstrated enrichment in cellular process (25.9%), metabolic process (20.3%), and biological regulation (10.5%). Within the MF category, the major subcategories were binding (46.9%) and catalytic activity (37.1%).

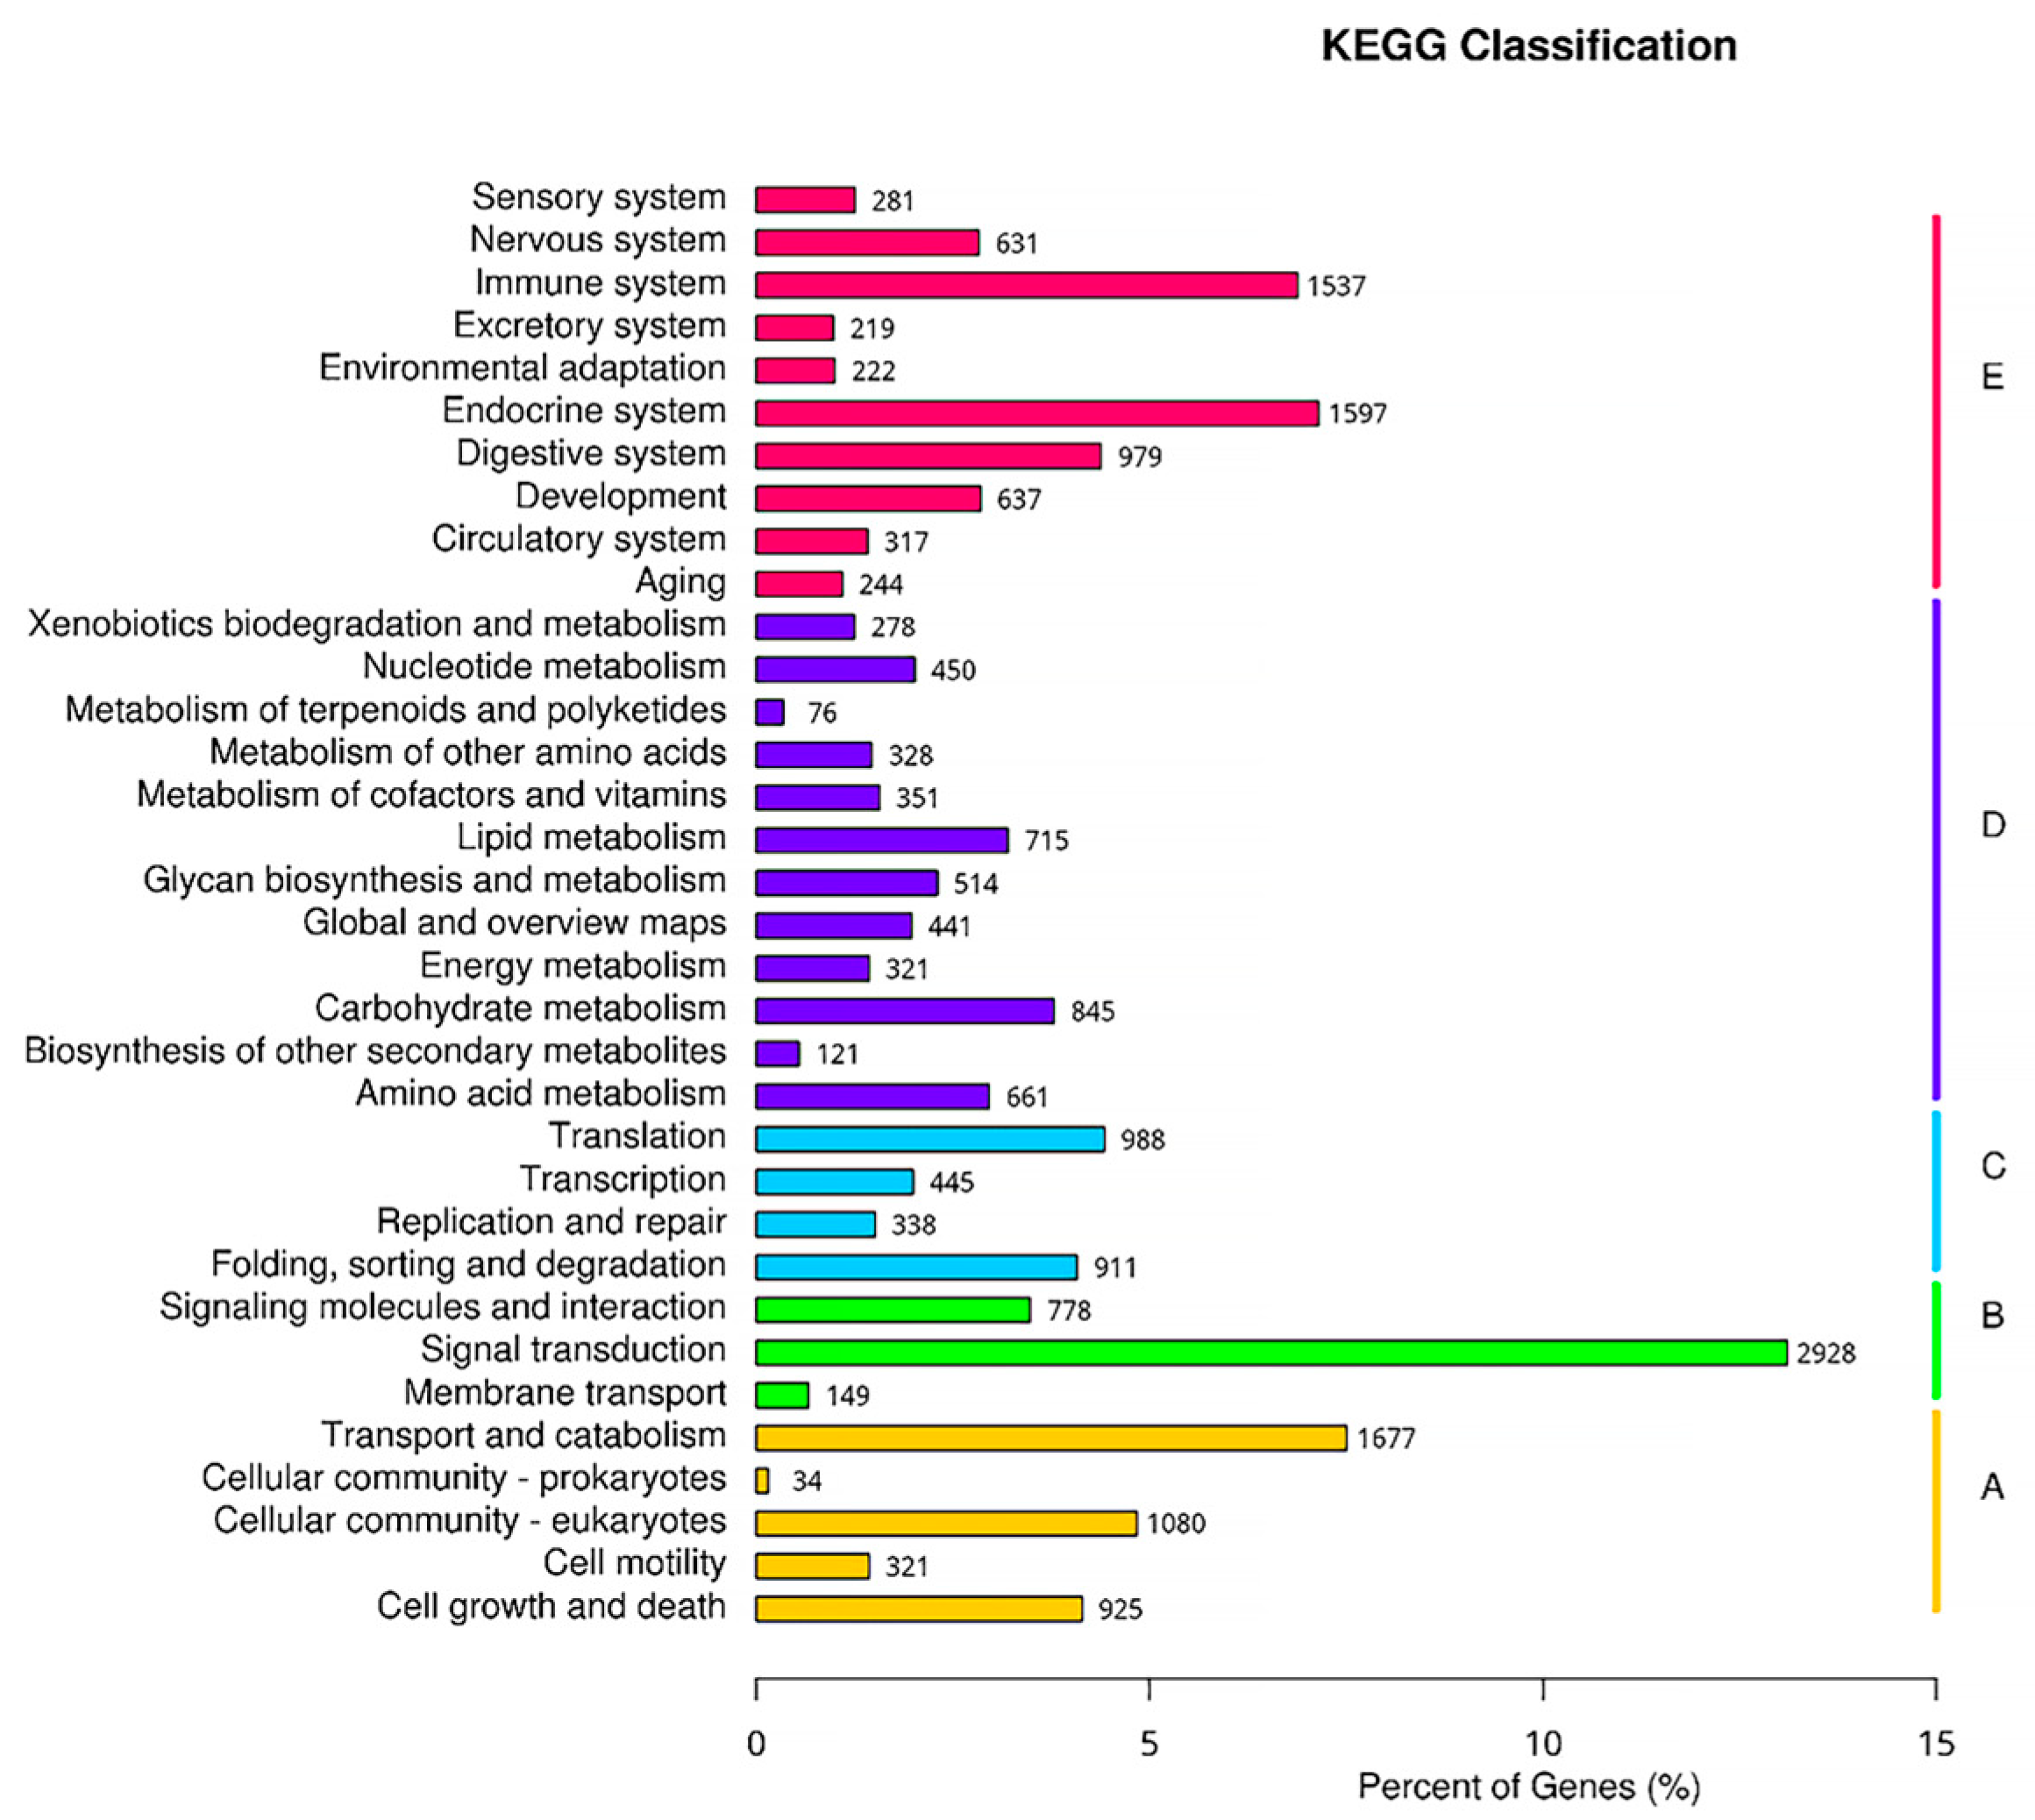
3.4.2. KEGG Functional Annotation

To investigate the biological functions of differentially expressed genes under ammonia stress, we conducted an analysis of the KEGG metabolic pathways associated with all DEGs (Figure 8). The findings revealed that the KEGG analysis categorized 21,023 unigenes into five main groups of metabolic pathways: cellular processes, environmental information processing, genetic information processing, metabolic processes, and organic systems. Notably, the pathway of signal transduction contained the largest number of unigenes (2928) within the environmental information processing category. This was followed by transport and catabolism (1677) in the cellular processes group, endocrine system (1597), and immune system (1537) within the organic systems classification.

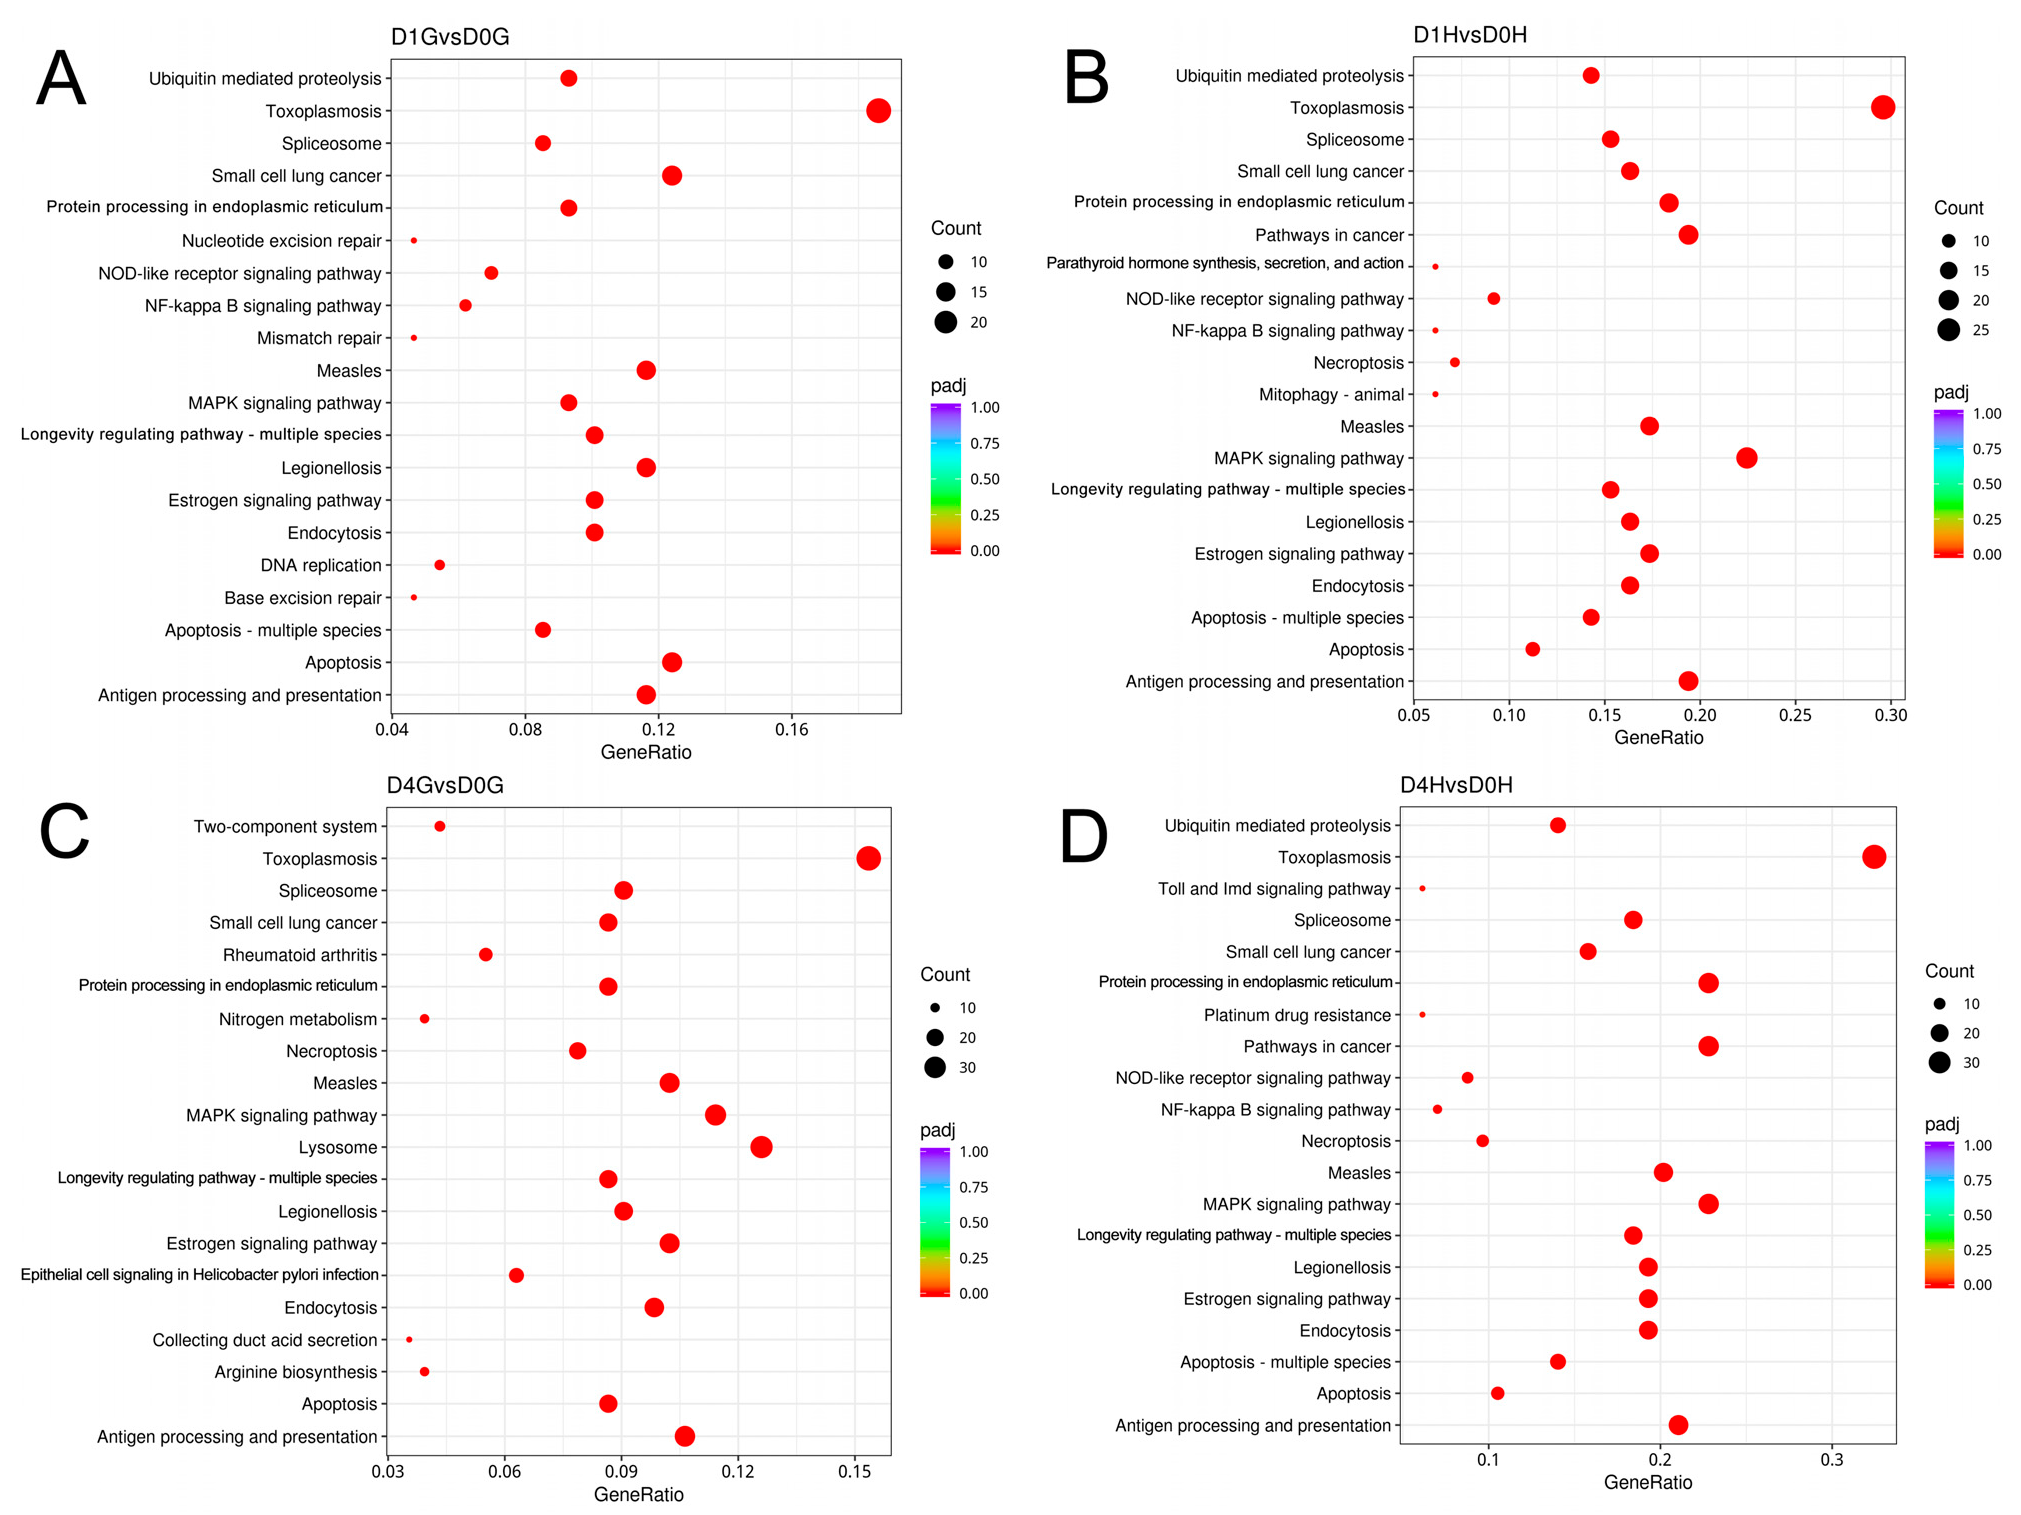
3.5. Functional Enrichment Analysis of GO and KEGG Pathways

Functional enrichment analysis was performed on DEGs to explore the biological functions significantly linked with them. The most significant GO term was chosen for presentation (Table 3). As demonstrated in the table, during ammonia stress, the DEGs in the gill and hepatopancreas of P. ustulata were primarily enriched in biological processes and molecular functions. At 24 h, the DEGs in the gill showed significant enrichment in cell death, transmembrane transport, transmembrane transporter activity, and cellular amino acid metabolism, while those in the hepatopancreas were notably enriched in DNA-binding transcription factor activity, nucleoplasm, anatomical structure development, transport, cell wall tissue or biogenesis, protein folding, and nuclear-related biological functions. Following 96 h of stress, the DEGs in the gill exhibited enrichment in transmembrane transport, carbohydrate metabolism, and ligase activity, whereas those in the hepatopancreas were significantly enriched in hydrolase activity, carbohydrate metabolic process, DNA-binding transcription factor activity, DNA binding, cell wall organization or biogenesis, and cell division.
KEGG pathway enrichment analysis was conducted on DEGs. The results revealed that DEGs in the gill and hepatopancreas were chiefly enriched in environmental and genetic information processing, cellular processes, and organic systems following 24 h exposure to ammonia stress. Specifically, cellular processes encompassed apoptosis (ko04210) and endocytosis (ko04144); environmental information processing included the MAPK signaling pathway (ko04010), NF-kB signaling pathway (ko04064), and TNF signaling pathway (ko04668); genetic information processing primarily involved DNA replication (ko03030), protein processing in the endoplasmic reticulum (ko04141), and organic systems such as antigen processing and presentation (ko04612), longevity regulation pathway in multiple species (ko04213), and NOD-like receptor signaling pathway (ko04621). Most of these pathways are linked to immune function and apoptosis signaling. After 96 h, besides the previously mentioned pathways, DEGs demonstrated significant enrichment in the FoxO signaling pathway (ko04068), glucagon signaling pathway (ko04922), insulin signaling pathway (ko04910), and AMPK signaling pathway (Figure 9). Additionally, the following pathways were notably upregulated, as illustrated in Table 4.
After 96 h of ammonia stress, there was a significant upregulation of metabolic pathways in the gill and hepatopancreas of blue clams. These pathways include nitrogen metabolism (ko00910), arginine biosynthesis (ko00220), alanine, aspartate, and glutamate metabolism (ko00250), sphingolipid metabolism (ko00600), oxidative phosphorylation (ko00190), acetaldehyde and dicarboxylic acid metabolism (ko00630), and amino acid biosynthesis (ko01230). The ammonia exposure led to notable changes in the expression of genes associated with nitrogen compound metabolism and excretion, energy metabolism, and amino acid metabolism (Table 4).

4. Discussion

The accumulation of excessive ammonia poses a significant threat to aquatic species, resulting in severe health complications, reduced reproduction rates, and increased mortality. This study specifically examined P. ustulata to understand its response to ammonia stress in the gills and hepatopancreas. In this study, the LC50 of 96 h in the P. ustulata was 222 mg/L, much higher than that of other bivalves, such as Meretrix meretrix (92.37 mg/L) [15] and C. sinensis (65.79 mg/L) [16]. The results will accumulate data on the toxicity of ammonia nitrogen to seawater mollusks and provide theoretical guidance for the healthy aquaculture of P. ustulata. By conducting a thorough analysis that integrated physiology and transcriptomics, the study comprehensively evaluated the effects of elevated concentrations of ammonia nitrogen stress. The results revealed that ammonia stress leads to a significant increase in oxidative damage and triggers apoptosis. Transcriptomic data further supported the mechanisms of ammonia toxicity, which are elaborated upon extensively in this study.
Studies have consistently demonstrated that the increase of ammonia concentration causes the body to produce a large number of reactive oxygen species (ROS), thus inducing oxidative damage and cell apoptosis, which is an important mechanism of ammonia toxicity in aquatic organisms [17,18,19]. Antioxidant enzymes such as SOD, CAT, and GSH-Px play crucial roles in the oxidative defense system by neutralizing harmful ROS. SOD facilitates the disproportionation of superoxide anion radicals into oxygen and hydrogen peroxide, thus aiding in maintaining the delicate balance between oxidation and antioxidation processes within the organism [20]. CAT safeguards cells from hydrogen peroxide toxicity by catalytically breaking down hydrogen peroxide into oxygen and water molecules [21]. GSH-Px protects cell membranes’ integrity and functionality by converting reduced glutathione (GSH) to oxidized glutathione (GSSG) and reducing toxic peroxides into harmless hydroxyl compounds [22]. In our study, we observed that the activity of antioxidant enzymes including CAT (effect size η2 were 0.934 and 0.888), SOD (effect size η2 were 0.557 and 0.412), and GSH-Px (effect size η2 were 0.821 and 0.679) in the gill and hepatopancreas of P. ustulata were significantly increased after exposure to ammonia stress at 96 h LC50 levels for 48 h, respectively. This suggests that the antioxidant defense system in clams is activated after ammonia stress. Moreover, the MDA (effect size η2 were 0.429 and 0.681 in the gill and hepatopancreas, respectively) content showed a significant increase, indicating severe oxidative stress induced by elevated ammonia levels in the organisms. Subsequently, after 72 h, SOD and GSH-Px activities declined, with SOD activity dropping below levels in the control group by 96 h. This decline could be attributed to the excessive production of ROS due to high ammonia concentrations, disrupting cell membrane integrity and impairing the organism’s detoxification mechanisms. These findings suggest that the existing antioxidant defense system may not be adequate to shield tissues from damage during prolonged exposure to high ammonia levels.
Acute exposure to ammonia nitrogen triggers organisms to promptly undergo oxidative stress. The overproduction of reactive oxygen species by P. ustulata under such conditions can damage small molecules like nucleic acids within the cell, subsequently initiating the apoptotic process [23]. Apoptosis is a sophisticated and tightly regulated cellular mechanism pivotal in biological functions such as development, homeostasis, and immunity [24]. In this investigation, the DEGs in the gill and hepatopancreas of P. ustulata were significantly enriched in the apoptosis pathway at both the 24 h and 96 h stress time points. This enrichment resulted from the inability to eliminate excessive ROS, which led to DNA damage and ultimately caused apoptotic cell death [25]. Studies have shown that ammonia nitrogen exposure significantly disrupts the normal functional structure of mitochondria in gills of Ruditapes philippinarum [26], thereby affecting the microstructure of gill tissue. In addition, a TUNEL experiment of gill tissue of S. constricta also confirmed this point [27]. In this study, ammonia nitrogen induced apoptosis of P. ustulata cells, which may be because toxic ammonia caused oxidative stress and destroyed the microstructure of P. ustulata tissue. Simultaneously, a substantial number of DEGs were notably enriched in the TNF signaling pathway, MAPK signaling pathway, NF-κB signaling pathway, and NOD-like signaling pathway. Research has shown that TNF-α can activate the NF-κB and MAPK signaling pathways, which are primarily linked to inflammatory responses. Upregulation of these pathways can significantly contribute to the generation of pro-inflammatory factors [28,29,30]. The NOD-like receptor is a pattern recognition receptor crucial in the inflammatory response, and its mediated immune response plays a critical role in the organism’s tolerance and resistance when exposed to environmental stress [31]. The aforementioned results indicate that high concentrations of ammonia stress can significantly induce inflammation in P. ustulata. Similarly, TLR, NF-κB, FOXO, and apoptosis signal are the main pathways involved in the regulation of ammonia stress in Corbicula fluminea [32], R. philippinarum [33], and so on. Based on this, we speculated that with the extension of ammonia nitrogen stress time, ROS produced in clams accumulated in large quantities, and the body itself was not able to resist the oxidative stress caused by ROS production, thus causing cell apoptosis and activating inflammation.
After the 96 h mark of exposure to ammonia stress, analysis of the KEGG enrichment results revealed significant upregulation of the FoxO signaling pathway, AMPK signaling pathway, and insulin signaling pathway, in addition to other signaling pathways previously identified. The FoxO signaling pathway is crucial in regulating cellular and organismal responses to environmental cues, playing a key role in cell division, apoptosis, homeostasis maintenance, and stress response regulation in the biological system [34]. This pathway may be upregulated through activation by MAPK [35]. During this period, multiple signaling pathways in P. ustulata orchestrate apoptosis in response to oxidative stress induced by high ammonia levels, resulting in increased energy demand. The AMPK signaling pathway serves as a sensor of the energy status in eukaryotic cells, becoming activated during energy insufficiency and playing a critical role in energy homeostasis regulation [36]. Hence, the significant elevation of the AMPK pathway is speculated to be a vital mechanism for blue clam in maintaining energy equilibrium, which aligns with findings on the AMPK pathway in Macrobrachium rosenbergii under ammonia nitrogen stress [37]. Furthermore, the upregulation of the AMPK pathway can activate the insulin signaling pathway, suppress autophagy, and enhance apoptosis [38]. In summary, the heightened ammonia concentration triggers a notable upregulation of the TNF signaling pathway, MAPK signaling pathway, NF-κB signaling pathway, and NOD-like signaling pathway in P. ustulata, leading to an inflammatory response. Moreover, DEGs are significantly enriched in apoptosis, the FoxO signaling pathway, AMPK signaling pathway, and insulin signaling pathway to regulate energy balance and facilitate apoptosis for maintaining internal stability.
Ammonia stress leads to elevated ammonia levels in organisms, potentially causing severe toxicity. However, organisms possess several detoxification pathways for ammonia. Prior research on aquatic animals has demonstrated that the hepatopancreas of aquic animals have the ability for their capacity to convert ammonia into the less harmful glutamine and to excrete urea through the ornithine cycle [39,40]. Aquatic animals’ high tolerance to ammonia has been linked to their ability to transform ammonia into urea [41]. Studies have observed that exposure to high concentrations of ammonia can elevate the activities of enzymes GS and GDH in C. sinensis and S. constricta [8,10]. Furthermore, the levels of arginine, proline, and ornithine have been detected in Crassostrea hongkongensis following ammonia stress, indicating their roles in the ornithine cycle [42]. This research found a significant increase in GS (effect size η2 was 0.409) and GDH (effect size η2 was 0.663) activities within 6 h of ammonia stress, with GS activity notably higher than that of the control group within 96 h. Concurrently, ARG (effect size η2 was 0.757) activity in P. ustulata significantly increased after 24 h, while urea (effect size η2 was 0.909) levels remained elevated throughout the stress period. Similar results have been found in S. constricta, which may use the synthesis of glutamine and urea in the presence of high ammonia nitrogen to reduce the toxicity of ammonia nitrogen in the body [8,43]. Interestingly, hepatopancreas detoxification of ammonia nitrogen through the combined action of glutamine synthesis and urea synthesis has been reported in a variety of aquatic animals (e.g., Pelteobagrus fulvidraco [44], C. sinensis [32], Lates calcarifer [45], etc.). Based on this, we hypothesize that the conversion of glutamate from ammonia and α-ketoglutarate via GDH, the subsequent production of glutamine catalyzed by GS, and the transformation of ammonia into urea through the ornithine cycle are significant ammonia metabolic pathways in the hepatopancreas of the P. ustulata. In other shellfish with low tolerance to ammonia nitrogen, such as Hyriopsis cumingii (96 h LC50 is 12.86 mg/L) [46] and R. philippinarum (96 h LC50 have not been reported, but exposure to 0.1 mg/L ammonia concentration 1 d shows a very significant toxic effect) [47], there is no report of a urea synthesis pathway in the detoxification metabolic pathway after ammonia nitrogen stress. However, in the hepatopancreas of C. sinensis (96 h LC50 is 65.79 mg/L) [16] and S. constricta (96 h LC50 is 244.55 mg/L) [8] with strong tolerance to ammonia nitrogen, both glutamine synthesis and urea synthesis pathways jointly resist oxidative damage caused by acute ammonia nitrogen stress, suggesting that the synergistic effect of glutamine synthesis and urea synthesis may also be the main reason for the strong tolerance of ammonia nitrogen in P. ustulata.
In aquatic animals, inhibition of protein hydrolysis and amino acid metabolism is an effective strategy to reduce the concentration of ammonia nitrogen in the body. A study in Portunus trituberculatus found that ammonia concentration was reduced by urea cycle and reduced amino acid catabolism after ammonia nitrogen stress [48]. Gene expression analysis of the transcriptome of P. ustulata revealed downregulation of genes associated with amino acid metabolic pathways, such as serine/threonine protein kinase and cysteine protease, under ammonia nitrogen stress. This suggests that P. ustulata can mitigate ammonia production by reducing amino acid catabolism to enhance its ammonia tolerance [49]. Furthermore, elevated mRNA expression levels of Rh glycoprotein and N/K ATPase were observed in the gill following 24 h of ammonia nitrogen stress, indicating the vital role of transporters like Rh glycoprotein and N/K ATPase in ammonia excretion in the gill [50,51]. This finding suggests that ammonia excretion in P. ustulata is coordinated by NH3/NH4+ transporter proteins. However, Rh glycoprotein and N/K ATPase displayed a sharp decrease after 96 h of ammonia exposure, potentially due to the damage inflicted on gill tissues by prolonged ammonia nitrogen exposure [52]. This was substantiated by the significant enrichment of numerous differentially expressed genes in the apoptotic pathway.

5. Conclusions

This study conducted a preliminary analysis of the physiological and molecular response mechanisms to ammonia stress in P. ustulata. Exposure to 222 mg/L ammonia nitrogen stress for 96 h resulted in a noteworthy increase in the activity of antioxidant enzymes in P. ustulata. However, during the later stages of stress, the activity of some antioxidant enzymes decreased, suggesting an inadequate antioxidant defense system to protect tissue cells from prolonged high ammonia nitrogen stress. Following 24 h of ammonia stress, DEGs were notably enriched in pathways associated with apoptosis, NF signaling, MAPK signaling, NF-kB signaling, and NOD-like signaling. These pathways are linked to inflammatory responses and the induction of inflammatory factors, indicating that high levels of ammonia stress can trigger inflammation and apoptosis in P. ustulata. By the 96 h mark, nitrogen metabolism, alanine, aspartate, and glutamate metabolism pathways, among others, were significantly upregulated. The expressions of ammonia transport-related genes such as Rh glycoprotein, ammonium transporter, V-type H+-transporting ATPase, and N/K ATP were notably altered, suggesting that P. ustulata can mitigate ammonia accumulation through the synergistic action of NH3/NH4+ and H transporters alongside reduced amino acid metabolism. Additionally, key enzymes related to ammonia metabolism, including GS, GDH, and ARG, exhibited significant elevation in the hepatopancreas, with the corresponding genes showing similar expression patterns. These findings provide initial evidence that P. ustulata detoxifies endogenous ammonia by synthesizing glutamine and urea, thereby laying the groundwork for further research on the physiological responses and molecular mechanisms of ammonia detoxification in mollusks.

Author Contributions

J.H.: Methodology; project administration; writing—original draft; Visualization; X.W.: investigation, data curation; M.W.: investigation; Z.L.: supervision; L.H.: conceptualization, supervision, project administration, funding acquisition, investigation, X.Z.: investigation; funding acquisition. All authors have read and agreed to the published version of the manuscript.

Funding

The research was funded by National Key Research and Development Program of China (2023YFD2401702 and 2024YFD2401703); China Agriculture Research System of MOF and MARA (CARS-49); Zhejiang Science and Technology Project (2023C02011); the National Natural Science Foundation of China (32102821); the Zhejiang Provincial Natural Science Foundation of China (LTGN24C190006).

Institutional Review Board Statement

The animal study was reviewed and approved by the Institutional Animal Care and Use Committee (IACUC) of Zhejiang Wanli University, China (Approval code: 20221003001). Additionally, we confirm that the study aligns with international animal welfare standards, including Directive 2010/63/EU on the protection of animals used for scientific purposes.

Informed Consent Statement

Not applicable.

Data Availability Statement

We have uploaded the raw transcriptome data to NCBI’s Sequence Read Archive (SRA) under the project accession number PRJNA1015289.

Conflicts of Interest

The authors declare no competing or financial interest.

References

  1. Dauda, A.B.; Ajadi, A.; Tola-Fabunmi, A.S.; Akinwole, A.O. Waste production in aquaculture: Sources, components and managements in different culture systems. Aquacult. Fish. 2019, 4, 81–88. [Google Scholar] [CrossRef]
  2. Kir, M.; Topuz, M.; Sunar, M.C.; Topuz, H. Acute toxicity of ammonia in Meagre (Argyrosomus regius Asso, 1801) at different temperatures. Aquacult. Res. 2015, 47, 3593–3598. [Google Scholar] [CrossRef]
  3. Ip, Y.K.; Chew, S.F.; Randall, D.J. Ammonia toxicity, tolerance, and excretion. Fish Physiol. 2001, 20, 109–148. [Google Scholar] [CrossRef]
  4. Ren, Q.; Pan, L. Digital gene expression analysis in the gills of the swimming crab (Portunus trituberculatus) exposed to elevated ambient ammonia-N. Aquaculture 2014, 434, 108–114. [Google Scholar] [CrossRef]
  5. Banihashemi, E.S.; Khara, H.; Pajand, Z.; Rahnandeh, M. Histopathological study of gill, kidney and liver of Persian Sturgeon (Acipenser persicus Borodin, 1897) and Stellate (Acipenser stellatus Pallas, 1811) exposed to sublethal concentration of un-ionised ammonia UAN. J. Parasit. Dis 2016, 40, 1443–1450. [Google Scholar] [CrossRef]
  6. Ip, Y.K.; Chew, S.F. Ammonia Production, Excretion, Toxicity, and Defense in Fish: A Review. Front. Physiol. 2010, 1, 134. [Google Scholar] [CrossRef]
  7. Wright, P.A.; Wood, C.M. A new paradigm for ammonia excretion in aquatic animals: Role of Rhesus (Rh) glycoproteins. J. Exp. Biol. 2009, 212, 2303–2312. [Google Scholar] [CrossRef]
  8. Lv, L.; Ren, J.; Zhang, H.; Sun, C.; Dong, Y.; Lin, Z. Transcriptomic Analysis of Gill and Hepatopancreas in Razor Clam (Sinonovacula constricta) Exposed to Acute Ammonia. Front. Mar. Sci. 2022, 9, 832494. [Google Scholar] [CrossRef]
  9. Zhao, Q. Response and Detoxification Mechanism of Hyriopsis cumingii Exposed to Ambient Ammonia. Master’s Thesis, Southwest University, Chongqing, China, 2021. [Google Scholar]
  10. Liang, X. Effects of Ammonia Nitrogen Stress on Detoxification Metabolism and Functional Verification of Related Genes in Cyclina sinensis. Master’s Thesis, Jiangsu Ocean University, Lianyungang, China, 2022. [Google Scholar]
  11. He, L.; Xue, S.; Ye, S.; Laws, E.A.; Yuan, H.; Yang, S.; Du, X. Holocene evolution of the Liaohe Delta, a tide-dominated delta formed by multiple rivers in Northeast China. J. Asian Earth Sci. 2018, 152, 52–68. [Google Scholar] [CrossRef]
  12. Ryu, D.-k.; Kim, Y. Age and growth of the Asian clam Potamocorbula ustulata ustulata (Reeve, 1844) on the west coast of Korea. Korean. J. Malacol. 2007, 23, 17–23. [Google Scholar]
  13. Ren, P.; Fang, P.; Bao, Y.; Li, H.; Wang, H.; Gong, K. Variation in microbenthic community characteristics among different types of wetlands in Xuanmen bay. Acta Ecol. Sin. 2016, 36, 5632–5645. [Google Scholar]
  14. Cohen, J. A power primer. Psychol. Bull. 1992, 112, 155–159. [Google Scholar] [CrossRef]
  15. Chen, J.; Huang, H.; Xu, H.; He, H.; Fan, W.; Ding, F. Ammonia effects the survival and the energy budget of clam Meretrix meretrix. Mar. Sci. 2010, 34, 40–46. [Google Scholar]
  16. Ge, H.; Liang, X.; Liu, J.; Cui, Z.; Guo, L.; Li, L.; Sun, Y.; Dong, Z.; Wei, M. Effects of acute ammonia exposure on antioxidant and detoxification metabolism in clam Cyclina sinensis. Ecotoxicol. Environ. Saf. 2021, 211, 111895. [Google Scholar]
  17. Rama, S.; Manjabhat, S.N. Protective effect of shrimp carotenoids against ammonia stress in common carp, Cyprinus carpio. Ecotoxicol. Environ. Saf. 2014, 107, 207–213. [Google Scholar] [CrossRef]
  18. Cheng, C.; Yang, F.; Ling, R.; Liao, S.; Miao, Y.; Ye, C.; Wang, A. Effects of ammonia exposure on apoptosis, oxidative stress and immune response in pufferfish (Takifugu obscurus). Aquat. Toxicol. 2015, 164, 61–71. [Google Scholar] [CrossRef] [PubMed]
  19. Zhang, T.; Yan, Z.; Zheng, X.; Wang, S.; Fan, J.; Liu, Z. Effects of acute ammonia toxicity on oxidative stress, DNA damage and apoptosis in digestive gland and gill of Asian clam (Corbicula fluminea). Fish Shellfish. Immunol. 2020, 99, 514–525. [Google Scholar] [CrossRef]
  20. Dong, L.; He, Y.; Wang, Y.; Dong, Z. Research progress on application of superoxide dismutase (SOD). J. Agric. Sci. Technol. 2013, 15, 53–58. [Google Scholar]
  21. Li, C.; Ni, D.; Song, L.; Zhao, J.; Zhang, H.; Li, L. Molecular cloning and characterization of a catalase gene from Zhikong scallop Chlamys farreri. Fish Shellfish. Immunol. 2008, 24, 26–34. [Google Scholar] [CrossRef]
  22. Yang, K.; Cao, F.; Xue, Y.; Tao, L.; Zhu, Y. Three classes of antioxidant defense systems and the development of Postmenopausal Osteoporosis. Front. Physiol. 2022, 13, 840293. [Google Scholar] [CrossRef]
  23. Chen, Y.K. Physiological, Immunological and Apoptotic Responses of Sinonovacula constricta to Ammonia Stress. Master’s Thesis, Shanghai Ocean University, Shanghai, China, 2022. [Google Scholar]
  24. Elmore, S. Apoptosis: A review of programmed cell death. Toxicol. Pathol. 2007, 35, 495–516. [Google Scholar] [CrossRef] [PubMed]
  25. Zhao, L.; Cui, C.; Liu, Q.; Sun, J.; He, K.; Adam, A.A.; Luo, J.; Li, Z.; Wang, Y.; Yang, S. Combined exposure to hypoxia and ammonia aggravated biological effects on glucose metabolism, oxidative stress, inflammation and apoptosis in largemouth bass (Micropterus salmoides). Aquat. Toxicol. 2020, 224, 105514. [Google Scholar] [CrossRef] [PubMed]
  26. Cong, M.; Wu, H.; Yang, H.; Zhao, J.; Lv, J. Gill damage and neurotoxicity of ammonia nitrogen on the clam Ruditapes philippinarum. Ecotoxicology 2017, 26, 459–469. [Google Scholar] [CrossRef]
  27. Guo, Z.; Chen, K.; Du, X.; Li, Y.; Niu, D. Ammonia-induced oxidative stress triggered apoptosis in the razor clam (Sinonovacula constricta). Environ. Sci. Pollut. Res. 2024, 31, 22380–22394. [Google Scholar] [CrossRef] [PubMed]
  28. He, W.; Wang, Z.; Luo, Z.; Yu, Q.; Jiang, Y.; Zhang, Y.; Zhou, Z.; Smith, A.J.; Cooper, P.R. LPS promote the odontoblastic differentiation of human dental pulp stem cells via MAPK signaling pathway. Cell. Physiol 2015, 230, 554–561. [Google Scholar] [CrossRef]
  29. He, W.; Wang, Z.; Zhou, Z.; Zhang, Y.; Zhu, Q.; Wei, K.; Lin, Y.; Cooper, P.R.; Smith, A.J.; Yu, Q. Lipopolysaccharide Enhances Wnt5a Expression through Toll-like Receptor 4, Myeloid Differentiating Factor 88, Phosphatidylinositol 3-OH Kinase/AKT and Nuclear Factor Kappa B Pathways in Human Dental Pulp Stem Cells. J. Endod. 2014, 40, 69–75. [Google Scholar] [CrossRef]
  30. Yu, p.; Yan, S. Effects of simulated hypoxic microenvironment on invasion, migration and Ras/MAPK /NF-kB pathway of human gastric cancer cells in Vitro. Chin. J. Clin. Res. 2019, 32, 907–910+914. [Google Scholar]
  31. Zou, D. Breeding of a Heat-Resistant Strain of Scapharca subcrenata and Its Response Mechanisms to Thermal Stresses. Master’s Thesis, Yantai Institute of Coastal Zone Research, Chinese Academy of Sciences, Yantai, China, 2022. [Google Scholar]
  32. Zhang, T.; Yan, Z.; Zheng, X.; Fan, J.; Wang, S.; Wei, Y.; Yang, L.; Wang, P.; Guo, S. Transcriptome analysis of response mechanism to ammonia stress in Asian clam (Corbicula fluminea). Aquat. Toxicol. 2019, 214, 105235. [Google Scholar] [CrossRef]
  33. Ma, Q.; Yan, Z.; Zheng, X.; Fan, J.; Wang, S.; Wei, Y.; Yang, L.; Wang, P.; Guo, S. Transcriptome sequencing reveals improved ammonia nitrogen tolerance in Zebra II strain of the Manila clam Ruditapes philippinarum. Comp. Biochem. Physiol. Part D Genom. Proteom. 2022, 44, 101016. [Google Scholar] [CrossRef]
  34. Wang, Z.G. Progress in the function of FOXO on tumor inhibition. Chin. J. Dis. Control. Prev. 2013, 17, 809–812. [Google Scholar]
  35. Kim, J.H.; Choi, J.S.; Lee, B.H. PI3K/Akt and MAPK pathways evoke activation of FoxO transcription factor to undergo neuronal apoptosis in brain of the silkworm Bombyx mori (Lepidoptera: Bombycidae). Cell. Mol. Biol 2012, 58, Ol1780–Ol1785. [Google Scholar]
  36. Jiang, P.; Ren, L.; Zhi, L.; Yu, Z.; Lv, F.; Xu, F.; Peng, W.; Bai, X.; Cheng, K.; Quan, L.; et al. Negative regulation of AMPK signaling by high glucose via E3 ubiquitin ligase MG53. Mol. Cell 2021, 81, 629–637.e625. [Google Scholar] [CrossRef]
  37. Garcia, D.; Shaw, R.J. AMPK: Mechanisms of Cellular Energy Sensing and Restoration of Metabolic Balance. Mol. Cell 2017, 66, 789–800. [Google Scholar] [CrossRef]
  38. Nwadike, C.; Williamson, L.E.; Gallagher, L.E.; Guan, J.; Chan, E.Y.W. AMPK Inhibits ULK1-Dependent Autophagosome Formation and Lysosomal Acidification via Distinct Mechanisms. Mol. Cell. Biol. 2018, 38, MCB. 00023-18. [Google Scholar] [CrossRef]
  39. Song, M.; Li, M.; Li, J.; Yuan, L.; Wang, R.; Shi, G. Effects of acute ammonia exposure on gene involved in inflammation of mudskipper. J. Fish. China 2018, 42, 1704–1710. [Google Scholar]
  40. Weihrauch, D.; Joseph, G.; Allen, G.J.P. Ammonia excretion in aquatic invertebrates: New insights and questions. Exp. Biol. 2018, 221, jeb169219. [Google Scholar] [CrossRef] [PubMed]
  41. Wang, Y.; Walsh, P.J. High ammonia tolerance in fishes of the family Batrachoididae (Toadfish and Midshipmen). Aquat. Toxicol. 2000, 50, 205–219. [Google Scholar] [CrossRef]
  42. Lu, J.; Yao, T.; Shi, S.; Ye, L. Effects of acute ammonia nitrogen exposure on metabolic and immunological responses in the Hong Kong oyster Crassostrea hongkongensis. Ecotoxicol. Environ. Saf. 2022, 237, 113518. [Google Scholar] [CrossRef] [PubMed]
  43. Sun, G.; Lv, L.; Yao, H.; Lin, Z.; Xu, N.; Dong, Y. Integrated application of multi-omics and biochemical analysis revealed the physiological response mechanism of ammonia nitrogen tolerance in the razor clam (Sinonovacula constricta). Front. Mar. Sci. 2024, 11, 1444929. [Google Scholar] [CrossRef]
  44. Zhang, M.; Li, M.; Wang, R.; Qian, Y. Effects of acute ammonia toxicity on oxidative stress, immune response and apoptosis of juvenile yellow catfish Pelteobagrus fulvidraco and the mitigation of exogenous taurine. Fish Shellfish. Immun. 2018, 79, 313–320. [Google Scholar] [CrossRef]
  45. Jahanbani, A.; Shahriari, A.; Mohammadian, T. Ureagenesis of Asian seabass (Lates calcarifer) under ammonia stress and overcrowding. Aquaculture 2023, 576, 739810. [Google Scholar] [CrossRef]
  46. Zhao, Q.; Feng, K.; Zhang, L.; Bai, Y.; Yao, W. Effects of acute ammonia stress on antioxidant responses, histopathology and ammonia detoxification metabolism in triangle sail mussels (Hyriopsis cumingii). Water 2021, 13, 425. [Google Scholar] [CrossRef]
  47. Cong, M.; Wu, H.; Cao, T.; Lv, J.; Wang, Q.; Ji, C.; Li, C.; Zhao, J. Digital gene expression analysis in the gills of Ruditapes philippinarum exposed to short- and long-term exposures of ammonia nitrogen. Aquat. Toxicol. 2018, 194, 121–131. [Google Scholar] [CrossRef] [PubMed]
  48. Meng, X.; Jayasundara, N.; Zhang, J.; Ren, X.; Gao, B.; Li, J.; Liu, P. Integrated physiological, transcriptome and metabolome analyses of the hepatopancreas of the female swimming crab Portunus trituberculatus under ammonia exposure. Ecotox. Environ. Saf. 2021, 228, 113026. [Google Scholar] [CrossRef]
  49. Gao, N.; Zhu, L.; Guo, Z.; Yi, M.; Zhang, L. Effects of chronic ammonia exposure on ammonia metabolism and excretion in marine medaka Oryzias melastigma. Fish Shellfish. Immunol. 2017, 65, 226–234. [Google Scholar] [CrossRef] [PubMed]
  50. Clifford, A.M.; Goss, G.G.; Wilkie, M.P. Adaptations of a deep sea scavenger: High ammonia tolerance and active NH4+ excretion by the Pacific hagfish (Eptatretus stoutii). Comp. Biochem. Physiol. A Mol. Integr. Physiol. 2015, 182, 64–74. [Google Scholar] [CrossRef]
  51. Sinha, A.K.; Zinta, G.; AbdElgawad, H.; Asard, H.; Blust, R.; de Boeck, G. High environmental ammonia elicits differential oxidative stress and antioxidant responses in five different organs of a model estuarine teleost (Dicentrarchus labrax). Comp. Biochem. Physiol. C Toxicol. Pharmacol. 2015, 174–175, 21–31. [Google Scholar] [CrossRef]
  52. Schram, E.; Roques, J.A.C.; Abbink, W.; Spanings, T.; de Vries, P.; Bierman, S.; van de Vis, H.; Flik, G. The impact of elevated water ammonia concentration on physiology, growth and feed intake of African catfish (Clarias gariepinus). Aquaculture 2010, 306, 108–115. [Google Scholar] [CrossRef]
Figure 1. The effect of ammonia stress on the enzymes and products of the antioxidant defense system in the gills of P. ustulata. (A) CAT activity; (B) SOD activity; (C) GSH-Px activity; (D) MDA content. Data with different letters showed significant difference among tissues using one-way ANOVA (p < 0.05).
Fishes 10 00200 g001
Figure 2. The effect of ammonia stress on the enzymes and products of the antioxidant defense system in the hepatopancreas of P. ustulata. (A) CAT activity; (B) SOD activity; (C) GSH-Px activity; (D) MDA content. Data with different letters showed significant difference among tissues using one-way ANOVA (p < 0.05).
Fishes 10 00200 g002
Figure 3. The effect of ammonia stress on ammonia detoxification enzymes in P. ustulata. (A) GS activity; (B) GDH activity; (C) ARG activity; (D) Urea content. Data with different letters showed significant difference among tissues using one-way ANOVA (p < 0.05).
Fishes 10 00200 g003
Figure 4. Pearson correlation between sample.
Fishes 10 00200 g004
Figure 5. Volcano map of DEGs. (A) Metabolic pathway annotation and enrichment of DEGs in D1H vs. D0H group; (B) Metabolic pathway annotation and enrichment of DEGs in D4H vs. D0H group; (C) Metabolic pathway annotation and enrichment of DEGs in D1G vs. D0G group; (D) Metabolic pathway annotation and enrichment of DEGs in D4G vs. D0G group.Red represents upregulated genes, green represents downregulated genes, and blue represents genes with no significant differential expression.
Fishes 10 00200 g005
Figure 6. Venn diagram of DEGs. (A) Venn diagram of differentially expressed genes (DEGs) in gill tissues at 0 h, 24 h, and 96 h. (B) Venn diagram of differentially expressed genes (DEGs) in hepatopancreas tissue at 0 h, 24 h, and 96 h. The numbers in Venn diagram circles show total DEGs per comparison group; overlaps represent shared DEGs between groups.
Fishes 10 00200 g006
Figure 7. Annotation statistics of go secondary nodes of differentially expressed genes.
Fishes 10 00200 g007
Figure 8. KEGG annotation map. A: Organismal Systems; B: Environmental Information Processing; C: Genetic Information Processing; D: Metabolism; E: Cellular Processes.
Fishes 10 00200 g008
Figure 9. Bubble diagram of KEGG enrichment analysis. (A) KEGG-enriched pathways in D1H vs. D0H group; (B) KEGG-enriched pathways in D4H vs. D0H group; (C) KEGG-enriched pathways in D1G vs. D0G group; (D) KEGG-enriched pathways in D4G vs. D0G group. In the figure, larger dots indicate a higher degree of enrichment, while redder dots represent a greater number of genes enriched in the corresponding pathway.
Fishes 10 00200 g009
Table 1. Effect size of enzyme activities.
EnzymeGillHepatopancreas
CAT0.9340.888
SOD0.5570.412
GSH-Px0.8210.679
MDA0.4290.681
GS/0.409
GDH/0.663
ARG/0.757
Urea/0.909
Table 2. Sequencing data evaluation statistics of samples.
SampleSequenceBasesQ30 (%)Q20 (%)Error Rate (%)GC (%)
D0H122,842,2966.992.7497.300.0346.29
D0H223,273,5997.092.3297.120.0342.37
D0H327,418,9458.292.5597.210.0345.26
D0H423,860,2267.292.4897.180.0345.64
D1H123,994,3087.291.5396.790.0346.80
D1H222,670,1946.891.8396.860.0346.40
D1H323,711,3687.192.5797.200.0345.68
D1H423,714,8777.192.3397.100.0345.83
D4H122,935,6476.992.5297.200.0346.42
D4H223,685,3537.192.5297.160.0346.04
D4H325,613,0527.792.7397.280.0345.89
D4H423,934,0567.292.6697.280.0345.23
D0G123,564,9187.192.2397.140.0339.38
D0G223,949,2767.292.5497.240.0342.89
D0G322,637,2166.892.5597.220.0343.49
D0G423,608,1517.192.4497.210.0340.29
D1G123,043,6526.992.0297.040.0336.88
D1G222,836,5596.992.6297.280.0339.80
D1G327,259,3038.292.8297.360.0340.51
D1G425,161,3007.592.7497.320.0340.52
D4G123,078,3516.992.1297.060.0341.31
D4G223,594,5717.192.5597.230.0342.58
D4G323,397,6387.091.5096.760.0342.71
D4G423,971,9517.292.4597.220.0343.32
Table 3. GO enrichment analysis of DEGs.
GroupCategoryGO IDDescriptionGeneRatio
D1G vs. D0GBPGO:0008219Cell death12
BPGO:0055085Transmembrane transport43
MFGO:0022857Transmembrane transporter activity53
BPGO:0006520Cellular amino acid metabolic process28
D4G vs. D0GBPGO:0055085Transmembrane transport67
BPGO:0005975Carbohydrate metabolic process36
MFGO:0016874Ligase activity16
D1H vs. D0HMFGO:0003700DNA-binding transcription factor activity20
CCGO:0005654Nucleoplasm12
BPGO:0048856Anatomical structure development13
BPGO:0032196Transposition6
BPGO:0071554Cell wall organization or biogenesis5
BPGO:0006457Protein folding5
CCGO:0005634Nucleus35
D4H vs. D0HMFGO:0016810Hydrolase activity, acting on carbon-nitrogen (but not peptide) bonds5
BPGO:0005975Carbohydrate metabolic process18
D4H vs. D0HMFGO:0003700DNA-binding transcription factor activity16
MFGO:0003677DNA binding46
BPGO:0071554Cell wall organization or biogenesis5
BPGO:0051301Cell division7
Table 4. List of DEGs of the gill and hepatopancreas involved in responding to 96 h ammonia stress in P. ustulata.
Gene IDGill
Log2FoldChange
Hepatopancreas
Log2FoldChange
Gene Description
Cluster-22753.638572.82331.345V-type proton ATPase subunit B
Cluster-22753.758731.8950.23366V-type H+-transporting ATPase subunit a
Cluster-22753.36771−0.63368−0.82744Na/K-ATPase alpha-subunit
Cluster-22753.622023.39141.9668Glutathione S-transferase
Cluster-22753.5964612.09410.949NADH dehydrogenase subunit 2
Cluster-22753.151182.77161.7348Glutamine synthetase
Cluster-22753.772750.941460.57256Glutamate dehydrogenase
Cluster-22753.989622.4491−0.48522Argininosuccinate synthase
Cluster-16686.0 0.7397Ammonium transporter 3
Cluster-22753.1173200.197050.24848Ammonium transporter 1
Cluster-22753.1297631.8164−0.46276Ammonium transporter Rh type
Cluster-22753.133859−2.89192.1372Carbonic anhydrase
Cluster-22753.2946−0.47581−2.9762Carbonic anhydrase 6
Cluster-22753.709380.399580.39334Catalase
Cluster-21163.0−0.54152−0.41775Cu/Zn superoxide dismutase
Cluster-22753.117170.678840.14033Glutathione peroxidase
Log2FoldChange > 0 indicates that the gene is up-regulated, Log2FoldChange < 0 indicates down-regulation.
Disclaimer/Publisher’s Note: The statements, opinions and data contained in all publications are solely those of the individual author(s) and contributor(s) and not of MDPI and/or the editor(s). MDPI and/or the editor(s) disclaim responsibility for any injury to people or property resulting from any ideas, methods, instructions or products referred to in the content.

