Article

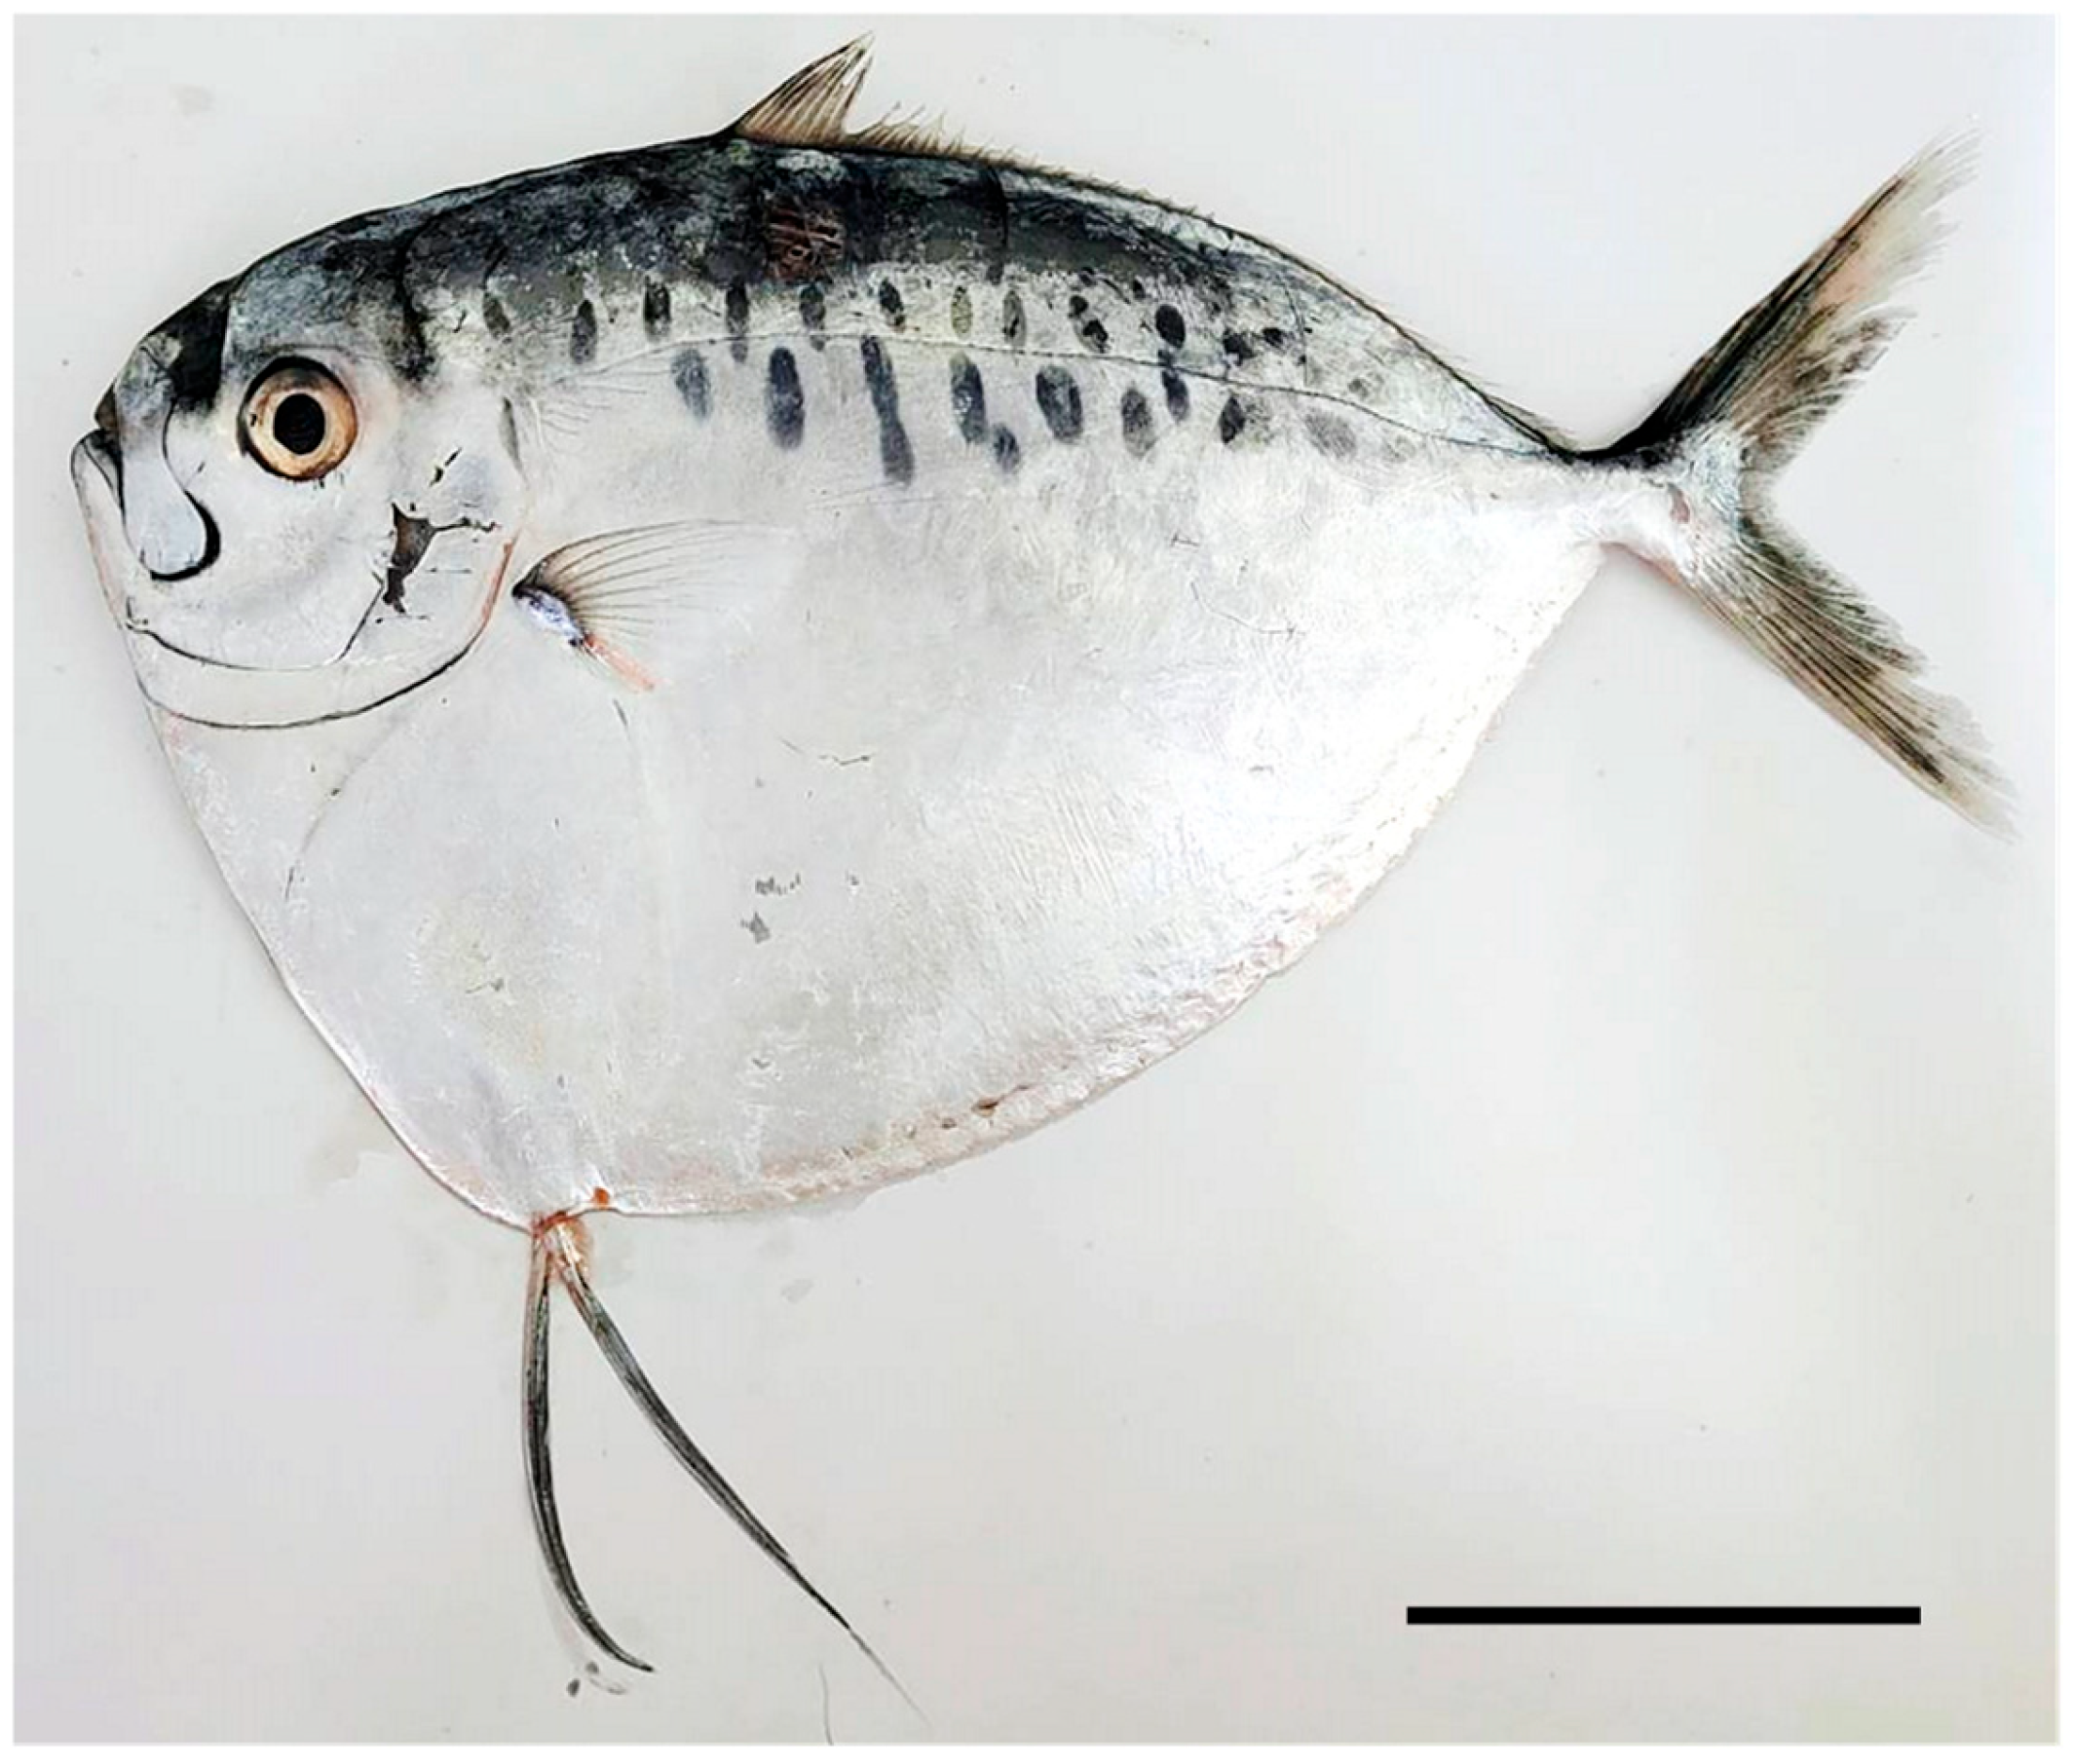
Feeding Habits of Mene maculata (Teleostei: Menidae) in the Southwestern Waters of Taiwan, Western Pacific Ocean

1
Department of Environmental Biology and Fisheries Science, National Taiwan Ocean University, No. 2, Beining Rd., Zhongzheng Dist., Keelung City 202301, Taiwan
2
Doctoral Degree Program in Ocean Resource and Environmental Changes, National Taiwan Ocean University, No. 2, Beining Rd., Zhongzheng Dist., Keelung City 202301, Taiwan
3
Coastal and Offshore Resources Research Center, Fisheries Research Institute, No. 6, Yugang N. 3rd Rd., Qianzhen Dist., Kaohsiung City 806, Taiwan
*
Author to whom correspondence should be addressed.
Fishes 2025, 10(4), 182; https://doi.org/10.3390/fishes10040182
Submission received: 25 March 2025 / Revised: 14 April 2025 / Accepted: 15 April 2025 / Published: 16 April 2025

Abstract

:
This study investigated the feeding habits of moonfish (Mene maculata) in the waters of southwestern Taiwan in the Western Pacific Ocean using commercial trawling nets and Taiwanese purse seines. For this, we analyzed the body size and stomach content of moonfish specimens collected from the study area between January and December 2023. The length–weight relationship revealed hypoallometric growth patterns in both male and female specimens, with allometric coefficients of 2.6574 and 2.7219, respectively. Stomach content analysis indicated that the specimens primarily fed on Calanoida (zooplankton; %PSIRI = 36.79) and Benthosema pterotum (fish; %PSIRI = 19.23). Dietary composition varied with body size and sampling time. Larger individuals consumed higher proportions of fish. The percentage of empty stomachs was high, likely attributable to the fishing gear used and sampling time. Based on the results of this study, it is speculated that moonfish feed mainly before early morning or at other times during the day.
Key Contribution: The diet of moonfish shows the difference between body size and sampling time. The high percentage of sampled moonfish with empty stomachs may be related to the fishing gear, because the sampling time may not have included the feeding time.

1. Introduction

The moonfish (Mene maculata) is the only species in the family of Menidae (Figure 1). It is widely distributed, and records of its collection can be found in locations including the tropical waters of the Indo-West Pacific from East Africa to southern Japan, as well as northeastern Australia [1]. Taiwan is a subtropical island in Southeast Asia, geographically positioned in the western Pacific Ocean. Moonfish are often caught in the waters around Taiwan, and it is an important and low-priced baitfish that is consistently captured by longline fisheries in the southern waters of Taiwan. It is not often seen in fish markets as not everyone can easily cook it. This is also the reason why its price is low. However, the nutritional value of moonfish is very high. In the waters around Taiwan, fishing seasons and methods differ according to the region. For example, in the waters of southwestern Taiwan, the primary fishing season extends from September to April and the main fishing methods involve trawlers and torch-light fisheries; in contrast, in the waters of northeastern Taiwan, the primary fishing season extends from March to June and the main fishing methods involve trawlers and set nets [2,3]. Although the moonfish is mostly caught during a year-round fishing season, the main fishing locations are still in the waters of southwestern Taiwan, with the total catch in the region potentially being over 90% of the total in Taiwan [2,3].
Very few studies have focused on the moonfish in Taiwan. Initial studies have surveyed its resource status and fisheries [2], and evaluated the maturity and fecundity of moonfish in the adjacent waters of Taiwan [4]. Subsequent research has analyzed the effects of fishery overexploitation on the growth and age structure of moonfish [3].
Recent studies have investigated the effects of abiotic environmental factors on the distribution and catch rate of moonfish. Spatial variations across moonfish fisheries indicate a seasonal pattern, with fishing occurring in coastal waters during winter and in offshore waters during spring–summer [5]. The catch rate is influenced by not only sea surface temperature and thermocline changes but also the weakened Kuroshio Current, which alters the distribution range of this species [6].
Feeding habits and prey availability strongly influence fish habitats and fishing grounds. Variations in vertical and spatial distribution across fish species often result in specific predation patterns [7,8]. Prey biomass can influence fish stocks and resource availability [9,10]. These findings highlight the importance of considering biological and environmental interactions when studying fish species.
Although research has highlighted declines in moonfish resources and catch rates [3], detailed investigations of this species in Taiwanese waters remain limited. A recent decline has been noted in moonfish catches. Therefore, in line with the principles of sustainable fishery development and management, further research on moonfish in the southwestern waters of Taiwan is imperative.
Stomach content analysis is a valuable tool for understanding trophic interactions and feeding ecology [11,12,13], which can provide insights into stock and population dynamics [9]. The present study focused on moonfish in the southwestern waters of Taiwan, in the Western Pacific Ocean. The primary objective was to analyze the stomach contents of these fish to clarify their feeding habits and investigate the length–weight relationship to determine growth patterns. Our findings may bridge knowledge gaps regarding the feeding ecology and biological parameters of moonfish, providing a theoretical basis for sustainable fishery management.

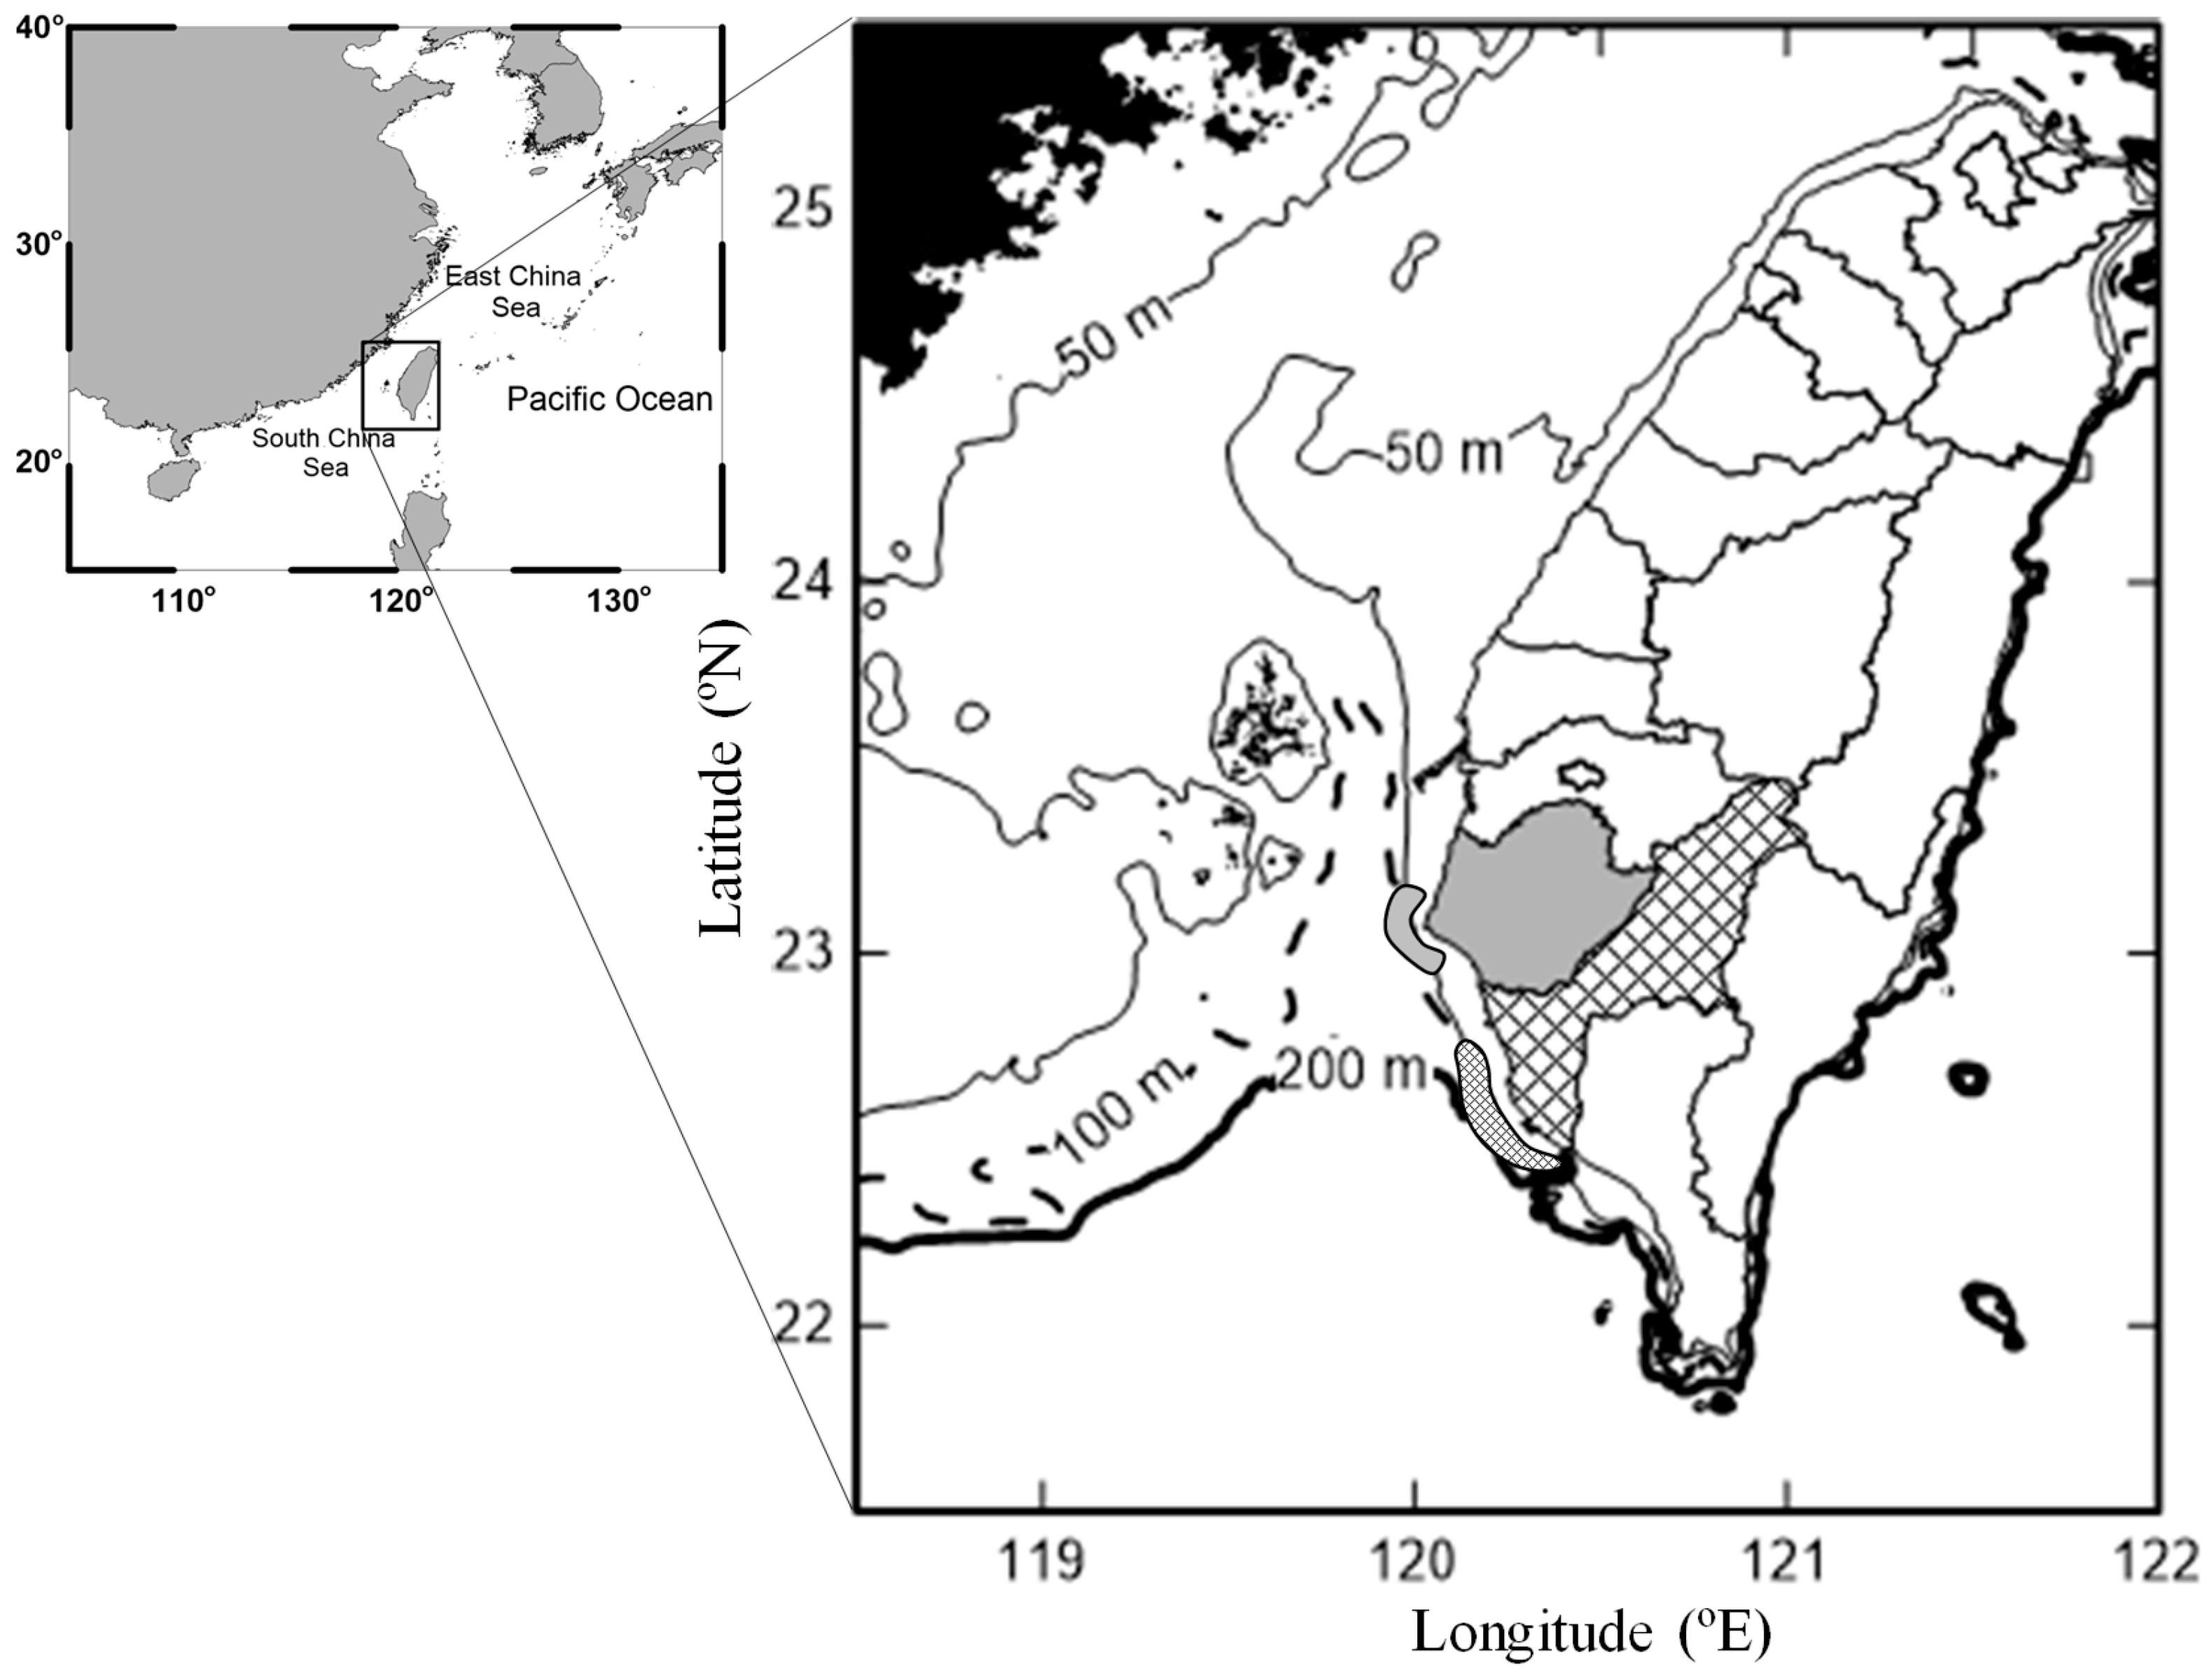
2. Materials and Methods

Moonfish specimens were randomly selected from the catches of commercial trawlers and Taiwanese purse seines in the southwestern waters of Taiwan, in the Western Pacific Ocean. The commercial trawling nets are typically used to fish several times from the evening to dawn. Our sampling time generally extended from the evening until midnight. The Taiwanese purse seines are usually used in fishing closer to dawn. Thus, our sampling time overlapped with the fishermen’s fishing time. The selection of sampling sites was based on the relatively major catch locations, high total landings, and longer catch season compared to other sites in Taiwan. Based on comprehensive consideration, we chose to collect samples in coastal waters near Tainan City and Kaohsiung City. The water depth of the sampling area is about 200m or less (Figure 2). The fishing area was ~22° 22′–23°10′ N, 119°52′–120°25′ E. We tried to collect specimens every month from January to December 2023 (Table 1) but, due to the bad weather in December, it was not easy for fisherman to use their boats and it was impossible to collect samples during this period. Whenever possible, at least 60 samples were collected per sampling. Too few individuals of other fish species were collected for meaningful diet comparisons. However, due to the market sales mechanism, we were sometimes unable to collect 60 samples. Therefore, we conducted secondary sampling within the same month (preferably within 10 days) to make up the number of samples, such as the sampling in Kaohsiung in May. To fully reflect the fish feeding habits across the range of sizes, we selected small to large samples in each sampling period. As usual, the stomach contents of the fish continue to be digested from the time they are caught until they are analyzed in the laboratory; the specimens were therefore frozen as soon as possible after capture to preserve the stomach contents and were transported to a laboratory for further analysis.
A total of 1467 moonfish specimens were collected that were identified to the species level following the method proposed by Nakabo [14]. The base information about the fish including fork length (FL) using a vernier scale and wet body weight (BW) using an electronic scale was measured to the nearest 0.01 mm and 0.01 g, respectively. As male and female moonfish have the same external appearance, the sex was determined according to gonad morphology. The main reason for confirming gender was to analyze the length–weight relationship and stomach contents between male and female specimens. We also determined the development of gonadal status to help understand the potential relationship between feeding and gonadal development. The stomach fullness and digestion state that are used to identify fish vary considerably in the literature. In this study, stomach fullness and digestion state were visually assessed using a biological microscope. Stomach fullness was estimated as the percentage of prey volume in the stomach and categorized as 0 (empty), 1 (one-quarter full), 2 (one-third full), 3 (half full), 4 (two-thirds full), 5 (three-quarters full), or 6 (full). The digestion state was categorized as follows: slightly digested, which means we can easily recognize the stomach content as a fish, crab, or even zooplankton—normally, the volume of resolved material in the stomach is much less; partially digested, which means some prey may not be in their original full shape or may possibly be separated into multiple pieces, but the tissues with some identifiable shape or identifying characteristics are intact; severely digested, which means most stomach contents are broken down, without the original shape and no intact identifying characters—even calculating the quantity is difficult; or fully digested, which means that no material was present in the stomach.
Only the prey in the stomach was identified and counted in this study. Other organisms not in the stomach (such as fish found in the mouth, or zooplankton stuck on gill rakers) were only recorded and identified to assist in the identification of the stomach contents. Therefore, we cut the stomach from the bottom of the gills to keep the most intact and largest stomach volume. Then, the stomach was opened with clean dissecting scissors and precision tweezers, and the contents were flushed into a Petri dish with water. Then, they were flushed again with 95% alcohol and, as far as possible, we collected all the material using a net with a mesh size of 330 µm. In most cases, all material in the stomach was removed. The above steps were performed when the stomach was completely thawed. Traditional visual techniques for diet analysis (especially to identify the prey items) are often difficult to perform. Although more technologically advanced approaches have been developed in recent years, traditional diet analysis is still considered to be a useful method due to its low cost. In this study, we aimed to identify all stomach contents and categorized them as follows: fish, cephalopods, crab, shrimp, other decapods, stomatopods, or zooplankton. The category of zooplankton was subdivided into foraminifera, radiolaria, medusa, siphonophora, ctenophora, cladocera, ostrocoda, calanoda, cyclopoida, harpacticoida, sapphirina, other copepoda (for those which cannot more easily be identified), mysidacea, euphausiacea, Sergestidae, lucifera, amphipoda, pteropoda (there are Creseidae, Cavoliniidae, and Atlantidae), chaetognatha, appendicularia, thaliacea, polychaeta, barnacle nauplius, shrimp larva, crab zoea, crab megalopa, and echinodermata larva. In the category of fish, we identified contents to the lowest possible taxonomic level. In addition, other non-biological matter in the stomach was still be recorded, but no data analysis was performed.
To analyze size-related dietary differences (ontogenetic shifts in diet), specimens were divided into five size classes: <15, 16–17, 18–19, 20–21, and >22 cm. There are two reasons for distinguishing body length classes in this way: first, moonfish smaller than 15 cm or larger than 22 cm are relatively rare in commercial catches, and 16-21 cm covers the most common sizes of moonfish caught. Secondly, stratifying body length according to growth stage, such as subadults and adults, may lead to substantial variation in sample sizes across groups. According to the results of Hwang [4], moonfish with a body length of more than 14 cm are in the adult (first maturity) stage. If this is used as the basis for body length grouping, due to the small sample size, separating the results may lead to overinterpretation. The length–weight relationship was evaluated using the allometric equation developed by Le Cren [15]:
BW = a × FLb,
where BW is wet body weight (g), FL is fork length (mm), a is a coefficient related to body shape, and b is an exponent that indicates isometric growth at a value of 3, the hypoallometric growth patterns at a value of less than 3, and the positive allometric growth patterns at a value of more than 3 [16].
To evaluate the relative importance of each prey item in the moonfish diet, several commonly used dietary composition indices were calculated [11,17]: the percentage frequency of occurrence (%FO) of each prey item; the percentage weight (%W), the proportion of each individual prey item’s weight to the total weight of prey items; the percentage number (%N), the proportion of each prey item relative to the total number of prey items. These indices were estimated on the basis of effectively (nonempty) stomachs.
To compare the importance of prey items between species, the prey-specific relative importance index (%PSIRI) [17] was calculated as %PSIRI = %FOi (%PNi + %PWi)/2, where %FOi is the percentage frequency of occurrence, %PNi is the prey-specific abundances based on counts, and %PWi is the prey-specific abundances based on weight. Variations in the sex ratio across sampling months and locations and differences in the length–weight relationship between male and female specimens were investigated using the chi-square test. This statistical analysis was performed using the R statistical software. Statistical significance was set at p < 0.05 (significance level). Stomach content composition was compared across months, locations, and size classes through analysis of similarities with Bray–Curtis similarity metrics in PRIMER-E6. Before conducting the Bray–Curtis similarity analysis, the dietary data for the different groups or size classes (value of IRI) were normalized using a log-transformed [log(x + 1)] transformation; then, the similarity matrices were constructed using the Bray–Curtis similarity coefficient. One-way analysis of similarities (ANOSIM) was performed on the similarity matrices to determine whether the dietary compositions of the fish differed among sites, months, or size classes. In the ANOSIM, a value of R is the test for differences in resemblances among samples; it is scaled between −1 and +1. When R > 0.75, there are differences between these testing samples; when 0.50 < R < 0.75, the testing samples have revealed a slightly significant difference (can be separated but are overlapping); when 0.25 < R, percent frequency there are no differences between these testing samples. These analyses and visualizations were also performed using the Plymouth Routines in Multivariate Ecological Research (PRIMER-E6; version 6.1.5; PRIMER-E Ltd., Plymouth, UK) and R (version 4.3.1) software.

3. Results

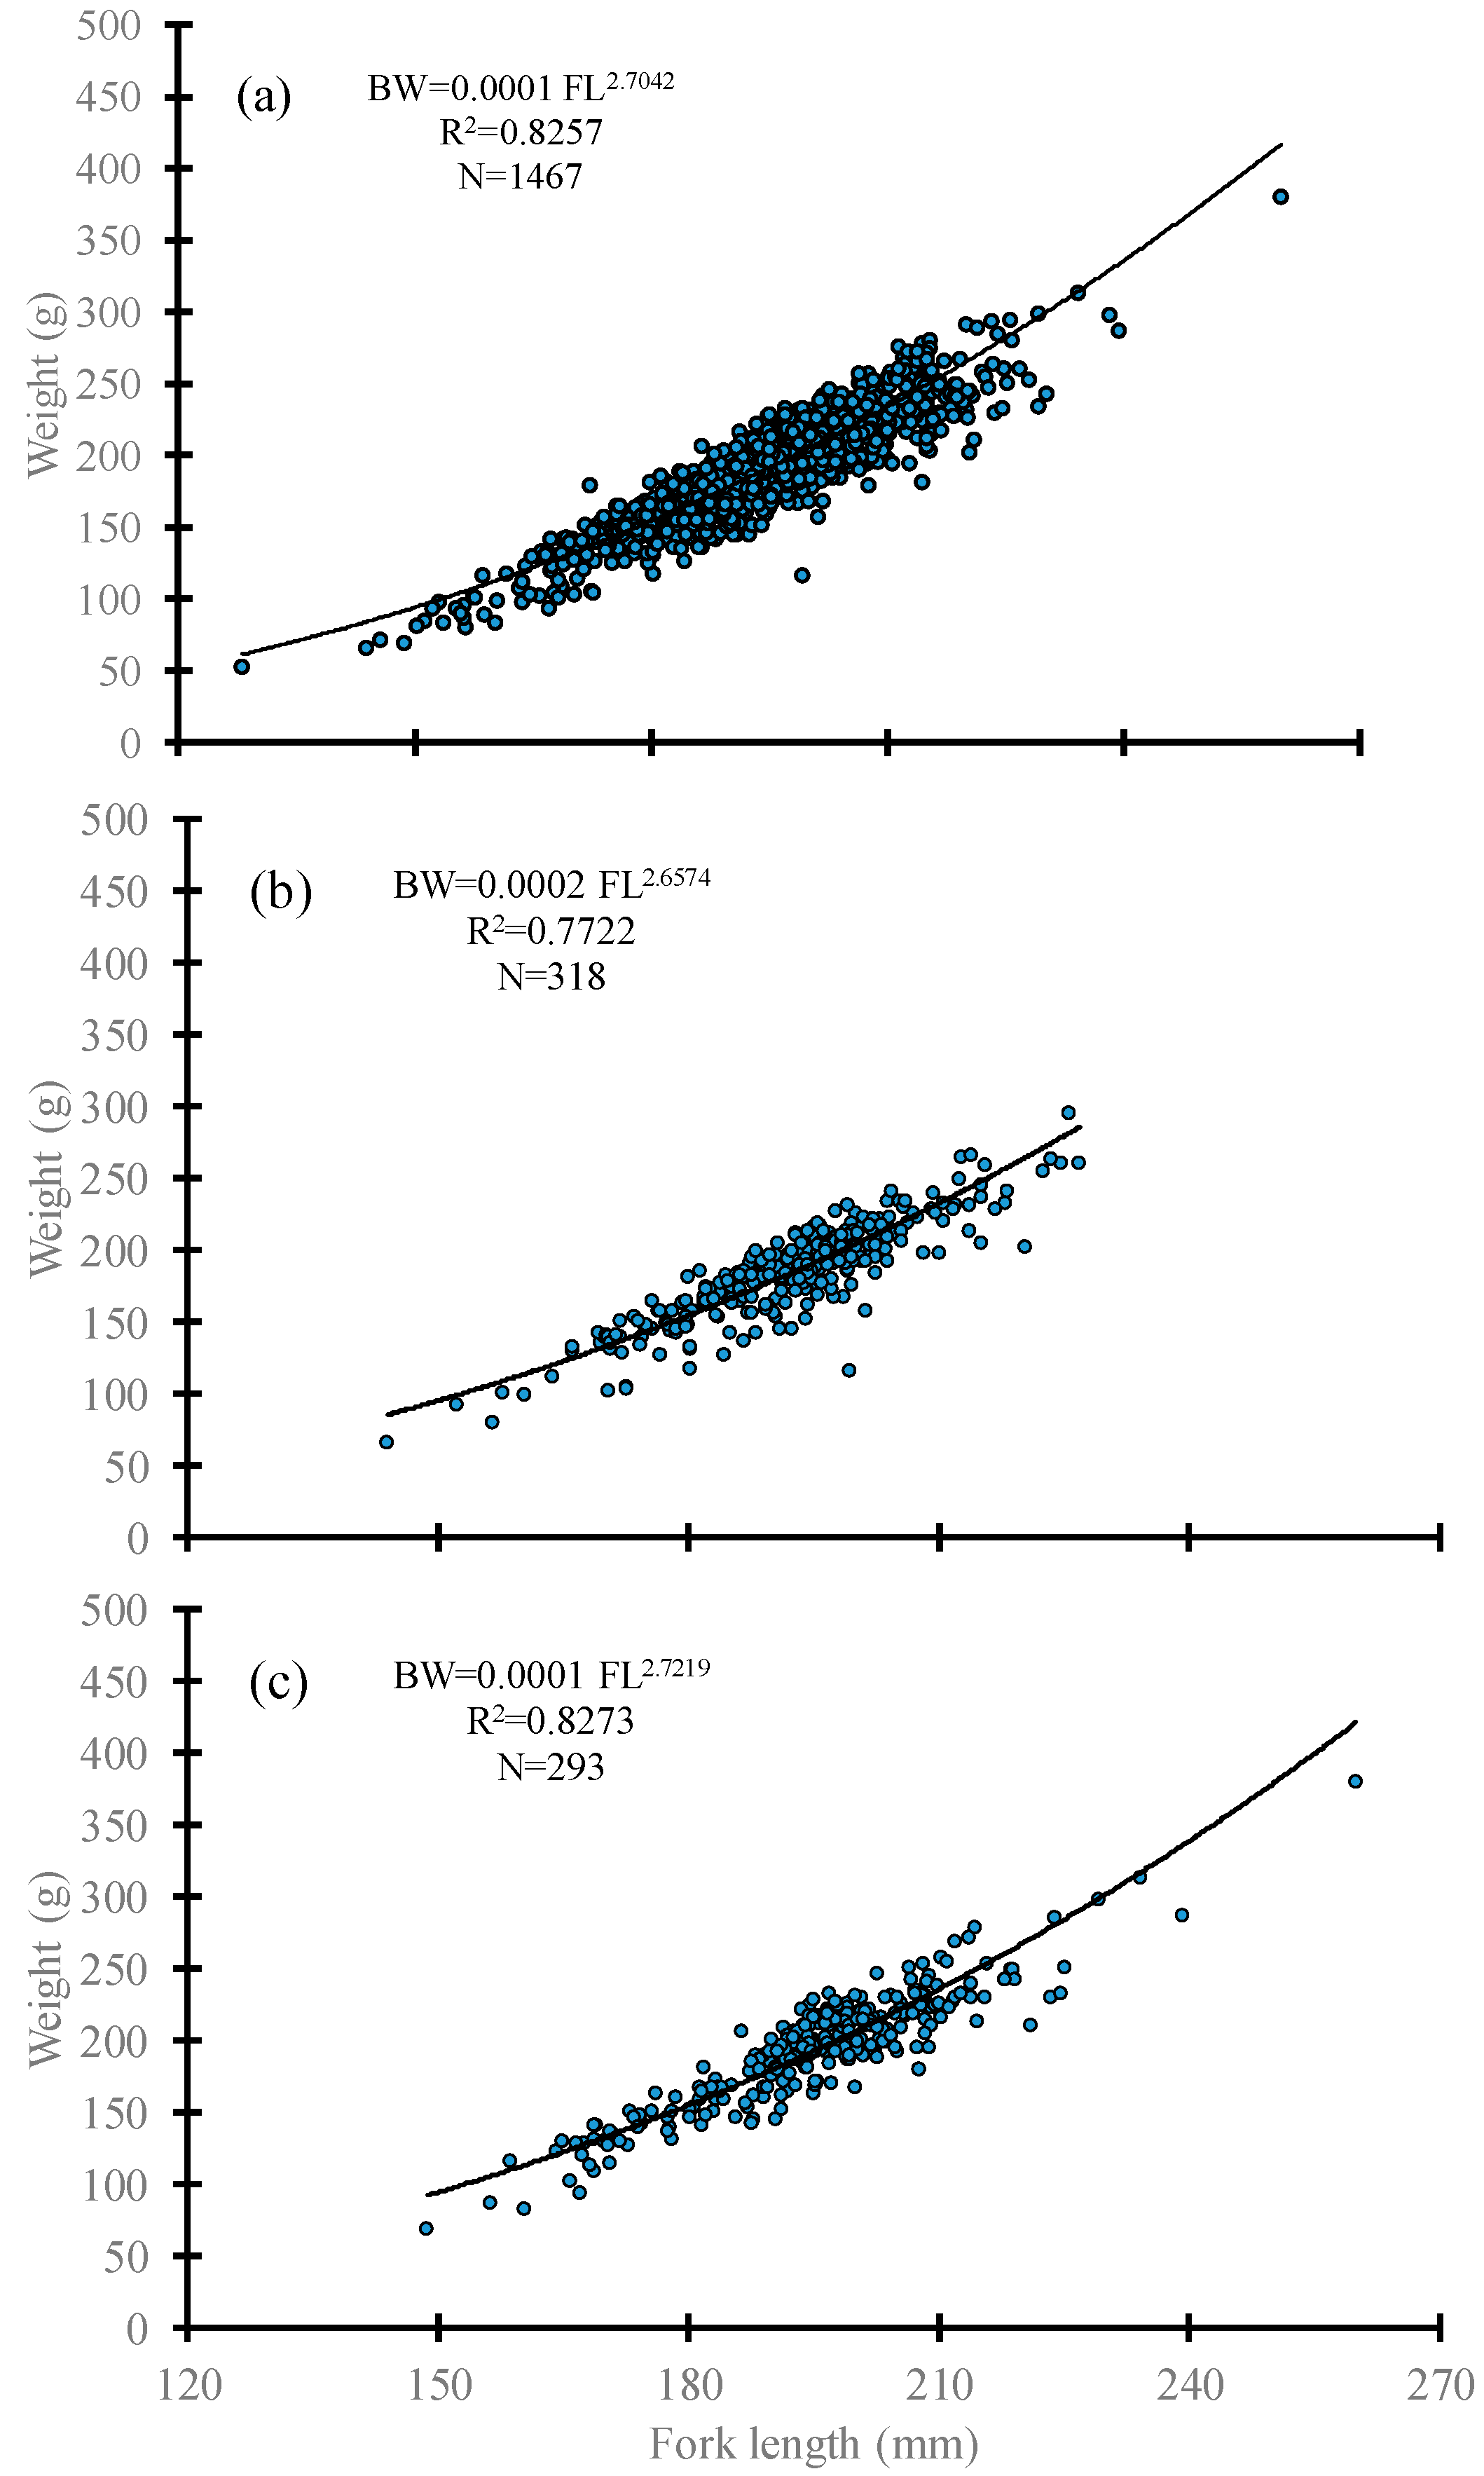
3.1. Specimen Characteristics

The FL of all the moonfish specimens from the southwestern waters of Taiwan ranged from 128.03 to 259.93 mm. The BW ranged from 52.71 to 380.4 g. The FL was slightly higher, although non-significantly, for specimens collected from the waters near Tainan City than for those collected from the waters near Kaohsiung City (n = 978 vs. 489; FL: 194.98 ± 13.06 vs. 193.94 ± 11.48 mm; p > 0.05). The average body size did not differ significantly between the Tainan and Kaohsiung specimens (p > 0.05). The BW was lower, although non-significantly, for the Tainan specimens than for the Kaohsiung specimens (192.11 ± 36.11 vs. 198.51 ± 77.67 g; p > 0.05). Most specimens were 180–210 mm in length.
From the specimens, 611 were randomly selected for sex determination. The overall sex ratio (female/male) was 0.9 (p = 0.12), and no significant sex ratio difference was observed (p > 0.05). For male specimens, the FL and BW were 192.75 ± 12.13 (range: 143.87 to 226.83) mm and 187.42 ± 32.8 (range: 66 to 295.17) g, respectively. By contrast, for female specimens, the FL and BW were 195.05 ± 13.83 (range: 148.66 to 259.93) mm and 195.38 ± 38.4 (range: 69.4 to 380.4) g, respectively. No significant between-sex difference was observed in body size (p > 0.05).
Figure 3 presents the length–weight relationship for all specimens (BW = 0.0001 × FL2.7042; R2 = 0.8257), female specimens (BW = 0.0001 × FL2.7219; R2 = 0.8273), and male specimens (BW = 0.0002 × FL2.6574; R2 = 0.7722). The estimated b values were 2.7042, 2.7219, and 2.6574 for all, female, and male specimens, respectively. No significant between-sex difference was observed in the b value (p > 0.05). These results revealed negative allometric growth patterns in both male and female specimens.

3.2. Stomach Fullness and Digestion State

We examined a total of 649 stomachs in this study. The percentage of empty stomachs (ES%) was higher for the Kaohsiung specimens (mean is about 88.03%) than for the Tainan specimens (mean is about 63.09%) (Table 1). However, this difference was non-significant (p > 0.05). After deducting the empty stomach samples (the value was zero), the average stomach fullness index was 2.5 and 1.7 in the Tainan specimens and the Kaohsiung specimens, respectively. The stomach fullness index was obviously lower for the Kaohsiung specimens than for the Tainan specimens. The digestion state of prey items also varied widely. If we quantify the degree of digestion, it ranges from 1 to 4, from slightly digested to severely digested (fully digested means empty stomach). The average degree of digestion was 2 and 3 in the Tainan specimens and the Kaohsiung specimens, respectively. The value was higher for the Kaohsiung specimens than for the Tainan specimens. It is worth noting that both severely and slightly digested contents were noted in the stomachs of specimens collected from the same location and at the same time. This result is particularly evident in the samples from Kaohsiung. The main prey items in these samples primarily included small shrimp, crabs, crab megalopa, and fish larvae.

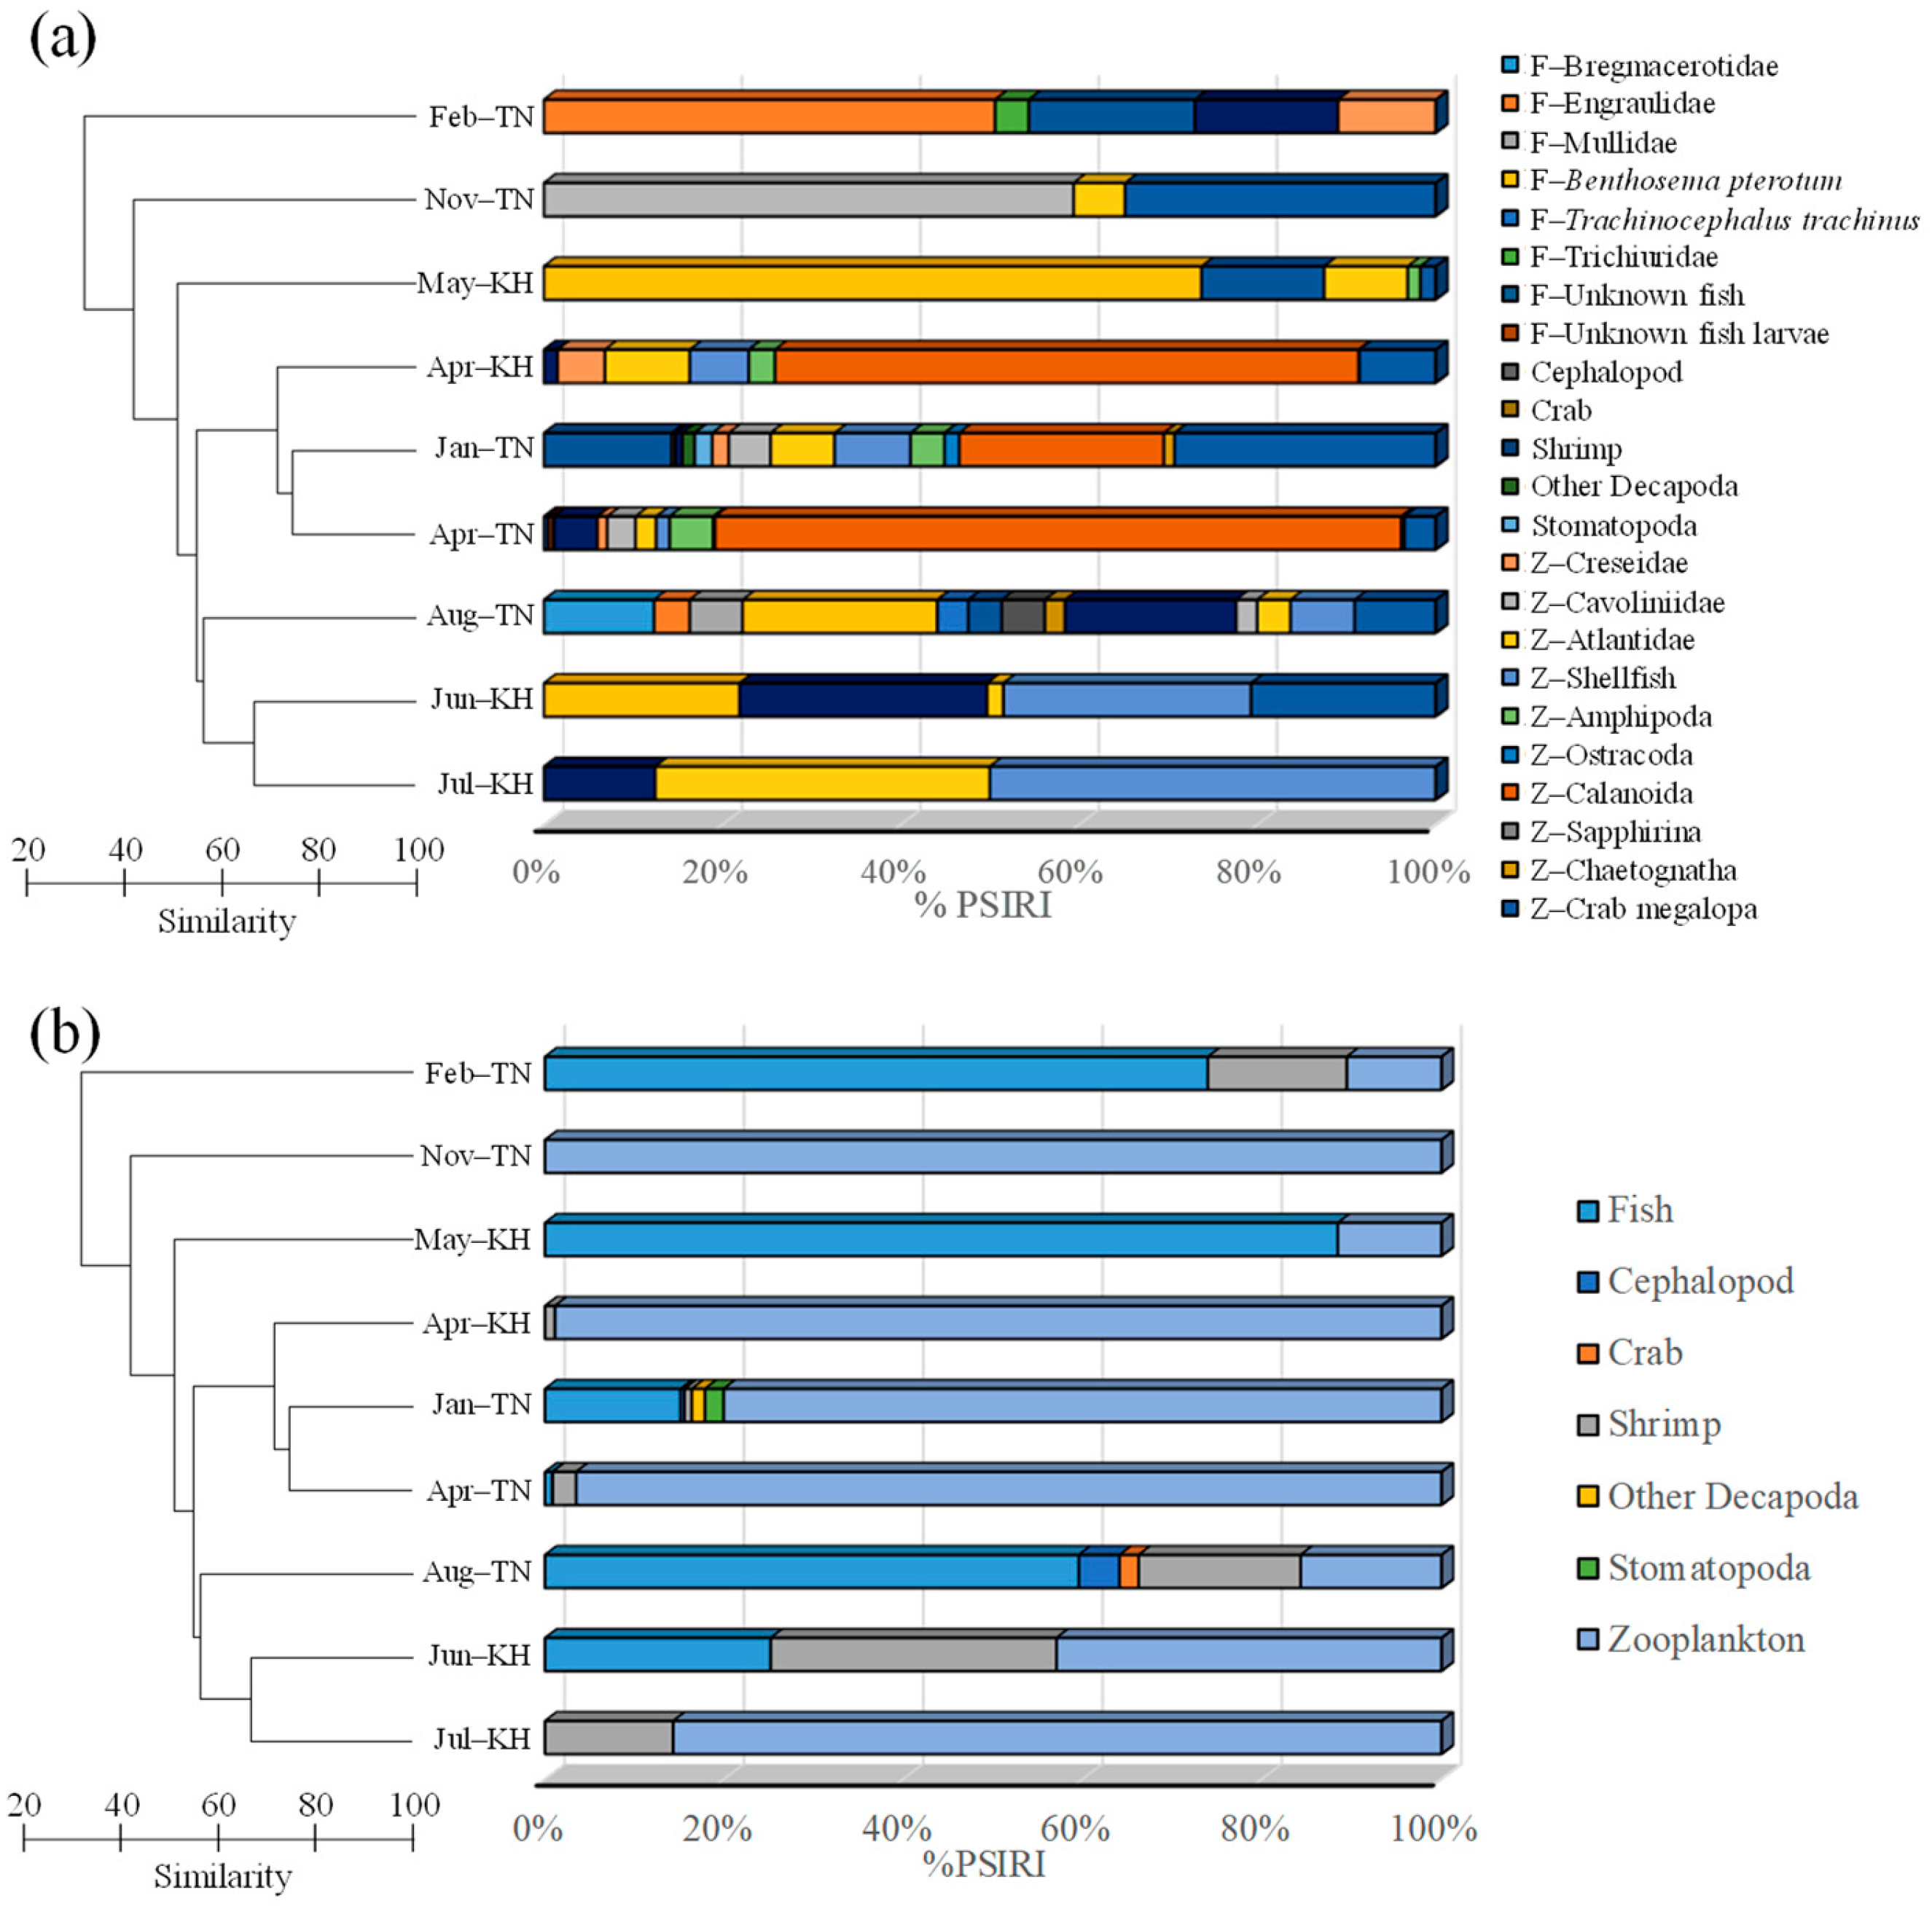
3.3. Dietary Variations Across Sampling Months

In total, the diet of moonfish specimens comprised seven prey categories (not including unidentified prey types): fish (eight prey items, including unknown fish and unknown fish larvae), cephalopods, crabs, shrimp, other decapods, stomatopods, and zooplankton (10 prey items) (Table A1). According to the results of the above seven prey categories, the most important one is zooplankton (%PSIRI = 76.58), followed by fish (%PSIRI = 20.03), and shrimp (%PSIRI = 2.42), while the other four were all below 1%. Among the zooplankton, Calanoida was the predominant dietary component (%PSIRI = 36.79) and the most important of all the prey items; it was followed by Benthosema pterotum (fish; %PSIRI = 19.23), crab megalopa (zooplankton; %PSIRI = 7.41), Engraulidae (fish; %PSIRI = 7.32), unknown fish (%PSIRI = 4.49), and shrimp (%PSIRI = 4). The %PSIRI of all the other prey items was all below 4%. Figure 4 presents a dendrogram depicting the %PSIRI value of each prey item in moonfish diet across sampling months and locations. Detailed data, including %N, %W, %FO, and %PSIRI for each sampling month and location, are listed in Table A1. According to the results of the ANOSIM, the R-value was 0.982 in the different sampling months analyzed (p = 0.001), and the R-value was 0.244 in the different sampling locations analyzed (p = 0.07). This indicates that although no significant differences were observed between the two sampling locations, variations in dietary components were noted across sampling months. Based on this result, the clustering based on Bray–Curtis similarity matrices revealed five major temporal groups of diet: June–August (G1; summer), January and April (G2; spring), May (G3; late spring), November (G4; autumn), and February (G5; winter). The G1 diet primarily comprised fish (B. pterotum, in particular, is the most important), shrimp, zooplankton (Atlantidae, shellfish, and crab megalopa are the most important), cephalopod, and crab. The G2 diet was most diverse in composition but primarily included zooplankton (Calanoida was the major item and crab megalopa was the second), fish (the family of Bregmacerotidae was dominant), shrimp, stomatopods, cephalopod, and other decapods. The G3 diet primarily comprised two categories, fish (including B. pterotum and unidentified fish) and zooplankton (Atlantidae is the most important). The G4 diet comprised only three major prey items: Cavoliniidae, crab megalopa, and Atlantidae. These all belong to the category of zooplankton. The G5 diet mainly included fish (the family of Engraulidae was dominant, followed by unidentified fish and Trichiuridae), shrimp, and zooplankton (only including Creseidae).
In addition, we compared the stomach contents of moonfish between male and female samples (Table A2). The stomach contents of 216 females revealed seven prey categories (a total of 20 prey items). Zooplankton presented a %PSIRI of 73.55 (Calanoida is the most important item), whereas fish was 21.52 (B. pterotum had the highest value of %PSIRI compared to the other fish), crabs had a value of 2.08, and shrimp was 1.69. The %PSIRI of all the other prey items was all below 1%. The stomach contents of 281 males revealed five prey categories (a total of 19 prey items). The first and second major prey items were the same as females, which were zooplankton (%PSIRI = 74.4; Calanoida) and fish (%PSIRI = 18.94; B. pterotum). These were followed by shrimp, with 4.54; cephalopods, with 1.8; and crabs, with 0.32. Using the statistical test ANOSIM, we detected that there was no difference between the groups (R = 0.18; p = 0.33). This study also found other non-biological matter in the stomachs of the moonfish, such as paper-like plastic products (about 2 × 2 cm in size), nylon lines (about 1–2 cm; a kind of fishing net), and fish scales (larger than any fish ingested into the stomach). Of all the moonfish in this study, only 5.6% were found to have ingested plastic products, and there was no pattern in the samples collected in terms of body size, region, or time. The proportion of fish scales observed in the stomach of the moonfish was higher, about 48% of the total samples (70% of them were samples larger than 17 cm).

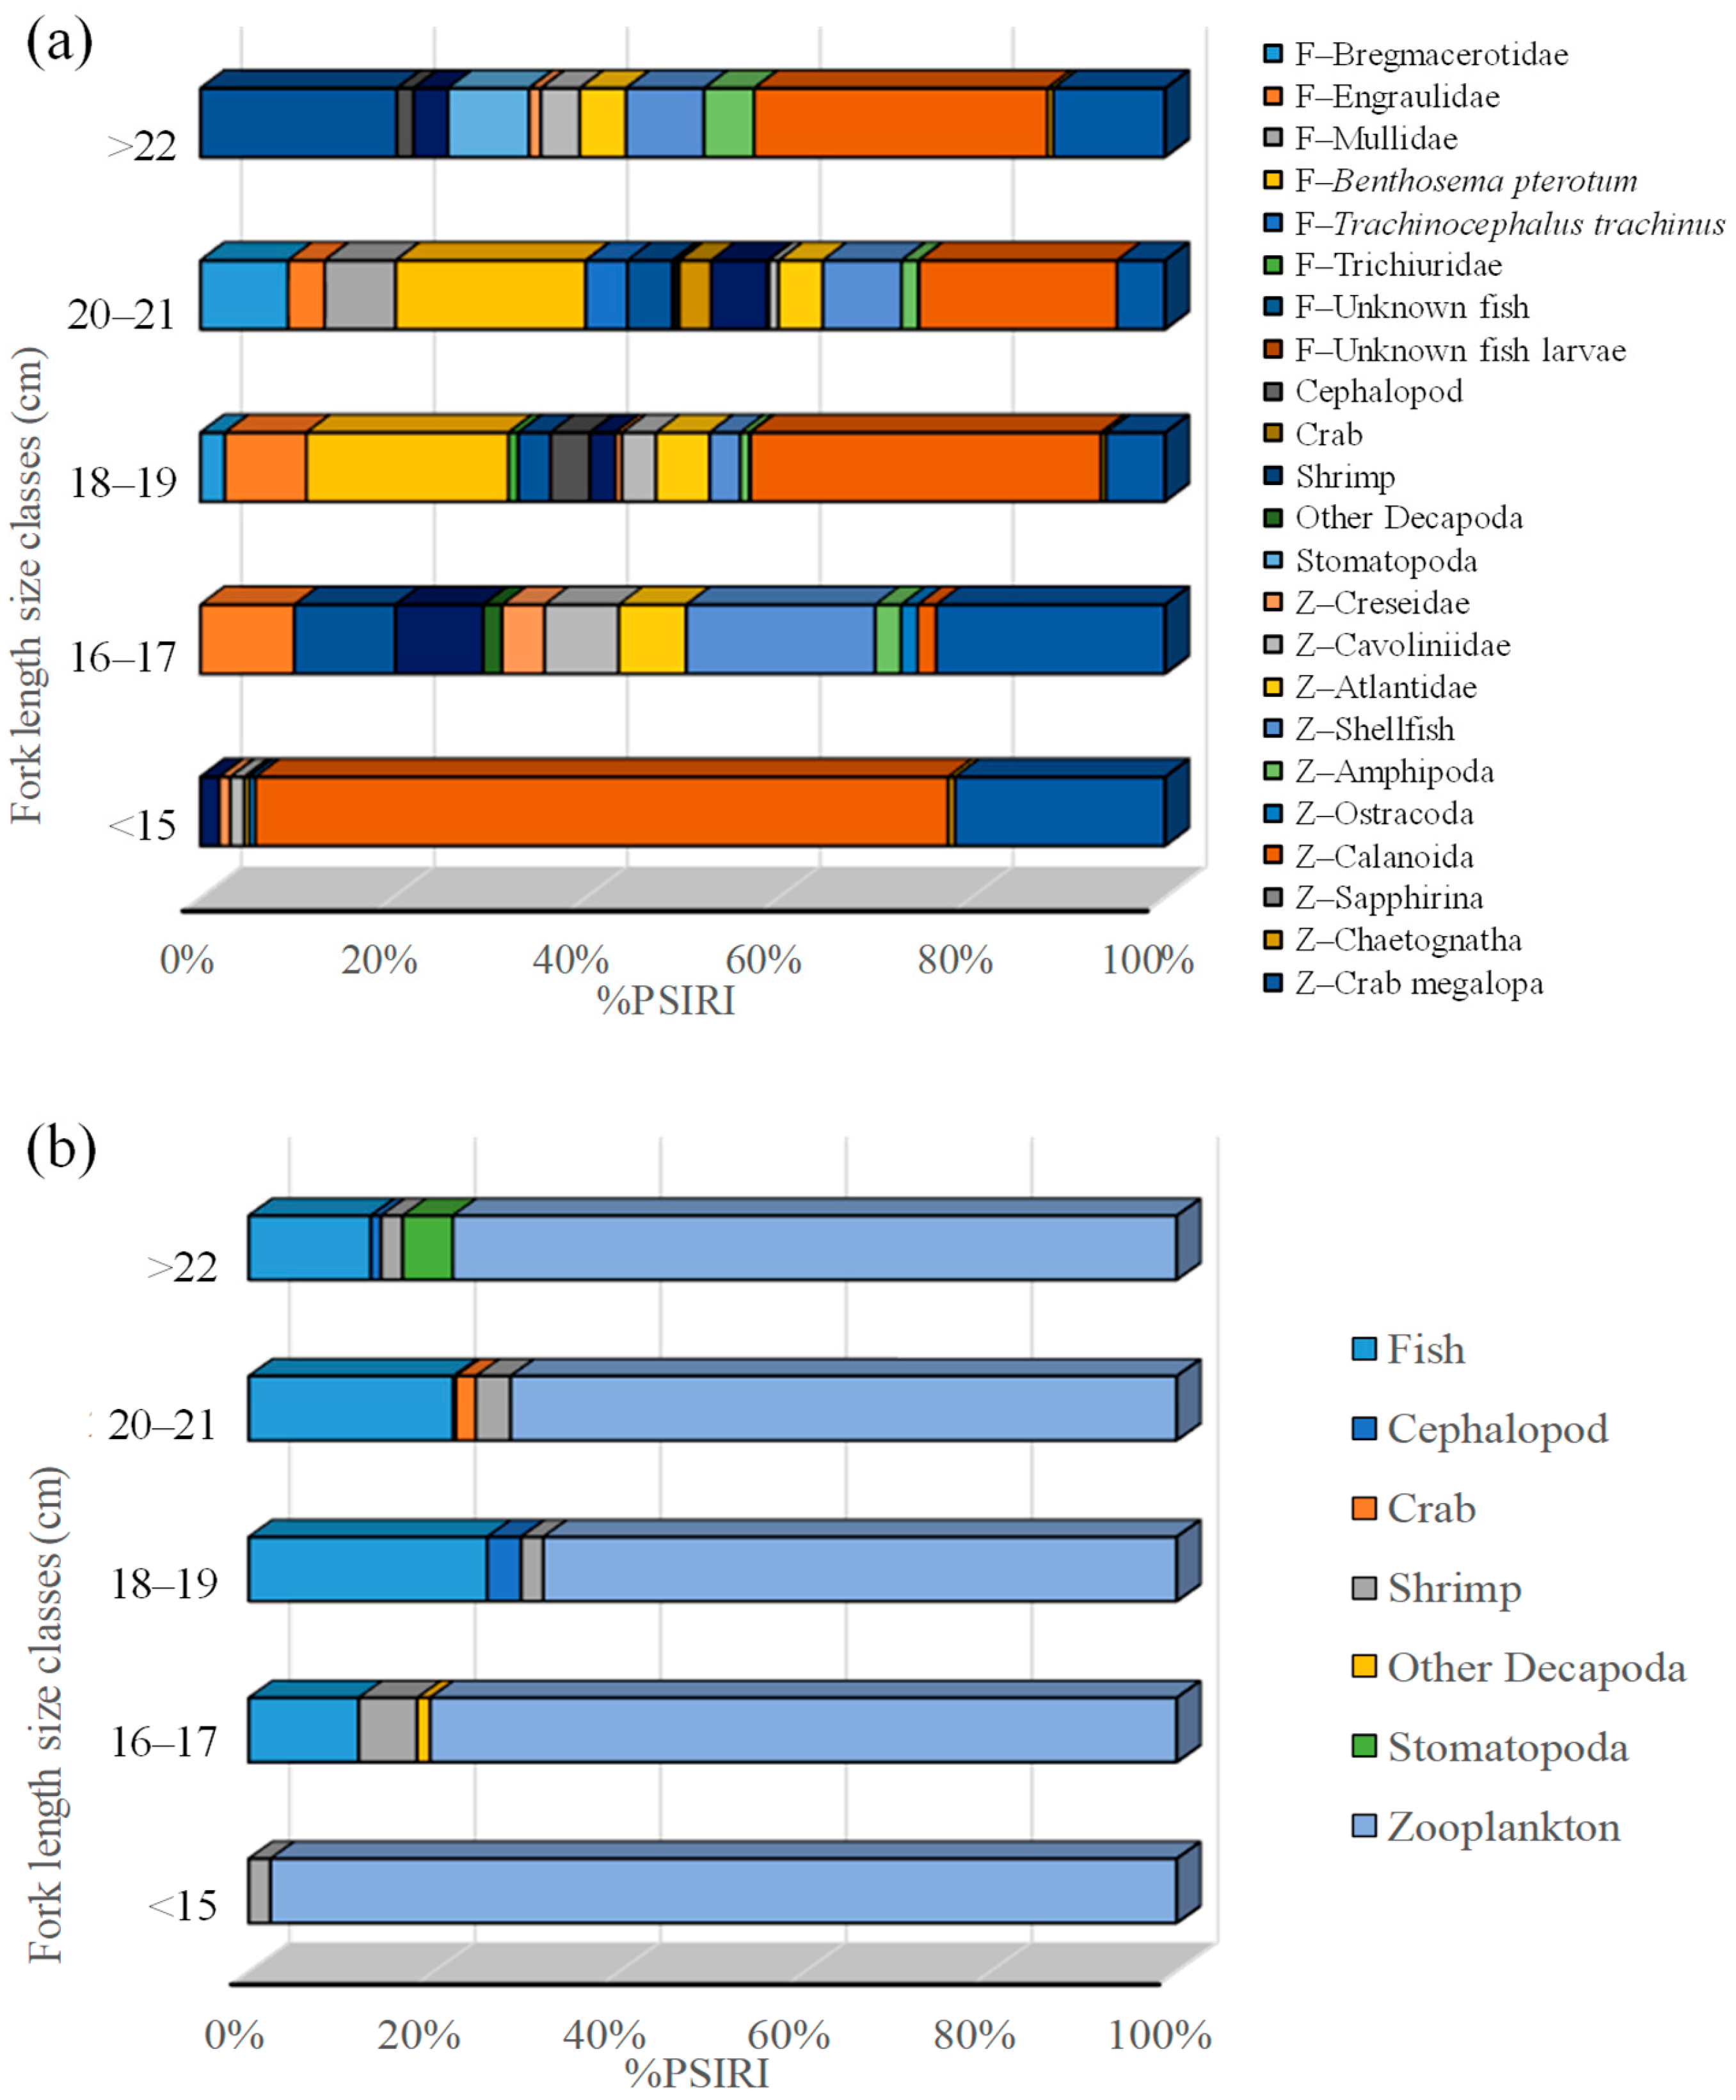
3.4. Dietary Variations Across Size Classes

The ANOSIM test indicated a highly significant (R = 0.891, p < 0.001) difference in the dietary composition of prey in the stomachs of all moonfish collected across the five size classes (Figure 5, Table A3). Smaller individuals (<15 cm FL) primarily consumed zooplankton (%PSIRI = 97.65), including Calanoida (the most important item) and crab megalopa, and shrimp (%PSIRI = 2.35), whereas larger individuals (>22 cm FL) consumed more fish (%PSIRI = 13.16, unidentified fish) in addition to zooplankton (%PSIRI = 78), including Calanoida and crab megalopa, and shrimp (%PSIRI = 2.31). Obviously, as body size increased, consumption of fish increased from %PSIRI = 0 to 13.16, and consumption of zooplankton decreased from %PSIRI = 97.65 to 78. The contribution of cephalopods also increased with body size: the %PSIRI increased from zero in the specimen size class of less than 15 cm to 1.11 in the specimen size class of over 22 cm. In addition, we observed that stomatopods were consumed only by larger fish (>22 cm FL). Some prey items can also only be found in one size class, such as other decapods only observed in the specimen size class of 16–17 cm and crabs only observed in the specimen size class of 20–21 cm. Shrimp were found in all size classes, but no clear trend was observed in the contribution of shrimp across the size classes.

4. Discussion

This study demonstrated hypoallometric growth patterns in both male and female specimens from the southwestern waters of Taiwan, in the Western Pacific Ocean. Similar growth patterns were observed in moonfish specimens sampled from different locations, for example, in unsexed specimens from Beibu Gulf in the South China Sea (b = 2.842) [1]; male (b = 2.8519) and female (b = 2.8756) specimens off the Mangalore coast, India [18]; and male and female specimens from Palabuhanratu Bay, Indonesia (b < 3) [19]. Some studies have reported different results; for example, positive allometric growth patterns were observed in specimens sampled from the Davao Gulf, the Philippines (b = 3.186) [20], and those sampled from the Karnataka Coast, India (b > 3) [21]. Notably, even when the sampling location is the same, results may vary depending on the sampling period. For instance, Hwang et al. [3] reported that the b value was 2.939 for moonfish sampled between 1981 and 1984, but increased to 3.147 for specimens collected between 1995 and 1997. Furthermore, Nguyen et al. [5] stated that the b value exceeded 3 for moonfish sampled between January and August 2021. Variations in the length–weight relationship reflect variations in growth, health status, and gonad development [15]. However, this relationship may fluctuate due to environmental conditions (e.g., temperature and food source) and ecological factors (e.g., spawning and developmental stage) [15,22]. Generally, higher b values are observed when gonads are more developed, food availability is greater, and weight gain is higher than length increase after maturation. Therefore, if samples comprise smaller, immature fish with underdeveloped gonads, b values tend to be lower. Based on the previous results described above, the body length of samples with b values lower than 3 is mostly between 10 and 20 cm, while the body length of those with b values greater than 3 is mostly between 7 and 20 cm. The result is that the higher the number of small-sized samples, the lower the b value lower, which cannot be well verified. Obviously, the body length of the sample is not the only (or main) factor affecting the fluctuation of the b value. Future sampling processes should consider factors influencing the b value, for example, sex, maturity stage, and season.
Many studies have reported that feeding intensity is associated with reproductive activity in fish [23,24,25,26,27,28]. Fish may either increase feeding before the spawning season and reduce it during spawning or maintain high feeding activity throughout the spawning period. According to Du et al. [1], moonfish reproduce from April to October, with peak spawning noted from August to October in the South China Sea. Therefore, according to the results of this study, the ES% value should gradually decrease from April to October, reaching its lowest from August to October. However, our findings did not indicate a clear increase or reduction in the ES% value during the reproductive period. The high ES% in this study should be less affected by the reproductive season. Our results suggested that differences in stomach fullness between the Tainan and Kaohsiung specimens are more likely attributable to variations in fishing methods. The stomachs of most Kaohsiung specimens were nearly empty or only one-third full; this fullness rate was lower than that noted for the Tainan specimens. The between-location discrepancy may be attributable to differences in fishing practices. In Tainan City, trawling nets are typically used from the evening until midnight. In contrast, in Kaohsiung City, Taiwanese purse seines are used closer to dawn. This pattern may indirectly suggest that moonfish feed primarily before early morning or at other times during the day, because in other waters of Taiwan (such as the east and north), there are still many fishermen who catch moonfish by pole fishing during the daytime, and the catch is higher than at night. Even the rate of digestion can have an impact on this. However, feeding times in this species remain poorly understood. We should conduct more work to provide a better understanding of these phenomena.
Our results indicated that the diet of the moonfish specimens comprised bony fish, crustaceans (unidentified small shrimp), and zooplankton (Calanoida and crab megalopa). Larger individuals consumed more fish, whereas smaller individuals fed primarily on zooplankton. These findings align with those of Viswambharan [29], who reported that juvenile moonfish along the eastern Arabian Sea primarily consumed zooplankton crustaceans and shifted to cephalopods and fish as they grew. Similar results were found by Zahid et al. [30]. Their study revealed that the major prey item for moonfish with a body size of less than 14 cm (±3.6 cm) was zooplankton. The second item was crustaceans. Koepper et al. [31] also showed that moonfish (standard length between 13.7 and 16.5 cm) feed mainly on fish, bivalvia, and gastropods. We also can find some shellfish in the diet of a sample’s body size over 15 cm. It is just that both pelagic bivalvia and gastropods are classified as shellfish in our study. In addition to fish and shellfish, moonfish also eat other prey items in this study. As fish develop, increases in mouth size, stomach capacity, and swimming ability enable them to consume wider ranges of prey sizes and species [32]—a pattern consistent with our findings. This result may also reflect that the diet of moonfish has changed. Generally, the feeding habits of fish usually change at different growth stages, such as larvae, juveniles, young fish, and adult fish [33,34,35,36,37]. However, most of the samples collected in this study were adult fish [4]. This is because commercial fisheries often cannot catch smaller fish. This makes it relatively difficult to study the early life history of this fish. In the future, we should study the early life history and feeding changes of moonfish to understand its feeding ecology well. The first step may be to investigate the spawning and nursery grounds of moonfish in the waters around Taiwan to help us collect samples.
The fish species consumed by moonfish differ by region. For example, anchovies and unicorn cod are dominant prey items in the eastern Arabian Sea [29]. However, our findings indicated B. pterotum as a key dietary component. Prey selection in fish is influenced by not only preference, but also resource availability within their habitat [38,39]. Typically, the predominant prey items are highly nutritious or abundant in the habitat region. Many fish species primarily feed on anchovies and unicorn cod because of their abundance in the associated region [26,40,41,42]. Similar feeding patterns have been noted in other marine ecosystems [38,43,44,45]. In the southwestern waters of Taiwan, B. pterotum is an abundant and ecologically important species, with higher abundance in summer and autumn than in spring and winter [46,47,48,49]. Many economically important fish species, such as the ribbonfish (Trichiurus lepturus), juvenile yellowfin tuna (Thunnus albacares), skipjack tuna (Katsuwonus pelamis), and kawakawa (Euthynnus affinis), also rely on B. pterotum as a primary food source during these seasons [46,50,51,52]. This may explain why B. pterotum was a prominent prey item in the stomachs of moonfish specimens collected during summer and autumn in our study. A similar seasonal pattern may apply to individuals that consumed increased amounts of Calanoida.

5. Conclusions

In summary, our study confirmed hypoallometric growth in moonfish based on the length–weight relationship. The species exhibited a broad diet, with not only zooplankton but also fish and crustaceans emerging as key prey items. Although dietary composition did not differ significantly between the sampling locations, variations were observed across size classes and sampling months. This may suggest ontogenetic dietary shifts. In the future, we need to collect more moonfish with a small body size (less than 14 cm) to prove these shifts. Variations in the value of empty stomachs may be attributable to differences in the sampling fishing gear used in this study, which may be associated with the feeding time of moonfish. Further research on their feeding time is required to identify key factors contributing to the empty stomachs value. Although the moonfish is distributed across the waters surrounding Taiwan, the largest catches occur in the southwestern region. Future studies should compare feeding habits across different regions, such as northern versus southern and eastern versus western waters, to determine whether moonfish exhibits prey selectivity. The fish often migrate to or inhabit some areas to feed on prey, which will affect their habitat. In addition, there were many unknown fish species in the fish stomach in this study due to the difficulty in identifying them using external morphology. We suggest that molecular techniques may be used to determine the composition of stomach contents, further clarifying the feeding ecology of this species.

Author Contributions

Conceptualization, Y.-C.W.; methodology, Y.-C.W., M.-A.L. and J.-S.H.; software, Y.-C.W.; validation, Y.-C.W.; formal analysis, Y.-C.W.; investigation, Y.-C.W. and J.-S.H.; resources, M.-A.L. and J.-S.H.; data curation, Y.-C.W.; writing—original draft preparation, Y.-C.W.; writing—review and editing, M.-A.L.; visualization, Y.-C.W.; supervision, M.-A.L. and J.-S.H.; project administration, Y.-C.W., M.-A.L. and J.-S.H.; funding acquisition, M.-A.L. All authors have read and agreed to the published version of the manuscript.

Funding

This research was supported by the Fisheries Agency, Ministry of Agriculture [grant numbers: 111AS-6.4.2-F1(7) and 112AS-6.4.2-F1(7)], and National Science and Technology Council [grant number: 113-2611-M-019-008].

Institutional Review Board Statement

Our manuscript does not require approval from the Ethics Committee or Institutional Review Board since our study is solely based on data provided from wild fishery dead fish, not from experimental living fish. This study was conducted in accordance with the guidelines of the Animal Research and Ethics Committees of National Taiwan Ocean University.

Informed Consent Statement

Not applicable.

Data Availability Statement

The datasets presented in this article are not readily available because the data are part of an ongoing study.

Acknowledgments

We acknowledge the hard work and dedication of the individuals who provided sampling assistance and fishing data for this study. We also give special thanks to the Taiwan Ocean Conservation and Fisheries Sustainability Foundation for providing fish samples and assistance for this research. In addition, we thank the staff members who participated in this study.

Conflicts of Interest

The authors declare no conflicts of interest.

Appendix A

Table A1. Each prey item of moonfish in the southwestern waters of Taiwan in the Western Pacific Ocean across sampling months and locations (see Figure 3).
GroupsG1—SummerG2—SpringG3—Late SpringG4—AutumnG5—WinterTOTAL
Date/CityJul-KHJun-KHAug-TNApr-TNJan-TNApr-KHMay-KHNov-TNFeb-TN
Prey Items%N%W%FO%PSIRI%N%W%FO%PSIRI%N%W%FO%PSIRI%N%W%FO%PSIRI%N%W%FO%PSIRI%N%W%FO%PSIRI%N%W%FO%PSIRI%N%W%FO%PSIRI%N%W%FO%PSIRI%N%W%FO%PSIRI
FISH (TOTAL) 5061.982025.1735.7186.0763.6459.551.032.8412.50.793.3236.645.4515.11 77.7897.5287.588.45 82.6187.418073.954.0258.3542.4220.03
Benthosema pterotum 5061.982021.9310.7139.0327.2721.82 72.2197.397573.75 1.1934.6613.1319.23
Trichiuridae 4.3510.93103.790.050.511.010.7
Engraulidae 5.368.4313.644 56.5255.076050.590.765.19.097.32
Bregmacerotidae 8.9322.5522.7312.34 0.246.845.053.57
Trachinocephalus trachinus 3.578.99.093.49 0.092.72.021.01
Mullidae 3.576.289.095.94 0.091.92.021.72
Unknown fish 3.570.899.093.760.241.0912.50.493.3236.645.4514.32 5.560.1412.513.74 21.7421.413018.61.16.2512.124.49
Unknown fish larvae 0.791.7612.50.55 0.480.381.010.09
CEPHALOPODS (TOTAL) 7.141.813.644.550.240.1312.50.060.550.779.090.43 0.430.675.050.15
Cephalopod 7.141.813.644.830.240.1312.50.10.550.779.090.41 0.430.675.050.25
CRABS (TOTAL) 5.360.369.092.13 0.140.112.020.39
Crabs 5.360.369.092.26 0.140.112.020.65
SHRIMP (TOTAL)28.5782.9912.514.298.3320.662031.8917.8610.6240.9118.081.436.4362.52.621.390.7645.450.830.590.094.551.11 13.0412.413015.52.055.925.252.42
Shrimp28.5782.9912.512.58.3320.662027.7817.8610.6240.9119.191.436.4362.54.861.390.7645.450.790.590.094.551.53 13.0412.413016.082.055.925.254
OTHER DECAPODS (TOTAL) 0.550.669.091.46 0.090.081.010.18
Other decapods 0.550.669.091.38 0.090.081.010.29
STOMATOPODS (TOTAL) 1.669.059.092.1 0.291.171.010.25
stomatopods 1.669.059.091.99 0.291.171.010.42
ZOOPLANKTON (TOTAL)71.4317.0187.585.7141.6717.368042.9433.931.1540.9115.6997.390.610096.5392.5352.1610080.0799.4199.9110098.8922.222.4837.511.551001001001004.350.181010.5592.9833.7282.8376.58
Creseidae 1.831.47251.093.050.5936.361.820.30.334.555.31 4.350.181010.941.720.428.080.46
Cavoliniidae 3.570.039.092.350.873.3162.53.186.655.6372.734.71 6061.298059.39 2.21.8519.191.9
Atlantidae28.579.9637.537.58.330.42201.8114.290.2113.643.730.561.7837.52.319.973.3381.827.173.853.8236.369.5211.110.12259.386.676.45205.77 3.441.1830.33.79
Shellfish42.867.0550508.331.652027.788.930.213.647.210.321.3937.51.529.975.8372.738.530.8812.813.646.61 2.631.8822.223.63
Amphipoda 4.937.7437.54.874.991.6872.733.84.733.2718.182.935.560.1912.51.41 4.632.116.161.93
Ostracoda 0.320.08250.221.660.6736.361.64 0.480.16.060.14
Calanoida 86.870.035076.9531.027.8454.5522.9684.0263.1859.0965.47 71.0319.5323.2336.79
Sapphirina 0.30.094.550.08 0.050.011.010.02
Chaetognatha 0.320.6312.50.362.230.7327.271.18 0.570.234.040.19
Crab megalopa 250.115.296020.77.140.79.099.081.354.1662.53.522.9925.8690.9129.35.3316.4240.918.555.562.1612.51.7233.3332.268034.84 6.256.4334.347.41
Abbreviations: %N, percentage number; %W, percentage weight; %FO, percentage frequency of occurrence; %PSIRI, prey-specific relative importance index.
Table A2. Prey items of male and female moonfish in the southwestern waters of Taiwan in the Western Pacific Ocean.
SexMaleFemale
Prey Items%N%W%FO%PSIRI%N%W%FO%PSIRI
FISH (TOTAL)4.3456.2533.9318.943.7959.8544.1921.52
Benthosema pterotum0.8418.2410.7112.161.4246.5516.2822.89
Trichiuridae 0.080.872.331.36
Engraulidae1.336.4710.717.840.44.116.987.72
Bregmacerotidae0.4816.277.145.980.080.012.330.32
Trachinocephalus trachinus0.246.423.571.9
Mullidae0.244.533.573.23
Unknown fish1.24.3110.712.221.037.6613.957.88
Unknown fish larvae 0.790.654.650.18
CEPHALOPODS (TOTAL)0.481.35.361.80.40.224.650.06
Cephalopod0.481.35.362.630.40.224.650.07
CRABS (TOTAL)0.120.251.790.320.160.012.332.08
Crabs0.120.251.790.470.160.012.332.62
SHRIMP (TOTAL)3.868.428.574.540.874.123.261.69
Shrimp3.868.428.576.630.874.123.262.13
OTHER DECAPODS (TOTAL) 0.160.152.330.45
Other decapods 0.160.152.330.57
STOMATOPODS (TOTAL) 0.472.022.330.65
Stomatopods 0.472.022.330.82
ZOOPLANKTON (TOTAL)91.233.866.0774.494.1533.6576.7473.55
Creseidae1.930.687.140.581.580.239.30.33
Cavoliniidae2.772.0316.072.051.821.7127.911.71
Atlantidae3.861.76252.493.160.7737.215.92
Shellfish4.582.07253.581.341.7418.63.87
Amphipoda4.72.4716.072.414.581.8318.61.55
Ostracoda0.240.063.570.340.630.139.30.15
Calanoida64.2217.3423.2135.4675.4921.1125.5834.01
Sapphirina0.120.011.790.05
Chaetognatha0.960.413.570.160.320.14.650.22
Crab megalopa7.836.9832.149.825.226.0339.535.68
Abbreviations: %N, the percentage number; %W, the percentage weight; %FO, the percentage frequency of occurrence; %PSIRI, prey-specific relative importance index.
Table A3. Prey items of five size classes of moonfish in the southwestern waters of Taiwan in the Western Pacific Ocean.
Size Classes<15 cm16–17 cm18–19 cm20–21 cm>22 cm
Prey Items%N%W%FO%PSIRI%N%W%FO%PSIRI%N%W%FO%PSIRI%N%W%FO%PSIRI%N%W%FO%PSIRI
FISH (TOTAL) 6.631.830.7711.855.467137.7425.713.6556.5846.1522.062.6829.577513.16
Benthosema pterotum 2.8454.1516.9820.940.5825.1815.3819.71
Trichiuridae 0.161.031.891.02
Engraulidae 2.8311.677.699.731.357.6311.328.470.443.147.693.8
Bregmacerotidae 0.286.083.772.520.4411.9711.549.08
Trachinocephalus trachinus 0.298.387.694.33
Mullidae 0.295.917.697.36
Unknown fish 3.7720.1323.0810.490.692.17.553.330.290.847.694.662.6829.577520.37
Unknown fish larvae 0.160.011.890.011.321.163.850.26
CEPHALOPODS (TOTAL) 0.280.023.773.650.731.757.690.280.450.68251.11
Cephalopod 0.280.023.774.080.731.757.690.430.450.68251.72
CRABS (TOTAL) 0.290.347.692.13
Crabs 0.290.347.693.32
SHRIMP (TOTAL)1.722.966.672.353.7710.5830.776.321.763.8618.872.41.69.2330.773.752.914.71502.31
Shrimp1.722.966.671.943.7710.5830.779.11.763.8618.872.671.69.2330.775.842.914.71503.58
OTHER DECAPODS (TOTAL) 1.892.857.691.37
Other decapods 1.892.857.691.97
STOMATOPODS (TOTAL) 1.347.95255.42
Stomatopods 1.347.95258.4
ZOOPLANKTON (TOTAL)98.2897.166.6797.6587.7454.7769.2380.4692.525.1269.8168.2493.7332.169.2371.7892.6257.0910078
Creseidae1.731.0866.671.164.722.1315.384.390.810.063.770.682.040.23.850.142.011.71251.22
Cavoliniidae0.86633.331.4510.389.4830.777.71.891.4713.213.521.461.1419.231.022.242.781004.05
Atlantidae0.861.4833.330.4914.154.1530.776.994.05130.195.561.750.3923.084.583.132.88754.79
Shellfish 14.153.238.4619.61.621.7916.983.180.870.4715.388.164.935.11008.09
Amphipoda 6.62.4623.082.693.380.6216.980.966.563.667.691.744.473.71755.19
Ostracoda0.862.2633.330.663.771.2715.381.710.160.051.890.090.580.067.690.08
Calanoida91.3882.9466.6771.853.771.7115.381.9272.5713.2330.1936.3477.5523.2311.5420.5369.1331.482530.42
Sapphirina 0.160.011.890.04
Chaetognatha1.731.6233.330.7 0.810.163.770.5 0.890.92250.61
Crab megalopa0.861.7233.3321.7530.230.3730.7723.717.036.7332.086.092.922.9534.624.965.828.5110011.56
Abbreviations: %N, percentage number; %W, percentage weight; %FO, percentage frequency of occurrence; %PSIRI, prey-specific relative importance index.

References

  1. Du, D.S.; Feng, B.; Hou, G.; Lu, H.S.; Yan, Y.R. Age and growth of moonfish, Mene maculata from mouth of the Beibu Gulf, South China Sea. J. Fish. China 2012, 36, 576–583. [Google Scholar] [CrossRef]
  2. Hwang, S.Y. Fisheries and population study of Taiwan moon fish, Mene maculate. Bull. Taiwan Fish. Res. Inst. 1981, 33, 281–295. [Google Scholar]
  3. Hwang, S.Y.; Chen, C.T.; Liu, K.M. Age and growth of the moon fish, Mene maculata, before and after heavy exploitation in southwestern Taiwan waters. J. Fish. Soc. Taiwan 2002, 29, 299–311. [Google Scholar] [CrossRef]
  4. Hwang, S.Y. Study on maturity and fecundity of moonfish, Mene maculata, in adjacent waters of Taiwan. Bull. Taiwan Fish. Res. Inst. 1984, 37, 93–100. [Google Scholar]
  5. Nguyen, M.L.; Jiang, X.N.; Wang, Y.C.; He, J.S.; Liao, C.H.; Lee, M.A. Preliminary study on the fishing activities of the moonfish Mene maculate fishery in the waters of southwestern Taiwan. J. Fish. Soc. Taiwan 2021, 48, 55–66. [Google Scholar] [CrossRef]
  6. Ray, A.; Mondal, S.; Osuka, K.E.; Sihombing, R.I.; Lee, M.A.; Wang, Y.C.; He, J.S. Impact of climate variability on moonfish (Mene maculata) catch rate in the waters off southwestern Taiwan. Fish. Oceanogr. 2024, 33, e12667. [Google Scholar] [CrossRef]
  7. Flemer, D.A.; Woolcott, W.S. Food habits and distribution of the fishes of Tuckahoe Creek, Virginia, with special emphasis on the bluegill, Lepomis m. macrochirus Rafinesque. Chesap. Sci. 1966, 7, 75–89. [Google Scholar] [CrossRef]
  8. González-Iglesias, M.D.L.C.; Paz, X.; Román-Marcote, E.; Hermida-Doval, M. Feeding habits of fish species distributed on the Grand Bank (NAFO Divisions 3NO 2002–2005). In NAFO Scientific Council Research (SCR) Documents, NAFO SCR Doc. 06/31 Serial N° N5755.; Centro Oceanográfico de Vigo: Vigo, Spain, 2006; pp. 1–22. [Google Scholar]
  9. Tanaka, H.; Aoki, I.; Ohshimo, S. Feeding habits and gill raker morphology of three planktivorous pelagic fish species off the coast of northern and western Kyushu in summer. J. Fish Biol. 2006, 68, 1041–1061. [Google Scholar] [CrossRef]
  10. Eriksen, E.; Skjoldal, H.R.; Dolgov, A.V.; Strand, E.; Keulder-Stenevik, F.; Prokopchuk, I.P.; Prokhorova, T.A.; Prozorkevich, D.; Benzik, A.N. Diet and trophic structure of fishes in the Barents Sea: Seasonal and spatial variations. Prog. Oceanogr. 2021, 197, 102663. [Google Scholar] [CrossRef]
  11. Hyslop, E. Stomach contents analysis—A review of methods and their application. J. Fish Biol. 1980, 17, 411–429. [Google Scholar] [CrossRef]
  12. Amundsen, P.A.; Sánchez-Hernández, J. Feeding studies take guts–critical review and recommendations of methods for stomach contents analysis in fish. J. Fish Biol. 2019, 95, 1364–1373. [Google Scholar] [CrossRef] [PubMed]
  13. da Silveira, E.L.; Semmar, N.; Cartes, J.E.; Tuset, V.M.; Lombarte, A.; Ballester, E.L.C.; Vaz-dos-Santos, A.M. Methods for trophic ecology assessment in fishes: A critical review of stomach analyses. Rev. Fish. Sci. Aquacult. 2020, 28, 71–106. [Google Scholar] [CrossRef]
  14. Nakabo, T. Fishes of Japan with Pictorial Keys to the Species, 3rd ed.; Tokai University Press: Tokyo, Japan, 2013; p. 877. [Google Scholar]
  15. Le Cren, E.D. The length-weight relationship and seasonal cycle in gonad weight and condition in the perch (Perca fluviatilis). J. Anim. Ecol. 1951, 20, 201–219. [Google Scholar] [CrossRef]
  16. Edwards, A.L. An Introduction to Linear Regression and Correlation; W. H. Freeman and Company: New York, NY, USA, 1976; p. 213. [Google Scholar]
  17. Brown, S.C.; Bizzarro, J.J.; Cailliet, G.M.; Ebert, D.A. Breaking with tradition: Redefining measures for diet description with a case study of the Aleutian skate Bathyraja aleutica (Gilbert 1896). Environ. Biol. Fishes 2012, 95, 3–20. [Google Scholar] [CrossRef]
  18. Sneha, D. Studies on Biological Aspects of the Moon fish, Mene maculata (Bloch and Schneider 1801) off Mangalore Coast. Ph.D. Thesis, Animal and Fisheries Sciences University, Bidar, Karnataka, India, 2019. [Google Scholar]
  19. Gani, M.J.A.; Zairion, Z.; Boer, M. Reproductive Biology Status Reproductive Biology Status of Moonfish (Mene maculata) in Palabuhanratu Bay during West Monsoon. J. Trop. Fish. Manag. 2024, 8, 9–16. [Google Scholar] [CrossRef]
  20. Gumanao, G.S.; Saceda-Cardoza, M.M.; Mueller, B.; Bos, A.R. Length–weight and length–length relationships of 139 Indo-Pacific fish species (Teleostei) from the Davao Gulf, Philippines. J. Appl. Ichthyol. 2016, 32, 377–385. [Google Scholar] [CrossRef]
  21. Viswambharan, D.; Rohit, P.; Joshi, K.K.; Thomas, S. Length-weight relationship and growth parameters of moonfish Mene maculata (Bloch and Schneider 1801) from Karnataka Coast, India. Indian J. Fish. 2018, 65, 105–109. [Google Scholar] [CrossRef]
  22. Pauly, D. Fish Population Dynamics in Tropical Waters: A Manual for Use with Programmable Calculators; International Center for Living Aquatic Resources Management (I.C.L.A.R.M.): Makati, Manila, Philippines, 1984; p. 325. [Google Scholar]
  23. Dadzie, B.S.; Abou-Seedo, F.; Al-Qattan, E. The food and feeding habits of the silver pomfret, Pampus argenteus (Euphrasen), in Kuwait waters. J. Appl. Ichthyol. 2000, 16, 61–67. [Google Scholar] [CrossRef]
  24. Garrido, S.; Murta, A.G.; Moreira, A.; Ferreira, M.J.; Angélico, M.M. Horse mackerel (Trachurus trachurus) stomach fullness off Portugal: Index calibration and spatio-temporal variations in feeding intensity. ICES J. Mar. Sci. 2008, 65, 1662–1669. [Google Scholar] [CrossRef]
  25. Valinassab, T.; Jalali, S.; Hafezieh, M.; Zarshenas, G.R. Evaluation of some feeding indices of Pomadasys kaakan in the Northern Persian Gulf. Iran. J. Fish. Sci. 2011, 10, 497–504. [Google Scholar]
  26. Mohammed, K.; Rohit, P.; Abdussamad, E.M.; Abdul Azeez, P.; Vase, V.K.; Bharadiya Sangita, A. Reproductive biology, diet and feeding pattern of longtail tuna Thunnus tonggol (Bleeker 1851) in the north-eastern Arabian Sea off Gujarat, India. Indian J. Fish. 2018, 65, 16–25. [Google Scholar] [CrossRef]
  27. Mammel, M.; Lee, M.A.; Wang, Y.C.; Ghosh, A.; Chen, Y.K.; Matilda, M.V.; Navus, S.G. Unraveling the feeding strategies of the greater amberjack: Insights into size-dependent dietary patterns and environmental influences in Taiwanese waters. Fish. Sci. 2024, 90, 931–952. [Google Scholar] [CrossRef]
  28. Ordiano-Flores, A.; Méndez Gudiño, K.E.; Calle-Morán, M.D.; Hernández-Téllez, A.R.; Cajas-Flores, J.M. Feeding ecology of the Patagonian toothfish, Dissostichus eleginoides, in Ecuadorian waters. Mar. Ecol. 2024, 45, e12811. [Google Scholar] [CrossRef]
  29. Viswambharan, D. Biology and Stock Delineation of Razor Moonfish, Mene maculata Along the Konkan Malabar Coast of India. Ph.D. Thesis, Central Instituteof Fisheries Education, Mumbai, India, 2019. [Google Scholar]
  30. Zahid, A.; Rahardjo, M.F.; Syafei, L.S.; Susilowati, R. Ekologi Trofik Komunitas Ikan Di Perairan Segara Menyan Subang, Jawa Barat. ILMU KELAUTAN Indones. J. Mar. Sci. 2015, 20, 170–186. [Google Scholar] [CrossRef]
  31. Koepper, S.; Nuryati, S.; Palm, H.W.; Wild, C.; Yulianto, I.; Kleinertz, S. Metazoan endoparasite fauna and feeding ecology of commercial fishes from Java, Indonesia. Parasitol. Res. 2022, 121, 551–562. [Google Scholar] [CrossRef]
  32. Wootton, R.J.; Robert, J.W. Feeding. In Ecology of Teleost Fishes; Springer: Dordrecht, The Netherlands, 1990; pp. 32–72. [Google Scholar] [CrossRef]
  33. St John, J. Ontogenetic changes in the diet of the coral reef grouper Plectropomus leopardus (Serranidae): Patterns in taxa, size and habitat of prey. Mar. Ecol. Prog. Ser. 1999, 180, 233–246. [Google Scholar] [CrossRef]
  34. Graham, B.S.; Grubbs, D.; Holland, K.; Popp, B.N. A rapid ontogenetic shift in the diet of juvenile yellowfin tuna from Hawaii. Mar. Biol. 2006, 150, 647–658. [Google Scholar] [CrossRef]
  35. Choi, S.H.; Suk, H.Y. The mechanisms leading to ontogenetic diet shift in a microcanivore, Pterogobius elapoides (Gobiidae). Anim. Cells Syst. 2012, 16, 343–349. [Google Scholar] [CrossRef]
  36. Costalago, D.; Navarro, J.; Álvarez-Calleja, I.; Palomera, I. Ontogenetic and seasonal changes in the feeding habits and trophic levels of two small pelagic fish species. Mar. Ecol. Prog. Ser. 2012, 460, 169–181. [Google Scholar] [CrossRef]
  37. Sánchez-Hernández, J.; Nunn, A.D.; Adams, C.E.; Amundsen, P.A. Causes and consequences of ontogenetic dietary shifts: A global synthesis using fish models. Biol. Rev. 2019, 94, 539–554. [Google Scholar] [CrossRef]
  38. Dolgov, A.V. The role of capelin (Mallotus villosus) in the foodweb of the Barents Sea. ICES J. Mar. Sci. 2002, 59, 1034–1045. [Google Scholar] [CrossRef]
  39. Troccoli, G.H.; Aguilar, E.; Martínez, P.A.; Belleggia, M. The diet of the Patagonian toothfish Dissostichus eleginoides, a deep-sea top predator off Southwest Atlantic Ocean. Polar Biol. 2020, 43, 1595–1604. [Google Scholar] [CrossRef]
  40. Mohamed, K.S.; Zacharia, P.U.; Muthiah, C.; Abdurahiman, K.P.; Nayak, T.H. Trophic modelling of the Arabian Sea ecosystem off Karnataka and simulation of fishery yields. Bull. Cent. Mar. Fish. Res. Inst. 2008, 51, 140. [Google Scholar]
  41. Ghosh, S.; Vase, V.K. Reproductive and Feeding Biology of Goldspotted Grenadier Anchovy, Coilia dussumieri Off Saurashtra Coast, Northern Arabian Sea. Thalass. Int. J. Mar. Sci. 2023, 39, 157–168. [Google Scholar] [CrossRef]
  42. Anulekshmi, C.; Nakhawa, A.D.; Azeez, P.A.; Akhilesh, K.V.; Bhendekar, S.; Khandagle, P.A.; Zacharia, P.U.; Shubhadeep, G.; Rohit, P. Biology of the Bombayduck Harpadon nehereus (Hamilton 1822) from the north-eastern Arabian Sea, India: Biology of Bombay duck in north eastern Arabian Sea. Indian J. Fish. 2024, 71, 70–81. [Google Scholar] [CrossRef]
  43. Murillo, C.; Oyarzún, C.; Fernández, I. Variación latitudinal y estacional en la dieta de Dissostichus eleginoides Smitt 1898 (Perciformes: Nototheniidae) en ambientes profundos de la costa centro-sur de Chile. Gayana 2008, 72, 94–101. [Google Scholar] [CrossRef]
  44. Suca, J.J.; Pringle, J.W.; Knorek, Z.R.; Hamilton, S.L.; Richardson, D.E.; Llopiz, J.K. Feeding dynamics of Northwest Atlantic small pelagic fishes. Prog. Oceanogr. 2018, 165, 52–62. [Google Scholar] [CrossRef]
  45. Cohen, D.L.; Beckley, L.E. Diet and prey selectivity of the mesopelagic lanternfish Myctophum asperum from the Perth Canyon, Western Australia. Jpn. J. Ichthyol. 2021, 68, 294–302. [Google Scholar] [CrossRef]
  46. Chiou, W.D.; Wu, C.C.; Cheng, L.Z. Spatiotemporal distribution of sergestid shrimp Acetes intermedius in the coastal waters of southwestern Taiwan. Fish. Sci. 2000, 66, 1014–1025. [Google Scholar] [CrossRef]
  47. Chiou, W.D.; Lee, L.K. Migration of kawakawa Euthynnus affinis in the waters near Taiwan. Fish. Sci. 2004, 70, 746–757. [Google Scholar] [CrossRef]
  48. Chiou, W.D.; Hsiao, Y.W. Food items of skinnycheek lantern fish (Benthosema pterotum) in the coastal waters off southwestern Taiwan. J. Fish. Soc. Taiwan 2021, 48, 211–226. [Google Scholar] [CrossRef]
  49. Hsieh, H.Y.; Lo, W.T.; Liao, C.C.; Meng, P.J. Shifts in the assemblage of summer mesopelagic fish larvae in the Gaoping waters of southwestern Taiwan: A comparison between El Niño events and regular years. J. Mar. Sci. Eng. 2021, 9, 1065. [Google Scholar] [CrossRef]
  50. Weng, J.S.; Lee, M.A.; Liu, K.M.; Hsu, M.S.; Hung, M.K.; Wu, L.J. Feeding ecology of juvenile yellowfin tuna from waters southwest of Taiwan inferred from stomach contents and stable isotope analysis. Mar. Coast. Fish. 2015, 7, 537–548. [Google Scholar] [CrossRef]
  51. Chang, Y.C.; Chiang, W.C.; Madigan, D.J.; Tsai, F.Y.; Chiang, C.L.; Hsu, H.H.; Lin, S.M.; Zhuang, M.Y.; Sun, C.T.; Chen, L.C.; et al. Trophic dynamics and feeding ecology of skipjack tuna (Katsuwonus pelamis) off Eastern and Western Taiwan. Molecules 2022, 27, 1073. [Google Scholar] [CrossRef]
  52. Chiou, W.D.; Chen, C.Y.; Wang, C.M.; Chen, C.T. Food and feeding habits of ribbonfish Trichiurus lepturus in coastal waters of south-western Taiwan. Fish. Sci. 2006, 72, 373–381. [Google Scholar] [CrossRef]
Figure 1. Image of Mene maculata. Scale: 5 cm.
Fishes 10 00182 g001
Figure 2. Sampling locations in waters of southwestern Taiwan, Western Pacific Ocean. Gray-shaded area: Tainan City; grid-shaded area: Kaohsiung City.
Fishes 10 00182 g002
Figure 3. Fork length (FL)–weight (BW) relationship for moonfish specimens collected in southwestern waters of Taiwan, Western Pacific Ocean: (a) all specimens; (b) male specimens; (c) female specimens.
Fishes 10 00182 g003
Figure 4. Dendrogram depicting prey-specific index of relative importance (%PSIRI) value of (a) each prey item; and (b) seven prey categories in moonfish diet across sampling months and locations. F: fish; Z: zooplankton.
Fishes 10 00182 g004
Figure 5. Variations in dietary composition across five size classes based on the fork length of moonfish: (a) each prey item, (b) seven prey categories. %PSIRI: prey-specific index of relative importance; F: fish; Z: zooplankton.
Fishes 10 00182 g005
Table 1. Date and location of specimen collection, total number of specimens in collection (N), percentage of empty stomachs (ES%), total number of specimens for determining sex (Ns), and total number of specimens for analyzed stomach contents (Nf).
Date (2023)LocationNES%NsNf
1/1TN15906663
2/17TN133805050
3/1TN1301005048
4/3TN15673.335535
5/5TN811003030
8/21TN15947.624242
11/7TN16083.333030
Total 97863.09323298
4/27KH7070.597070
5/11, 5/17KH7787.57272
6/13KH13383.333030
7/13KH7088.574070
9/20KH771004377
10/11KH621003232
Total 48988.03287351
TN: Tainan City; KH: Kaohsiung City.
Disclaimer/Publisher’s Note: The statements, opinions and data contained in all publications are solely those of the individual author(s) and contributor(s) and not of MDPI and/or the editor(s). MDPI and/or the editor(s) disclaim responsibility for any injury to people or property resulting from any ideas, methods, instructions or products referred to in the content.

