
Mitogenomic and Phylogenetic Analyses of Lysmata lipkei (Crustacea: Decapoda: Lysmatidae)


Abstract
1. Introduction
2. Materials and Methods
2.1. Sampling, Identification, and DNA Extraction
2.2. Mitogenome Annotation and Analysis
2.3. Phylogenetic Tree Reconstruction
3. Results
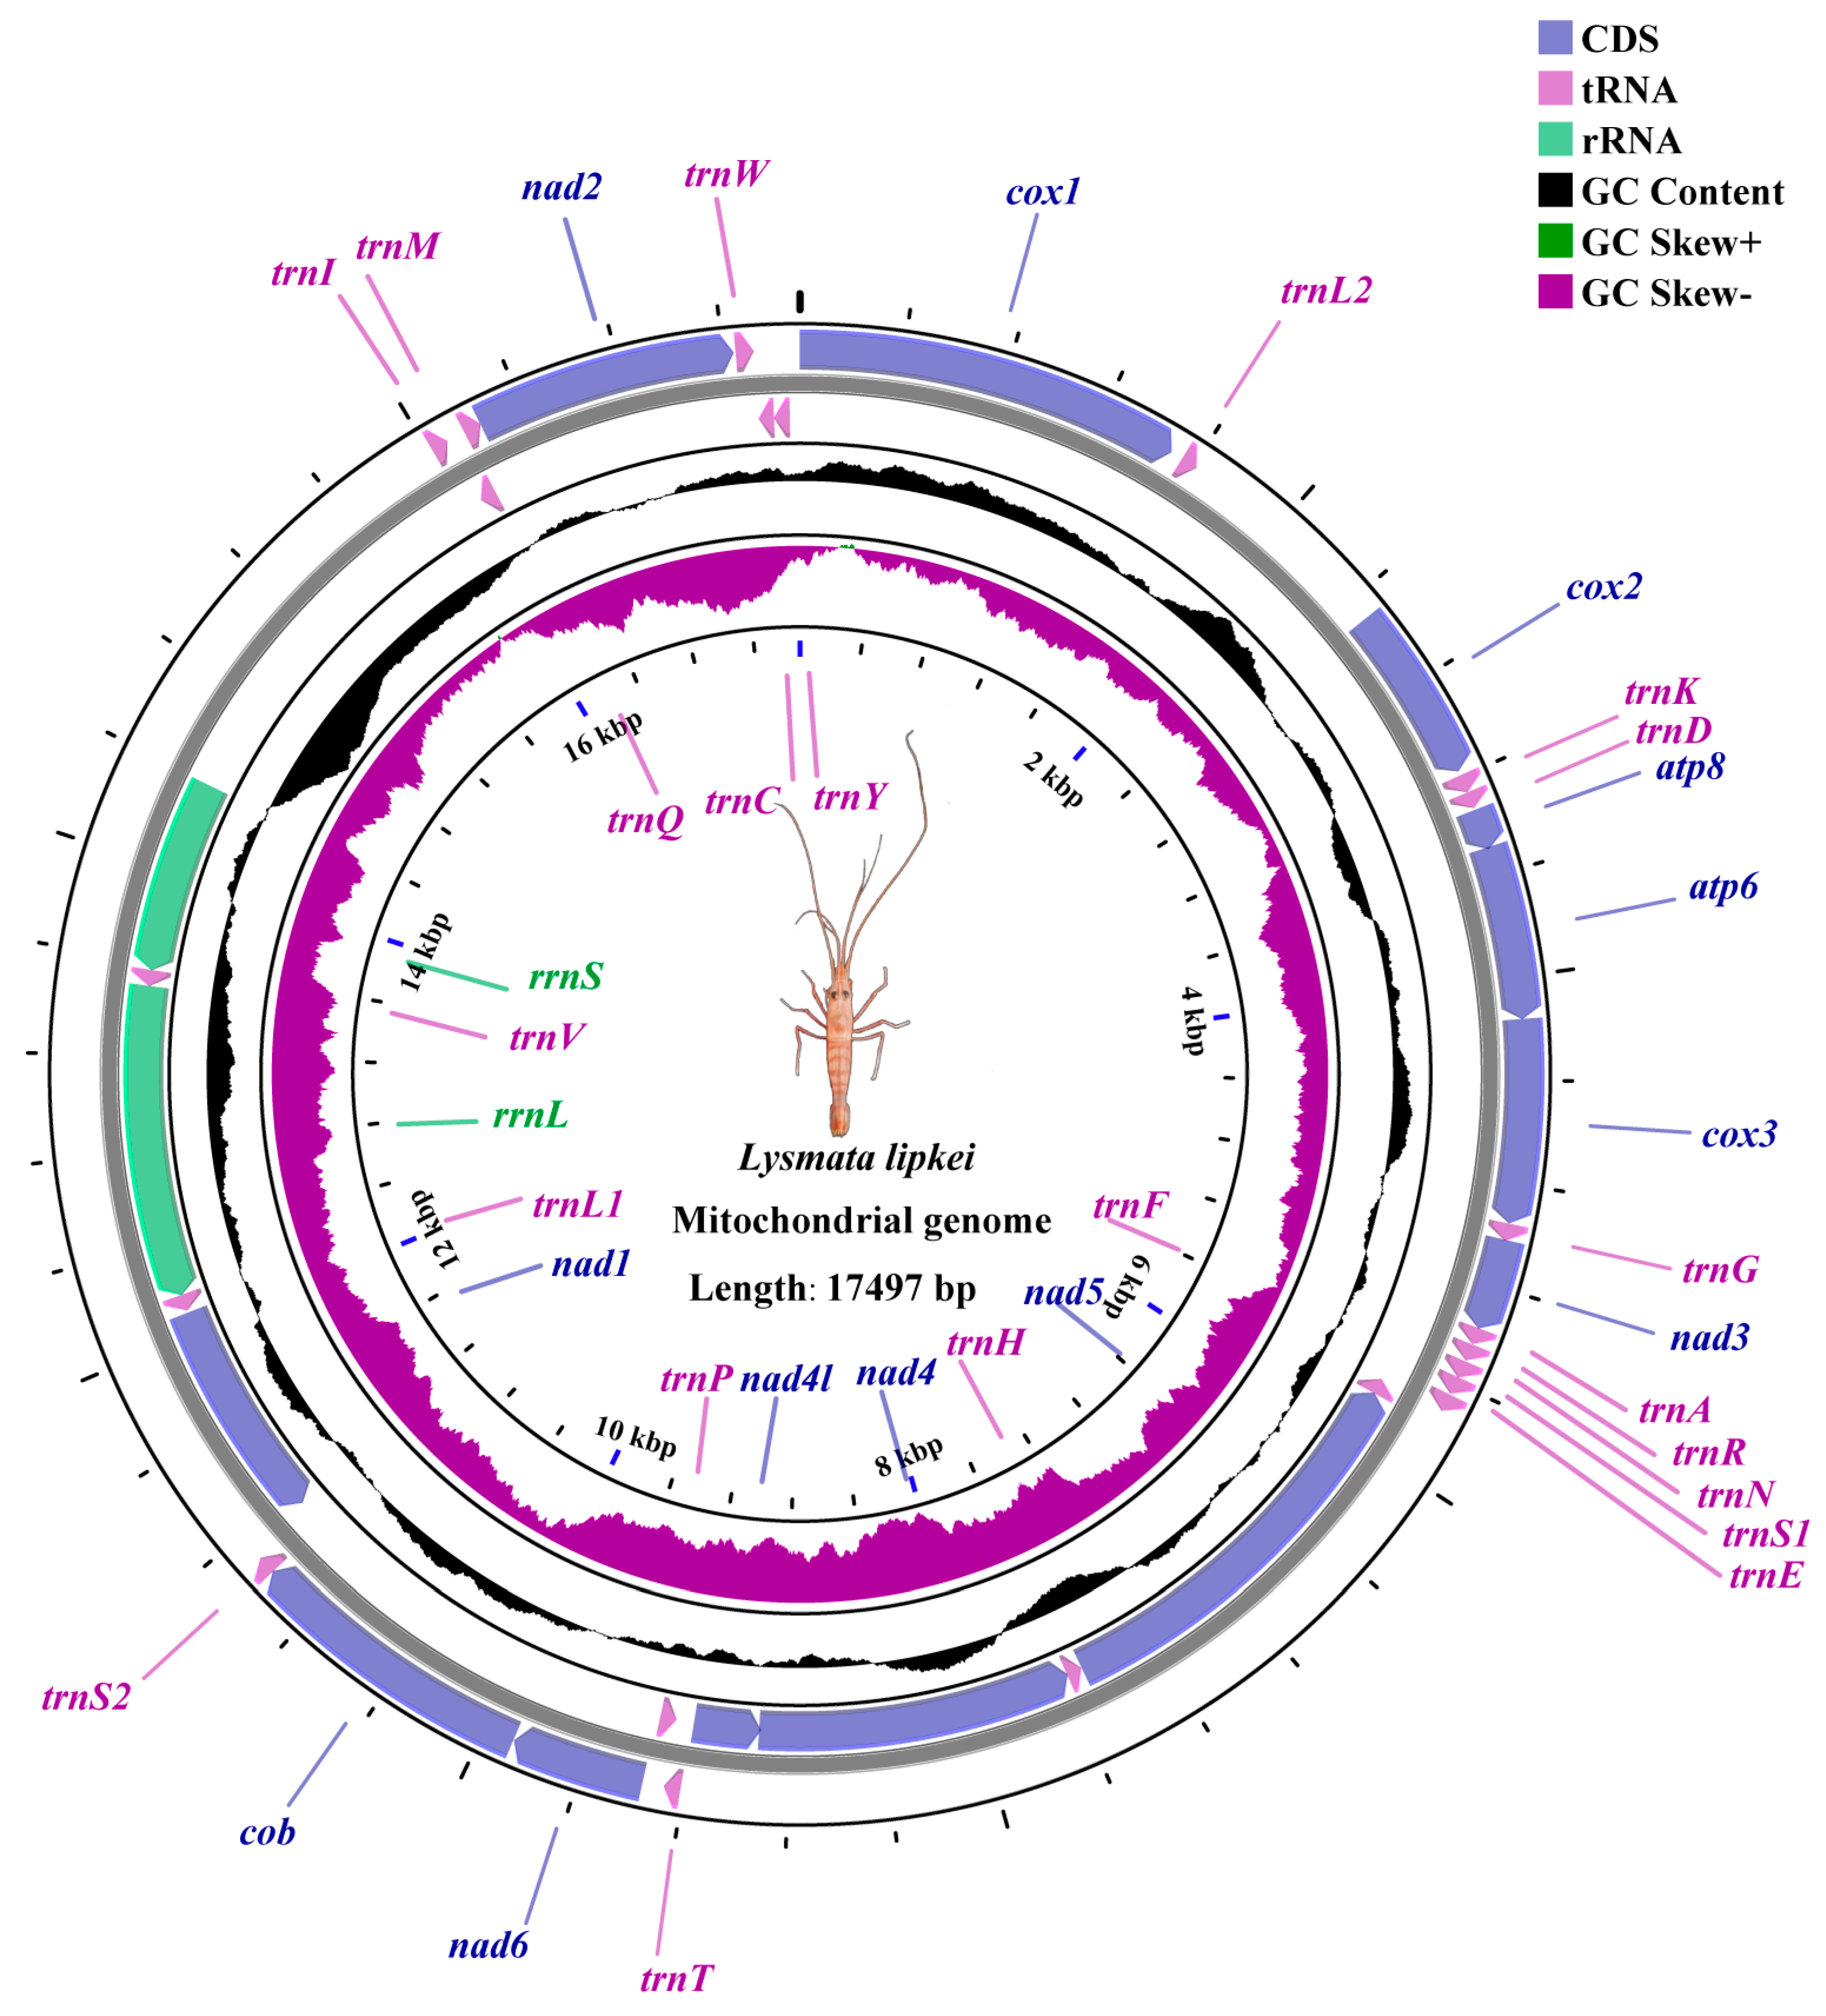
3.1. Mitogenome Structure and Composition
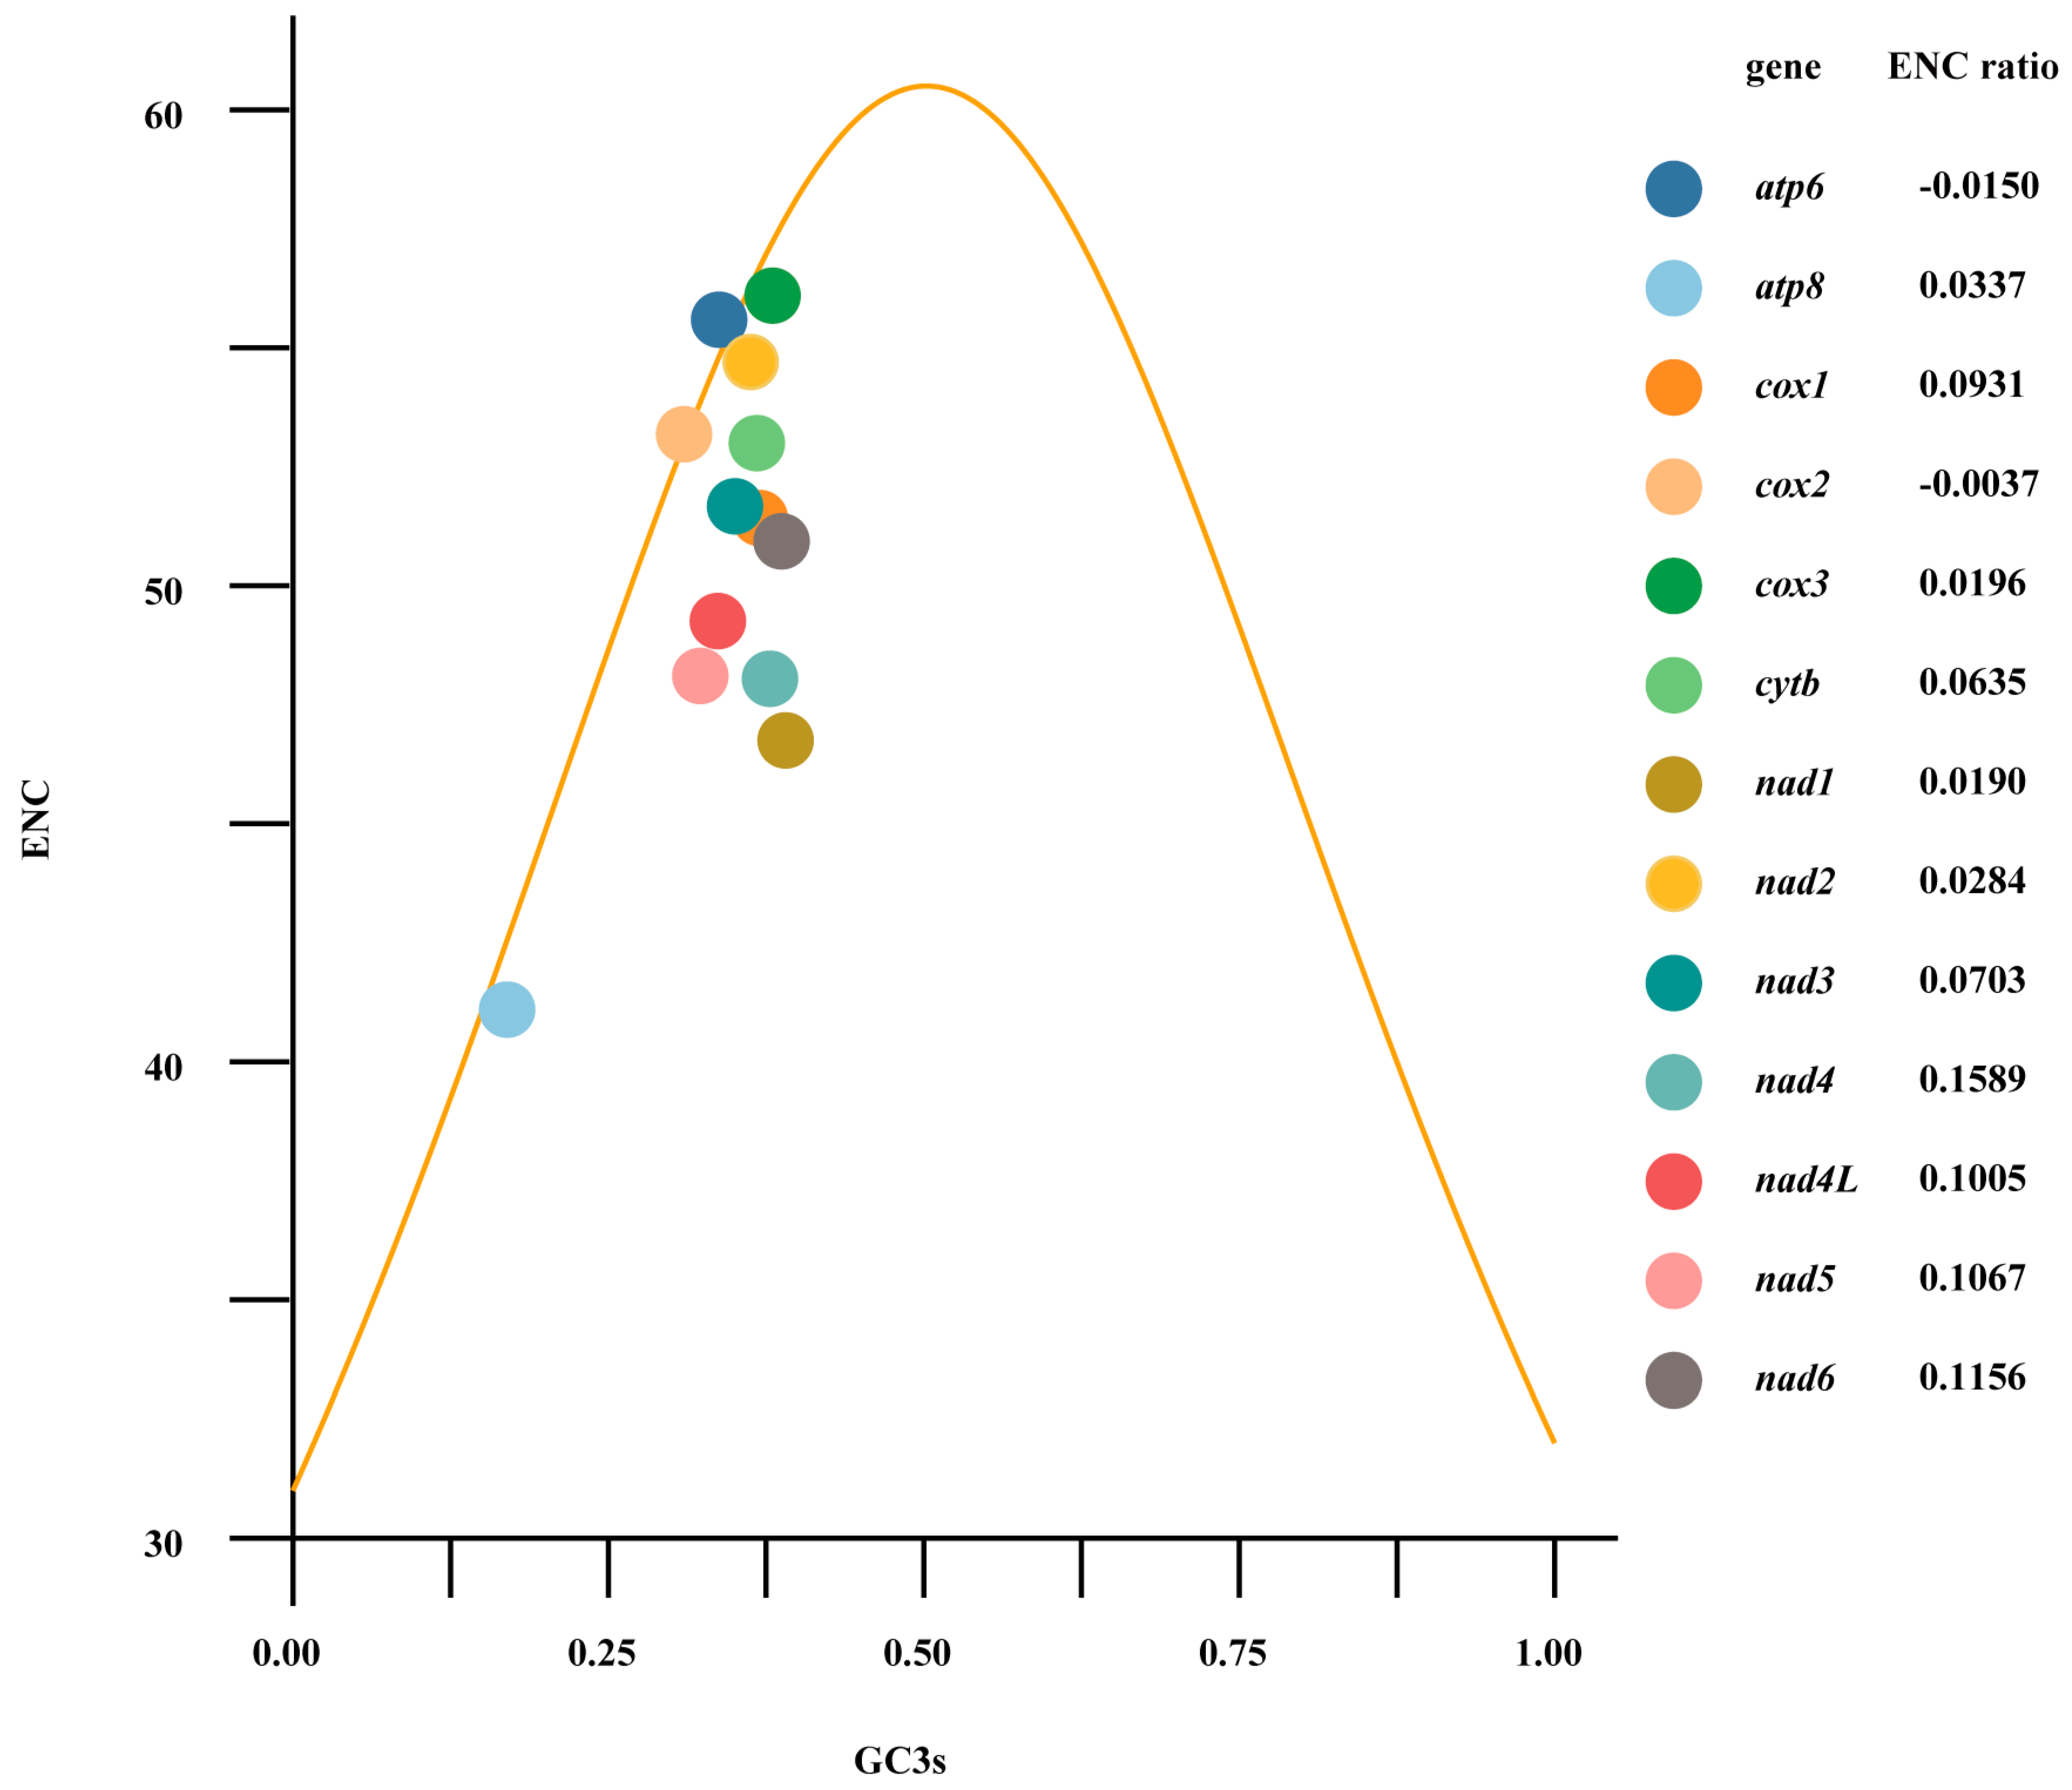
3.2. Protein Coding Genes
3.3. Transfer RNAs and Ribosomal RNAs
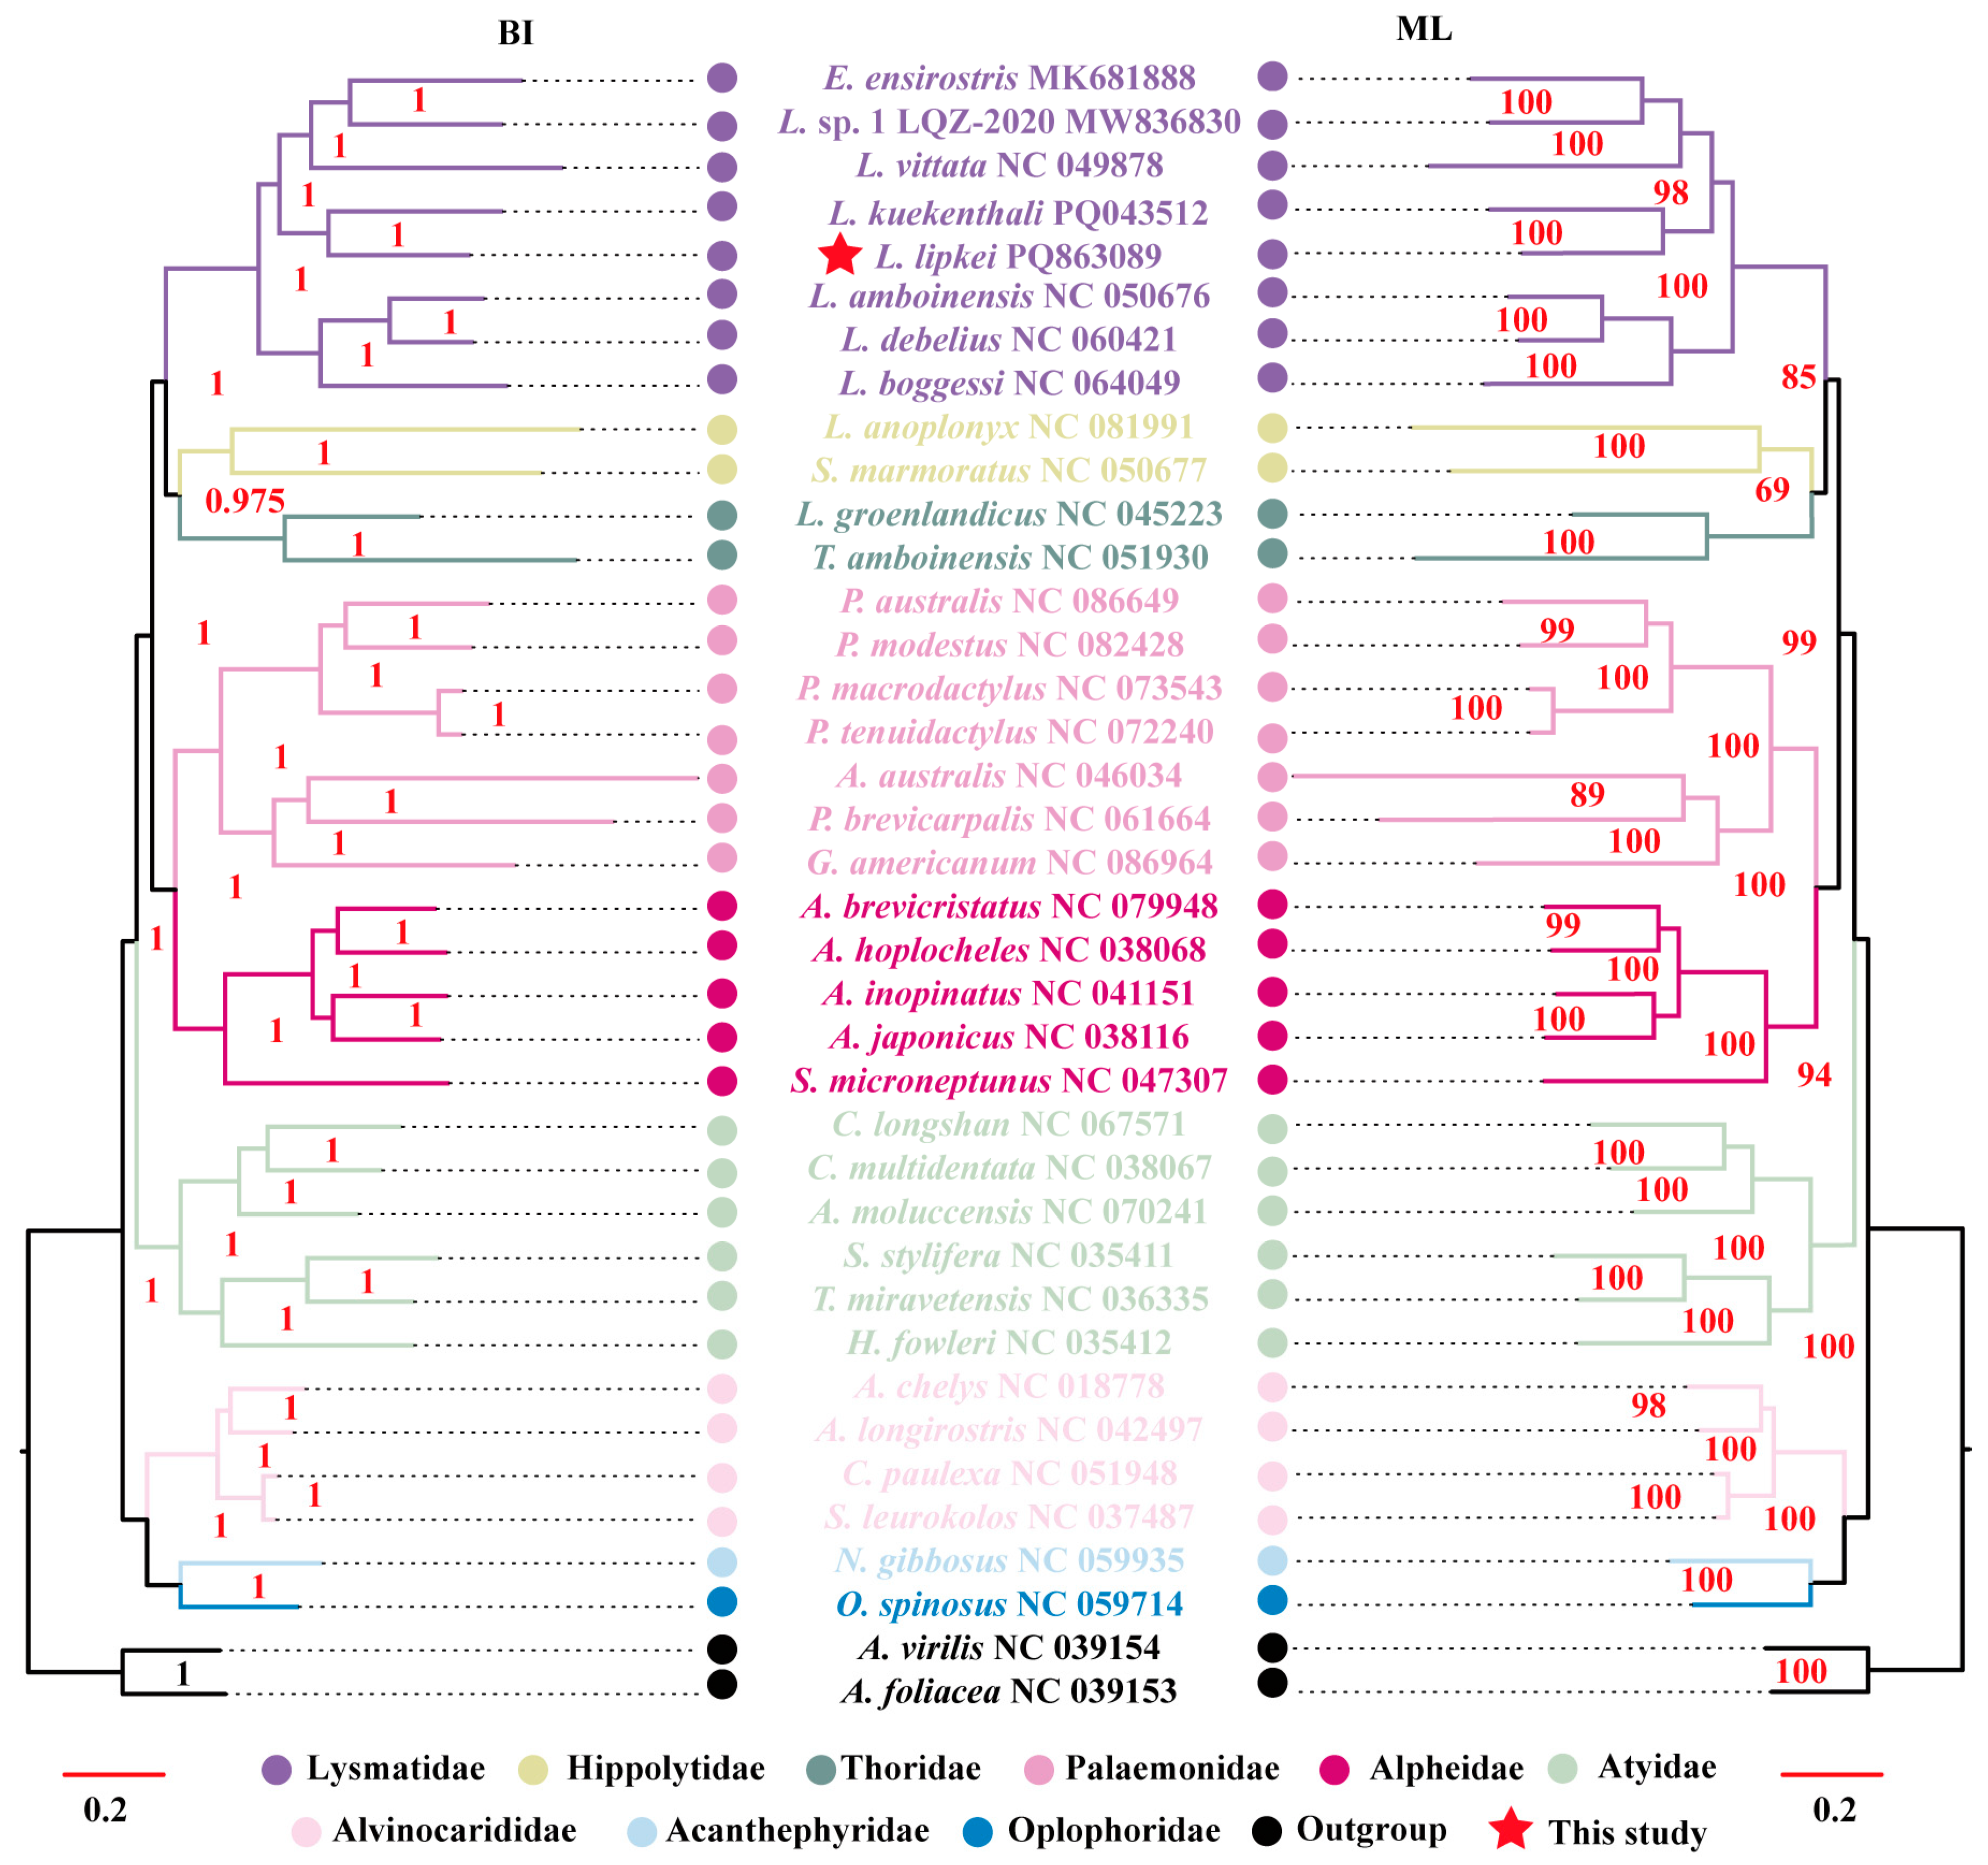
3.4. Phylogenetic Relationships
4. Discussion
4.1. Mitogenome
4.2. Phylogenetic Analysis
5. Conclusions
Author Contributions
Funding
Institutional Review Board Statement
Informed Consent Statement
Data Availability Statement
Acknowledgments
Conflicts of Interest
References
- Yang, H.J.; Kim, C.H. Zoeal Stages of Lysmata vittata (Decapoda: Caridea: Hippolytidae) Reared in the Laboratory. Anim. Syst. Evol. Divers. 2010, 26, 261–278. [Google Scholar] [CrossRef]
- Santos, R.D.C.; Alves, D.F.R.; Carvalho-Batista, A. Shrimps of Genus Lysmata Risso, 1816 (Caridea: Lysmatidae) from Queimada Grande Island Region, Southeastern Brazil. Nauplius 2021, 29, e2021032. [Google Scholar] [CrossRef]
- Choi, J.Y.; Choe, J.R.; Koh, J.; Choi, C.Y. Effects of Specific Light Wavelengths on Osmotic Stress in the Ornamental Cleaner Shrimp Lysmata amboinensis (De Man, 1888) (Decapoda: Caridea: Lysmatidae). J. Crustac. Biol. 2018, 38, 475–482. [Google Scholar] [CrossRef]
- De Grave, S.; Fransen, C. Carideorum Catalogus: The Recent Species of the Dendrobranchiate, Stenopodidean, Procarididean and Caridean Shrimps (Crustacea: Decapoda). Zool. Meded. Leiden. 2011, 89, 195–589. [Google Scholar]
- Zhu, L.; Zhu, Z.; Zhu, L.; Wang, D.; Wang, J.; Lin, Q. The Complete Mitogenome of Lysmata vittata (Crustacea: Decapoda: Hippolytidae) with Implication of Phylogenomics and Population Genetics. PLoS ONE 2021, 16, e0255547. [Google Scholar] [CrossRef]
- Bernt, M.; Braband, A.; Schierwater, B.; Stadler, P.F. Genetic Aspects of Mitochondrial Genome Evolution. Mol. Phylogenetics Evol. 2013, 69, 328–338. [Google Scholar] [CrossRef] [PubMed]
- Pang, X.; Han, C.; Guo, B.; Liu, K.; Lin, X.; Lu, X. The First Complete Mitochondrial Genome of Eucrate crenata (Decapoda: Brachyura: Goneplacidae) and Phylogenetic Relationships within Infraorder Brachyura. Genes 2022, 13, 1127. [Google Scholar] [CrossRef]
- Lü, J.; Xia, L.; Liu, X.; Ma, Y.; Li, J.; Ye, Y.; Guo, B. The Mitochondrial Genome of Grapsus albolineatus (Decapoda: Brachyura: Grapsidae) and Phylogenetic Associations in Brachyura. Sci. Rep. 2022, 12, 2104. [Google Scholar] [CrossRef]
- Tan, M.H.; Gan, H.M.; Lee, Y.P.; Poore, G.C.B.; Austin, C.M. Digging Deeper: New Gene Order Rearrangements and Distinct Patterns of Codons Usage in Mitochondrial Genomes among Shrimps from the Axiidea, Gebiidea and Caridea (Crustacea: Decapoda). PeerJ 2017, 5, e2982. [Google Scholar] [CrossRef]
- Sun, S.; Sha, Z.; Wang, Y. Mitochondrial Phylogenomics Reveal the Origin and Adaptive Evolution of the Deep-Sea Caridean Shrimps (Decapoda: Caridea). J. Oceanol. Limnol. 2021, 39, 1948–1960. [Google Scholar] [CrossRef]
- Christoffersen, M.L. Phylogenetic Relationships of Hippolytid Genera, with an Assignment of New Families for the Crangonoidea and Alpheoidea (Crustacea, Decapoda, Caridea). Cladistics 1987, 3, 348–362. [Google Scholar] [CrossRef]
- De Grave, S.; Li, C.P.; Tsang, L.M.; Chu, K.H.; Chan, T.-Y. Unweaving Hippolytoid Systematics (Crustacea, Decapoda, Hippolytidae): Resurrection of Several Families. Zool. Scr. 2014, 43, 496–507. [Google Scholar] [CrossRef]
- Pachelle, P.P.G.; Carvalho, L.; Alves, D.F.R.; Anker, A. A Revision of the Brazilian Species of Lysmata Risso, 1816 (Decapoda: Caridea: Lysmatidae), with Discussion of the Morphological Characters Used in Their Identification. Zootaxa 2020, 4789, 55–90. [Google Scholar] [CrossRef] [PubMed]
- Alves, D.F.R.; Lima, D.J.M.; Hirose, G.L.; Martinez, P.A.; Dolabella, S.S.; De Paiva Barros-Alves, S. Morphological and Molecular Analyses Confirm the Occurrence of Two Sympatric Lysmata Shrimp (Crustacea, Decapoda) in the Southwestern Atlantic. Zootaxa 2018, 4526, 41–55. [Google Scholar] [CrossRef] [PubMed]
- Ashrafi, H.; Baeza, J.A.; Ďuriš, Z. The Caridean Shrimps of the Genus Lysmata Risso, 1816 (Decapoda: Lysmatidae) from Madagascar Collected During the Atimo-Vatae Expedition: A New Species and Two New Records. Eur. J. Taxon. 2021, 774, 155–177. [Google Scholar] [CrossRef]
- Okuno, J.; Fiedler, G.C. Lysmata Lipkei, a New Species of Peppermint Shrimp (Decapoda, Hippolytidae) from Warm Temperate and Subtropical Waters of Japan. In Crustaceana Monograph; Brill: Leiden, The Netherlands, 2010; pp. 597–610. [Google Scholar]
- Aguilar, R.; Prakash, S.; Ogburn, M.B.; Lohan, K.M.P.; MacDonald, K.S.; Driskell, A.C.; Ahyong, S.T.; Leray, M.; McIlroy, S.E.; Tuckey, T.D.; et al. Unresolved Taxonomy Confounds Invasive Species Identification: The Lysmata vittata Stimpson, 1860 (Decapoda: Caridea: Lysmatidae) Species Complex and Recent Introduction of Lysmata vittata Sensu Stricto in the Western Atlantic. J. Crustac. Biol. 2022, 42, ruab079. [Google Scholar] [CrossRef]
- Ye, Y.; Miao, J.; Guo, Y.; Gong, L.; Jiang, L.; Lü, Z.; Xu, K.; Guo, B. The First Mitochondrial Genome of the Genus Exhippolysmata (Decapoda: Caridea: Lysmatidae), with Gene Rearrangements and Phylogenetic Associations in Caridea. Sci. Rep. 2021, 11, 14446. [Google Scholar] [CrossRef]
- Wang, Y.; Zeng, L.; Wen, J.; Li, X.; Huang, Y.; Sun, Y.; Zhao, J. Characterization of the Complete Mitochondrial Genome of Lysmata amboinensis (Hippolytidae, Decapoda) and Its Phylogenetic Analysis. Mitochondrial DNA Part B 2020, 5, 3851–3853. [Google Scholar] [CrossRef]
- Chen, J.; Xian, C.; Luo, Y.; Lin, M. Characterization of the Complete Mitochondrial Genome of Lysmata debelius (Decapoda: Hippolytidae). Mitochondrial DNA Part B 2021, 6, 2099–2101. [Google Scholar] [CrossRef]
- Chen, J.; Xian, C.; Luo, Y.; Lin, M. Characterization of the Complete Mitochondrial Genome of Lysmata vittata (Decapoda: Hippolytidae). Mitochondrial DNA Part B 2021, 6, 1718–1720. [Google Scholar] [CrossRef]
- Epps, M.T.; Nguyen, R.T.; Samborski, K.L.; Bogantes, V.E.; Janosik, A.M. The Complete Mitochondrial Genome of the Peppermint Shrimp Lysmata wurdemanni (Decapoda: Lysmatidae). Mitochondrial DNA B Resour. 2021, 6, 1964–1965. [Google Scholar] [CrossRef] [PubMed]
- Cronin, T.J.; Jones, S.J.M.; Baeza, J.A. The Complete Mitochondrial Genome of the Spot Prawn, Pandalus platyceros Brandt in von Middendorf, 1851 (Decapoda: Caridea: Pandalidae), Assembled from Linked-Reads Sequencing. J. Crustac. Biol. 2022, 42, ruac003. [Google Scholar] [CrossRef]
- Sun, Y.; Chen, J.; Liang, X.; Li, J.; Ye, Y.; Xu, K. Sequence Comparison of the Mitochondrial Genomes of Plesionika Species (Caridea: Pandalidae), Gene Rearrangement and Phylogenetic Relationships of Caridea. PeerJ 2024, 12, e17314. [Google Scholar] [CrossRef] [PubMed]
- Vinagre, C.; Mendonça, V.; Flores, A.A.V.; Baeta, A.; Marques, J.C. Complex Food Webs of Tropical Intertidal Rocky Shores (SE Brazil)—An Isotopic Perspective. Ecol. Indic. 2018, 95, 485–491. [Google Scholar] [CrossRef]
- Pachelle, P.P.G.; Anker, A.; Mendes, C.B.; Bezerra, L.E.A. Decapod Crustaceans from the State of Ceará, Northeastern Brazil: An Updated Checklist of Marine and Estuarine Species, with 23 New Records. Zootaxa 2016, 4131, 1–63. [Google Scholar] [CrossRef]
- Bankevich, A.; Nurk, S.; Antipov, D.; Gurevich, A.A.; Dvorkin, M.; Kulikov, A.S.; Lesin, V.M.; Nikolenko, S.I.; Pham, S.; Prjibelski, A.D.; et al. SPAdes: A New Genome Assembly Algorithm and Its Applications to Single-Cell Sequencing. J. Comput. Biol. 2012, 19, 455–477. [Google Scholar] [CrossRef]
- Li, H. Minimap2: Pairwise Alignment for Nucleotide Sequences. Bioinformatics 2018, 34, 3094–3100. [Google Scholar] [CrossRef]
- Danecek, P.; Bonfield, J.K.; Liddle, J.; Marshall, J.; Ohan, V.; Pollard, M.O.; Whitwham, A.; Keane, T.; McCarthy, S.A.; Davies, R.M.; et al. Twelve Years of SAMtools and BCFtools. Gigascience 2021, 10, giab008. [Google Scholar] [CrossRef]
- Koren, S.; Walenz, B.P.; Berlin, K.; Miller, J.R.; Bergman, N.H.; Phillippy, A.M. Canu: Scalable and Accurate Long-Read Assembly via Adaptive k-Mer Weighting and Repeat Separation. Genome Res. 2017, 27, 722–736. [Google Scholar] [CrossRef]
- Walker, B.J.; Abeel, T.; Shea, T.; Priest, M.; Abouelliel, A.; Sakthikumar, S.; Cuomo, C.A.; Zeng, Q.; Wortman, J.; Young, S.K.; et al. Pilon: An Integrated Tool for Comprehensive Microbial Variant Detection and Genome Assembly Improvement. PLoS ONE 2014, 9, e112963. [Google Scholar] [CrossRef]
- Bernt, M.; Donath, A.; Jühling, F.; Externbrink, F.; Florentz, C.; Fritzsch, G.; Pütz, J.; Middendorf, M.; Stadler, P.F. MITOS: Improved de Novo Metazoan Mitochondrial Genome Annotation. Mol. Phylogenetics Evol. 2013, 69, 313–319. [Google Scholar] [CrossRef]
- Grant, J.R.; Stothard, P. The CGView Server: A Comparative Genomics Tool for Circular Genomes. Nucleic Acids Res. 2008, 36, W181–W184. [Google Scholar] [CrossRef] [PubMed]
- Kumar, S.; Stecher, G.; Li, M.; Knyaz, C.; Tamura, K. MEGA X: Molecular Evolutionary Genetics Analysis across Computing Platforms. Mol. Biol. Evol. 2018, 35, 1547–1549. [Google Scholar] [CrossRef]
- Rice, P.; Longden, L.; Bleasby, A. EMBOSS: The European Molecular Biology Open Software Suite. Trends Genet. 2000, 16, 276–277. [Google Scholar] [CrossRef] [PubMed]
- Chan, P.P.; Lin, B.Y.; Mak, A.J.; Lowe, T.M. tRNAscan-SE 2.0: Improved Detection and Functional Classification of Transfer RNA Genes. Nucleic Acids Res. 2021, 49, 9077–9096. [Google Scholar] [CrossRef] [PubMed]
- Zhang, D.; Gao, F.; Jakovlić, I.; Zou, H.; Zhang, J.; Li, W.X.; Wang, G.T. PhyloSuite: An Integrated and Scalable Desktop Platform for Streamlined Molecular Sequence Data Management and Evolutionary Phylogenetics Studies. Mol. Ecol. Resour. 2020, 20, 348–355. [Google Scholar] [CrossRef]
- Katoh, K.; Standley, D.M. MAFFT Multiple Sequence Alignment Software Version 7: Improvements in Performance and Usability. Mol. Biol. Evol. 2013, 30, 772–780. [Google Scholar] [CrossRef]
- Talavera, G.; Castresana, J. Improvement of Phylogenies after Removing Divergent and Ambiguously Aligned Blocks from Protein Sequence Alignments. Syst. Biol. 2007, 56, 564–577. [Google Scholar] [CrossRef]
- Nguyen, L.-T.; Schmidt, H.A.; von Haeseler, A.; Minh, B.Q. IQ-TREE: A Fast and Effective Stochastic Algorithm for Estimating Maximum-Likelihood Phylogenies. Mol. Biol. Evol. 2015, 32, 268–274. [Google Scholar] [CrossRef]
- Kalyaanamoorthy, S.; Minh, B.Q.; Wong, T.K.; von Haeseler, A.; Jermiin, L.S. ModelFinder: Fast Model Selection for Accurate Phylogenetic Estimates. Nat. Methods 2017, 14, 587–589. [Google Scholar] [CrossRef]
- Ronquist, F.; Teslenko, M.; van der Mark, P.; Ayres, D.L.; Darling, A.; Höhna, S.; Larget, B.; Liu, L.; Suchard, M.A.; Huelsenbeck, J.P. MrBayes 3.2: Efficient Bayesian Phylogenetic Inference and Model Choice Across a Large Model Space. Syst. Biol. 2012, 61, 539–542. [Google Scholar] [CrossRef] [PubMed]
- Yuan, C.; Shi, W.; Dong, Y.; Li, Y.; Xu, Q. The First Complete Mitochondrial Genome of Notostomus gibbosus (Caridea, Acanthephyridae). Mitochondrial DNA B Resour. 2021, 6, 2050–2051. [Google Scholar] [CrossRef] [PubMed]
- Zhong, S.; Zhao, Y.; Zhang, Q. The Complete Mitochondrial Genome of Alpheus hoplocheles (Decapoda: Alpheidae). Mitochondrial DNA Part B 2019, 4, 189–190. [Google Scholar] [CrossRef]
- Shen, X.; Li, X.; Sha, Z.; Yan, B.; Xu, Q. Complete Mitochondrial Genome of the Japanese Snapping Shrimp Alpheus japonicus (Crustacea: Decapoda: Caridea): Gene Rearrangement and Phylogeny within Caridea. Sci. China Life Sci. 2012, 55, 591–598. [Google Scholar] [CrossRef]
- Chak, S.T.C.; Barden, P.; Baeza, J.A. The Complete Mitochondrial Genome of the Eusocial Sponge-Dwelling Snapping Shrimp Synalpheus microneptunus. Sci. Rep. 2020, 10, 7744. [Google Scholar] [CrossRef] [PubMed]
- Yang, C.-H.; Tsang, L.M.; Chu, K.H.; Chan, T.-Y. Complete Mitogenome of the Deep-Sea Hydrothermal Vent Shrimp Alvinocaris Chelys Komai and Chan, 2010 (Decapoda: Caridea: Alvinocarididae). Mitochondrial DNA 2012, 23, 417–419. [Google Scholar] [CrossRef]
- Sun, S.; Hui, M.; Wang, M.; Sha, Z. The Complete Mitochondrial Genome of the Alvinocaridid Shrimp Shinkaicaris leurokolos (Decapoda, Caridea): Insight into the Mitochondrial Genetic Basis of Deep-Sea Hydrothermal Vent Adaptation in the Shrimp. Comp. Biochem. Physiol. Part D Genom. Proteom. 2018, 25, 42–52. [Google Scholar] [CrossRef]
- Jurado-Rivera, J.A.; Jaume, D.; Juan, C.; Pons, J. The Complete Mitochondrial Genome of the Cave Shrimp Typhlatya miravetensis (Decapoda, Atyidae) and Its Systematic Position. Mitochondrial DNA B Resour. 2016, 1, 847–848. [Google Scholar] [CrossRef]
- Wang, Z.; Wu, Q.; Guo, H.; Tang, D.; Bai, Y.; Wang, Z.; Tao, Y. Next-Generation Sequencing Yields the Complete Mitogenome of Caridina Multidentata and Phylogenetic Analysis. Mitochondrial DNA B Resour. 2018, 3, 68–70. [Google Scholar] [CrossRef]
- Peng, C.; Fan, S. The Complete Mitochondrial Genome of Bamboo Shrimp Atyopsis moluccensis (Atyidae, Decapoda). Mitochondrial DNA B Resour. 2024, 9, 808–811. [Google Scholar] [CrossRef]
- Wang, X.-T.; Shi, W.-G.; Li, Y.-X.; Zhang, X.-L.; Xu, Q.-Z. The Complete Mitochondrial Genome of Oplophorus spinosus (Brullé, 1839) (Caridea, Oplophoridae). Mitochondrial DNA B Resour. 2021, 6, 1597–1598. [Google Scholar] [CrossRef] [PubMed]
- Liu, H. Sequence and Phylogenetic Analysis of the Mitochondrial Genome for a Giant Clam Commensal Shrimp Anchistus australis (Decapoda: Caridea: Palaemonidae). Mitochondrial DNA Part B 2020, 5, 312–313. [Google Scholar] [CrossRef] [PubMed]
- Peng, C.; Fan, S.; Peng, P. Characterization of Complete Mitochondrial Genome of Periclimenes brevicarpalis (Decapoda: Palaemonidae). Mitochondrial DNA B Resour. 2024, 9, 1414–1417. [Google Scholar] [CrossRef] [PubMed]
- Sun, Y.; Chen, J.; Ye, Y.; Xu, K.; Li, J. Comparison of Mitochondrial Genome Sequences between Two Palaemon Species of the Family Palaemonidae (Decapoda: Caridea): Gene Rearrangement and Phylogenetic Implications. Genes 2023, 14, 1499. [Google Scholar] [CrossRef]
- Sung, C.H.; Cheng, C.C.; Huang, C.W.; Wang, L.J. Characterization and Phylogenetic Analysis of the First Complete Mitochondrial Genome of Gnathophyllum americanum (Guérin-Méneville, 1855) (Malacostraca: Decapoda: Palaemonidae). Fishes 2023, 8, 238. [Google Scholar] [CrossRef]
- Kim, J.; Choi, J.-P.; Kim, H.-S.; Jo, Y.; Min, W.G.; Yum, S.; Bhak, J. The Complete Mitochondrial Genome of a Dokdo Shrimp, Lebbeus groenlandicus. Mitochondrial DNA B Resour. 2019, 4, 4196–4197. [Google Scholar] [CrossRef]
- Wang, Y.; Zeng, L.; Wen, J.; Li, X.; Huang, Y.; Sun, Y.; Zhao, J. The Complete Mitochondrial Genome of Thor. Amboinensis (Hippolytidae, Decapoda). Mitochondrial DNA Part B 2020, 5, 3077–3078. [Google Scholar] [CrossRef]
- Sun, Y.; Liu, W.; Chen, J.; Li, J.; Ye, Y.; Xu, K. Sequence Comparison of the Mitochondrial Genomes of Five Caridean Shrimps of the Infraorder Caridea: Phylogenetic Implications and Divergence Time Estimation. BMC Genom. 2024, 25, 968. [Google Scholar] [CrossRef]
- Cheng, J.; Chan, T.; Zhang, N.; Sun, S.; Sha, Z. Mitochondrial Phylogenomics Reveals Insights into Taxonomy and Evolution of Penaeoidea (Crustacea: Decapoda). Zool. Scr. 2018, 47, 582–594. [Google Scholar] [CrossRef]
- Felsenstein, J. Confidence Limits on Phylogenies: An Approach Using the Bootstrap. Evolution 1985, 39, 783–791. [Google Scholar] [CrossRef]
- Hillis, D.M.; Bull, J.J. An Empirical Test of Bootstrapping as a Method for Assessing Confidence in Phylogenetic Analysis. Syst. Biol. 1993, 42, 182–192. [Google Scholar] [CrossRef]
- Golubenko, M.V.; Puzyrev, V.P. Liberties of the Genome: Insertions of Mitochondrial DNA Fragments into Nuclear Genome. Vavilovskii Zhurnal Genet. Sel. 2024, 28, 467–475. [Google Scholar] [CrossRef]
- Tan, B.G.; Gustafsson, C.M.; Falkenberg, M. Mechanisms and Regulation of Human Mitochondrial Transcription. Nat. Rev. Mol. Cell Biol. 2024, 25, 119–132. [Google Scholar] [CrossRef] [PubMed]
- Lozen, M.; Chen, Y.; Boisvert, R.; Schlacher, K. Mitochondrial Replication Assay (MIRA) for Efficient in Situ Quantification of Nascent mtDNA and Protein Interactions with Nascent mtDNA (mitoSIRF). Bio-Protocol 2023, 13, e4680. [Google Scholar] [CrossRef]
- Zhang, W.; Gan, T.; Xu, T.; Wang, P.; Tai, J.; Ma, F. Characterization of the Complete Mitochondrial Genome of Spirobolus grahami (Diplopoda: Spirobolidae) with Phylogenetic Analysis. Sci. Rep. 2024, 14, 7541. [Google Scholar] [CrossRef]
- Li, C.P.; De Grave, S.; Chan, T.-Y.; Lei, H.C.; Chu, K.H. Molecular Systematics of Caridean Shrimps Based on Five Nuclear Genes: Implications for Superfamily Classification. Zool. Anz. A J. Comp. Zool. 2011, 250, 270–279. [Google Scholar] [CrossRef]
- Wang, Q.; Wang, Z.; Tang, D.; Xu, X.; Tao, Y.; Ji, C.; Wang, Z. Characterization and Comparison of the Mitochondrial Genomes from Two Alpheidae Species and Insights into the Phylogeny of Caridea. Genomics 2020, 112, 65–70. [Google Scholar] [CrossRef]
- Ennis, C.C.; Haeffner, N.N.; Keyser, C.D.; Leonard, S.T.; Macdonald-Shedd, A.C.; Savoie, A.M.; Cronin, T.J.; Veldsman, W.P.; Barden, P.; Chak, S.T.C.; et al. Comparative Mitochondrial Genomics of Sponge-Dwelling Snapping Shrimps in the Genus Synalpheus: Exploring Differences between Eusocial and Non-Eusocial Species and Insights into Phylogenetic Relationships in Caridean Shrimps. Gene 2021, 786, 145624. [Google Scholar] [CrossRef]


| ID | Organism | Family | Length (bp) | AT (%) | Reference |
|---|---|---|---|---|---|
| NC 059935 | Notostomus gibbosus | Acanthephyridae | 17,590 | 60.3 | [43] |
| NC 038068 | Alpheus hoplocheles | Alpheidae | 15,735 | 60.6 | [44] |
| NC 038116 | Alpheus japonicus | Alpheidae | 16,619 | 65.1 | [45] |
| NC 041151 | Alpheus inopinatus | Alpheidae | 15,789 | 61.2 | |
| NC 047307 | Synalpheus microneptunus | Alpheidae | 15,603 | 64.6 | [46] |
| NC 079948 | Alpheus brevicristatus | Alpheidae | 15,705 | 62.6 | |
| NC 018778 | Alvinocaris chelys | Alvinocarididae | 15,910 | 63.4 | [47] |
| NC 037487 | Shinkaicaris leurokolos | Alvinocarididae | 15,903 | 65.9 | [48] |
| NC 042497 | Alvinocaris longirostris | Alvinocarididae | 16,022 | 62.2 | |
| NC 051948 | Chorocaris paulexa | Alvinocarididae | 15,909 | 65.7 | |
| NC 035411 | Stygiocaris stylifera | Atyidae | 15,812 | 66.3 | |
| NC 035412 | Halocaridinides fowleri | Atyidae | 15,977 | 64.3 | |
| NC 036335 | Typhlatya miravetensis | Atyidae | 15,865 | 66.2 | [49] |
| NC 038067 | Caridina multidentata | Atyidae | 15,825 | 63.4 | [50] |
| NC 067571 | Caridina longshan | Atyidae | 15,556 | 65.1 | |
| NC 070241 | Atyopsis moluccensis | Atyidae | 15,933 | 62.5 | [51] |
| MK681888 | Exhippolysmata ensirostris | Lysmatidae | 16,350 | 64.4 | [18] |
| MW836830 | Lysmata sp. 1 LQZ-2020 | Lysmatidae | 16,758 | 64.5 | |
| NC 049878 | Lysmata vittata | Lysmatidae | 22,003 | 71.5 | [21] |
| NC 050676 | Lysmata amboinensis | Lysmatidae | 16,735 | 64.1 | [19] |
| NC 060421 | Lysmata debelius | Lysmatidae | 16,757 | 67.1 | [20] |
| NC 064049 | Lysmata boggessi | Lysmatidae | 17,345 | 67.1 | [22] |
| PQ043512 | Lysmata kuekenthali | Lysmatidae | 17,540 | 69.0 | |
| PQ863089 | Lysmata lipkei | Lysmatidae | 17,497 | 63.4 | This study |
| NC 059714 | Oplophorus spinosus | Oplophoridae | 17,346 | 65.6 | [52] |
| NC 046034 | Anchistus australis | Palaemonidae | 15,396 | 68.4 | [53] |
| NC 061664 | Periclimenes brevicarpalis | Palaemonidae | 16,673 | 60.3 | [54] |
| NC 072240 | Palaemon tenuidactylus | Palaemonidae | 15,735 | 67.0 | [55] |
| NC 073543 | Palaemon macrodactylus | Palaemonidae | 15,744 | 68.1 | [55] |
| NC 082428 | Palaemon modestus | Palaemonidae | 15,734 | 67.6 | |
| NC 086649 | Palaemon australis | Palaemonidae | 15,905 | 64.9 | |
| NC 086964 | Gnathophyllum americanum | Palaemonidae | 15,842 | 66.3 | [56] |
| NC 045223 | Lebbeus groenlandicus | Thoridae | 17,399 | 64.8 | [57] |
| NC 051930 | Thor amboinensis | Thoridae | 15,553 | 73.1 | [58] |
| NC 081991 | Latreutes anoplonyx | Hippolytidae | 16,420 | 69.0 | [59] |
| NC 050677 | Saron marmoratus | Hippolytidae | 16,330 | 67.9 | [51] |
| NC 039154 | Aristeus virilis | Aristeidae | 15,936 | 64.6 | [60] |
| NC 039153 | Aristaeomorpha foliacea | Aristeidae | 15,926 | 66.0 | [60] |
| Regions | Size (bp) | T (%) | C (%) | A (%) | G (%) | AT (%) | GC (%) | AT Skew | GC Skew |
|---|---|---|---|---|---|---|---|---|---|
| Mitogenome | 17,497 | 31.4 | 22.2 | 32.0 | 14.4 | 63.4 | 36.6 | 0.008 | −0.213 |
| PCGs | 11,133 | 36.1 | 19.5 | 25.4 | 19.1 | 61.5 | 38.6 | −0.174 | −0.010 |
| tRNAs | 1475 | 32.8 | 15.7 | 33.2 | 18.3 | 66.0 | 34.0 | 0.006 | 0.078 |
| rRNAs | 2153 | 32.5 | 12.0 | 34.1 | 21.4 | 66.6 | 33.4 | 0.025 | 0.280 |
| Gene | Strand | Length (bp) | AT Skew | GC Skew | AT (%) | GC (%) | Start Codon | Stop Codon |
|---|---|---|---|---|---|---|---|---|
| atp6 | + | 675 | −0.117 | −0.262 | 61.1 | 39 | ATG | TAA |
| atp8 | + | 159 | −0.082 | −0.189 | 76.7 | 23.2 | ATA | TAA |
| cob | + | 1135 | −0.139 | −0.18 | 59 | 41 | ATG | T |
| cox1 | + | 1500 | −0.114 | −0.091 | 57.3 | 42.7 | ATT | TAA |
| cox2 | + | 687 | −0.071 | −0.124 | 61.2 | 38.8 | ATG | TAG |
| cox3 | + | 789 | −0.175 | −0.135 | 58.7 | 41.3 | ATG | TAA |
| nad1 | − | 945 | −0.233 | 0.251 | 61.3 | 38.7 | ATG | TAA |
| nad2 | + | 1017 | −0.147 | −0.317 | 60.9 | 39.2 | ATA | TAA |
| nad3 | + | 355 | −0.214 | −0.206 | 64.6 | 35.5 | ATA | T |
| nad4 | − | 1341 | −0.271 | 0.363 | 62.8 | 37.3 | ATG | TAG |
| nad4l | − | 285 | −0.253 | 0.359 | 63.9 | 36.2 | ATG | TAA |
| nad5 | − | 1728 | −0.187 | 0.256 | 64.4 | 35.7 | ATG | TAA |
| nad6 | + | 519 | −0.223 | −0.337 | 64 | 36 | ATG | TAA |
| Gene | Strand | Length (bp) | AT Skew | GC Skew | AT (%) | GC (%) | Anticodon |
|---|---|---|---|---|---|---|---|
| rrnL | − | 1330 | 0.05 | 0.304 | 69.3 | 30.7 | |
| rrnS | − | 823 | −0.02 | 0.248 | 62.2 | 37.8 | |
| trnA | + | 64 | 0.1 | 0 | 62.5 | 37.6 | UGC |
| trnC | − | 64 | 0 | 0.091 | 65.6 | 34.4 | GCA |
| trnD | + | 64 | 0 | 0.167 | 81.2 | 18.7 | GUC |
| trnE | + | 69 | 0 | −0.048 | 69.6 | 30.4 | UUC |
| trnF | − | 67 | 0.083 | 0.263 | 71.6 | 28.3 | GAA |
| trnG | + | 67 | 0.064 | −0.2 | 70.1 | 29.8 | UCC |
| trnH | − | 65 | 0 | 0.538 | 80 | 20 | GUG |
| trnI | + | 67 | 0.053 | 0.172 | 56.8 | 43.3 | GAU |
| trnK | + | 69 | 0.05 | 0.034 | 57.9 | 42 | UUU |
| trnL1 | − | 69 | 0.048 | 0.259 | 60.9 | 39.1 | UAG |
| trnL2 | + | 65 | −0.023 | 0 | 66.1 | 33.8 | UAA |
| trnM | + | 69 | 0 | −0.241 | 58 | 42 | CAU |
| trnN | + | 67 | 0.091 | −0.043 | 65.7 | 34.3 | GUU |
| trnP | − | 69 | 0.02 | 0.5 | 71 | 28.9 | UGG |
| trnQ | − | 69 | 0.059 | 0.222 | 73.9 | 26 | UUG |
| trnR | + | 65 | −0.25 | −0.03 | 49.3 | 50.8 | UCG |
| trnS1 | + | 69 | −0.122 | 0 | 59.4 | 40.6 | UCU |
| trnS2 | + | 70 | −0.098 | 0.158 | 72.9 | 27.1 | UGA |
| trnT | + | 64 | −0.042 | −0.125 | 75 | 25 | UGU |
| trnV | − | 68 | −0.07 | 0.28 | 63.2 | 36.7 | UAC |
| trnW | + | 69 | 0.045 | −0.2 | 63.7 | 36.2 | UCA |
| trnY | − | 66 | 0.077 | 0.259 | 59.1 | 41 | GUA |
Disclaimer/Publisher’s Note: The statements, opinions and data contained in all publications are solely those of the individual author(s) and contributor(s) and not of MDPI and/or the editor(s). MDPI and/or the editor(s) disclaim responsibility for any injury to people or property resulting from any ideas, methods, instructions or products referred to in the content. |
© 2025 by the authors. Licensee MDPI, Basel, Switzerland. This article is an open access article distributed under the terms and conditions of the Creative Commons Attribution (CC BY) license (https://creativecommons.org/licenses/by/4.0/).
Share and Cite
Zhang, X.; Zhu, Z.; Wang, J.; Shi, G.; Lin, Q. Mitogenomic and Phylogenetic Analyses of Lysmata lipkei (Crustacea: Decapoda: Lysmatidae). Fishes 2025, 10, 177. https://doi.org/10.3390/fishes10040177
Zhang X, Zhu Z, Wang J, Shi G, Lin Q. Mitogenomic and Phylogenetic Analyses of Lysmata lipkei (Crustacea: Decapoda: Lysmatidae). Fishes. 2025; 10(4):177. https://doi.org/10.3390/fishes10040177
Chicago/Turabian StyleZhang, Xixi, Zhihuang Zhu, Jianxin Wang, Ge Shi, and Qi Lin. 2025. "Mitogenomic and Phylogenetic Analyses of Lysmata lipkei (Crustacea: Decapoda: Lysmatidae)" Fishes 10, no. 4: 177. https://doi.org/10.3390/fishes10040177
APA StyleZhang, X., Zhu, Z., Wang, J., Shi, G., & Lin, Q. (2025). Mitogenomic and Phylogenetic Analyses of Lysmata lipkei (Crustacea: Decapoda: Lysmatidae). Fishes, 10(4), 177. https://doi.org/10.3390/fishes10040177