Article

Reconstruction of Recreational Catch and Multi-Fisheries Stock Assessment of Hairtail (Trichiurus lepturus) in Korean Waters Under a Data-Limited Situation

Coastal Water Fisheries Resources Research Division, National Institute of Fisheries Science, Busan 46083, Republic of Korea
*
Author to whom correspondence should be addressed.
Fishes 2025, 10(4), 166; https://doi.org/10.3390/fishes10040166
Submission received: 27 February 2025 / Revised: 4 April 2025 / Accepted: 6 April 2025 / Published: 8 April 2025

Abstract

:
Accurate catch data are essential for effective fisheries management. This study reconstructs the historical recreational catch of hairtail (Trichiurus lepturus) in Korean waters by incorporating unreported catches to improve stock assessment accuracy. Using a Bayesian state-space surplus production model, we conducted a multi-fishery stock assessment by integrating abundance indices from eight major fisheries. The multigear mean standardization (MGMS) method was applied to derive standardized CPUE indices for each fishery, providing a more comprehensive evaluation of stock trends. The results indicate that excluding recreational catches and multiple CPUE indices may lead to biased stock assessments of hairtail in Korean waters. Models using an integrated CPUE index (SMSC) yielded higher MSY and biomass estimates, suggesting a more optimistic stock condition, whereas fishery-specific CPUE models (MSC) provided more precautionary estimates. The Kobe plot analysis indicates recent stock recovery, but continued monitoring and adaptive management are required to ensure long-term sustainability. This study highlights the importance of integrating recreational catch data and multi-fishery approaches in stock assessments, particularly under data-limited conditions, to enhance resource management and policy decision-making.
Key Contribution: This study improves stock assessment accuracy by incorporating reconstructed recreational catches and integrating multi-fishery abundance indices using the MGMS method. The application of a Bayesian state-space surplus production model highlights the impact of data inclusion on stock status estimation, emphasizing the need for precautionary management to ensure the sustainable utilization of hairtail resources.

1. Introduction

Hairtail (Trichiurus lepturus) is a key multi-gear fishery species in Korean waters and holds significant economic value in Korea’s coastal fisheries. Between the 1990s and 2000s, the annual catch of hairtail showed fluctuations but remained relatively stable at approximately 60–80 thousand metric tons [1]. However, due to intensified fishing competition, increased illegal fishing by Chinese vessels, and the enforcement of fishing prohibitions in the exclusive economic zones (EEZ) of Korea and Japan, the coastal catch of hairtail declined sharply in the late 2000s [2]. The lowest recorded catch was 32 thousand metric tons in 2011, but it showed a gradual recovery, reaching 60 thousand metric tons again by 2023 [1].
Of the 41 coastal fisheries operating in Korean waters, 37 specifically target hairtail. According to the most recent five-year average fish production of Korean marine fisheries (2020–2024), eight major fisheries—Offshore longline, Offshore stownet, Offshore angling, Offshore gillnet, Two-boat large trawl, Large otter trawl, Large purse seine, and Coastal multi–fishery—contribute approximately 90.9% of the total catch [1]. Moreover, during the same period (2020–2024), hairtail ranked third in average annual fish production among all fish species in Korean coastal fisheries, emphasizing its economic significance in the region [1]. Given its commercial significance, systematic resource monitoring and assessment are crucial for the sustainable utilization and effective management of hairtail stocks. A precise stock assessment is particularly necessary to identify the key drivers of catch fluctuations, objectively evaluate stock status, and establish effective management strategies for resource sustainability.
Traditional stock assessment studies have predominantly employed surplus production models based on CPUE (catch per unit effort) data from a single fishery [3,4,5,6]. However, in real-world fisheries, a single fish stock is often harvested by multiple fisheries, and assessments based solely on single-fishery CPUE data may fail to fully reflect population fluctuations [7]. To overcome this limitation, recent studies have increasingly adopted surplus production models that incorporate CPUE data from multiple fisheries [8,9]. When multiple fisheries target the same species, an assessment framework that considers inter-fishery differences offers a more realistic depiction of stock dynamics. However, obtaining detailed catch information from various fisheries is often challenging due to differences in data availability and reporting accuracy. This data limitation necessitates the use of alternative assessment approaches tailored for data-limited situations. Thus, to achieve an accurate stock assessment of hairtail, which is harvested across multiple fisheries, it is crucial to move beyond the conventional single-fishery approach and implement a multi-fishery-based assessment methodology suitable for data-limited conditions.
Since the late 1980s, global fishery production has remained relatively stable, ranging between 86 and 94 million metric tons [10]. However, these statistics primarily rely on officially reported commercial fisheries data, often overlooking unreported catches from small-scale fisheries, recreational fishing, illegal fishing, and discarded bycatch [11,12,13]. Consequently, actual catches are likely underestimated, potentially compromising the accuracy of stock assessments and undermining the credibility of fisheries management policies [14,15]. To mitigate this issue, catch reconstruction methodologies have been increasingly employed in recent studies to supplement existing statistics and enhance the accuracy of total catch estimates [14,16,17].
To ensure the sustainable utilization and management of hairtail, the Korean government has designated July as a closed season. Additionally, a minimum catch size of 18 cm has been implemented and strictly enforced [18]. Since 2023, hairtail has been designated as a species under the total allowable catch (TAC) system [18]. The TAC is a crucial policy tool aimed at preventing the overexploitation of fishery resources and promoting sustainable fisheries management. Its phased implementation allows for an adaptive approach to maximize effectiveness.
The management of fishery resources primarily relies on stock assessments based on catch data from commercial fisheries. However, official statistics often overlook unreported catches, such as those from recreational and illegal fishing, resulting in a systematic underestimation of stock biomass. These data limitations can undermine the reliability of stock assessments and introduce biases into fisheries management strategies. Therefore, to ensure the sustainable use of hairtail, it is crucial to supplement existing official statistics and establish a more accurate stock assessment framework.
Studies on hairtail in Korea have primarily focused on their biological and ecological characteristics, including age and growth [19], egg distribution [20], and stomach content composition and feeding strategies [21]. Regarding stock assessment, previous studies have estimated annual and age-specific stock biomass using cohort-based assessment methods [22]. Additionally, studies have evaluated hairtail stocks harvested by multiple fisheries and estimated optimal catch levels based on economic factors such as market price and fishing costs [2].
While some studies have considered the impact of multiple fisheries, research has largely overlooked unreported (informal) catches, such as those from recreational fisheries—when reconstructing catch data. Excluding unreported catches from official statistics can result in an underestimation of actual stock abundance, potentially weakening the effectiveness of fisheries management policies. Therefore, it is essential to reconstruct total catch data by incorporating unreported catches and integrating these estimates into stock assessments.
Therefore, this study aims to improve the accuracy of hairtail stock assessments by incorporating unreported catches and multiple fisheries data. Specifically, a Bayesian state-space surplus production model under data-limited conditions was applied to data from 2000 to 2024, integrating data from multiple fisheries. Additionally, catch reconstruction was conducted to account for unreported catches from recreational fishing, which was excluded from official statistics. Furthermore, stock assessment using reconstructed catch data was compared with those based solely on officially reported catches to assess the impact of catch reconstruction on stock status estimates. The results of this study are expected to serve as a fundamental resource for the sustainable management of hairtail stocks and the development of more refined fisheries policies. Moreover, this study highlights the necessity of employing data-limited stock assessment approaches when comprehensive fishery-dependent data are unavailable, ensuring more effective fisheries resource management and policy decision-making.

2. Materials and Methods
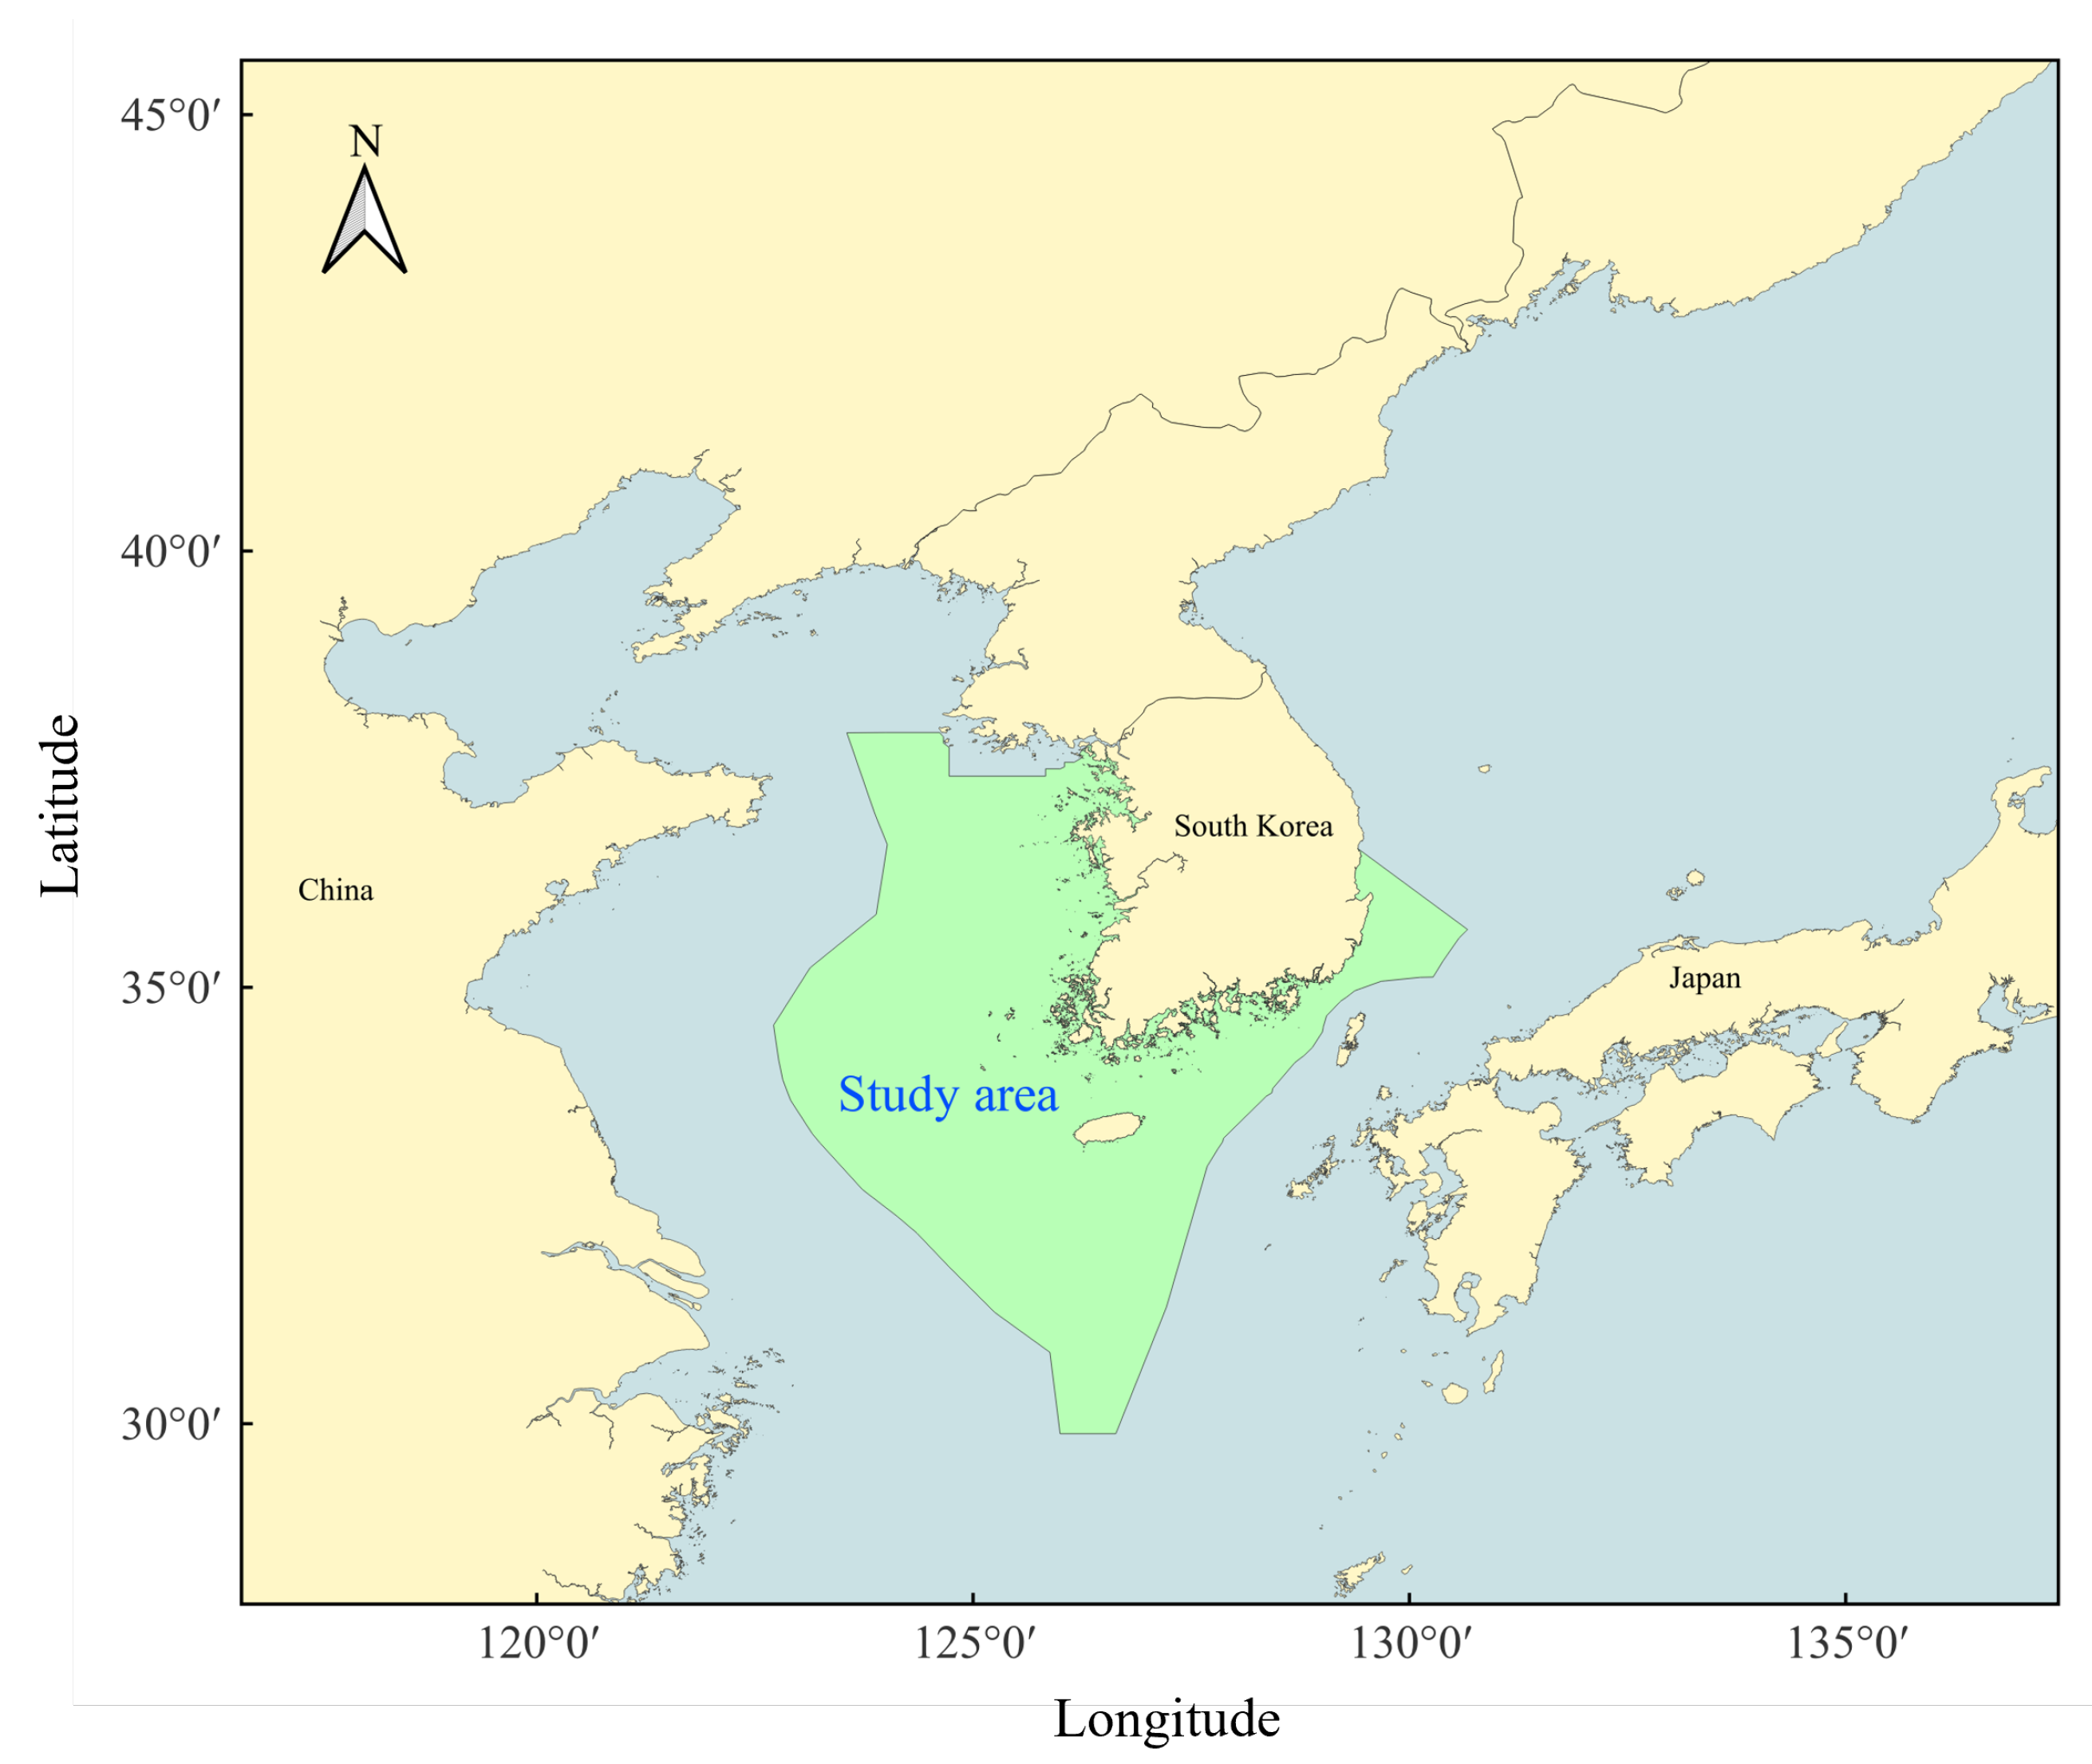
2.1. Data

2.1.1. Collecting Commercial Catch

For the collection of commercial catch data on hairtail, we utilized annual catch records classified by year, fishery type, and species. These data, obtained from Statistics Korea [1], encompass the eight major fisheries primarily engaged in hairtail harvesting: Two-boat large trawl, Offshore longline, Offshore stownet, Large otter trawl, Large purse seine, Coastal multi-fishery, Offshore angling, and Offshore gillnet. These catches are primarily derived from waters surrounding the Korean Peninsula, particularly the Yellow Sea, the East China Sea, and parts of the southeastern coast of Korea, as illustrated in Figure 1.

2.1.2. Reconstruction of Recreational Catch

To estimate the recreational catch of hairtail, we utilized catch statistics from Statistics Korea [1]. Official statistics on recreational catch have only been recorded since 2023, and currently, data are available for a single year. In 2023, hairtail accounted for 37.7% of the total recreational catch, making it the most dominant species in the dataset. Recreational fishing for hairtail in Korea is predominantly conducted in the southern and southeastern coastal waters. The peak season spans from August to November, during which nighttime fishing trips are especially popular. Anglers typically board chartered fishing vessels and employ vertical jigging or bait fishing techniques to target hairtail.
For stock assessment purposes, a long-term time series dataset is essential. Since historical recreational catch data are unavailable before 2023, it was necessary to estimate the catch for years prior to 2023 and for 2024. The estimation was based on the officially reported 2023 catch of 6112 metric tons. The extrapolation method incorporated two key factors: relative fishing effort and relative stock abundance index.
Fishing effort for recreational fishery was assumed to be represented by the number of recreational fishing vessel users. Data on the number of recreational fishing vessel users from 2000 to 2023 were obtained from the Korea Coast Guard survey data. As the 2024 data have not yet been published, the average value from the most recent five years (2019–2023) was used as a proxy. The relative fishing effort for each year was calculated by setting the 2023 value as 1.0 and deriving the relative values for other years accordingly.
The relative abundance index was derived from the multigear mean standardization (MGMS) [23], which accounts for stock variations across different fisheries. The details of the MGMS estimation process are explained in the following section. Using this approach, the estimated recreational catch for years other than 2023 was calculated using the following equation:
R C ^ j = R C 2023 ( 6 , 112 m t ) × F j r e l × I j r e l
where R C ^ j represents the estimated recreational catch for year F j r e l denotes the relative fishing effort for year j, and I j r e l refers to the relative stock abundance index for year j.

2.1.3. Standardizing CPUE Data for Multiple Fisheries

To obtain the abundance index of hairtail across different fisheries, we applied the multigear mean standardization (MGMS) method to eight fisheries data: two boat large trawl, offshore longline, offshore stownet, large otter trawl, large purse seine, coastal multi fishery, offshore angling, and offshore gillnet. The MGMS approach, originally developed by Gibson-Reinemer et al. [23], enables the integration of CPUE data from multiple gear types by adjusting for differences in catchability across gears. Given the absence of a unified CPUE index that accounts for the diverse fishing gears targeting hairtail, the application of MGMS ensures a more robust and consistent representation of stock abundance trends across multiple fisheries.
The standardized CPUE for each gear type was calculated using the following equation:
M S C i j = C i j / e T C ¯ / e
In this equation, M S C i j represents the mean standardized catch for species i in year j. The numerator, C i j / e , corresponds to the CPUE for species i year j, adjusted for the effort associated with the specific gear type. The denominator, T C ¯ / e , represents the mean total catch per unit effort across all observation years for the given gear type. By dividing the observed CPUE by the mean CPUE for that gear type, the resulting M S C i j values are standardized across different fisheries, allowing for a direct comparison of relative abundance between gears.
Since the effort units (e) are canceled out during this calculation, the MGMS method preserves both the patterns of relative abundance of species within an observation and the relative abundance of a species across observations. This ensures that the resulting abundance index reflects genuine trends in hairtail stock abundance rather than biases introduced by differences in gear selectivity.
Once CPUE data for each gear type were converted to M S C i j , they were aggregated across all gears to obtain a final standardized abundance index for hairtail:
S M S C = k M S C k
The summation of M S C k across all gear (k) types ensures that the final MGMS-derived abundance index integrates data from multiple fisheries while maintaining the relative contributions of each gear [24,25]. The most straightforward way to combine data from multiple gears is to sum the M S C k values across all gear types for each species and observation year. The MSC and SMSC values were subsequently used as input data for catch reconstruction and stock assessment model

2.2. Stock Assessment Model for Multiple Fisheries

To conduct a stock assessment of hairtail under a data-limited situation, we employed a Bayesian surplus production model that accounts for multiple fisheries. This approach is particularly suitable when direct stock estimates are unavailable, as it integrates catch data, abundance indices, and informative priors to estimate stock dynamics. The model was primarily developed based on the methodologies of Meyer et al. [26] and An et al. [9], with modifications to better accommodate the multi-fishery stock assessment.
To estimate model parameters using a Bayesian approach, we implemented the model in Stan, a probabilistic programming language designed for Bayesian inference. The model was fitted using the rstan package in R [27], which facilitates efficient Hamiltonian Monte Carlo (HMC) sampling. This implementation allows for robust posterior estimation of key stock parameters while effectively accounting for uncertainty in data-limited conditions. The full Stan model code used in this study, including the specification of priors, likelihood functions, and generated quantities, is provided in Appendix A.
This Bayesian approach provides a robust framework for multiple fisheries stock assessment in a data-limited context, allowing for the integration of uncertainty in both observed data and parameter estimates. By comparing the results across the four model scenarios, we aim to determine the most reliable method for assessing hairtail stocks under limited data availability.
To evaluate the impact of different data integration methods on hairtail stock assessment, we constructed four Bayesian surplus production models that incorporate various combinations of catch and abundance data. The details of these models are summarized in Table 1.
Model 1 and Model 2 incorporate both commercial and reconstructed recreational catch data to account for total fishery removals more comprehensively. In contrast, Model 3 and Model 4 rely only on commercial catch data, excluding the potential contribution of recreational fisheries.
For abundance indices, Model 1 and Model 3 use multiple CPUE indices ( M S C k ) from different fisheries, maintaining the distinct characteristics of each fishery. Meanwhile, Model 2 and Model 4 use an integrated abundance index ( S M S C ), which combines CPUE data from multiple fisheries into a single standardized index. Comparing these models allows us to assess whether incorporating recreational catch data and using an integrated CPUE index improves the robustness of stock assessment results.
The Bayesian surplus production model requires informative priors to constrain key parameters in the absence of direct stock estimates. The priors for the intrinsic growth rate (r) and carrying capacity (K) were set following the recommendations of Froese et al. [28]. The priors for initial biomass (p) and catchability coefficient (q) were specified using non-informative distributions to minimize their influence on posterior estimates. A complete description of the prior distributions used in this study, including their parameter values and justifications, is provided in Appendix A.

3. Results

3.1. Reconstructed Catch

The reconstructed recreational catch of hairtail, estimated using the 2023 reported catch (6112 mt) as a baseline and adjusted based on relative fishing effort ( F r e l ) for recreational fishery and relative abundance index ( I r e l ), is presented in Figure 2. The results illustrate the estimated temporal variation in recreational catch from 2000 to 2024.
Between 2000 and 2009, the reconstructed catch showed a steady increase from 766 mt in 2000 to 3042 mt in 2009, following a rise in relative fishing effort from 0.13 to 0.48. During this period, relative abundance remained relatively stable, fluctuating between 0.90 and 1.20. The highest relative abundance ( I r e l = 1.20 ) was observed in 2008, coinciding with a peak in reconstructed catch of 3063 mt.
From 2010 to 2016, the reconstructed catch declined, reaching a low of 1519 mt in 2012, which aligns with a substantial decrease in stock abundance ( I r e l = 0.57 ) and fishing effort ( F r e l = 0.43 ). This decline reflects a period of reduced resource availability and lower fishing intensity. However, an increasing trend emerged after 2016, with reconstructed catch climbing to 4697 mt in 2017 as both fishing effort and stock abundance recovered.
In the most recent years, the reconstructed catch peaked in 2021 at 6991 mt, driven by increased fishing effort ( F r e l = 1.06 ) and stock abundance ( I r e l = 1.08 ). However, in 2024, the estimated catch declined to 5029 mt, reflecting a decrease in stock abundance ( I r e l = 0.81 ), despite stable fishing effort ( F r e l = 1.02 ).
Figure 3 presents the total catch, incorporating both commercial and reconstructed recreational fishing estimates from 2000 to 2024. The stacked bars illustrate the contributions of the eight major fisheries, while the hatched bars indicate the reconstructed recreational catch. The results demonstrate that commercial fisheries have historically dominated the total catch, with recreational fishing making a relatively small but growing contribution in recent years.

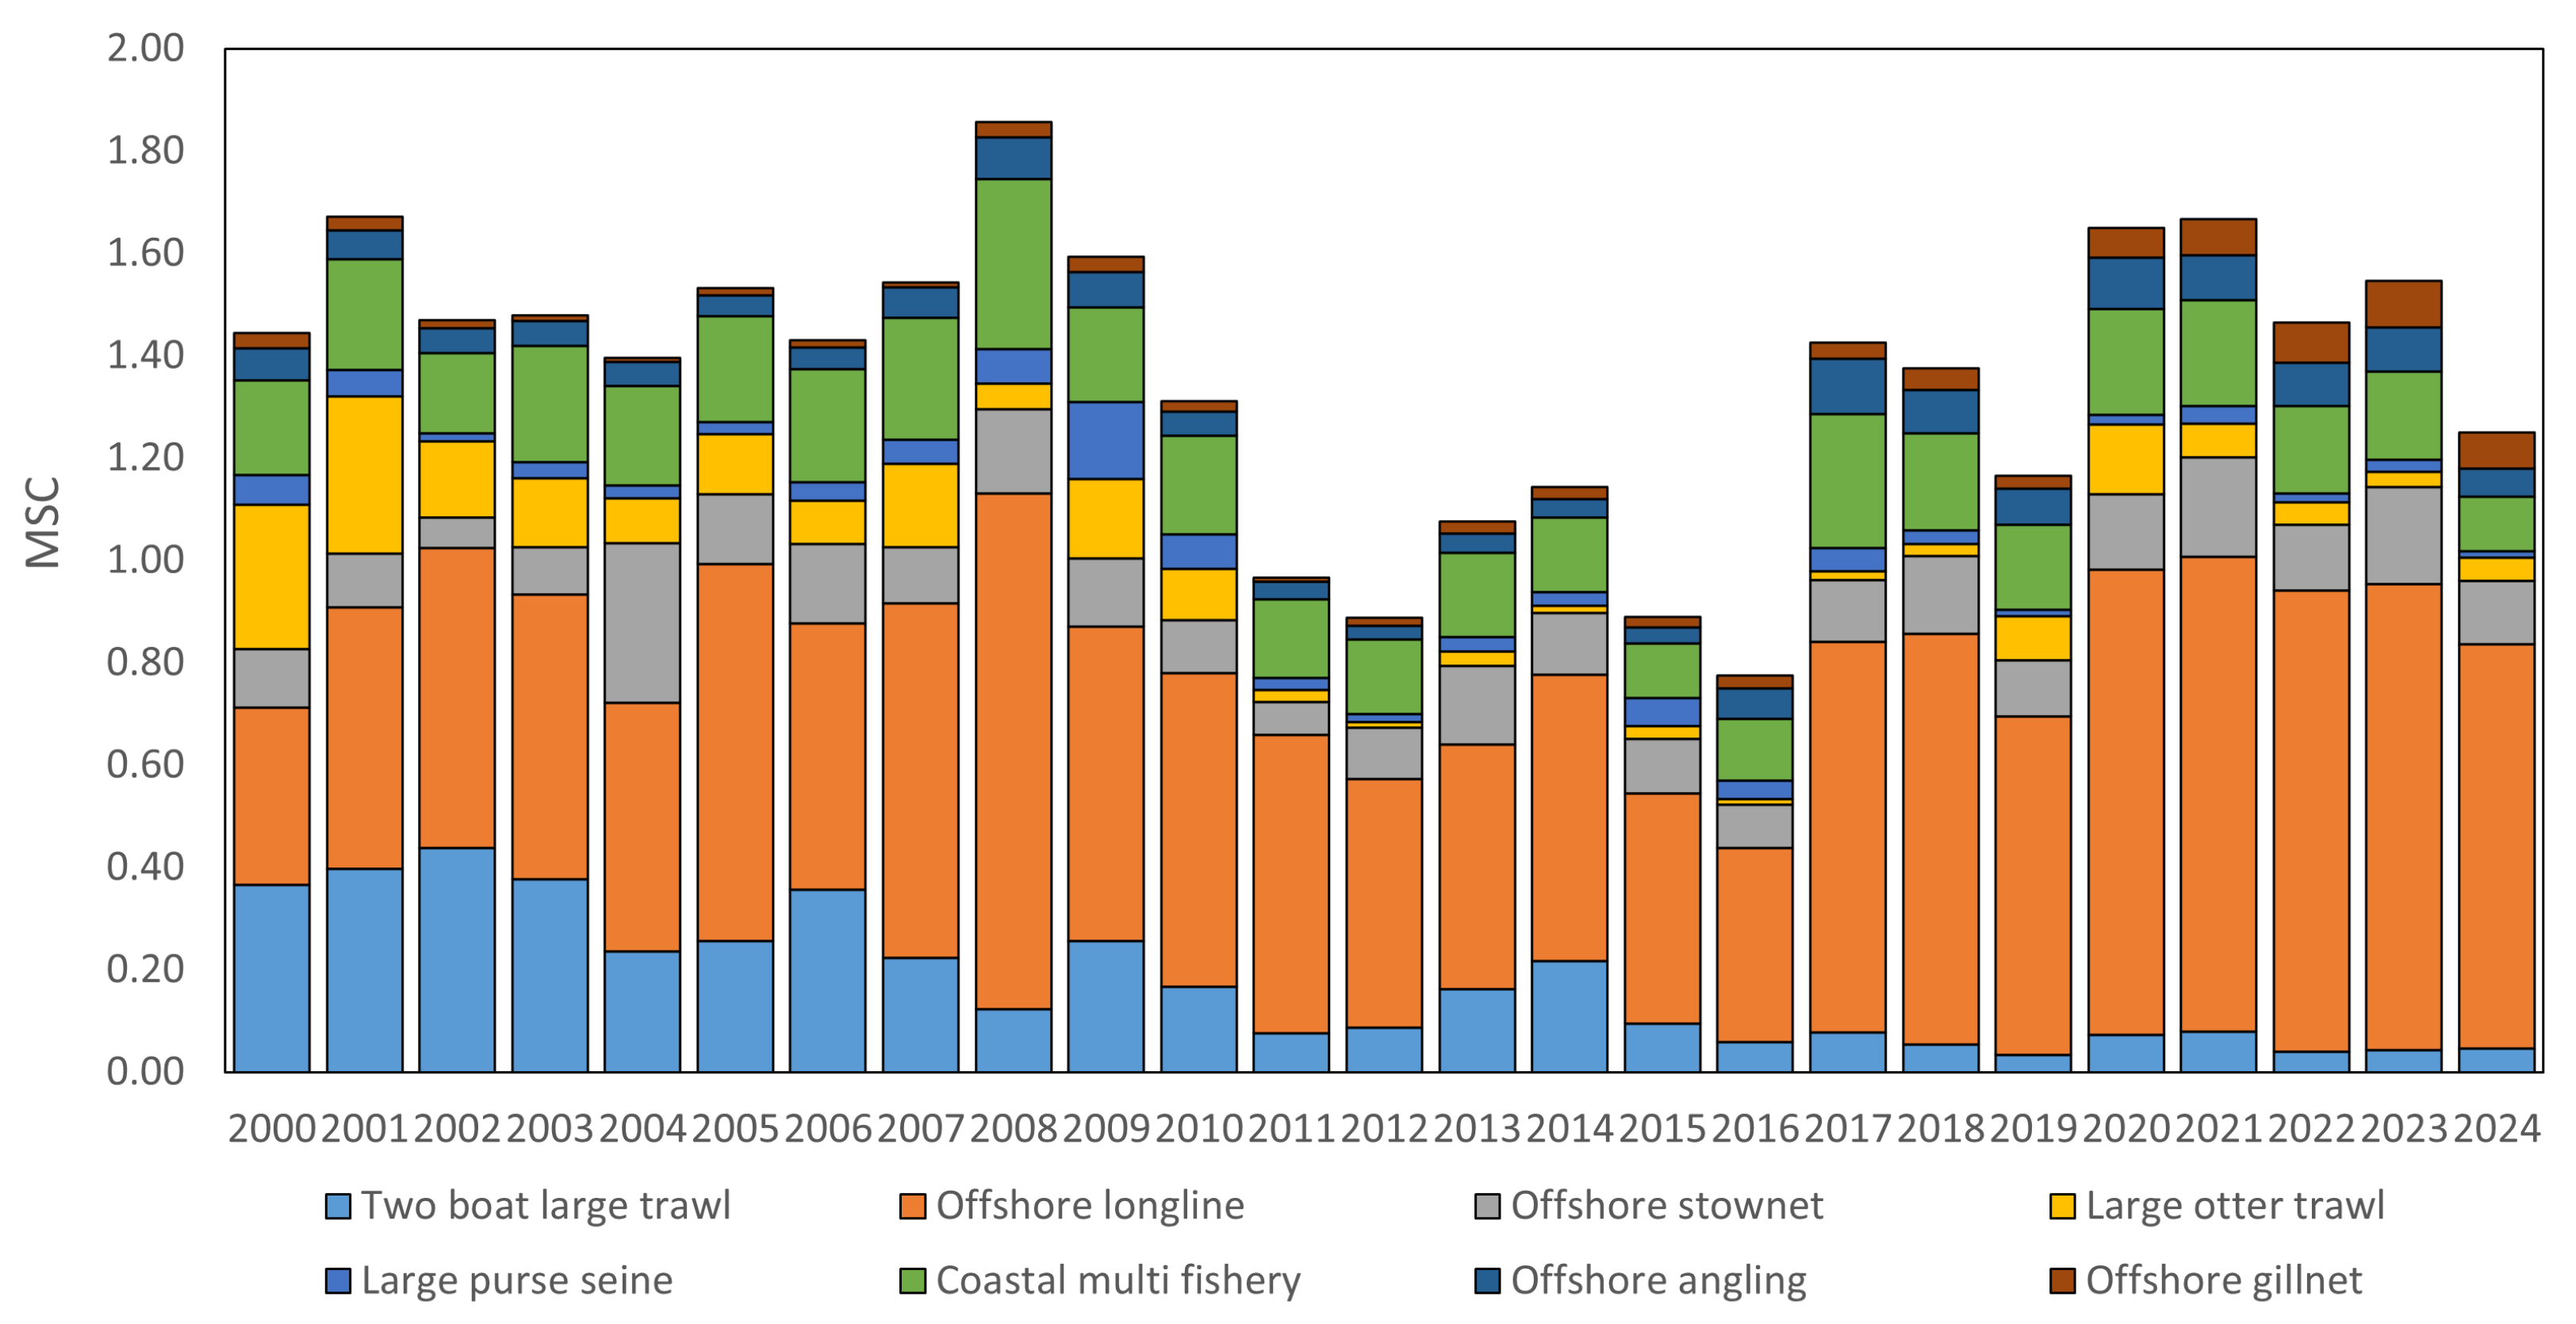
3.2. Standardized Abundance Indices for Multiple Fisheries

To assess the standardized abundance index of hairtail across multiple fisheries, the MGMS method was applied to estimate MSC values for each of the eight fisheries and their SMSC values, which represent the summation of MSC across all fisheries. Figure 4 presents the estimated MSC values for each fishery from 2000 to 2024. The stacked bar chart represents the contributions of each fishery to the overall standardized catch index, while the total height of each bar corresponds to the SMSC value, which integrates data from all fisheries.
The results show that offshore longline and two-boat large trawl fisheries have consistently contributed the most to the total SMSC values across the years, while other fisheries, such as offshore gillnet and offshore angling, have played relatively minor roles. The SMSC values varied over time, with notable peaks in 2008 (1.86) and 2021 (1.67), reflecting fluctuations in fishery-specific CPUE and total effort levels. The lowest SMSC values were recorded in 2016 (0.78) and 2015 (0.89), indicating lower overall fishery performance in those years.

3.3. Stock Assessment Results

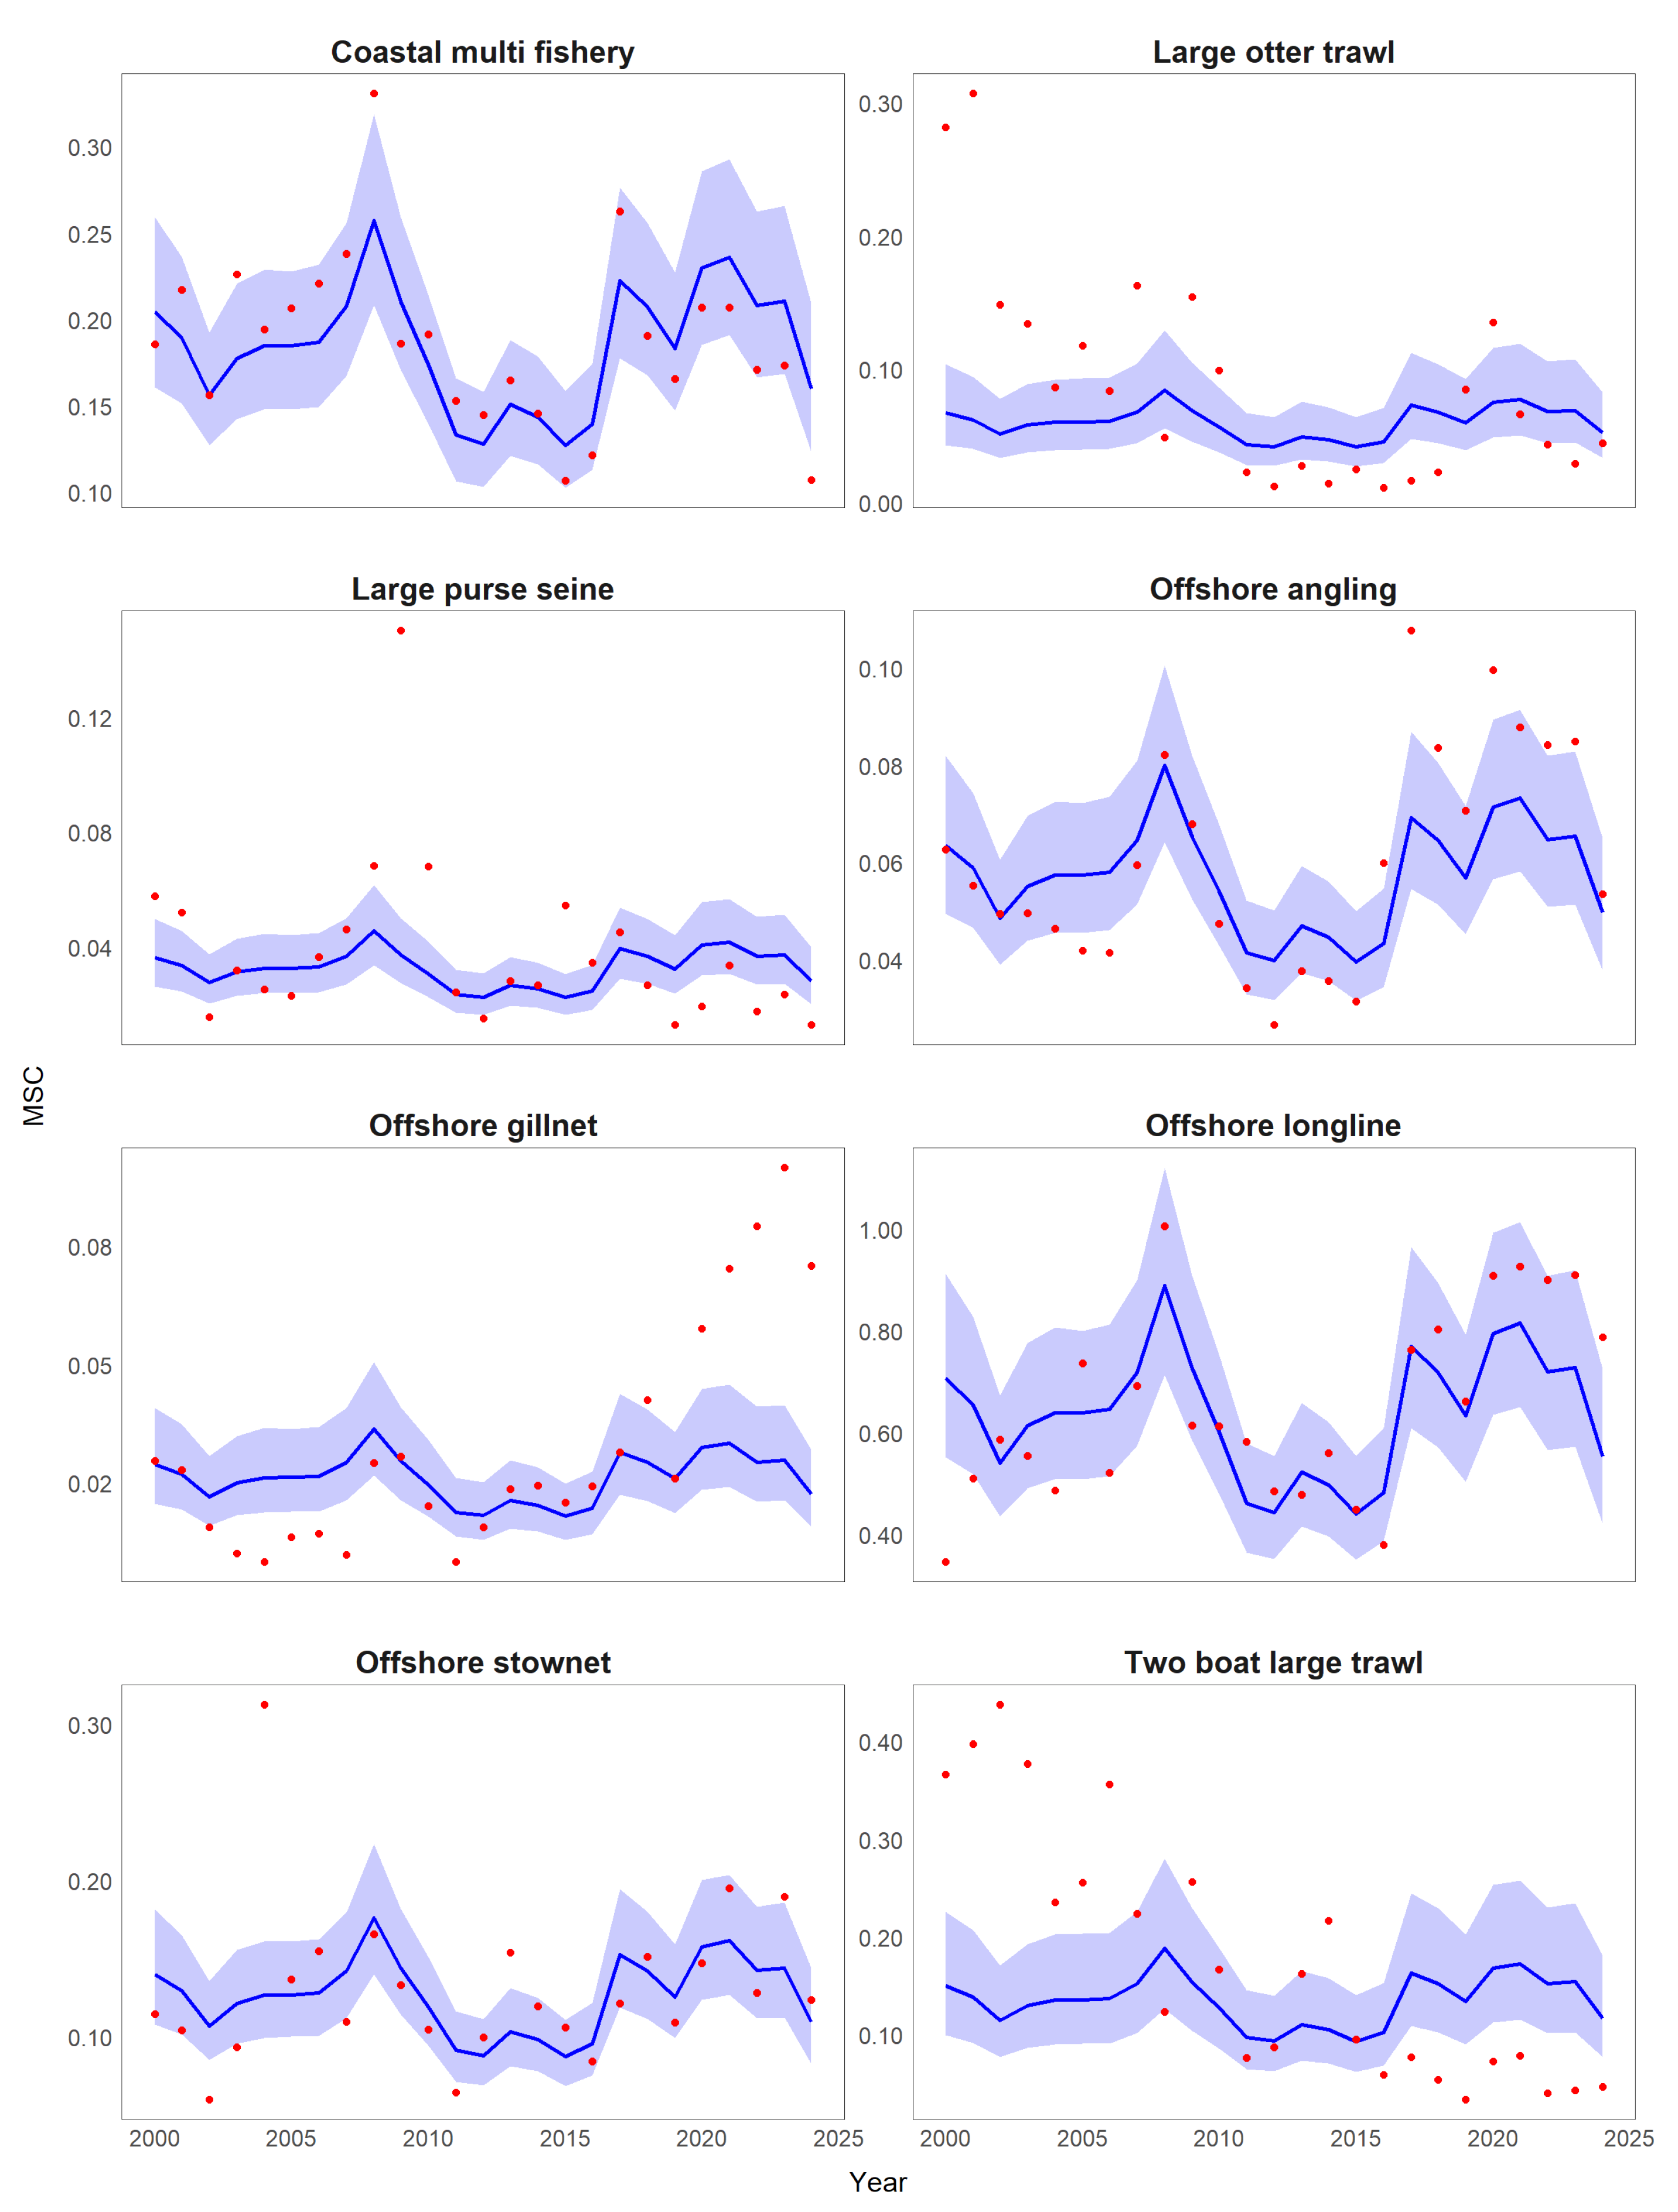
3.3.1. Fitted Abundance Indices

Figure 5 presents the estimated MSC-based abundance index trends for each of the eight fisheries, obtained from Model 1. The MSC estimates generally exhibit a reasonable fit to the observed data across most fisheries. The offshore longline, coastal multi fishery, and offshore stownet fisheries demonstrate strong agreement between estimated MSC values and observed data, with narrow credible intervals suggesting high confidence in the model’s predictions. In contrast, the large otter trawl, two-boat large trawl, and offshore gillnet fisheries exhibit relatively poor model fit, with wider credible intervals and greater deviations between observed and estimated MSC values. The offshore angling and large purse seine fisheries also show moderate deviations between estimated and observed values, though their overall trends remain consistent.
Figure 6 presents the estimated SMSC trends obtained from Model 2, which differs from Model 1 in that it utilizes a single integrated abundance index rather than separate MSC values for each fishery. Unlike Model 1, which estimates individual MSC values for each fishery, Model 2 provides a unified assessment of hairtail stock abundance by incorporating all fisheries into a single standardized metric. This approach reduces the potential biases that may arise from inter-fishery variability in CPUE trends and catchability. The SMSC estimates exhibit clear fluctuations, with notable peaks around 2000, 2009, and 2020, followed by subsequent declines. The highest estimated SMSC value occurred in 2020, indicating a temporary increase in overall stock availability.
Models 3 and 4, which follow similar frameworks as Models 1 and 2 but exclude reconstructed recreational catch data, produced abundance index estimates that closely resemble those of Models 1 and 2. As a result, the comparison between estimated and observed values for Models 3 and 4 is omitted from this section.

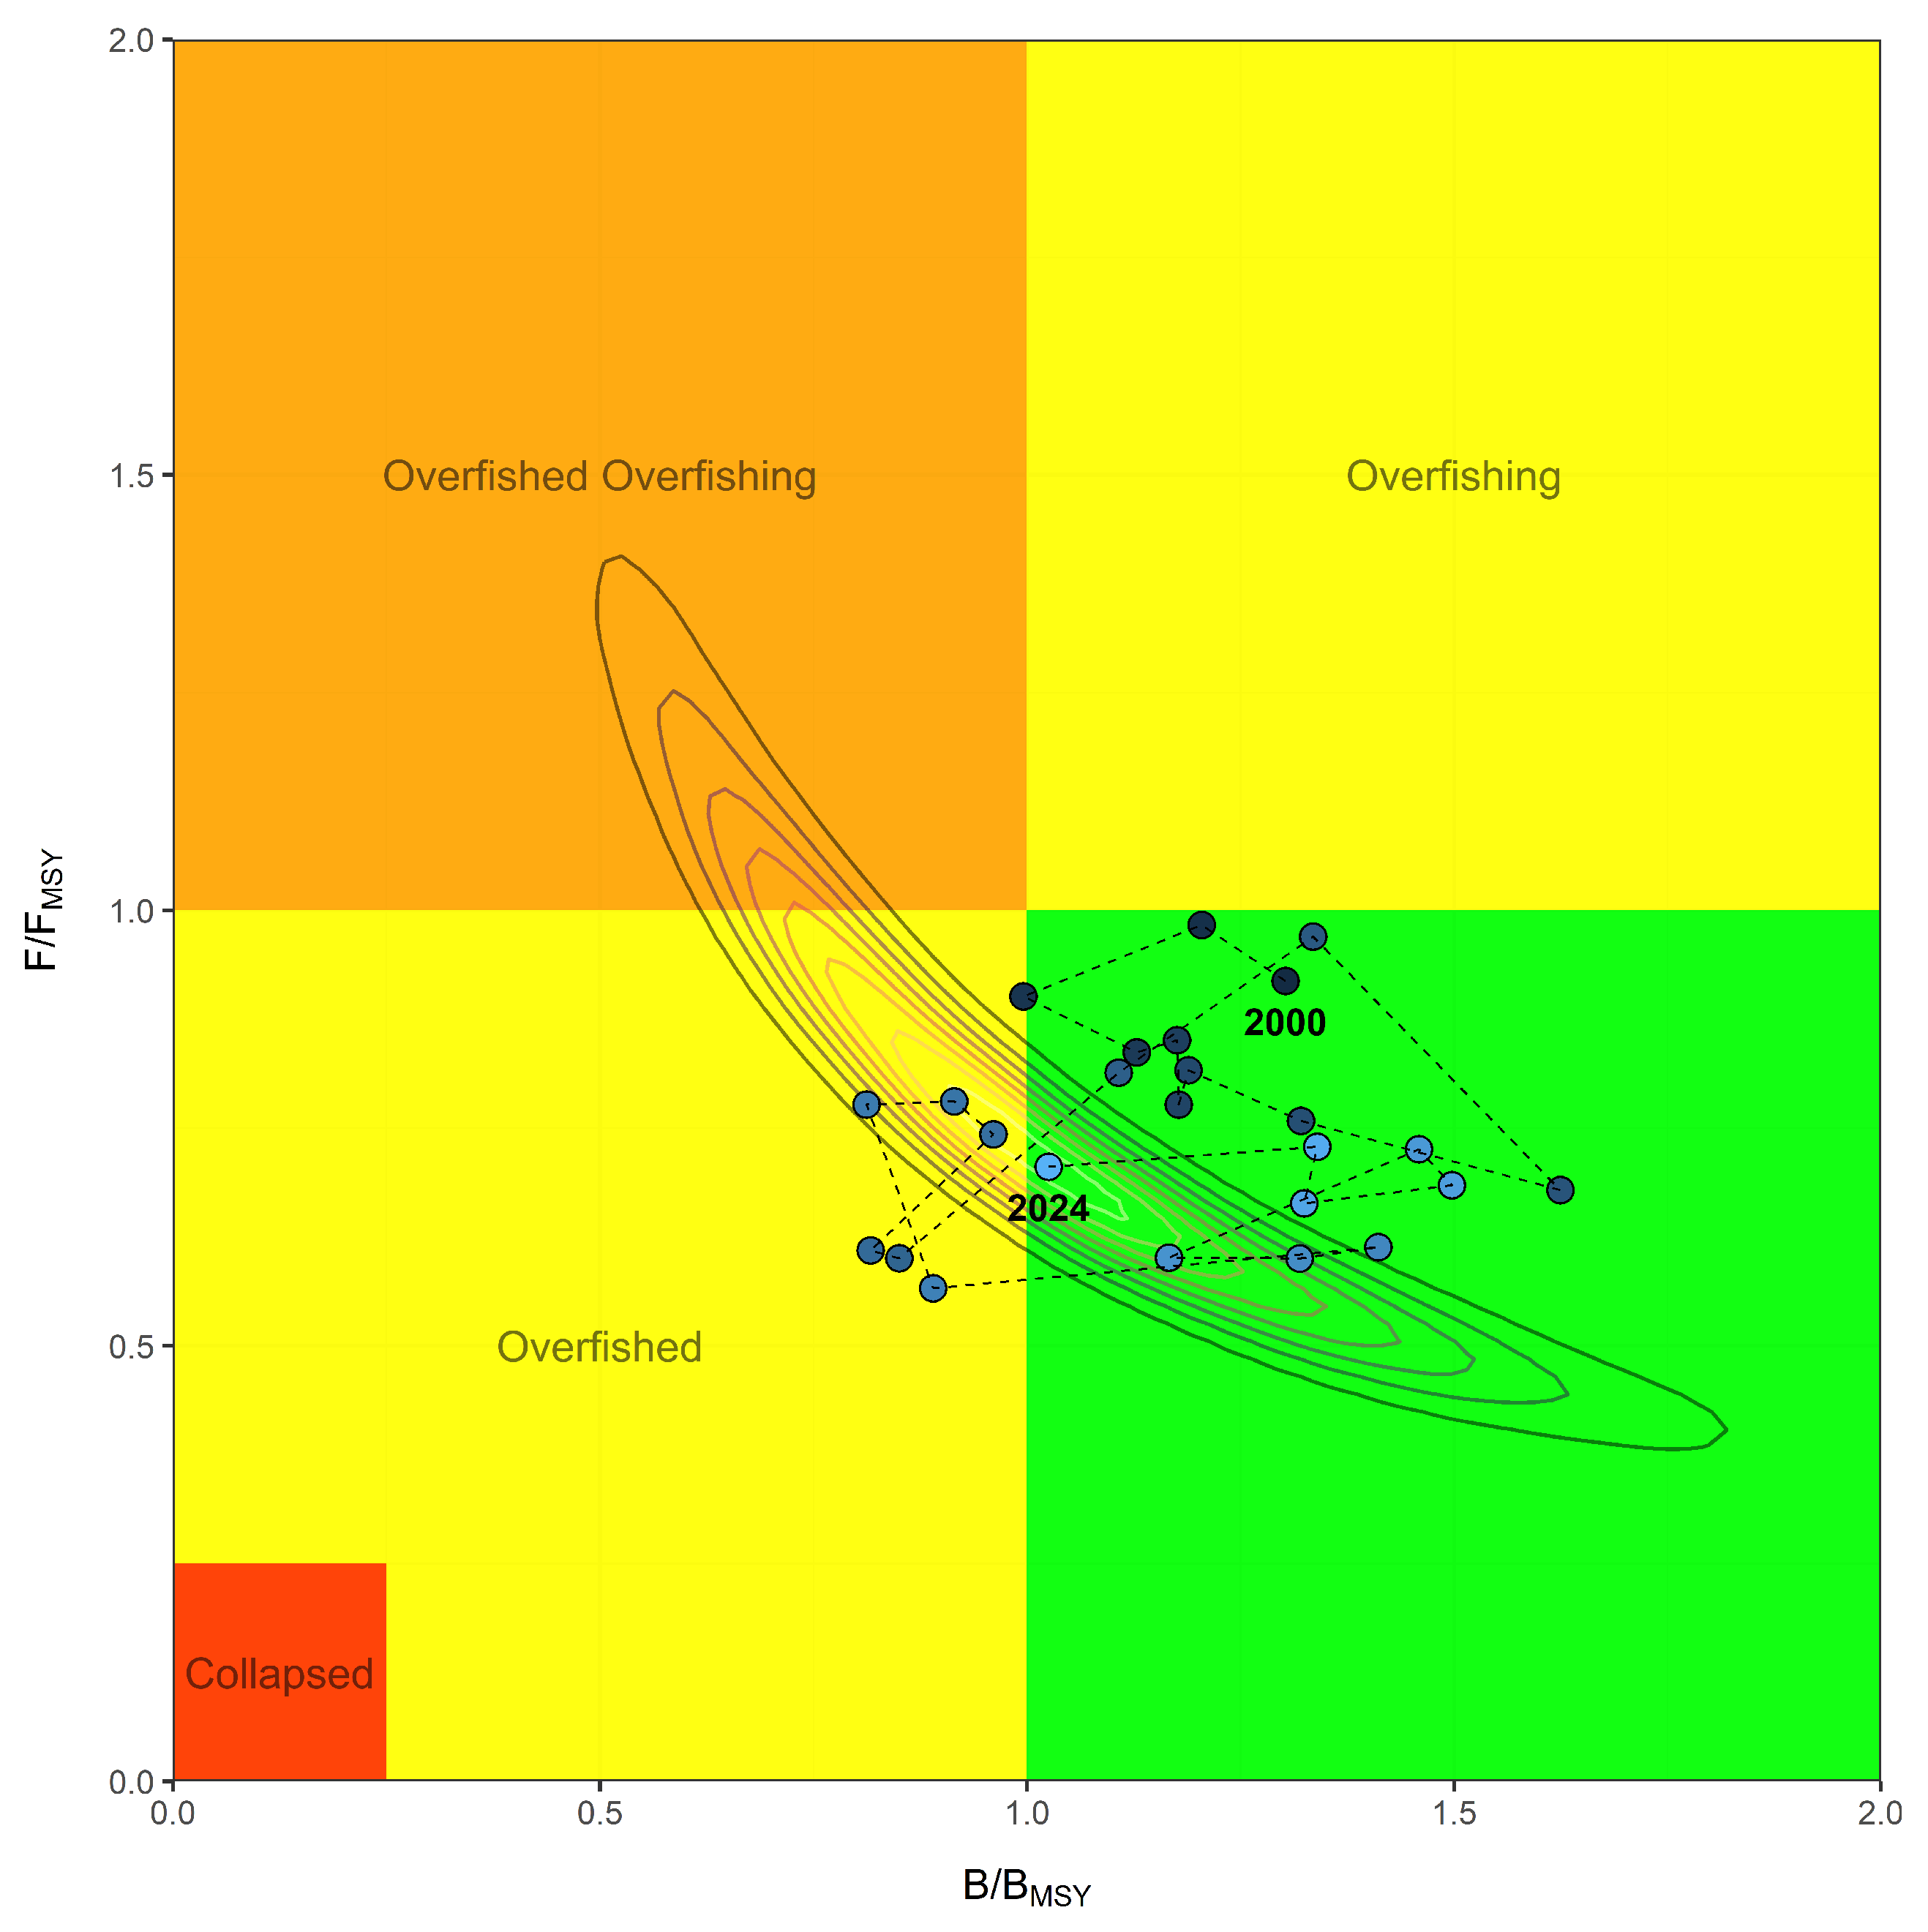
3.3.2. Estimated Parameters and Reference Points

Table 2 summarizes the estimated key parameters and reference points for the four models. The intrinsic growth rate (r) estimates range from 0.444 to 0.538 across models, with Model 1 showing the highest value. The maximum sustainable yield (MSY) estimates range from 64,633 to 89,556 mt, with Models 2 and 4 indicating higher MSY values. The fishing mortality at MSY (FMSY) estimates range from 0.222 to 0.269, with Models 1 and 3 indicating slightly higher values compared to Models 2 and 4.
Additionally, the ratio of the estimated last-year biomass (last B) to BMSY (last B/BMSY) was calculated to assess the stock status in the final year of the analysis. The estimated ratios range from 1.03 to 1.37 across models, with Models 2 and 4 producing higher values, reflecting a relatively more optimistic biomass estimate when using the integrated CPUE index. The 95% credible intervals for this ratio indicate a broad range of possible biomass conditions, with lower bounds between 0.47 and 0.73, and upper bounds extending up to 2.40.
The model diagnostics showed that all estimated parameters have an r-hat value of 1.02 or lower, indicating good model convergence and reliable posterior sampling [29]. Each model was run using four Markov chains with 5000 iterations per chain, where the first half of the iterations were designated as warm-up to ensure effective sampling from the posterior distribution.
Figure 7 and Figure 8 present the Kobe plots for Model 1 and Model 2, respectively, illustrating the temporal trends of the estimated biomass relative to B M S Y ( B / B M S Y ) and fishing mortality relative to F M S Y ( F / F M S Y ).
For Model 1 (Figure 7), the stock was initially in a relatively stable condition in 2000, with B / B M S Y = 1.30 and F / F M S Y = 0.92 . However, during the 2010s, the stock declined below B M S Y , indicating an overfished state. Since the late 2010s, the biomass has recovered, and in 2024, the stock is estimated to be at B / B M S Y = 1.03 and F / F M S Y = 0.52 , suggesting a stable condition with reduced fishing pressure.
Model 2 (Figure 8), which incorporates an integrated abundance index (SMSC), exhibits a similar trend to Model 1 but suggests a more stable stock condition. In 2000, the stock was estimated at B / B M S Y = 1.71 and F / F M S Y = 0.52 , indicating a well-sustained biomass level. Although a gradual decline occurred in the 2010s, the stock has rebounded since the late 2010s, reaching B / B M S Y = 1.37 and F / F M S Y = 0.42 in 2024.
Overall, both models indicate a period of stock depletion in the early 2010s, followed by a recovery phase in recent years. Model 2, which accounts for an integrated fishery approach, provides slightly more optimistic estimates of stock status compared to Model 1.
The trends observed in Models 3 and 4 are largely consistent with those of Models 1 and 2, respectively. The estimated trajectories of B / B M S Y and F / F M S Y in Models 3 and 4 exhibit similar patterns of stock decline in the early 2010s, followed by recovery in recent years. Given this similarity, the Kobe plots for Models 3 and 4 have been omitted to avoid redundancy.

4. Discussion

This study applied a multi-fishery Bayesian surplus production model to assess the stock status of hairtail (Trichiurus lepturus) in Korean waters. The approach integrated reconstructed recreational catch data, CPUE data from multiple fisheries, and Bayesian inference techniques to provide a comprehensive evaluation of stock dynamics under a data-limited situation. The results highlight the significance of including unreported catches and utilizing a multi-fishery assessment framework to improve the accuracy and reliability of stock assessments.
The reconstructed recreational catch estimates revealed that official statistics substantially underestimated total fishery removals. Similar findings have been reported in global fisheries where unreported recreational catches contribute significantly to overall fishery removals, thereby affecting stock assessment accuracy [30]. The importance of accounting for non-commercial fishing sectors is well documented in previous research, demonstrating that conventional stock assessments may be biased if only commercial catch data are considered [14]. While previous catch reconstruction studies, such as those conducted by the Sea Around Us project, have estimated the total historical catch within the Korean waters [31], these reconstructions omitted explicit estimates of recreational catch for hairtail. Given the substantial contribution of recreational fishing to overall removals in our study, the lack of explicit consideration of this sector in prior reconstructions highlights a critical gap in existing assessments. This further emphasizes the importance of integrating recreational catch estimates into stock assessments to improve fisheries management and ensure sustainable resource utilization.
To address this issue, since 2023, the Korean government has started reporting official statistics on recreational fisheries, including catch data for hairtail. This marks an important step in improving data availability for resource assessments. With more reliable recreational catch data expected in the future, stock assessments will become more accurate, providing better support for sustainable fisheries management. Future efforts should focus on refining estimation methods and expanding data collection on recreational fishing effort and catch rates to reduce uncertainties associated with reconstructed estimates.
The MGMS method was applied to integrate CPUE data from eight different fisheries, ensuring a standardized abundance index across multiple gear types [23]. This approach can be widely used in fisheries assessments where catchability varies among gear types, allowing for more consistent and comparable abundance trends. In the simulation study by Gibson-Reinemer et al. [23] MGMS consistently produced the highest mean correlation coefficient with true community structure under various conditions and showed fewer instances of poor model performance compared to conventional methods such as simple summation or relative abundance transformation. Moreover, in models incorporating multiple CPUE indices—such as Model 1 and Model 3—parameter estimation tends to be more complex and potentially biased due to gear-specific variability. By contrast, MGMS consolidates these inputs into a single standardized index, simplifying the model structure and reducing estimation bias. For example, as shown in Table 2, models employing MGMS (Model 2 and Model 4) exhibited narrower credible intervals for key parameter estimates. The estimated SMSC values showed temporal fluctuations corresponding to changes in fishery-specific CPUE trends, highlighting the necessity of incorporating multiple data sources when evaluating stock status. The findings align with previous studies demonstrating that single-gear CPUE indices often fail to capture species-wide abundance trends [32].
As summarized in Table 1, Models 1 and 2 incorporated reconstructed recreational catch data in addition to commercial catch, whereas Models 3 and 4 relied solely on commercial catch data. The inclusion of recreational catch notably influenced stock assessment outcomes, as evidenced by the higher estimates of B/BMSY and MSY in Models 1 and 2 (Table 2). These results imply that assessments excluding recreational removals may underestimate total fishing mortality and overstate the degree of stock depletion. This result is consistent with past studies emphasizing that incomplete catch data can bias model estimates, leading to incorrect management decisions [13].
Given the growing importance of recreational fishing in Korean coastal fisheries, particularly for species like hairtail, we emphasize the need for institutional mechanisms to monitor and integrate recreational catches into national stock assessment frameworks. Policymakers should consider implementing standardized reporting systems and periodic surveys for recreational fisheries to improve data accuracy and coverage. In the absence of robust recreational data, assessment models may lead to biased management decisions that fail to capture the full spectrum of fishing pressure. Therefore, the integration of recreational catch information is not only methodologically significant but also essential for the development of sustainable and equitable fisheries policies.
Between Model 1 and Model 2, key differences in estimated stock status emerged. Model 2, which used an integrated abundance index (SMSC), estimated higher values of MSY and B/BMSY, suggesting a more optimistic stock condition. In contrast, Model 1, which accounted for individual fishery-specific abundance trends (MSC), yielded more conservative estimates, indicating slightly lower biomass and higher fishing pressure. Given the inherent uncertainty in data-limited assessments, a precautionary approach is essential for effective fisheries management. While Model 2 suggests a more favorable stock status, a precautionary management strategy should consider the more conservative estimates from Model 1, ensuring that resource sustainability is not compromised.
The differences in model performance can be attributed to the structure and sensitivity of each model to input data. Model 2 yielded higher MSY and B/BMSY estimates due to the smoothing effect of the integrated CPUE index (SMSC), which may mask fishery-specific variability. In contrast, Model 1, which incorporated multiple fishery-specific indices (MSC), captured inter-fishery differences but resulted in wider credible intervals. These discrepancies suggest a trade-off between model simplicity and sensitivity, and highlight the importance of considering model structure when interpreting stock assessment outcomes. Incorporating both model types provides a more comprehensive perspective and helps improve confidence in the assessment results.
The 95% credible intervals shown in Table 2 provide important insights into the uncertainty surrounding key biological parameters and reference points. The relative biomass at the end of the time series (B/BMSY) exhibited notable variability. Model 1 estimated B/BMSY at 1.03 (0.48–1.82), whereas Model 2 produced a higher and more optimistic estimate of 1.36 (0.73–2.37). These differences imply that the interpretation of stock status—whether the stock is overfished or above the MSY benchmark—can differ depending on the data and model assumptions. The broad credible intervals suggest that while point estimates are above the threshold (B/BMSY > 1), there remains a non-negligible probability that the stock could still be below MSY levels.
All models demonstrated good convergence diagnostics, with r-hat values below 1.02, indicating effective posterior sampling [29]. The use of four Markov chains with 5000 iterations per chain and a warm-up period of 2500 iterations ensured robust parameter estimation. Bayesian surplus production models have been widely applied in data-limited fisheries due to their ability to incorporate prior knowledge and account for uncertainty [26]. Our study reaffirms the utility of this approach in multi-fishery stock assessments.
While Bayesian surplus production models offer flexibility and the ability to incorporate prior knowledge and uncertainty, they are not without limitations. One key consideration is the potential influence of prior distributions on posterior estimates, particularly when data are sparse or uncertain. In this study, we followed general recommendations from Froese et al. [28] to set informative priors for intrinsic growth rate (r) and carrying capacity (K), while using non-informative priors for parameters such as initial biomass (p) and catchability coefficient (q) to minimize their influence. Although this approach ensured consistency with previous studies, it may not fully capture the ecological and fishery-specific characteristics of Korean waters. In future applications, we recommend developing empirically based priors tailored to the biological and fisheries context of the Korean hairtail stock.
Bayesian models also tend to be computationally intensive due to the use of Markov Chain Monte Carlo (MCMC) sampling methods, which may limit their practicality for real-time management or extensive scenario testing. Moreover, the reliability of Bayesian inference depends heavily on data quality; highly uncertain or inconsistent data sources may increase posterior uncertainty or lead to unstable estimates [33].
Compared to traditional frequentist methods, Bayesian models provide full probability distributions for estimated parameters, allowing for a more nuanced interpretation of uncertainty. However, frequentist approaches may be preferred in cases where computational efficiency is critical or when objective priors are difficult to justify. A complementary use of both frameworks could provide a more balanced view for decision-making in fisheries management [34].
The Bayesian surplus production model is well-suited for data-limited situations; however, it does not account for age-structured population dynamics. Future assessments should explore age-structured models, such as statistical catch-at-age or integrated assessment models, which can provide more detailed insights into stock dynamics. As more data become available, shifting toward age-structured modeling will improve stock assessment reliability and facilitate more precise fisheries management.
Although this study focused on the hairtail fishery in Korean coastal waters, the modeling framework and reconstruction approach employed here are applicable to other data-limited, multi-fishery contexts. The integration of reconstructed recreational catches and standardized CPUE indices using MGMS can be adapted to other regions or species where multiple sectors contribute to total removals and where comprehensive catch records are lacking.
However, several region-specific factors should be considered when applying this approach elsewhere. For example, the high spatial and temporal concentration of hairtail recreational fishing in Korea, along with the recent availability of detailed user effort data, played a crucial role in enabling reconstruction. In regions lacking such auxiliary data or where recreational fishing practices differ substantially, alternative effort proxies or assumptions may be required. Additionally, species-specific life history traits and fleet compositions may affect model sensitivity and the selection of appropriate priors. Therefore, while the framework is broadly transferable, successful application in other contexts requires tailoring to the ecological, social, and data environments of the target fishery.
This study provides a comprehensive assessment of hairtail stocks, but some limitations remain. The reconstructed recreational catch estimates rely on extrapolations from a single year of official data, which introduces potential uncertainty in historical estimates. Future studies should aim to refine these estimates by incorporating additional survey data on recreational fishing effort and catch rates [15].

5. Conclusions

This study demonstrates the importance of integrating reconstructed catch data and multiple fisheries information into stock assessments to improve the accuracy and reliability of fisheries management. The application of a Bayesian surplus production model enabled a comprehensive evaluation of stock dynamics under a data-limited situation. As more reliable recreational fishing data become available, future assessments should incorporate these data while transitioning toward more data-intensive approaches, such as age-structured models. A precautionary management approach, guided by the more conservative estimates of Model 1, is recommended to ensure long-term sustainability and resilience of the hairtail fishery in Korean waters.

Author Contributions

Conceptualization, H.K.; methodology, H.K. and S.C.Y.; writing—original draft preparation, H.K., M.-J.K. and S.C.Y.; writing—review and editing, H.K., M.-J.K., S.C.Y. and M.-J.C.; visualization, H.K. All authors have read and agreed to the published version of the manuscript.

Funding

This research was funded by NIFS (National Institute of Fisheries Science) grant number R2025002.

Institutional Review Board Statement

Not applicable.

Informed Consent Statement

Not applicable.

Data Availability Statement

The raw data supporting the conclusions of this article will be made available by the authors on request.

Acknowledgments

We sincerely thank to the anonymous reviewers for their insightful comments and constructive feedback, which greatly helped improve the quality of this article.

Conflicts of Interest

The authors declare no conflicts of interest.

Abbreviations

The following abbreviations are used in this manuscript:
CPUECatch Per Unit Effort
MGMSMultiGear Mean Standardization
MSCMean Standardized Catch
SMSCSummation of Mean Standardized Catch
EEZExclusive Economic Zone
MSYMaximum Sustainable Yield
HMCHamiltonian Monte Carlo

Appendix A

This appendix provides the Stan code used to implement the Bayesian surplus production model for multiple fisheries.
Listing A1. Stan code for Bayesian surplus production model
  • data  {
      int <lower = 0> N;  //  Number of years
      int <lower = 0> F;  //  Number of fisheries
      vector [N]  C;  //  Total Catch for N years
      matrix [F,  N] I;  //  Multiple fisheries (F) CPUE for N years
    }
    parameters  {
      vector <lower = 0.01,  upper = 1.0> [N]  P;
      real <lower = 0.01,  upper = 1.0>  P_ini;
      real <lower = 0.01>  r;  //  intrinsic growth rate (r)
      real <lower = 0.01>  K;  //  carrying capacity (k)
      array [F]  real <lower = 0>  q;  //  catchability (q)
      array [F]  real <lower = 0>  tau2;  //  obs. error
      real <lower = 0>  sigma2;  //  process error
    }
    transformed  parameters  {
      vector [N]  Pmed;
      matrix [F,  N]  Imed;
      real  sigma;
      array [F]  real  tau;
      sigma  =  sqrt (sigma2);
      for  (f  in  1:F)  tau [f]  =  sqrt (tau2 [f]);
      Pmed[1]  =  P_ini;
      for  (n  in  2:N)  Pmed[n] = log(P[n − 1] + r ∗ P[n − 1] ∗ (1 − P[n − 1]) − C[n − 1]/K);
      for  (f  in  1:F)   {
      for  (n  in  1:N)  Imed[f,  n]  =  log(q[f] ∗ K ∗ P[n]);  //1
      };
    }
    model  {
      //Priors
      P_ini  ~  lognormal (log(0.8), 0.472);  // cv = 0.5
      K  ~  lognormal (log(940231), 0.294);  //cv = 0.3
      r  ~  lognormal (log(0.5), 0.294);  // cv = 0.3
      sigma  ~  lognormal (log(0.3), 0.833);  // cv = 1.0
      for  (f  in  1:F)  q[f]  ~  uniform (0, 1);   // uninformative prior
      for  (f  in  1:F)  tau[f]  ~  lognormal (log(0.3), 0.833);  // cv = 1.0
  •   // Joint  likelihoods
      P[1]  ~  lognormal (Pmed[1], sigma);
      for  (n  in  2:N)  P[n]  ~  lognormal (Pmed[n],sigma);
      for  (f  in  1:F)    {
      for  (n  in  1:N)  I[f, n]  ~  lognormal (Imed[f,  n],tau[f]);
      };
    }
    generated  quantities  {
      vector [N]  B;
      real  MSY;
      real  B_MSY;
      real  H_MSY;
  •   // Biomass
      for  (n  in  1:N)  B[n]  =  P[n] ∗ K;
      MSY  =  r ∗ K/4;
      B_MSY  =  K/2;
      F_MSY  =  r ∗ . 5;
    }

References

  1. Statistics Korea. Fishery Production Statistics. 2025. Available online: https://www.kosis.kr/index/index.do (accessed on 18 January 2025).
  2. Nam, J.; Cho, H. Estimation of the Optimal Harvest and Stock Assessment of Hairtail Caught by Multiple Fisheries. Ocean. Polar Res. 2018, 40, 237–247. [Google Scholar] [CrossRef]
  3. Millar, R.B.; Meyer, R. Non-Linear State Space Modelling of Fisheries Biomass Dynamics by Using Metropolis-Hastings within-Gibbs Sampling. J. R. Stat. Soc. Ser. Appl. Stat. 2002, 49, 327–342. [Google Scholar] [CrossRef]
  4. Punt, A.E.; Szuwalski, C. How well can FMSY and BMSY be estimated using empirical measures of surplus production? Fish. Res. 2012, 134–136, 113–124. [Google Scholar] [CrossRef]
  5. Liang, C.; Xian, W.; Pauly, D. Assessments of 15 exploited fish stocks in Chinese, South Korean and Japanese waters using the CMSY and BSM methods. Front. Mar. Sci. 2020, 7, 623. [Google Scholar] [CrossRef]
  6. Hyun, S.Y.; Kim, K. An evaluation of estimability of parameters in the state-space non-linear logistic production model. Fish. Res. 2022, 245, 106135. [Google Scholar] [CrossRef]
  7. Pascoe, S.; Hutton, T.; Hoshino, E.; Sporcic, M.; Yamasaki, S.; Kompas, T. Effectiveness of harvest strategies in achieving multiple management objectives in a multispecies fishery. Aust. J. Agric. Resour. Econ. 2020, 64, 700–723. [Google Scholar] [CrossRef]
  8. Winker, H.; Carvalho, F.; Thorson, J.T.; Kell, L.T.; Parker, D.; Kapur, M.; Sharma, R.; Booth, A.J.; Kerwath, S.E. JABBA-Select: Incorporating life history and fisheries’ selectivity into surplus production models. Fish. Res. 2020, 222, 105355. [Google Scholar] [CrossRef]
  9. An, D.; Kim, K.; Kang, H.; Hyun, S.Y. A Bayesian State-space Production Assessment Model for Common Squid Todarodes pacificus Stock Caught by Multiple Fisheries in Korean Waters. Korean J. Fish. Aquat. Sci. 2021, 54, 769–781. [Google Scholar] [CrossRef]
  10. FAO. The State of World Fisheries and Aquaculture 2024; FAO: Rome, Italy, 2024; p. 264. [Google Scholar] [CrossRef]
  11. Zeller, D.; Pauly, D. Good news, bad news: Global fisheries discards are declining, but so are total catches. Fish Fish. 2005, 6, 156–159. [Google Scholar] [CrossRef]
  12. Zeller, D.; Booth, S.; Pakhomov, E.; Swartz, W.; Pauly, D. Arctic fisheries catches in Russia, USA, and Canada: Baselines for neglected ecosystems. Polar Biol. 2011, 34, 955–973. [Google Scholar] [CrossRef]
  13. Zeller, D.; Harper, S.; Zylich, K.; Pauly, D. Synthesis of underreported small-scale fisheries catch in Pacific island waters. Coral Reefs 2015, 34, 25–39. [Google Scholar] [CrossRef]
  14. Pauly, D.; Zeller, D. Catch reconstructions reveal that global marine fisheries catches are higher than reported and declining. Nat. Commun. 2016, 7, 10244. [Google Scholar] [CrossRef] [PubMed]
  15. Zeller, D.; Cashion, T.; Palomares, M.L.D.; Pauly, D. Global marine fisheries discards: A synthesis of reconstructed data. Fish Fish. 2018, 19, 30–39. [Google Scholar] [CrossRef]
  16. Tsui, G.; Derrick, B.; de Leon, S.; Parducho, V.; Popov, S.; Noël, S.L.; Relano, V.; Zhang, C.I. Countries of the northwest Pacific: Updating catch reconstructions to 2018. In Updating to 2018 the 1950–2010 Marine Catch Reconstructions of the Sea Around Us. Part II: The Americas and Asia-Pacific; Derrick, B., Khalfallah, M., Relano, V., Zeller, D., Pauly, D., Eds.; Fisheries Centre Research Report; Fisheries Centre, University of British Columbia: Vancouver, BC, USA, 2020; Volume 28, pp. 102–121. [Google Scholar]
  17. Shon, S.; Harper, S.; Zeller, D. Reconstruction of marine fisheries catches for the Republic of Korea (South Korea) from 1950–2010. Fish. Cent. Work. Pap. 2014, 2014, 1–13. [Google Scholar]
  18. Korea Law Information Center. Enforcement Decree of the Fishery Resources Management Act. 2025. Available online: https://www.law.go.kr/LSW/main.html (accessed on 20 January 2025).
  19. Kim, Y.H.; Yoo, J.T.; Lee, E.H.; OH, T.Y.; Lee, D.W. Age and Growth of Largehead Hairtail Trichiurus lepturus in the East China Sea. Korean J. Fish. Aquat. Sci. 2011, 44, 695–700. [Google Scholar] [CrossRef]
  20. Lee, S.J.; Han, S.H.; Kim, M.J. Occurrence of the Eggs of Hairtail, Trichiurus japonicus in the Coastal Waters of Jeju Island, Korea in Spring. J. Korean Soc. Fish. Technol. 2020, 56, 11–20. [Google Scholar] [CrossRef]
  21. Kim, D.G.; Seong, G.C.; Kang, D.Y.; Jin, S.; Soh, H.Y.; Baeck, G.W. Diet Composition and Feeding Strategy of Largehead Hairtail, Trichiurus japonicus in the South Sea of Korea. Korean J. Ichthyol. 2023, 35, 11–20. [Google Scholar] [CrossRef]
  22. Zhang, C.I.; Sohn, M.H. A Study on the Stock Assessment and Management Implications of the Hairtail, Trichiurus lepturus Linne in Korean Waters 2. Variations in Population Biomass of the Hairtail, Trichiurus lepturus Linne in Korean Waters. Korean J. Fish. Aquat. Sci. 1997, 30, 620–626. [Google Scholar]
  23. Gibson-Reinemer, D.K.; Ickes, B.S.; Chick, J.H. Development and assessment of a new method for combining catch per unit effort data from different fish sampling gears: Multigear mean standardization (MGMS). Can. J. Fish. Aquat. Sci. 2017, 74, 8–14. [Google Scholar] [CrossRef]
  24. Jackson, D.A.; Harvey, H.H. Qualitative and quantitative sampling of lake fish communities. Can. J. Fish. Aquat. Sci. 1997, 54, 2807–2813. [Google Scholar] [CrossRef]
  25. Hinch, S.G.; Collins, N.C.; Harvey, H.H. Relative Abundance of Littoral Zone Fishes: Biotic Interactions, Abiotic Factors, and Postglacial Colonization. Ecology 1991, 72, 1314–1324. [Google Scholar] [CrossRef]
  26. Meyer, R.; Millar, R.B. BUGS in Bayesian stock assessments. Can. J. Fish. Aquat. Sci. 1999, 56, 1078–1087. [Google Scholar] [CrossRef]
  27. Stan Development Team. RStan: The R Interface to Stan, R package version 2.26.24; Stan Development Team: Los Angeles, ON, USA, 2023. [Google Scholar]
  28. Froese, R.; Demirel, N.; Coro, G.; Kleisner, K.M.; Winker, H. Estimating fisheries reference points from catch and resilience. Fish Fish. 2017, 18, 506–526. [Google Scholar] [CrossRef]
  29. Gelman, A.; Carlin, J.; Stern, H.; Dunson, D.; Vehtari, A.; Rubin, D. Bayesian Data Analysis, 3rd ed.; Chapman & Hall/CRC Texts in Statistical Science; Taylor & Francis: Abingdon, UK, 2013. [Google Scholar]
  30. Pauly, D.; Zeller, D. Catch Reconstruction: Concepts, Methods, and Data Sources. 2015. Available online: https://www.seaaroundus.org/doc/Methods/CatchReconstructionMethod/Methods-Catch-tab-Sept-25-2015(1).pdf (accessed on 11 January 2025).
  31. Us, S.A. Sea Aroud Us: Catches by Taxon in the Waters of Korea (South). 2025. Available online: https://www.seaaroundus.org/data/#/eez/410?chart=catch-chart&dimension=taxon&measure=tonnage&limit=10 (accessed on 11 January 2025).
  32. Maunder, M.N.; Punt, A.E. Standardizing catch and effort data: A review of recent approaches. Fish. Res. 2004, 70, 141–159. [Google Scholar] [CrossRef]
  33. Chen, Y. Quality of fisheries data and uncertainty in stock assessment. Sci. Mar. 2003, 67, 75–87. [Google Scholar] [CrossRef]
  34. Monnahan, C.C.; Branch, T.A.; Thorson, J.T.; Stewart, I.J.; Szuwalski, C.S. Overcoming long Bayesian run times in integrated fisheries stock assessments. ICES J. Mar. Sci. 2019, 76, 1477–1488. Available online: http://arxiv.org/abs/https://academic.oup.com/icesjms/article-pdf/76/6/1477/31247349/fsz059.pdf (accessed on 15 January 2025). [CrossRef]
Figure 1. Study area for hairtail stock in Korean waters.
Fishes 10 00166 g001
Figure 2. Reconstructed catch of hairtail from 2000 to 2024. The hatched bars represent the reconstructed catch (left y-axis), while the blue circles and red squares indicate the trends of relative fishing effort ( F r e l ) for recreational fishery and relative abundance index ( I r e l ), respectively (right y-axis).
Fishes 10 00166 g002
Figure 3. Total reconstructed catch, including commercial and recreational fishing, from 2000 to 2024.
Fishes 10 00166 g003
Figure 4. Estimated mean standardized catch (MSC) values for each fishery from 2000 to 2024 using the multigear mean standardization (MGMS) method [23]. The stacked bars represent the MSC values of eight fisheries, and the total height of each bar represents the summation of MSC (SMSC), which is obtained by summing MSC values from all fisheries.
Fishes 10 00166 g004
Figure 5. Estimated MSC-based abundance index trends for each fishery from Model 1. The blue lines represent posterior mean estimates of MSC, the shaded areas indicate 95% credible intervals, and the red dots denote observed MSC values.
Fishes 10 00166 g005
Figure 6. Estimated SMSC trends from Model 2. The blue line represents posterior mean SMSC estimates, the shaded area denotes the 95% credible interval, and the red dots indicate observed SMSC values. Unlike Model 1, which estimates MSC values for each fishery separately, Model 2 integrates all fisheries into a single standardized abundance index.
Fishes 10 00166 g006
Figure 7. Kobe plot for Model 1, showing the estimated biomass ( B / B M S Y ) and fishing mortality ( F / F M S Y ) trajectories from 2000 to 2024. The color gradient of blue dots represents the temporal progression, with darker shades indicating earlier years. The contour lines illustrate the 95% credible intervals for the estimates in 2024.
Fishes 10 00166 g007
Figure 8. Kobe plot for Model 2, which integrates abundance indices across multiple fisheries to estimate overall stock dynamics. The blue dots represent annual estimates, with darker shades indicating earlier years. The contour lines show the 95% credible intervals for 2024.
Fishes 10 00166 g008
Table 1. Description of the four Bayesian surplus production models used for stock assessment.
ModelCatch DataAbundance Data
Model 1Commercial [1] + Recreational (reconstructed) dataMultiple indices ( M S C k )
Model 2Commercial [1] + Recreational (reconstructed) dataIntegrated index ( S M S C )
Model 3Commercial [1] data onlyMultiple indices ( M S C k )
Model 4Commercial [1] data onlyIntegrated index ( S M S C )
Table 2. Estimated key parameters and reference points from the four models. Values in parentheses represent the 95% credible intervals.
ParametersModel 1Model 2Model 3Model 4
r0.538 (0.328–0.813)0.448 (0.275–0.680)0.528 (0.321–0.798)0.444 (0.272–0.668)
MSY (mt)66,446 (42,434–102,457)89,556 (50,806–154,062)64,633 (40,188–100,572)87,616 (49,211–152,595)
FMSY0.269 (0.164–0.407)0.224 (0.137–0.340)0.264 (0.160–0.399)0.222 (0.136–0.334)
last B/BMSY1.03 (0.48–1.82)1.36 (0.73–2.37)1.04 (0.47–1.89)1.37 (0.72–2.40)
Disclaimer/Publisher’s Note: The statements, opinions and data contained in all publications are solely those of the individual author(s) and contributor(s) and not of MDPI and/or the editor(s). MDPI and/or the editor(s) disclaim responsibility for any injury to people or property resulting from any ideas, methods, instructions or products referred to in the content.

