Article

DNA Barcoding of the Genus Discogobio (Teleostei, Cyprinidae) in China

School of Life Sciences, Guizhou Normal University, Guiyang 550025, China
*
Author to whom correspondence should be addressed.
Fishes 2025, 10(4), 157; https://doi.org/10.3390/fishes10040157
Submission received: 26 February 2025 / Revised: 30 March 2025 / Accepted: 1 April 2025 / Published: 3 April 2025
(This article belongs to the Special Issue Fish DNA Barcoding)

Abstract

Discogobio is a genus of small, economically important freshwater fishes that are widely distributed in Southwestern China. The species of the genus are morphologically very similar, which makes their taxonomic identification quite challenging. DNA barcoding technology can identify species at the molecular level, thus overcoming the limitations of morphological classification. In this study, we collected 16 morphological species of Discogobio from China, analyzed the mitochondrial cytochrome oxidase I subunit (COI) gene sequences of 206 samples, and applied DNA barcoding to identify the species. The COI amplicon was 651 bp in length, and the mean base contents were: (T) 28.83%, (C) 27.63%, (A) 25.97%, (G) 17.57%. The AT content (54.8%) was higher, and the base composition was biased. The intraspecific differences in the genus Discogobio were not significant, and the genetic distances were all less than 2%. The average interspecific genetic distances (3.94%) were about 18.8 times the average intraspecific genetic distances (0.21%), suggesting that there are barcode gaps among the species of the genus Discogobio. Five different species definition methods, Automatic Barcode Gap Discovery (ABGD), Assemble Species by Automatic Partitioning (ASAP), Bayesian Poisson Tree Process (bPTP), Generalized Mixed Yule Combination (GMYC), and Refined Single Linkage (RESL), were used to infer molecular operational taxonomic units (MOTU). The number of MOTUs ranged from 9 to 18. Phylogenetic analysis based on COI gene haplotypes showed that most species formed well-evolved branches on the phylogenetic tree, and the clustering among species was obvious without mixing. The results of this study provide reliable DNA barcoding information for species identification within the genus Discogobio, which is of great significance for taxonomic identification.
Key Contribution: This study applied DNA barcoding to identify 16 species of the genus Discogobio, including 11 known species and 5 undetermined species, revealing significant barcode gaps with average interspecific genetic distances 18.8 times greater than the intraspecific distances. By employing five species delimitation methods and phylogenetic analysis, the research provides reliable molecular data for the taxonomic classification of Discogobio, overcoming the challenges posed by their morphological similarities.

1. Introduction

Traditional morphological identification and classification primarily rely on the phenotypic characters of species [1]. However, species identification accuracy can be compromised by intrinsic genetic variations, environmental influences, sexual dimorphism, and developmental stages, potentially leading to misclassification of morphologically similar species [1,2]. The availability of widespread molecular tools has opened up new possibilities for alternative identification methods [3,4]. Since its introduction by Paul Hebert et al. in 2003, DNA barcoding has emerged as a robust technique that utilizes specific genomic regions characterized by both conserved and variable sequences, enabling rapid and accurate species discrimination [3,5,6]. This molecular approach not only circumvents limitations inherent in morphological characterization but also facilitates the establishment of comprehensive nucleotide sequence databases, thereby addressing several fundamental constraints of traditional morphological taxonomy [3,5].
DNA barcoding technology has been widely used in the classification and identification of species, the evaluation of biodiversity, and other related research [4,7]. Mitochondrial DNA is commonly used as a molecular marker in the study of DNA barcoding in animal groups [8]. It has proven useful as a marker for the classification and identification of different species and has solved many problems of fish classification and system evolution [8,9]. Notably, the mitochondrial cytochrome C oxidase subunit I (COI) gene has a moderate evolutionary rate and is easy to amplify using universal polymerase chain reaction primers. As a result, it has been applied to many fish taxonomic studies [10,11,12].
The genus Discogobio is a member of the subfamily Labeoninae, family Cyprinidae, order Cypriniformes. It is distinguished as a genus by its unique disc-shaped structure, whose anterior and lateral edges are greatly protruded to form a prominent horseshoe-shaped skin fold superficially covered with papillae [13]. Species of Discogobio are small benthic fishes adapted to fast-flowing aquatic environments [14]. Based on taxonomic records from Eschmeyer’s Catalog of Fishes and relevant ichthyological literature, the genus currently comprises 16 valid species [15]. Among these, four species are endemic to the freshwater systems of Vietnam, while the remaining twelve species are primarily distributed across three major river basins in Southwest China: the Nanpanjiang River, the Yuanjiang River, and the Pearl River systems, spanning the provinces of Guizhou, Yunnan, and Guangxi [15].
The species within the genus Discogobio share similar morphological characters, making taxonomic identification quite challenging. Since the establishment of the genus Discogobio, its taxonomic system has undergone many adjustments and refinements, and for a long time, there was only one species, D. tetrabarbatus [16]. Subsequent discoveries through improved collection and identification techniques have expanded the genus to include 12 recognized species in China. Wu et al. described D. longibarbatus and moved D. yunnanensis into the genus Discogobio [17]. Huang later described four new species, D. polylepis, D. macrophysallidos, D. elongatus, and D. brachyphysallidos [18]. Additionally, Chu et al. described two new species, D. bismargaritus, and D. laticeps [19]. Subsequently, D. multilineatus was described from Guangxi [20]. Zheng et al. described three new species, D. antethoracalis, D. propeanalis, and D. poneventralis [21]. The discovery of these new species enriched the taxonomic system of the genus Discogobio.
Some species within the genus Discogobio are easier to recognize because of their unique characters, such as D. tetrabarbatus with a unique rostrum and D. longibarbatus with well-developed barbels [16,17,19]. However, most congeners exhibit extensive overlap in key diagnostic characters, including lateral line scale counts, vertebral numbers, and air bladder morphology, resulting in repeated taxonomic revisions [19]. Notable cases highlight the limitations of traditional morphological approaches. Discogobio yunnanensis and D. brachyphysallidos were initially distinguished based on minor differences in pectoral–abdominal scale coverage [17,18,19]. However, subsequent studies have revealed significant overlaps in scale coverage patterns across geographically distinct populations, undermining their diagnostic reliability [22]. Similarly, the taxonomic status of D. macrophysallidos and D. polylepis has undergone multiple revisions. Initially, D. macrophysallidos and D. polylepis were separated by lateral line scale counts [18], later synonymized due to overlapping morphological characters [19], and ultimately revalidated through structural analysis of lateral line scale continuity, reinstating the validity of D. polylepis [21]. These controversies underscore the inherent limitations of single-trait classification strategies in addressing microgeographic adaptations and phenotypic plasticity [22].
Traditional taxonomy of the genus Discogobio usually relies on subjective prioritization of morphological traits by researchers, with the absence of standardized criteria for weighting different characters, resulting in instability in taxonomic outcomes. This phenomenon further underscores the necessity of integrating molecular evidence (e.g., DNA barcoding) to enhance objectivity in species delineation [19,22]. In this study, we utilized the COI gene to analyze the classification of Discogobio specimens collected from China. Additionally, we evaluated the efficacy of the COI gene as a DNA barcode for the molecular classification of Discogobio species, aiming to provide a robust taxonomic foundation for the classification of Discogobio species in China.

2. Materials and Methods

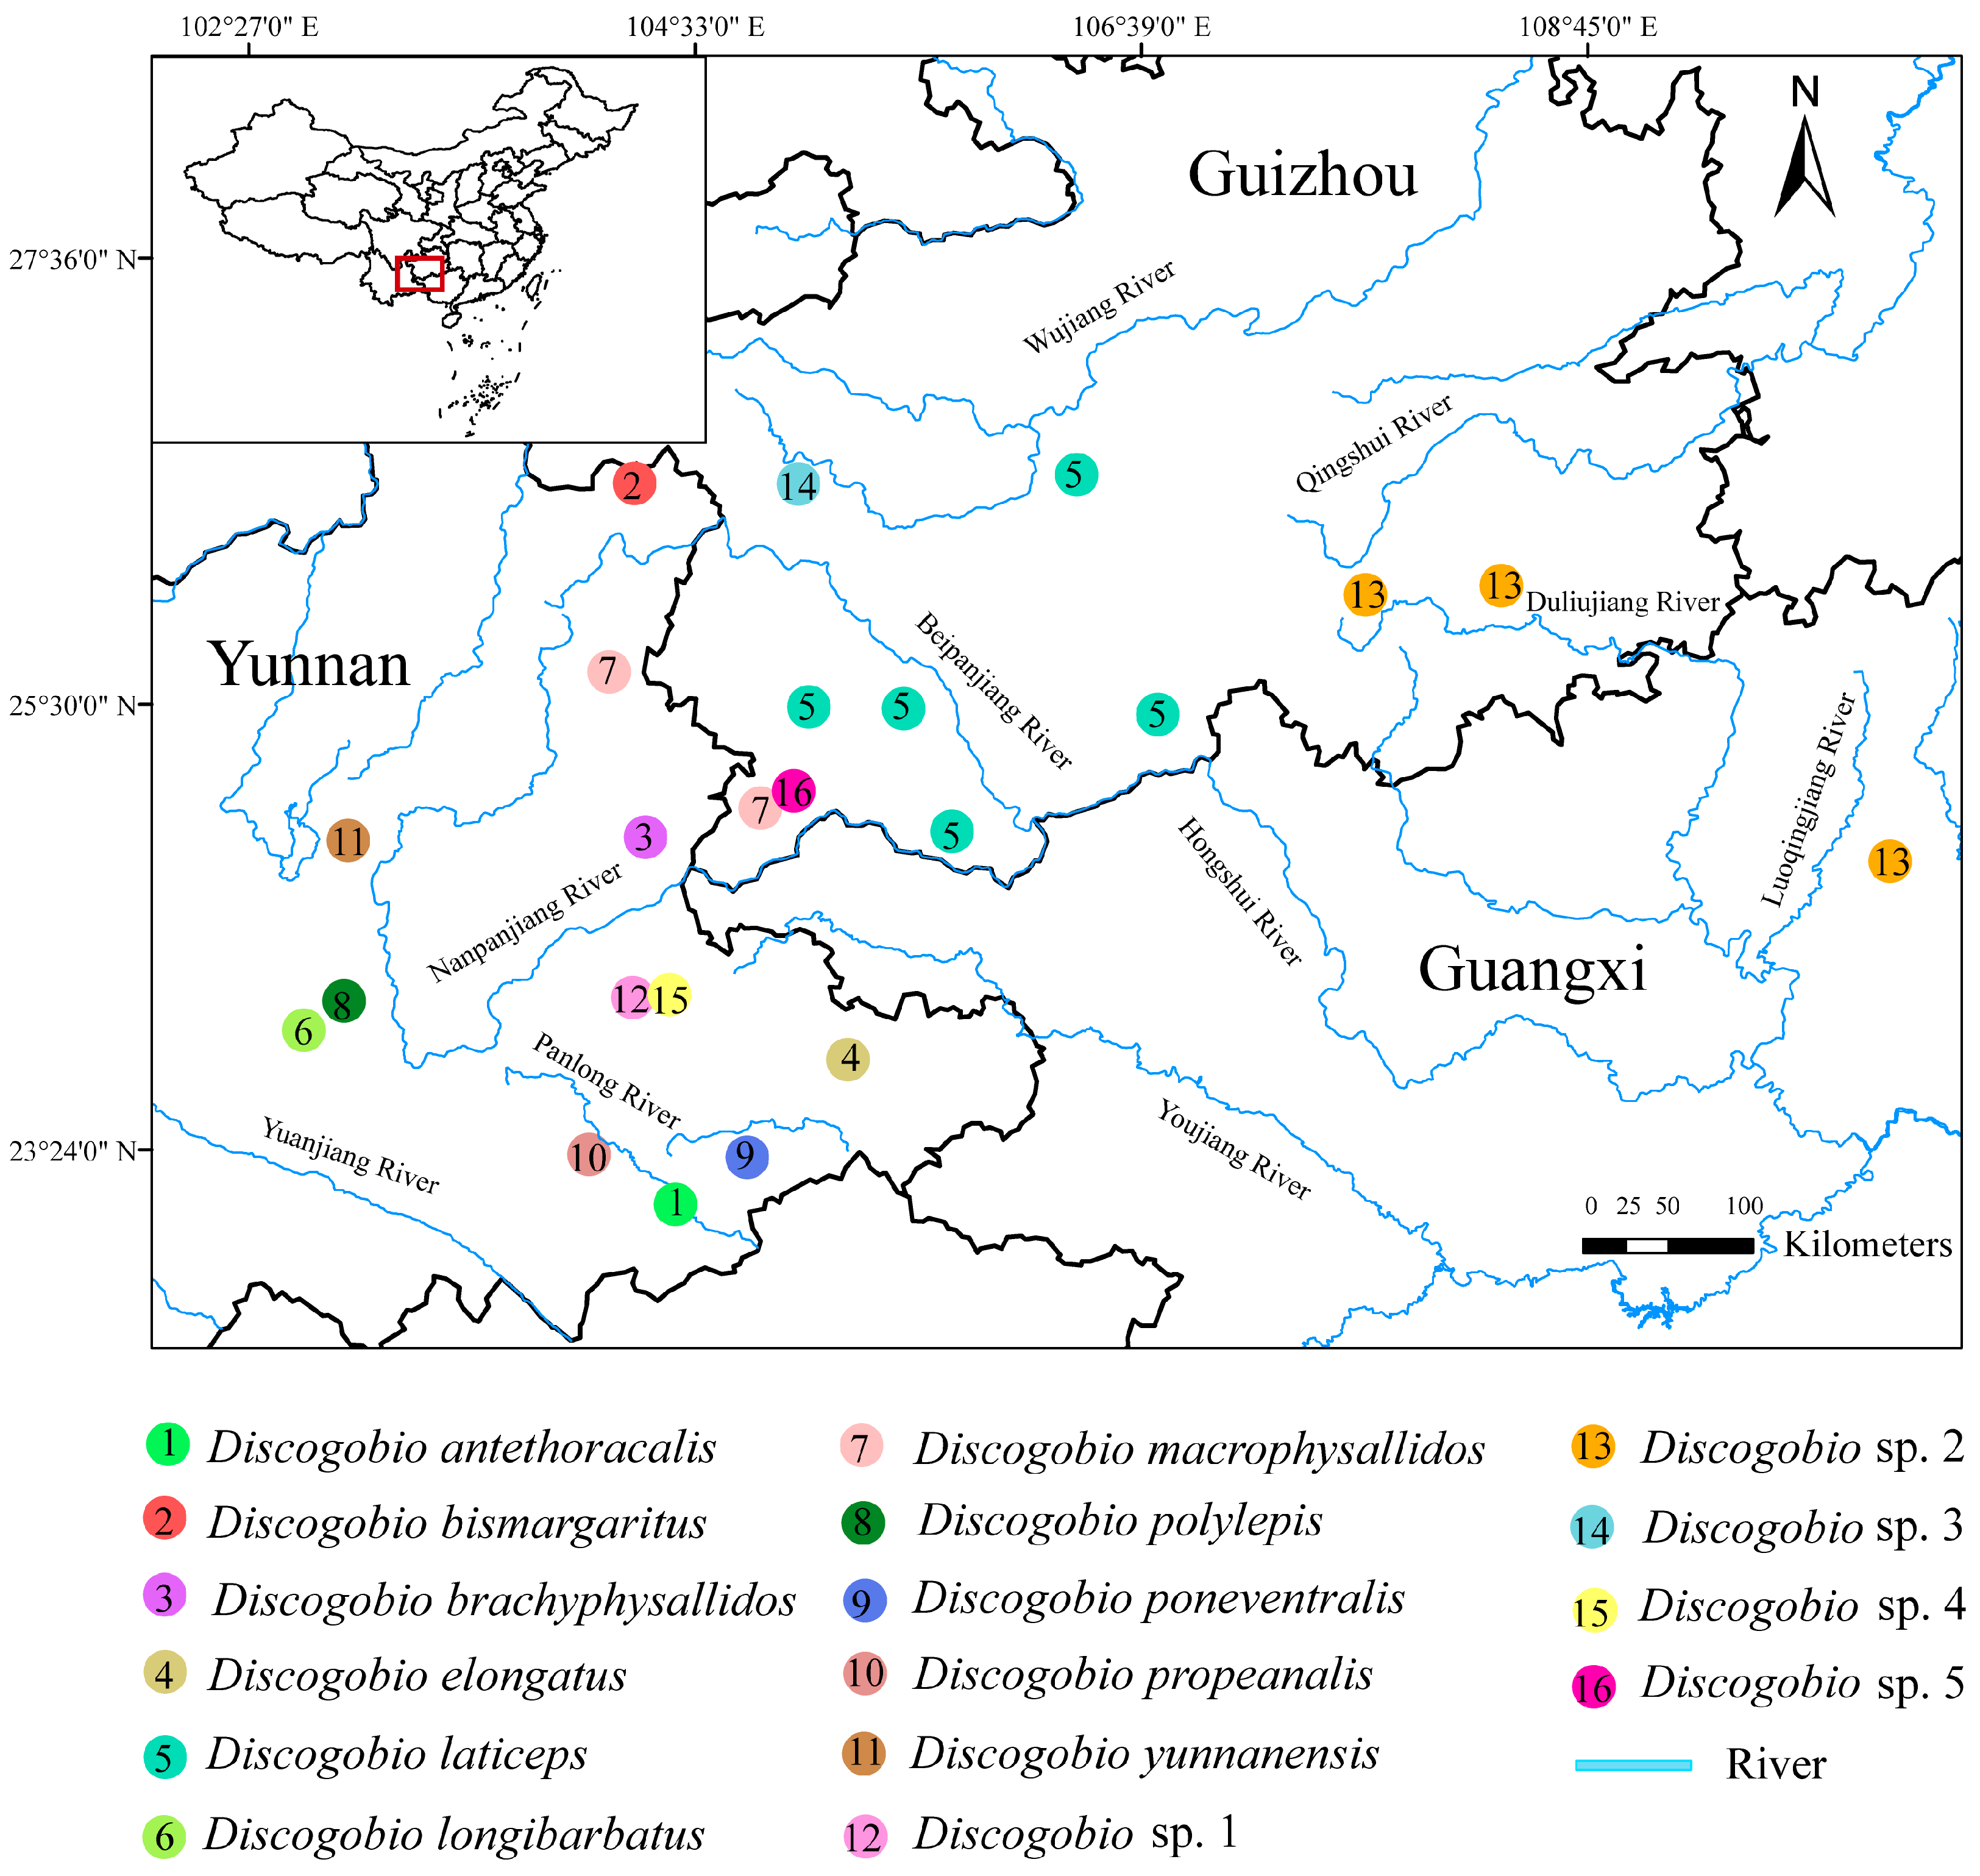
2.1. Sample Collection and Identification

Field collections adhered to the Guide to Collection, Preservation, Identification and Information Share of Animal Specimens [23] and the Implementation Rules of the Fisheries Law of the People’s Republic of China. From 2020 to 2024, we conducted extensive sampling of the genus Discogobio across 23 distinct locations spanning Guizhou, Yunnan, and Guangxi Provinces in China (Figure 1 and Table 1). Specimen identification was performed through comprehensive morphological examination and verification against relevant regional records and literature. All collected specimens were preserved in 75% ethanol and stored at the School of Life Sciences, Guizhou Normal University, Guiyang City, Guizhou Province, China.

2.2. DNA Extraction, Amplification, and Sequencing

Genomic DNA was extracted from the muscle of the species (right side) using a standard high-salt method [24]. The integrity of the genomic DNA was assessed using 1% agarose gel electrophoresis. The cytochrome c oxidase subunit I (COI) barcode region (651 bp) was then amplified using universal primers: COIF1 (5′-TCAACCAACCACAAAGACATTGGCAC-3′) and COIR1 (5′-TAGACTTCTGGGTGGCCAAAGAATCA-3′) [25]. The PCR assay was performed in a reaction volume of 35 µL, containing 1 µL of template DNA, 1 µL of each primer, 17.5 µL of 2 × Taq Plus MasterMix (Cowin Biotech, Taizhou, China), and 14.5 µL of distilled water. The PCR reactions were performed under the following conditions: initial denaturation at 95 °C for 5 min, followed by 35 cycles of denaturation at 95 °C for 45 s, annealing at 55 °C for 30 s, and extension at 72 °C for 45 s, and a final extension at 72 °C for 10 min. Using electrophoresis applied to 1% agarose gels, positive amplification was assessed and the fragment lengths were compared to those of a DL2000 DNA marker (Beijing Biomed Gene Technology Co., Ltd., Beijing, China). The PCR products were delivered to Sangon Biotech (Shanghai, China) for bidirectional sequencing.

2.3. Sequence Characterization, Genetic Distance, and Phylogenetic Analysis

Sequence chromatograms and alignments were visually inspected and assembled using Seqman from the DNASTAR Lasergene package (DNASTAR, Inc., Madison, WI, USA). All sequences were aligned and edited using MEGA v 11.0 [26] with the default Clustal W parameters, and nucleotide composition, conserved sites, variable sites, parsimony-informative sites, and singleton sites were recorded. Population genetic parameters, including haplotype number, haplotype diversity, and nucleotide diversity, were calculated using DnaSP 6.0 [27]. Intraspecific and interspecific genetic distances were estimated based on the Kimura 2-parameter (K2P) distance model, with bootstrap support values derived from 1000 replicates in MEGA. Subsequently, based on the K2P model-derived maximum genetic distance and nearest neighbor genetic distances, we utilized Origin 2018 [28] to visualize and represent the distribution of genetic distances through histograms and scatter plots. Identical sequences were condensed into unique haplotypes using DnaSP, which were subsequently employed for phylogenetic analyses. Phylogenetic inference was conducted using maximum likelihood (ML) with 1000 non-parametric bootstrap replicates using IQ-TREE v2.3.4 [29]. The TN + F + I + R3 model was identified as the best-fit model using ModelFinder [30] in IQ-TREE. The phylogenetic tree was visualized using the online tool Interactive Tree of Life (https://itol.embl.de/) [31] and further refined using Adobe Illustrator version 28.0 (Adobe Inc., San Jose, CA, USA) [32].

2.4. Species Delimitation

In this study, five delimitation algorithms (RESL, ABGD, ASAP, bPTP, GMYC) were used to identify species of the genus Discogobio and identify potential molecular operational taxa. Refined Single Linkage algorithm (RESL) analyses were performed using the BOLD system (http://v4.boldsystems.org, accessed on 8 January 2025). We uploaded the sequencing dataset to the BOLD system and processed the submitted sample sequences using the “Cluster Sequences” option in the system platform. We obtained the molecular operational taxonomic unit (MOTU) grouping results of the entire sequence based on the RESL method [33]. Automatic Barcode Gap Discovery (ABGD) analyses were performed on the web server [34] utilizing the following configuration: p min = 0.001, p max = 0.1, relative gap width = 1, matrix modeled as Kimura (K80), and other parameters set to the default. Assemble Species by Automatic Partitioning (ASAP) analyses were performed on the web server (https://bioinfo.mnhn.fr/abi/public/asap/asapweb.html, accessed on 14 January 2025). This method proposes species partitions using a hierarchical clustering algorithm based on pairwise genetic distances [35]. We used the same models as the ABGD method, with default settings applied [34]. The Bayesian Poisson Tree Process (bPTP) analyses were performed on the online website (http://species.h-its.org/ptp/, accessed on 16 January 2025) [36]. We submitted the ML tree constructed using the IQ-TREE v2.3.4 software, selected the root tree, removed the outgroup, and set the reversible Markov chain number to 500,000, with other parameters set to default. To perform Generalized Mixed Yule Combination (GMYC) analysis, we generated an ultrametric tree using BEAST v1.10.4 with an uncorrelated relaxed clock model and either Yule constant population model [37,38,39]. MCMC sampling over 10 million generations (every 1000th) ensured convergence and sufficient data [40]. Tracer v1.7.2 verified sampling quality [41], and TreeAnnotator (part of the BEAST suite) created the maximum clade credibility tree after discarding 10% as burn-in. This tree was then used for GMYC analysis with a single-threshold model in the R package Splits 1.0–19 [39].

3. Results

3.1. Sequence Characterization and Population Genetic Diversity

On a morphological basis, this study identified 11 named species within the genus Discogobio and 5 undetermined species (D. sp. 1, D. sp. 2, D. sp. 3, D. sp. 4, D. sp. 5) (Table 1). The sampling effort yielded 67 specimens of D. macrophysallidos, representing the most abundant species in our collection, whereas only a single specimen of D. yunnanensis was obtained. Sequence amplification was conducted on all individual specimens, resulting in a total of 206 COI sequences. After alignment, the sequence fragments obtained were 651 bp in length. The average nucleotide composition of the complete sequence dataset was as follows: thymine (T), 28.83%; cytosine (C), 27.63%; adenine (A), 25.97%; and guanine (G), 17.57%. The contents of A + T were significantly higher than those of C + G. There were 534 conserved sites, 117 variable sites, 112 parsimony informative sites, and 5 singleton sites. A total of 50 haplotypes were generated from the 206 COI sequences. Discogobio macrophysallidos (N = 67) had the highest number of haplotypes (Nh = 10), while D. antethoracalis (N = 12), D. brachyphysallidos (N = 3), D. longibarbatus (N = 3), and D. yunnanensis (N = 1) had the lowest number of haplotypes (Nh = 1). Correspondingly, D. sp. 1 exhibited the highest haplotype diversity, with h = 0.800 ± 0.164. Among the D. macrophysallidos, it had the highest nucleotide diversity, with π = 0.00605 ± 0.00063 (Table 1). Notably, the observed differences in haplotype counts may be influenced by variations in sample sizes across species.

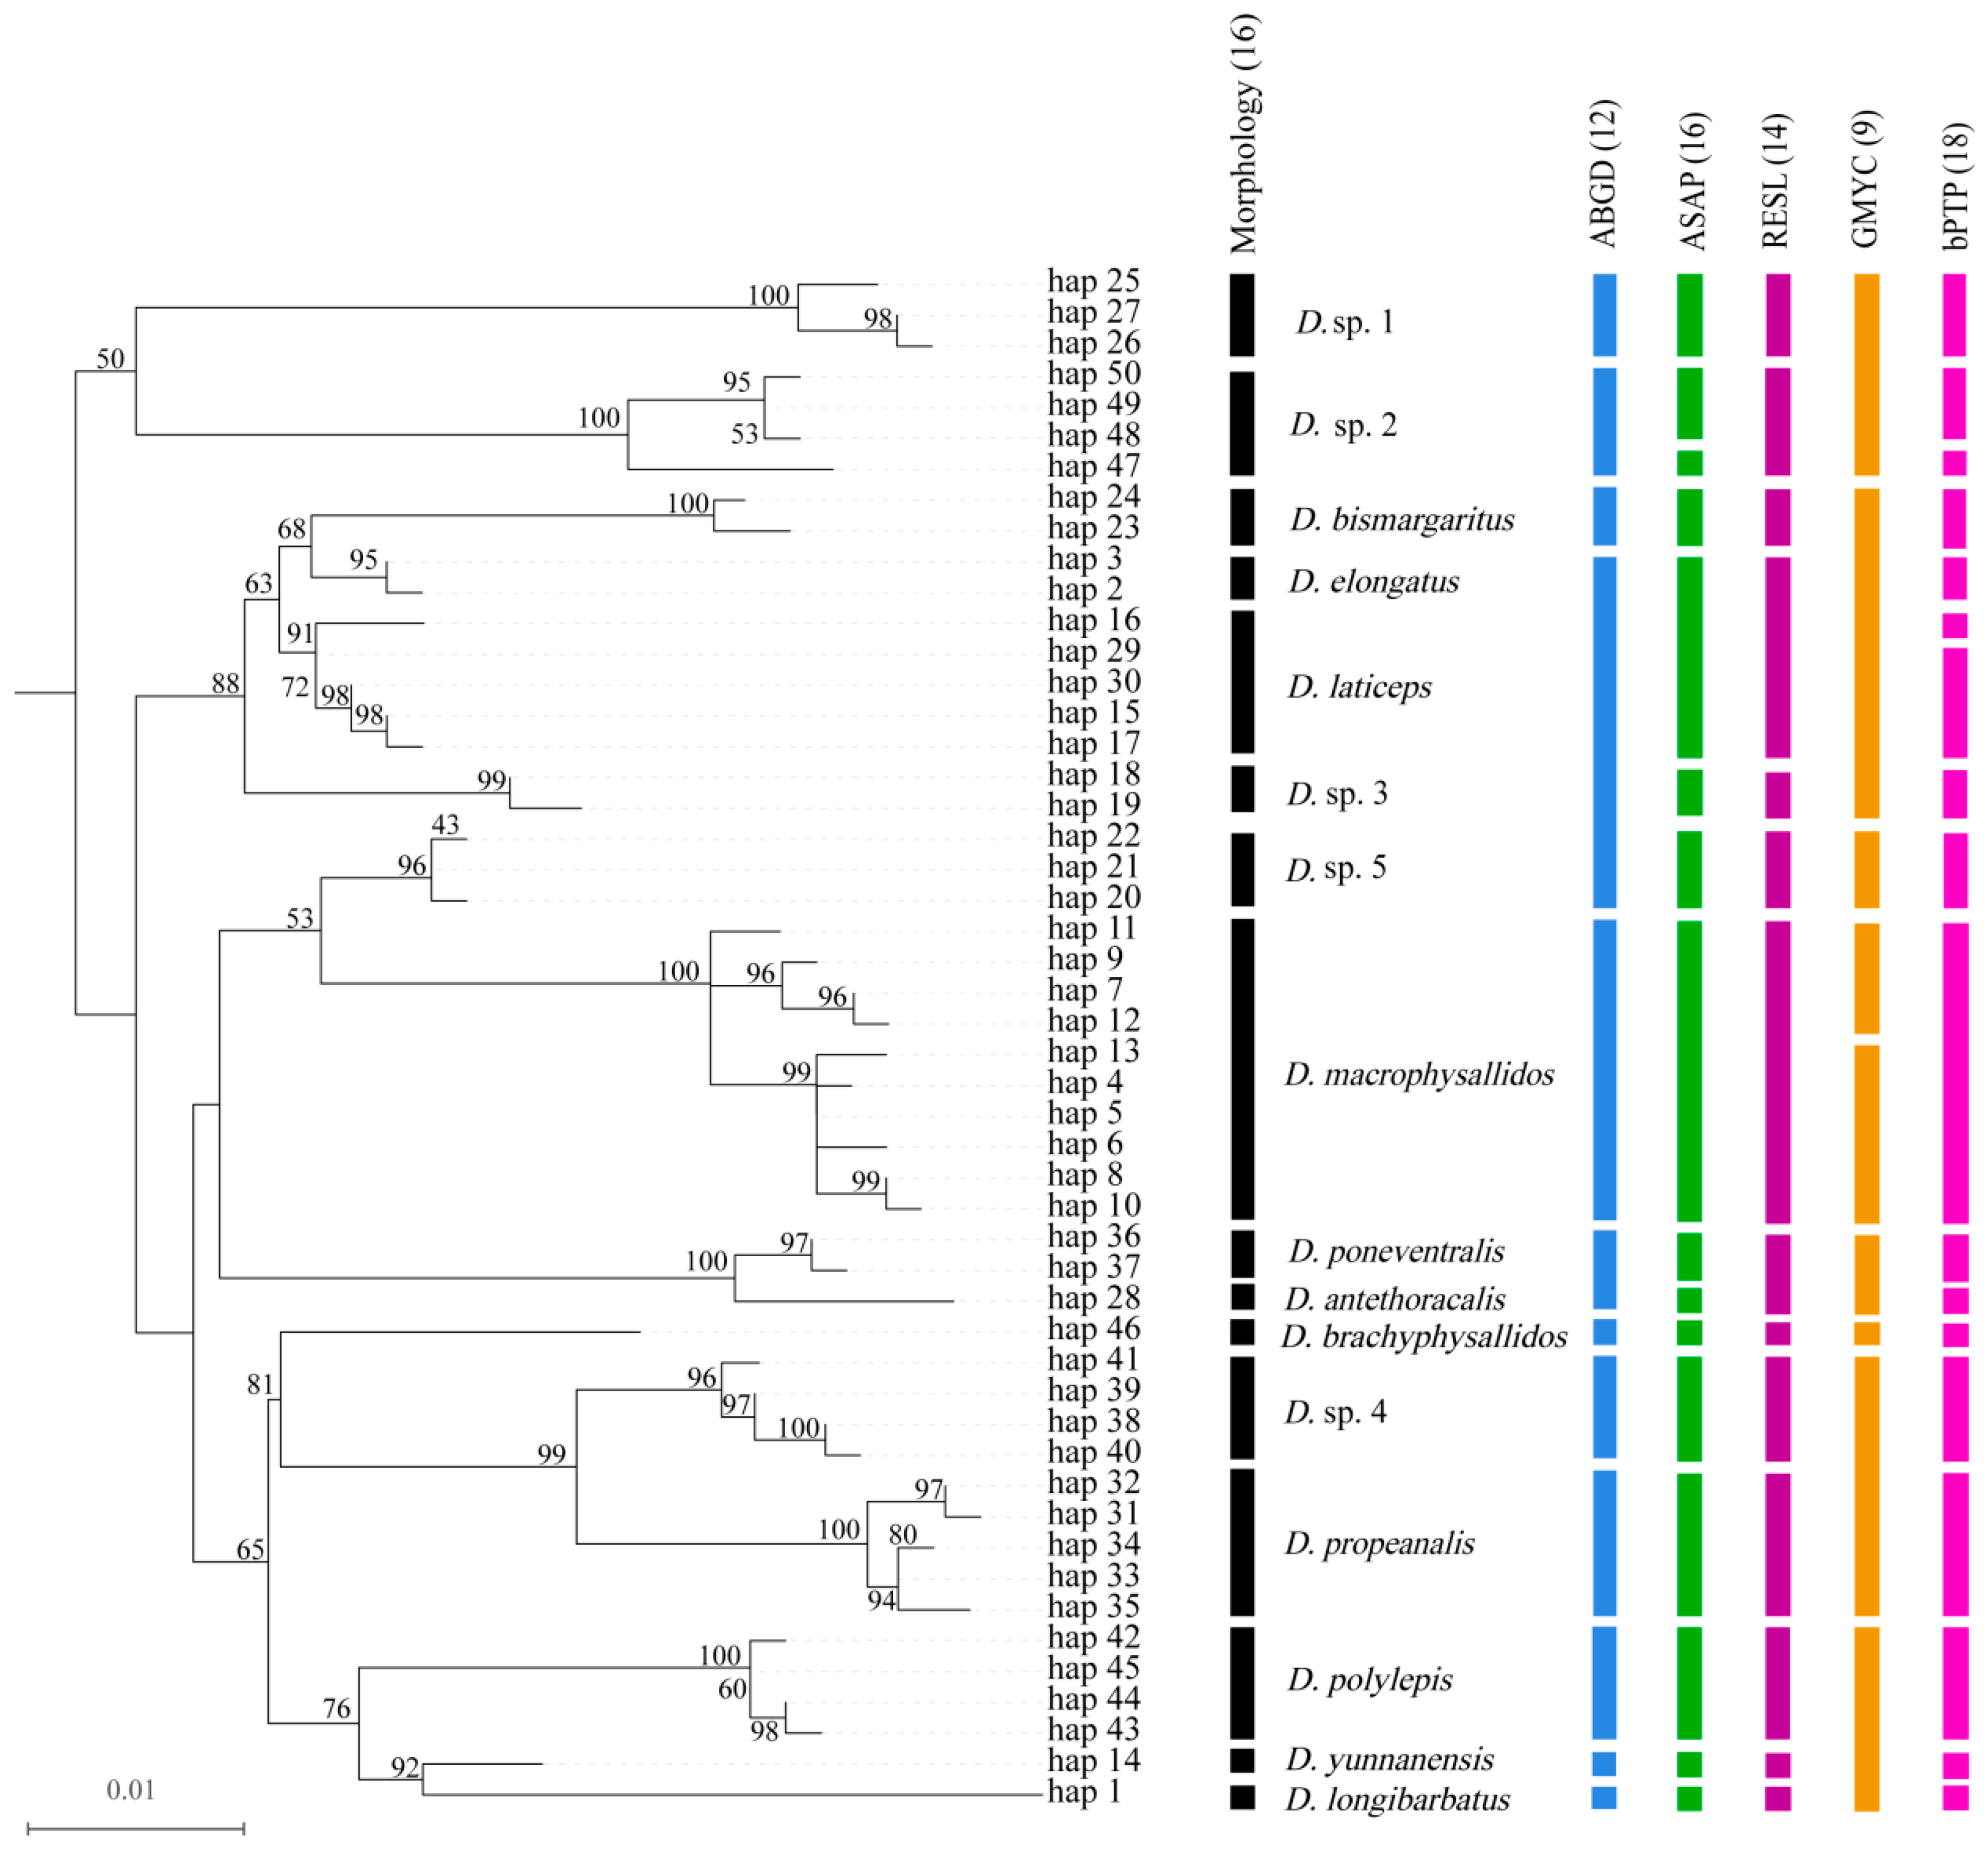
3.2. Species Boundary Discordance Across Analytical Approaches

Based on five species delimitation methods, the number of MOTUs ranged from 9 to 18 (Figure 2). The ABGD method identified 12 MOTUs, of which 10 corresponded to identified morphospecies. The ASAP method identified 16 MOTUs, of which 13 corresponded to identified morphospecies. The RESL analysis yielded 14 MOTUs, of which 12 corresponded to the results obtained through morphological delimitation in taxonomic consistency. The bPTP method identified 18 MOTUs, 14 of which corresponded to identified morphospecies. The GMYC analysis resulted in the identification of 9 MOTUs, which were taxonomically highly inconsistent with the results obtained through morphological definition.

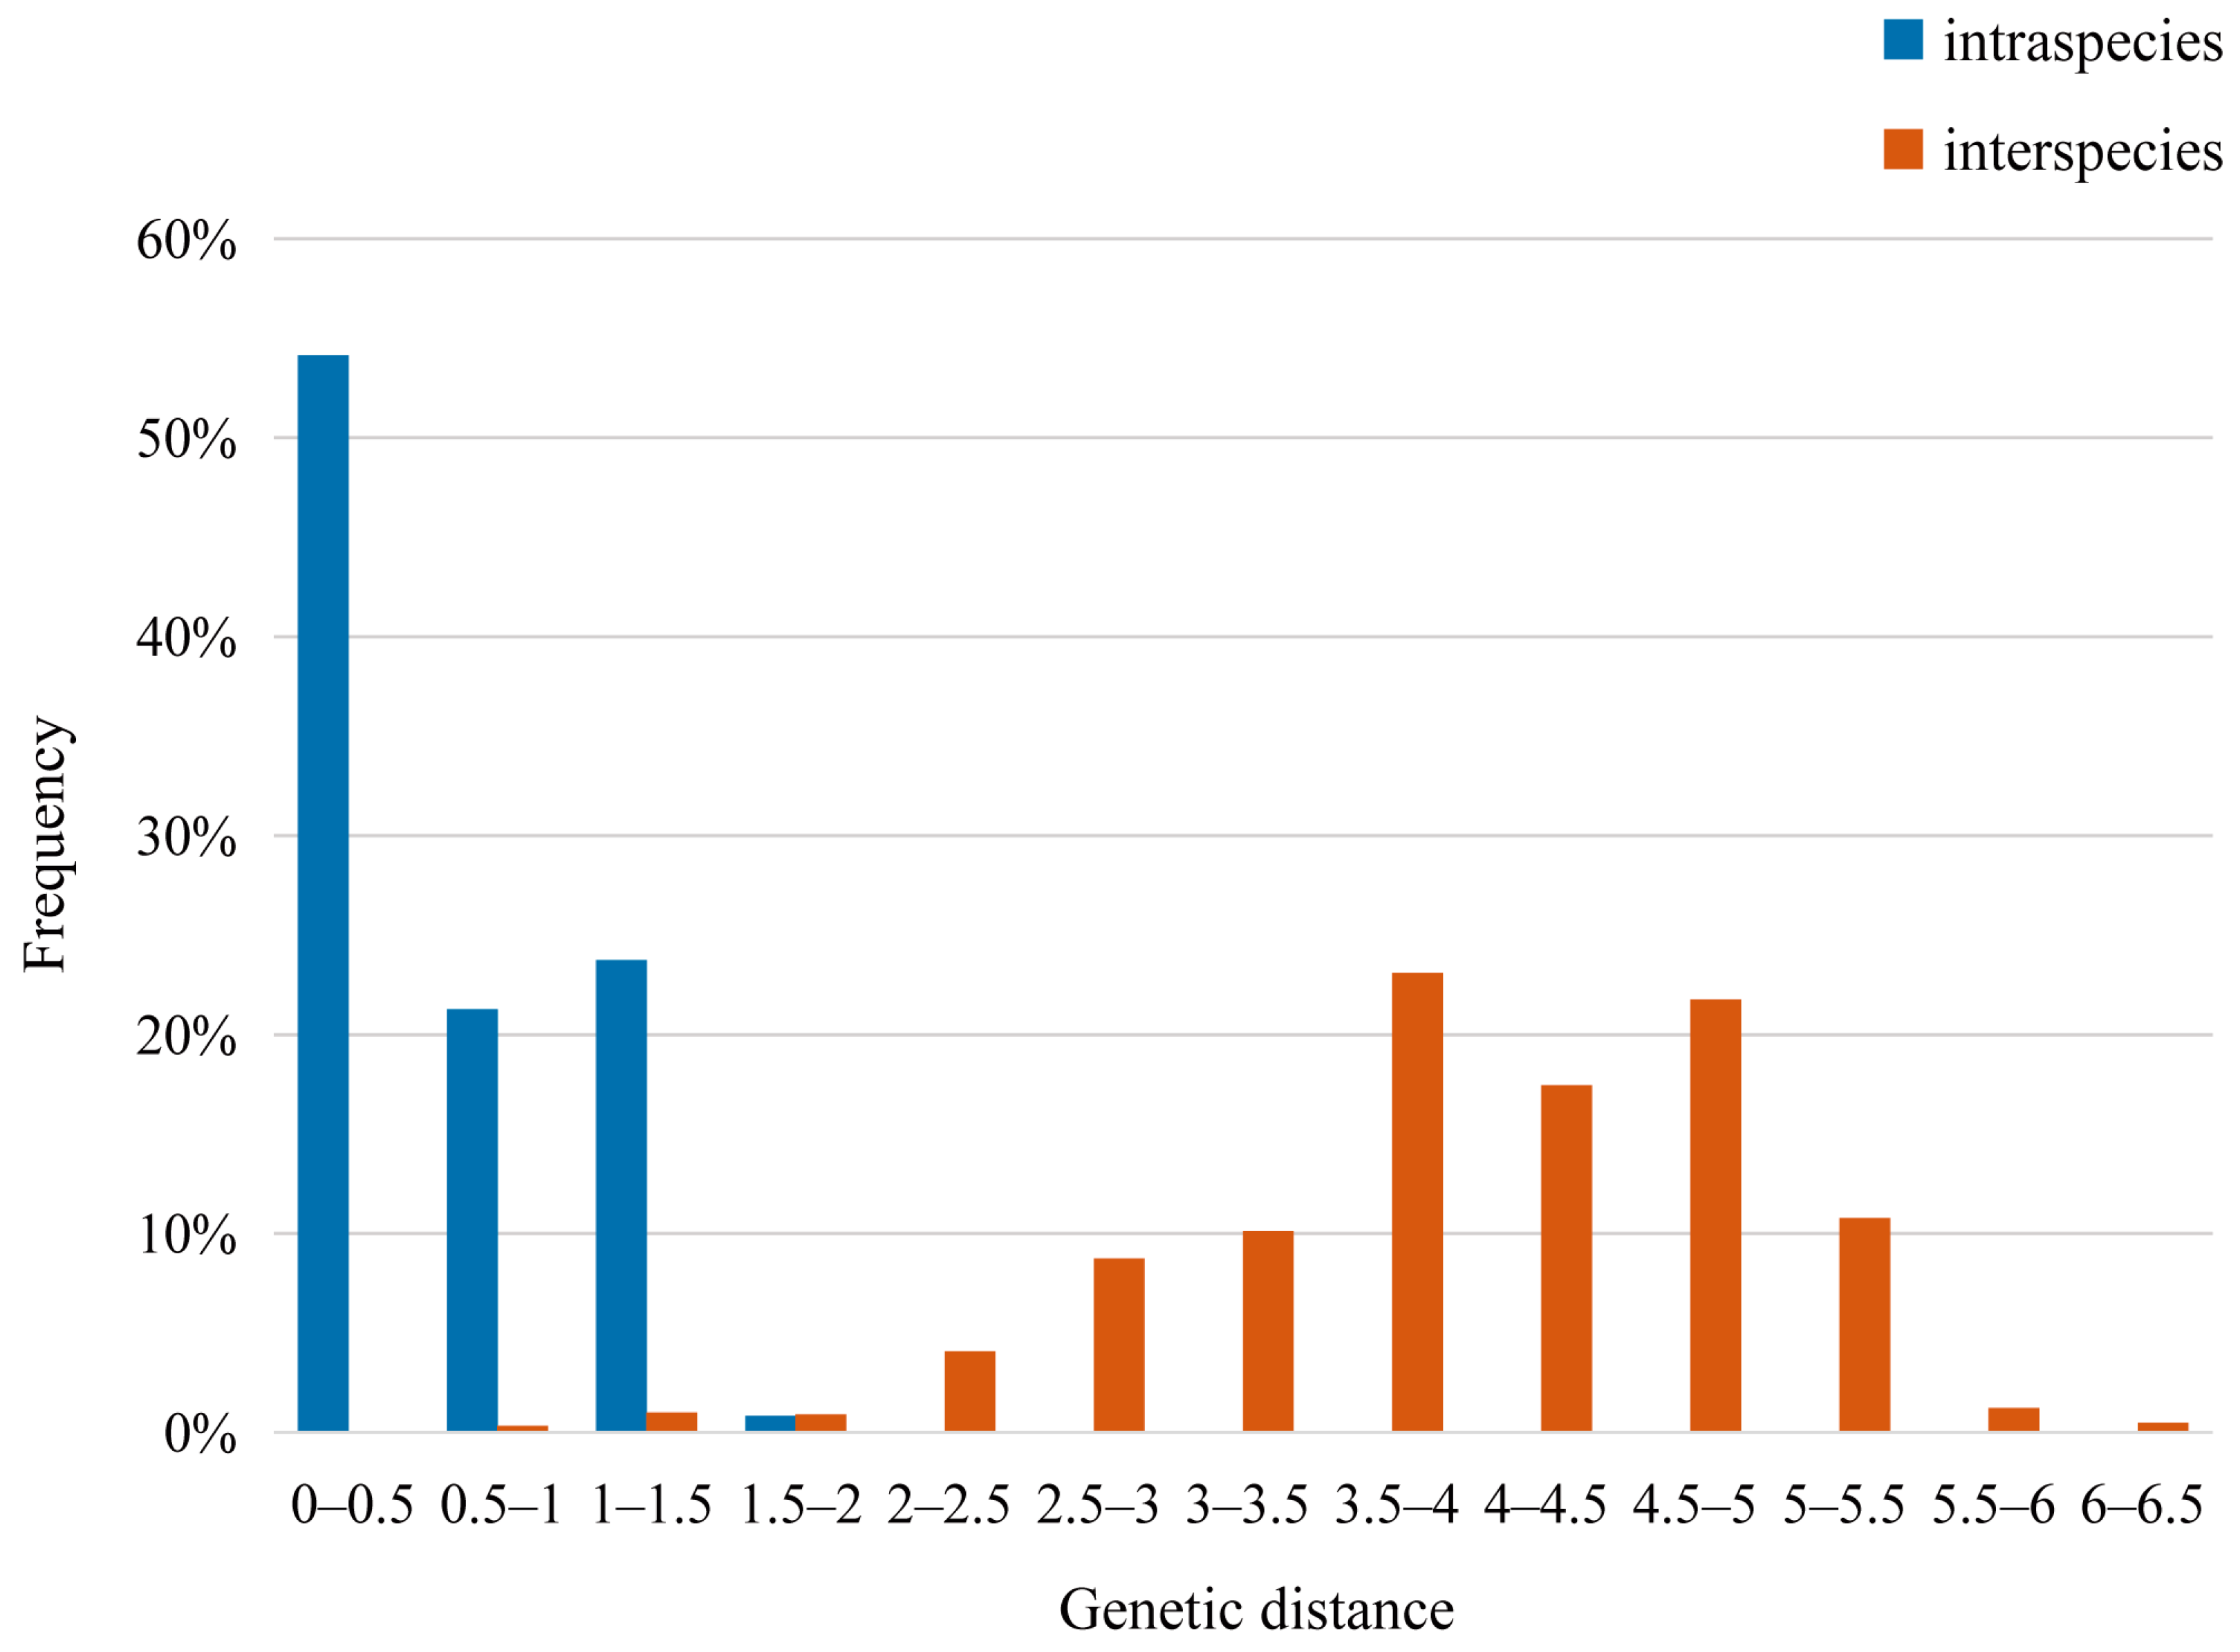
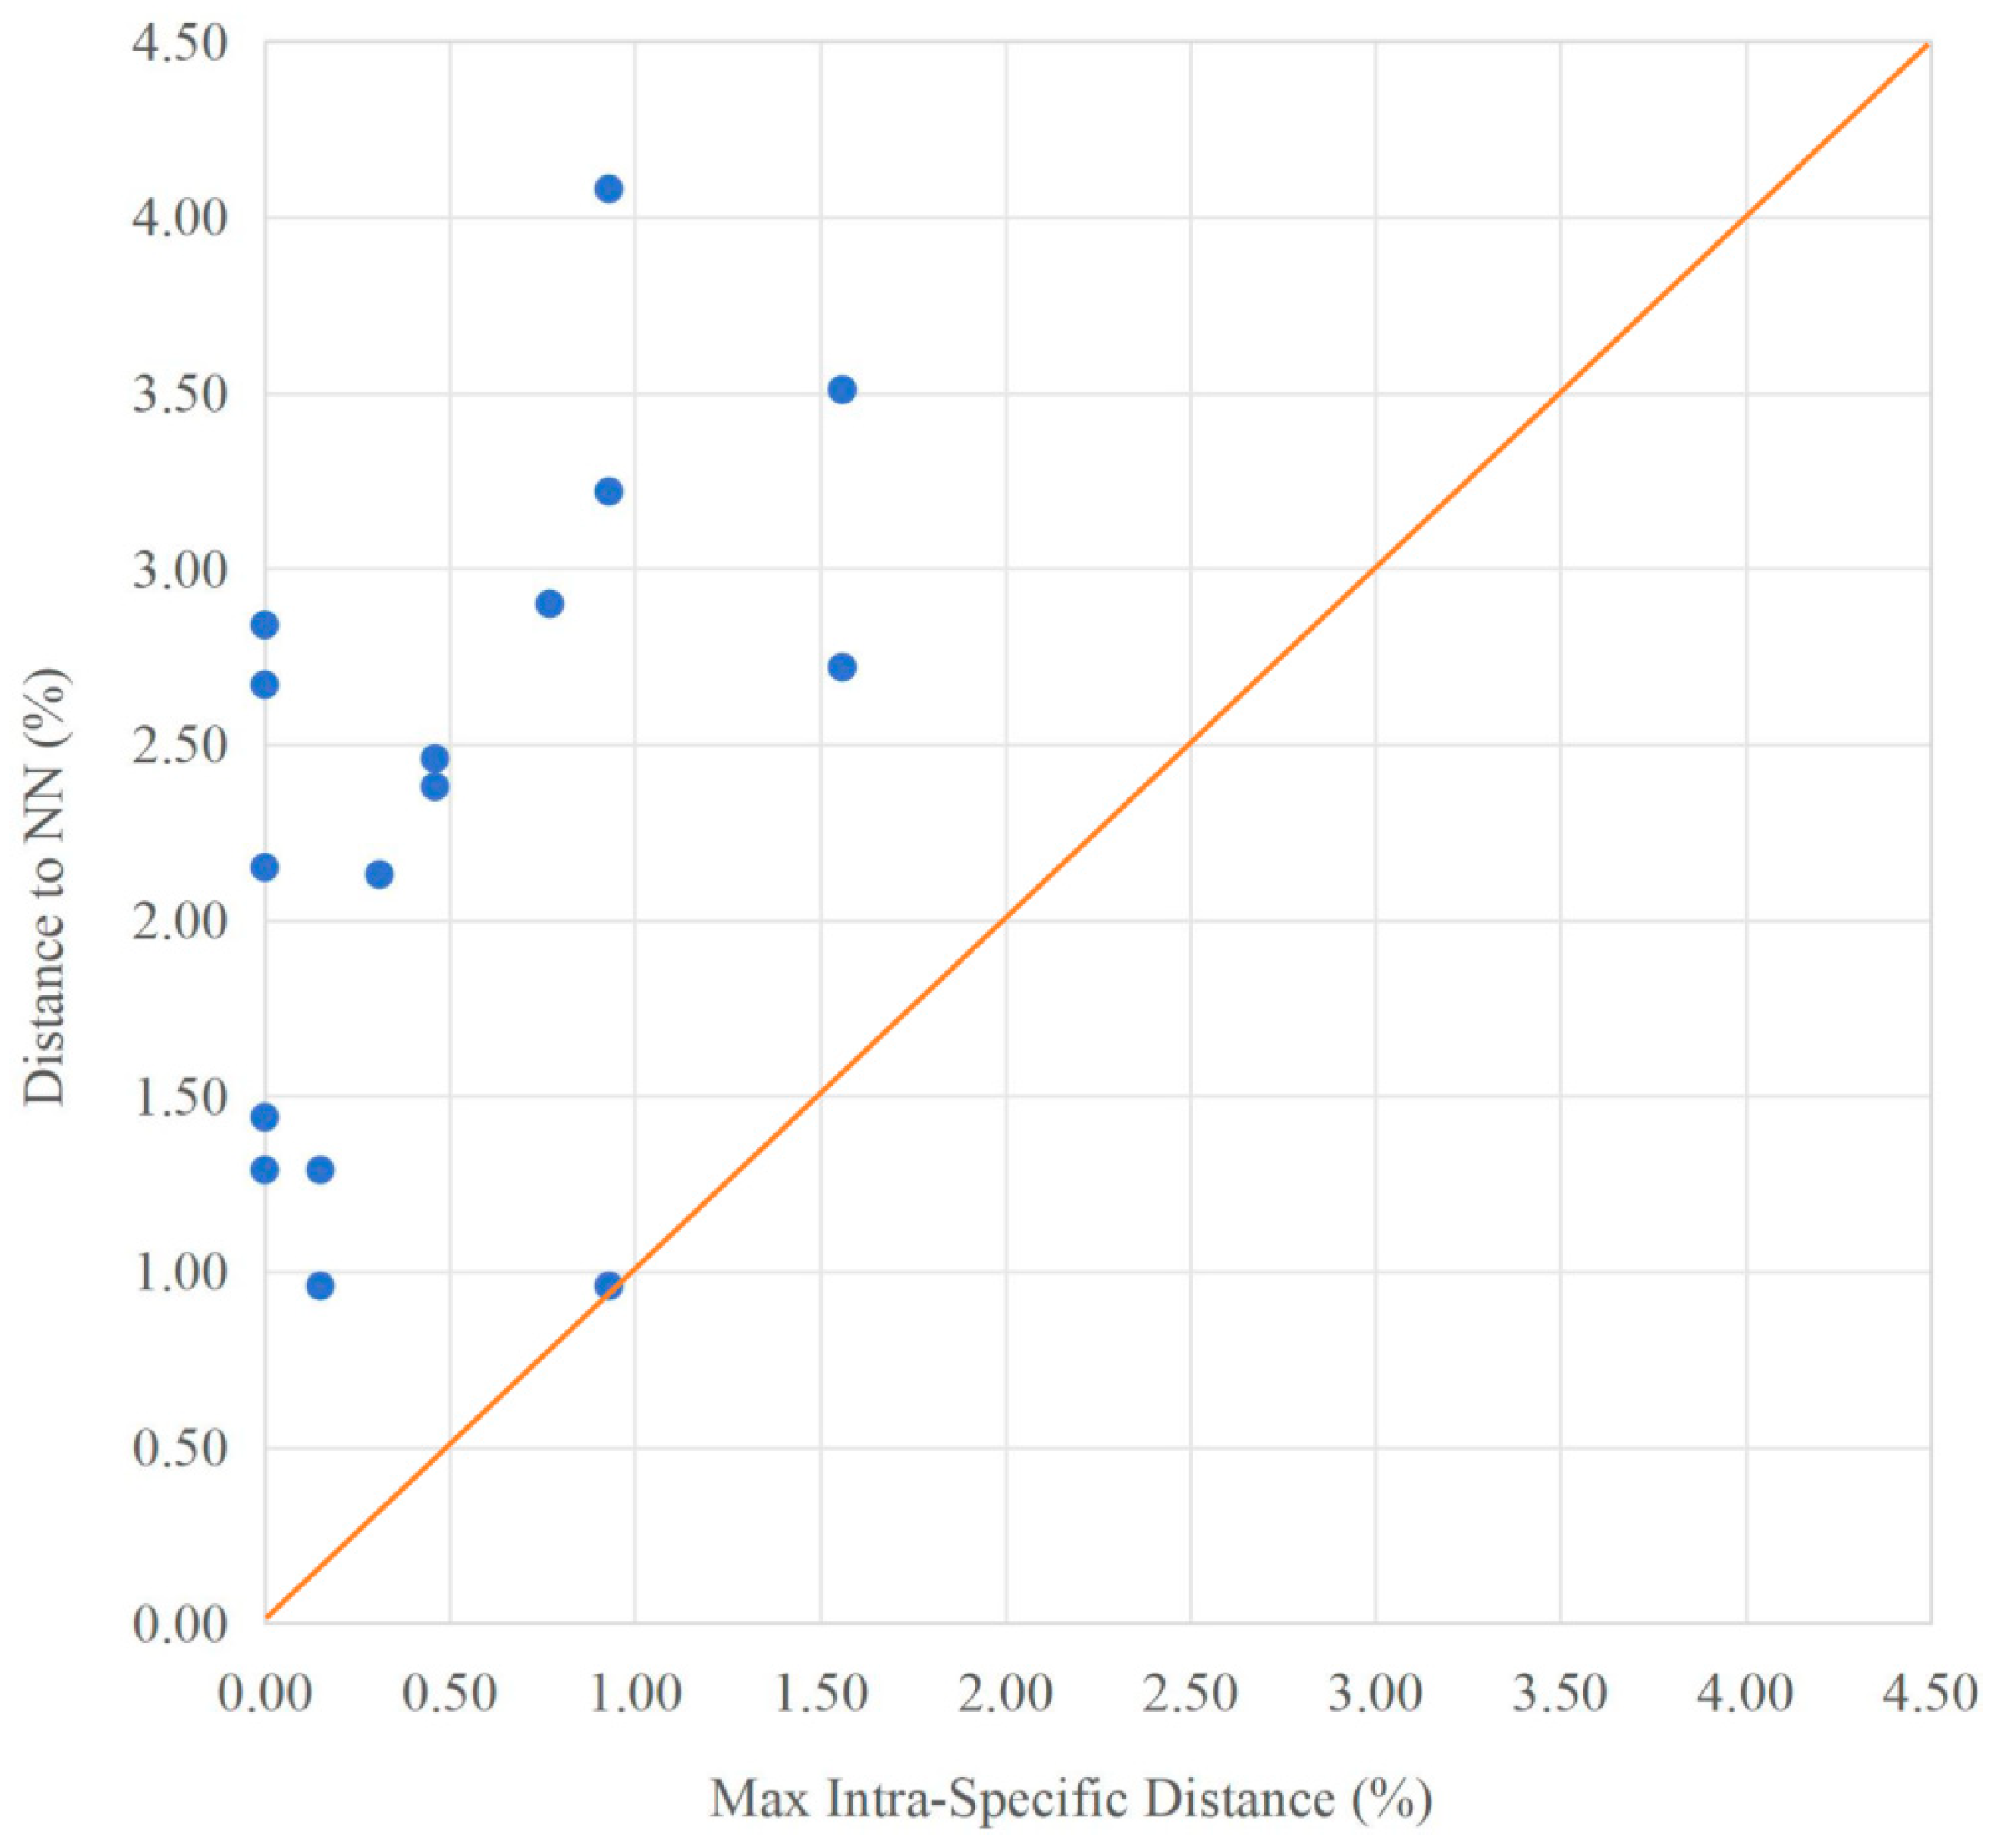
3.3. Genetic Distance and Phylogenetic Analysis

The intraspecific and interspecific genetic distances for fishes of the genus Discogobio based on the K2P model are shown in Table 2. Among the 16 species analyzed, D. yunnanensis was excluded from intraspecific genetic distance calculations due to insufficient sample size (n = 1). For the remaining 15 species, intraspecific genetic distances ranged from 0% to 1.56%, with a mean genetic distance of 0.21%. The intraspecific genetic distances of the 11 known species and 5 undetermined species obtained through morphological identification were all below the threshold of 2%, of which D. macrophysallidos possessed the largest intraspecific genetic distance of 1.56%. The respective interspecific genetic distances ranged from 0.96% to 6.21%, with an average interspecific genetic distance of 3.94%. The maximum value of interspecific genetic distance was 6.21% between D. propeanalis and D. sp. 1, and the minimum value was 0.96% between D. elongatus and D. laticeps. We found very low interspecific genetic distances among several species, well below the DNA barcoding threshold for interspecific genetic distances. For example, the interspecific genetic distance between D. antethoracalis and D. poneventralis was 1.29%, between D. elongatus and D. laticeps was 0.96%, and between D. sp. 5 and D. elongatus was 1.44%. Hence, there is some overlap in intraspecific and interspecific genetic distances in fishes of the genus Discogobio, but the overlap is relatively small, and some DNA barcode gaps can be formed (Figure 3).
The nearest-neighbor genetic distances between species ranged from 0.96% to 4.08%. Overall, there was a significant difference between the mean interspecific genetic distance (3.94%) and the mean intraspecific genetic distance (0.21%). The interspecific genetic distance was about 18.8 times higher than the intraspecific genetic distance. Barcode gap analysis showed that the maximum intraspecific distance for each species was lower than the minimum distance to its nearest neighbor (Figure 4), suggesting the presence of barcode gaps.
The phylogenetic tree constructed with haplotype sequences based on the maximum likelihood method is shown in Figure 2. Most species formed well-distinguished branches on the phylogenetic tree, and the major evolutionary branches represented different taxonomic species. The clustering results showed that the clustering among the species was distinct, without any mixing among species.

4. Discussion

4.1. Applicability of DNA Barcode in the Identification of the Genus Discogobio

On a morphological basis, we identified 16 taxonomic entities, including 11 known species and five undetermined species. This suggests that the genus Discogobio has a high species diversity with the presence of undescribed species. The average A + T content of 206 COI gene sequences (representing 50 haplotypes) from 16 Discogobio species was 54.80%, demonstrating a distinct base composition bias. This finding aligns with the common feature observed in vertebrate COI genes, where A + T content typically exceeds G + C content [42].
We used COI gene sequence markers to further analyze the collected samples of Discogobio using DNA barcoding based on external morphometric identification. DNA barcoding for species identification is mainly used to separate species through the obvious gaps formed by the genetic distances between different sequences due to the moderate evolutionary rate of COI genes [43]. These genetic gaps are manifested in two aspects: intraspecific genetic distances and interspecific genetic distances. Hebert et al. conducted a taxonomic study on 13,320 species within the animal kingdom and found that, in DNA barcodes based on COI sequences, the intraspecific genetic distances of most species were no more than 2%, or even less than 1%, except for phylum Cnidaria [3]. Subsequently, Ward et al. observed a similar pattern in their taxonomic studies of fishes and birds in Australia. Consequently, a 2% threshold for intraspecific genetic distance has been widely adopted in studies on taxonomic identification of species [25].
Among the 16 species of the genus Discogobio, the intraspecific genetic distances ranged from 0% to 1.56%, all of which were below the 2% threshold, except for D. yunnanensis, which was represented by only a single sequence. In addition to the 2% genetic threshold, the 10-fold rule is another widely applied criterion in DNA barcoding studies based on COI genes. This rule states that the mean interspecific genetic distance should be approximately 10 times greater than the mean intraspecific genetic distance, or even higher [3,25]. This criterion has been successfully applied in DNA barcoding studies of Cuban freshwater fishes [44], Yangtze River fish fauna [45], and fishes from Guizhou Province [46]. In our study, the mean interspecific genetic distance (3.94%) was significantly higher than the mean intraspecific genetic distance (0.21%), with the former being approximately 18 times greater than the latter. This finding satisfies the differentiation criteria proposed by Hebert [3]. Collectively, both the 2% genetic threshold and the 10-fold rule support the utility of the COI gene sequence as a reliable DNA barcode for molecular identification within the genus Discogobio.

4.2. Different Methods Result in Different Species Delimitation

Applying a uniform threshold to all taxa is not feasible due to differences in population sizes and species divergence times [47]. Species definition requires further scientific algorithms to avoid relying only on empirical genetic distance thresholds [48]. In this study, we applied five species delimitation methods—ABGD, ASAP, bPTP, RESL, and GMYC, which generated 12, 16, 18, 14, and 9 MOTUs, respectively. Previous studies have shown that different species definition algorithms may not accurately delineate species boundaries or may give conflicting results [49,50]. The differences in the number of MOTUs obtained using the five species definition methods may be attributed to differences in their algorithms. Among them, ABGD, ASAP, and RESL perform species definition through intraspecific and interspecific genetic distance differences [34,35,36]. In this study, the intraspecific genetic distances for all species did not exceed 2%, resulting in relatively conservative outcomes from these three methods (Figure 2). On the other hand, GMYC and bPTP are evolutionary tree-based species definition methods. GMYC relies on Ultrametric Trees to determine species [38,39,40], while bPTP utilizes substitution-calibrated trees to identify species, avoiding potential pitfalls associated with constructing time-calibrated phylogenies [51]. These two methods identified different species in this study, in agreement with previous findings that the bPTP method typically leads to higher MOTUs [52].
The combination of multiple morphospecies into a single MOTU, or the division of a morphospecies into multiple MOTUs, highlights the potential limitations of using a single mitochondrial gene for species identification. Some species are molecularly indistinguishable, possibly because these populations have only recently diverged, resulting in insufficient accumulation of molecular differences [53,54,55]. In addition, the results of species identification may be affected by other factors, such as the presence of nuclear mitochondrial DNA segments, mitochondrial heterogeneity, incomplete lineage sorting, interspecific hybridization, mitochondrial introgression, and inadequate taxon sampling [56,57,58,59,60,61,62]. Therefore, we should be conservative about inferences drawn from molecular species delimitation studies [63]. An integrated taxonomy that combines molecular, morphological, geographic, and ecological data is essential for species recognition, identification, and broad classification.

5. Conclusions

In summary, both the 2% genetic threshold and the 10-fold rule collectively support the utility of the COI gene sequence as a reliable DNA barcode for species-level identification within the genus Discogobio. When integrated with morphological characters, our study suggested that DNA barcoding effectively discriminated species within the genus Discogobio, supported by marked divergence in intraspecific versus interspecific genetic distances and species-specific monophyletic clades. The DNA barcoding data generated in this study provide a critical molecular foundation for species delineation within the morphologically conserved genus Discogobio, offering valuable insights for its taxonomic revision and conservation prioritization.

Author Contributions

H.L.: investigation, methodology, formal analysis, experiment, software, writing—original draft preparation, data curation. H.C.: investigation, formal analysis, writing—reviewing and editing. R.H.: investigation, writing—reviewing and editing. Z.Q.: experiment. R.Z.: Conceptualization, investigation, formal analysis, funding acquisition, methodology, project administration. All authors have read and agreed to the published version of the manuscript.

Funding

The work was supported by the new seedling plans of Guizhou Normal University (Qianshi Xinmiao [2022]11).

Institutional Review Board Statement

This study does not involve the handling or utilization of live animals. The samples utilized were derived from museum specimens housed in our laboratory collection, which primarily originate from donations by local fishermen and other sources.

Informed Consent Statement

Not applicable.

Data Availability Statement

The data have been submitted to BOLD.

Conflicts of Interest

The authors declare no conflicts of interest.

References

  1. Liu, J.L.; Dujsebayeva, T.N.; Chirikova, M.A.; Gong, X.; Li, D.J.; Guo, X.G. Does the Dzungarian racerunner (Eremias dzungarica Orlova, Poyarkov, Chirikova, Nazarov, Munkhbaatar, Munkhbayar & Terbish, 2017) occur in China? Species delimitation and identification with DNA barcoding and morphometric analyses. Zool. Res. 2021, 42, 287–293. [Google Scholar] [CrossRef] [PubMed]
  2. Rock, J.; Costa, F.O.; Walker, D.I.; North, A.W.; Hutchinson, W.F.; Carvalho, G.R. DNA barcodes of fish of the Scotia Sea, Antarctica indicate priority groups for taxonomic and systematics focus. Antarct. Sci. 2008, 20, 253–262. [Google Scholar] [CrossRef]
  3. Hebert, P.D.N.; Cywinska, A.; Ball, S.L.; Dewaard, J.R. Biological identifications through DNA barcodes. Proc. Biol. Sci. 2003, 270, 313–321. [Google Scholar] [CrossRef]
  4. Allison Jr, P.F.; Pickich, E.T.; Barnett, Z.C.; Garrick, R.C. DNA barcoding is currently unreliable for species identification in most crayfishes. Ecol. Evol. 2024, 14, e70050. [Google Scholar] [CrossRef]
  5. Zhou, Z.; Guo, H.; Han, L.; Chai, J.; Che, X.; Shi, F. Singleton molecular species delimitation based on COI-5P barcode sequences revealed high cryptic/undescribed diversity for Chinese katydids (Orthoptera: Tettigoniidae). BMC Evol. Biol. 2019, 19, 79. [Google Scholar] [CrossRef]
  6. Hollingsworth, P.M. Refining the DNA barcode for land plants. Proc. Natl. Acad. Sci. USA 2011, 108, 19451–19452. [Google Scholar] [CrossRef] [PubMed]
  7. Rodrigues, B.L.; Baton, L.A.; Shimabukuro, P.H.F. Single-locus DNA barcoding and species delimitation of the sandfly subgenus Evandromyia (Aldamyia). Med. Vet. Entomol. 2020, 34, 420–431. [Google Scholar] [CrossRef]
  8. Yan, Y.B.; Cheng, Q.Q. Study on molecular taxonomy of genus Pampus based on complete mitochondrial genome structure. Mar. Fish. 2022, 44, 31–44. (In Chinese) [Google Scholar] [CrossRef]
  9. Lee, H.L.; Yu, H.J.; Kim, J.K. New descriptions of four larval lanternfish species and cryptic diversity of Benthosema pterotum (Pisces: Myctophidae) from the Northwest Pacific. J. Fish Biol. 2022, 101, 1474–1500. [Google Scholar] [CrossRef]
  10. Cheng, J.; Chen, Y.P.; Ye, J.W.; Chen, H.Y.; Chen, Z.H.; Liang, R.S. DNA barcoding and molecular phylogeny of Pteroninae species in China Sea. Mar. Fish. 2024, 46, 257–265. [Google Scholar] [CrossRef]
  11. Baisvar, V.S.; Kumar, R.; Singh, M.; Kushwaha, B. Cytochrome-C oxidase I gene-based genetic divergence and molecular phylogeny among the species of fish genus Channa. Proc. Natl. Acad. Sci. India Sect. B Biol. Sci. 2019, 89, 1455–1463. [Google Scholar] [CrossRef]
  12. Bektas, Y.; Aksu, İ.; Kaya, C.; Bayçelebi, E.; Turan, D. DNA barcoding and species delimitation of the genus Oxynoemacheilus (Teleostei: Nemacheilidae) in Anatolia. J. Fish Biol. 2022, 101, 505–514. [Google Scholar] [CrossRef] [PubMed]
  13. Zhang, E.; Yue, P.Q.; Chen, J.X. Labeoninae. In Fauna Sinica Osteichthyes Cypriniformes; Yue, P.Q., Ed.; Beijing Science Press: Beijing, China, 2000; pp. 171–174. (In Chinese) [Google Scholar]
  14. Tan, H.; Zhang, M.; Cheng, G.; Chen, X. The complete mitochondrial genome of Discogobio laticeps (Cyprinidae: Labeoninae). Mitochondrial DNA Part B 2019, 4, 1981–1982. [Google Scholar] [CrossRef]
  15. Fricke, R.; Eschmeyer, W.N.; Van der Laan, R. Catalog of Fishes: Genera, Species, References; California Academy of Sciences: San Francisco, CA, USA, 2024; Available online: https://researcharchive.calacademy.org/research/ichthyology/catalog/fishcatmain.asp (accessed on 22 December 2024).
  16. Lin, S.Y. Carps and Carp-Like Fishes of Kwangtung and Adjacent Inlands; Fishery Experimental Station, Bureau of Reconstruction: Shenzhen, China, 1931; p. 167. [Google Scholar]
  17. Wu, X.; Lin, R.; Chen, X.; He, M. The Cyprinid Fishes of China; Shanghai Scientific Technical Press: Shanghai, China, 1977; Volume 2, pp. 229–394. [Google Scholar]
  18. Huang, S.Y. Four new species of the genus Discogobio from Yunnan, China. Zool. Res. 1989, 10, 356–361. (In Chinese) [Google Scholar]
  19. Chu, X.L.; Cui, G.H.; Zhou, W. A taxonomic review of fishes of the genus Discogobio, with description of two new species (Cypriniformes: Cyprinidae). Acta Zootaxonomica Sin. 1993, 18, 237–246. (In Chinese) [Google Scholar]
  20. Cui, G.H.; Zhou, W.; Lan, J.H. Discogobio multilineatus, a new cyprinid species from China (Teleostei: Cyprinidae). Ichthyol. Explor. Freshw. 1993, 4, 155–160. [Google Scholar]
  21. Zheng, L.; Zhou, W. Revision of the cyprinid genus Discogobio Lin, 1931 (Pisces: Teleostei) from the upper Red River basin in Wenshan Prefecture, Yunnan, China, with descriptions of three new species. Environ. Biol. Fishes 2008, 81, 255–266. [Google Scholar] [CrossRef]
  22. Yang, Q.; Zhou, W.; Shu, S.S. Morphological and differentiation of Discogobio yunnanensis from different population. Acta Zoo Taxon. Ica Sin. 2011, 36, 117–124. [Google Scholar]
  23. Xue, D. Guide to Collection, Preservation, Identification and Information Share of Animal Specimens; Standard Press of China: Beijing, China, 2010; pp. 103–125. [Google Scholar]
  24. Aljanabi, S.M.; Martinez, I. Universal and rapid salt-extraction of high quality genomic DNA for PCR-based techniques. Nucleic Acids Res. 1997, 25, 4692–4693. [Google Scholar] [CrossRef]
  25. Ward, R.D.; Zemlak, T.S.; Innes, B.H.; Last, P.R.; Hebert, P.D. DNA barcoding Australia’s fish species. Philos. Trans. R. Soc. London Ser. B Biol. Sci. 2005, 360, 1847–1857. [Google Scholar] [CrossRef]
  26. Tamura, K.; Stecher, G.; Kumar, S. MEGA11: Molecular evolutionary genetics analysis version 11. Mol. Biol. Evol. 2021, 38, 3022–3027. [Google Scholar] [CrossRef] [PubMed]
  27. Rozas, J.; Ferrer-Mata, A.; Sánchez-DelBarrio, J.C.; Guirao-Rico, S.; Librado, P.; Ramos-Onsins, S.E.; Sánchez-Gracia, A. DnaSP 6: DNA sequence polymorphism analysis of large data sets. Mol. Biol. Evol. 2017, 34, 3299–3302. [Google Scholar] [CrossRef] [PubMed]
  28. Moberly, J.G.; Bernards, M.T.; Waynant, K.V. Key features and updates for origin 2018. J. Cheminform. 2018, 10, 5. [Google Scholar] [CrossRef] [PubMed]
  29. Nguyen, L.T.; Schmidt, H.A.; Von Haeseler, A.; Minh, B.Q. IQ-TREE: A fast and effective stochastic algorithm for estimating maximum-likelihood phylogenies. Mol. Biol. Evol. 2015, 32, 268–274. [Google Scholar] [CrossRef]
  30. Kalyaanamoorthy, S.; Minh, B.Q.; Wong, T.K.F.; von Haeseler, A.; Jermiin, L.S. ModelFinder: Fast model selection for accurate phylogenetic estimates. Nat. Methods 2017, 14, 587–589. [Google Scholar]
  31. Letunic, I.; Bork, P. Interactive Tree of Life (iTOL) v4: Recent updates and new developments. Nucleic Acids Res. 2019, 47, W256–W259. [Google Scholar] [CrossRef]
  32. McLean, D. Adobe photoshop and illustrator techniques. J. Audiov. Media Med. 2002, 25, 79–81. [Google Scholar] [CrossRef]
  33. Ratnasingham, S.; Hebert, P.D. A DNA-based registry for all animal species: The barcode index number (BIN) system. PLoS ONE 2013, 8, e66213. [Google Scholar] [CrossRef]
  34. Puillandre, N.; Lambert, A.; Brouillet, S.; Achaz, G.J. ABGD, Automatic Barcode Gap Discovery for primary species delimitation. Mol. Ecol. 2012, 21, 1864–1877. [Google Scholar] [CrossRef]
  35. Puillandre, N.; Brouillet, S.; Achaz, G. ASAP: Assemble species by automatic partitioning. Mol. Ecol. Resour. 2021, 21, 609–620. [Google Scholar] [CrossRef]
  36. Zhang, J.; Kapli, P.; Pavlidis, P.; Stamatakis, A. A general species delimitation method with applications to phylogenetic placements. Bioinformatics 2013, 29, 2869–2876. [Google Scholar] [CrossRef] [PubMed]
  37. Pons, J.; Barraclough, T.G.; Gomez-Zurita, J.; Cardoso, A.; Duran, D.P.; Hazell, S.; Kamoun, S.; Sumlin, W.D.; Vogler, A.P. Sequence-based species delimitation for the DNA taxonomy of undescribed insects. Syst. Biol. 2006, 55, 595–609. [Google Scholar] [CrossRef] [PubMed]
  38. Monaghan, M.T.; Wild, R.; Elliot, M.; Fujisawa, T.; Balke, M.; Inward, D.J.; Lees, D.C.; Ranaivosolo, R.; Eggleton, P.; Barraclough, T.G.; et al. Accelerated species inventory on Madagascar using coalescent-based models of species delineation. Syst. Biol. 2009, 58, 298–311. [Google Scholar] [CrossRef] [PubMed]
  39. Fujisawa, T.; Barraclough, T. Delimiting species using single-locus data and the generalized mixed Yule coalescent approach: A revised method and evaluation on simulated data sets. Syst. Biol. 2013, 62, 707–724. [Google Scholar] [CrossRef]
  40. Bouckaert, R.; Heled, J.; Kühnert, D.; Vaughan, T.; Wu, C.H.; Xie, D.; Suchard, M.A.; Rambaut, A.; Drummond, A.J. BEAST 2: A software platform for Bayesian evolutionary analysis. PLoS Comput. Biol. 2014, 10, e1003537. [Google Scholar] [CrossRef]
  41. Rambaut, A.; Drummond, A.J.; Xie, D.; Baele, G.; Suchard, M.A. Posterior summarization in Bayesian phylogenetics using Tracer 1.7. Syst. Biol. 2018, 67, 901–904. [Google Scholar] [CrossRef]
  42. Zheng, L.P.; Geng, Y.M. Complete mitochondrial genome of Guigarra cailaoensis Wang, Chen & Zheng, 2022 (Cypriniformes, Cyprinidae) and its phylogenetic implications. ZooKeys 2024, 1190, 75–89. [Google Scholar] [CrossRef]
  43. Miralles, A.; Puillandre, N.; Vences, M. DNA barcoding in species delimitation: From genetic distances to integrative taxonomy. Methods Mol. Biol. 2024, 2744, 77–104. [Google Scholar] [CrossRef]
  44. Lara, A.; Ponce de León, J.L.; Rodriguez, R.; Casane, D.; Cote, G.; Bernatchez, L.; García-Machado, E.R. DNA barcoding of Cuban freshwater fishes: Evidence for cryptic species and taxonomic conflicts. Mol. Ecol. Resour. 2010, 10, 421–430. [Google Scholar] [CrossRef]
  45. Shen, Y.J.; Hubert, N.; Huang, Y.; Wang, X.Z.; Gan, X.N.; Peng, Z.G. DNA barcoding the ichthyofauna of the Yangtze River: Insights from the molecular inventory of a mega-diverse temperate fauna. Mol. Ecol. Resour. 2019, 19, 1278–1291. [Google Scholar] [CrossRef]
  46. Tang, Q.; Deng, L.; Luo, Q.; Duan, Q.; Wang, X.; Zhang, R. DNA barcoding of fish species diversity in Guizhou, China. Diversity 2023, 15, 203. [Google Scholar] [CrossRef]
  47. Greenstone, M.H.; Vandenberg, N.J.; Hu, J. Barcode haplotype variation in North American agroecosystem lady beetles (Coleoptera: Coccinellidae). Mol. Ecol. Resour. 2011, 11, 629–637. [Google Scholar] [CrossRef]
  48. Li, Q.; Liu, Q.; Yu, Y.; Lin, X.; He, X.; Huang, X. Revealing cryptic diversity and population divergence in subtropical aphids through DNA barcoding. Zool. Scr. 2023, 52, 517–530. [Google Scholar] [CrossRef]
  49. Ren, J.L.; Ren, L.; Zhang, R.Z. Delimiting species, revealing cryptic diversity, and population divergence in Qinghai-Tibet Plateau weevils through DNA barcoding. Ecol. Evol. 2024, 14, e11592. [Google Scholar] [CrossRef]
  50. Wang, T.; Zhang, Y.P.; Yang, Z.Y.; Liu, Z.; Du, Y.Y. DNA barcoding reveals cryptic diversity in the underestimated genus Triplophysa (Cypriniformes: Cobitidae, Nemacheilinae) from the northeastern Qinghai-Tibet Plateau. BMC Evol. Biol. 2020, 20, 151. [Google Scholar] [CrossRef]
  51. Zhang, Y.H.; Qin, G.; Zhang, H.X.; Wang, X.; Lin, Q. DNA barcoding reflects the diversity and variety of brooding traits of fish species in the family Syngnathidae along China’s coast. Fish. Res. 2017, 185, 137–144. [Google Scholar] [CrossRef]
  52. Hsiao, Y.; Oberprieler, R.G. An integrative taxonomic and phylogenetic approach reveals a new genus of Australasian Cycas-pollinating weevils (Coleoptera: Curculionidae: Cossoninae). Zool. J. Linn. Soc. 2024, 202, zlad190. [Google Scholar] [CrossRef]
  53. Dupuis, J.R.; Roe, A.D.; Sperling, F.A. Multi-locus species delimitation in closely related animals and fungi: One marker is not enough. Mol. Ecol. 2012, 21, 4422–4436. [Google Scholar] [CrossRef]
  54. Knowles, L.L.; Carstens, B.C. Delimiting species without monophyletic gene trees. Syst. Biol. 2007, 56, 887–895. [Google Scholar] [CrossRef]
  55. Maddison, W.P. Gene trees in species trees. Syst. Biol. 1997, 46, 523–536. [Google Scholar] [CrossRef]
  56. Li, T.C.; Wang, Y.K.; Sui, Z.X.; Wang, T.; Nian, J.Z.; Jiang, J.Z.; Tang, T.; Liu, F.S.; Xiao, J.H.; Huang, D.W. Multiple mitochondrial haplotypes within individual specimens may interfere with species identification and biodiversity estimation by DNA barcoding and metabarcoding in fig wasps. Syst. Entomol. 2021, 46, 887–899. [Google Scholar] [CrossRef]
  57. Li, J.J.; Li, Q.; Wu, Y.X.; Ye, L.Q.; Liu, H.H.; Wei, J.F.; Huang, X.L. Mountains act as museums and cradles for hemipteran insects in China: Evidence from patterns of richness and phylogenetic structure. Glob. Ecol. Biogeogr. 2021, 30, 1070–1085. [Google Scholar] [CrossRef]
  58. Rubinoff, D.; Cameron, S.; Will, K. A genomic perspective on the shortcomings of mitochondrial DNA for “barcoding” identification. J. Hered. 2006, 97, 581–594. [Google Scholar] [CrossRef]
  59. Song, H.; Buhay, J.E.; Whiting, M.F.; Crandall, K.A. Many species in one: DNA barcoding overestimates the number of species when nuclear mitochondrial pseudogenes are coamplified. Proc. Natl. Acad. Sci. USA 2008, 105, 13486–13491. [Google Scholar] [CrossRef] [PubMed]
  60. Song, H.; Moulton, M.J.; Whiting, M.F. Rampant nuclear insertion of mtDNA across diverse lineages within Orthoptera (Insecta). PLoS ONE 2014, 9, e110508. [Google Scholar] [CrossRef]
  61. Scribner, K.T.; Page, K.S.; Bartron, M.L. Hybridization in freshwater fishes: A review of case studies and cytonuclear methods of biological inference. Rev. Fish Biol. Fish. 2000, 10, 293–323. [Google Scholar] [CrossRef]
  62. Mastrantonio, V.; Porretta, D.; Urbanelli, S.; Crasta, G.; Nascetti, G. Dynamics of mtDNA introgression during species range expansion: Insights from an experimental longitudinal study. Sci. Rep. 2016, 6, 30355. [Google Scholar] [CrossRef]
  63. Carstens, B.C.; Pelletier, T.A.; Reid, N.M.; Satler, J.D. How to fail at species delimitation. Mol. Ecol. 2013, 22, 4369–4383. [Google Scholar] [CrossRef]
Figure 1. Map of sixteen species sampling sites. The base maps originated from the Standard Map Service website (https://www.webmap.cn/main.do?method=index, accessed on 6 January 2025).
Fishes 10 00157 g001
Figure 2. ML tree based on barcoding mitochondrial COI haplotype, where numbers below the branches represent bootstrap values (>50% shown). Ultrafast bootstrap supports (UBPs) from ML analysis are noted beside nodes. Scale bars represent 0.01 nucleotide substitutions per site. Each colored vertical bar represents a species delimited by each method utilized.
Fishes 10 00157 g002
Figure 3. Frequency distribution of pairwise genetic distances calculated using the Kimura 2-parameter (K2P) model (%) at intraspecific and interspecific levels within the genus Discogobio.
Fishes 10 00157 g003
Figure 4. Scatterplot of maximum intraspecific variation and minimum genetic distance to the nearest-neighbor species for each species in the genus Discogobio. Each circle represents a species. The dot falling below the 1:1 slope indicates the absence of a barcode gap.
Fishes 10 00157 g004
Table 1. Sampling information, numbers of individuals, and diversity parameters for the specimens included in this study.
SpeciesCollection SiteHaplotypeNumber of Specimens
(N)
Number of Haplotypes (Nh)Haplotype Diversity (h)Nucleotide Diversity (π)
D. antethoracalisWenshan, Yunnan, ChinaHap 28121//
D. bismargaritusGuangnan, Yunnan, ChinaHap 23–24420.500 ± 0.2650.00230 ± 0.00122
D. brachyphysallidosYiliang, Yunnan, ChinaHap 4631//
D. elongatusXuanwei, Yunnan, ChinaHap 2–3420.500 ± 0.2650.00077 ± 0.00041
D. laticepsZhenfeng, Xingren, Xiuwen, Ceheng, Luodian, Guizhou, ChinaHap 15–17
Hap 29–30
2650.732 ± 0.0540.00371 ± 0.00041
D. longibarbatusYuxi, Yunnan, ChinaHap 131//
D. macrophysallidosFuyuan, Yunnan; Xingyi, Guizhou, ChinaHap 4–1367100.698 ± 0.0550.00605 ± 0.00063
D. polylepisYuxi, Yunnan, ChinaHap 42–451040.733 ± 0.1200.00157 ± 0.00040
D. poneventralisWenshan, Yunnan, ChinaHap 36–37920.500 ± 0.1280.00077 ± 0.00020
D. propeanalisWenshan, Yunnan, ChinaHap 31–351550.705 ± 0.0880.00249 ± 0.00075
D. yunnanensisYiliang, Yuannan, ChinaHap 1411//
D. sp. 1Wenshan, Yunnan, ChinaHap 25–27530.800 ± 0.1640.00553 ± 0.00142
D. sp. 2Rongjiang, Sandu, Guizhou; Gongcheng, Guangxi, ChinaHap 47–501340.615 ± 0.1360.00492 ± 0.00201
D. sp. 3Shuicheng, Guizhou, ChinaHap 18–19420.500 ± 0.265/0.00154 ± 0.00081/
D. sp. 4Wenshan, Yunnan, ChinaHap 38–411340.603 ± 0.1310.00213 ± 0.00061
D. sp. 5Xingyi, Guizhou, ChinaHap 20–221730.404 ± 0.1300.00077 ± 0.00028
Table 2. Genetic K2P distances among the Discogobio species: the mean and the maximum of intra-group distances, the nearest neighbor (NN), and the minimum distance to the NN for the species.
SpeciesMean IntraMax IntraNN DistNN
D. antethoracalis0.00%0.00%1.29%D. poneventralis
D. bismargaritus0.23%0.46%2.38%D. laticeps
D. brachyphysallidos0.00%0.00%2.67%D. yunnanensis
D. elongatus0.08%0.15%0.96%D. laticeps
D. laticeps0.37%0.93%0.96%D. elongatus
D. longibarbatus0.00%0.00%2.84%D. yunnanensis
D. macrophysallidos0.61%1.56%2.72%D. sp. 4
D. polylepis0.16%0.46%2.46%D. yunnanensis
D. poneventralis0.08%0.15%1.29%D. antethoracalis
D. propeanalis0.25%0.93%3.22%D. sp. 4
D. yunnanensis//2.15%D. sp. 4
D. sp. 10.56%0.93%4.08%D. laticeps
D. sp. 20.21%0.77%2.90%D. yunnanensis
D. sp. 30.50%1.56%3.51%D. elongatus
D. sp. 40.07%0.31%2.13%D. laticeps
D. sp. 50.00%0.00%1.44%D. elongatus
Disclaimer/Publisher’s Note: The statements, opinions and data contained in all publications are solely those of the individual author(s) and contributor(s) and not of MDPI and/or the editor(s). MDPI and/or the editor(s) disclaim responsibility for any injury to people or property resulting from any ideas, methods, instructions or products referred to in the content.

