Article

Functional Analysis of NdBCO-like4 Gene in Pigmentation of Neocaridina denticulata sinensis

1
Key Laboratory of Healthy Mariculture for the East China Sea, Ministry of Agriculture and Rural Affairs, Fisheries College of Jimei University, Jimei University, 43 Yindou Road, Jimei, Xiamen 361021, China
2
State Key Laboratory of Mariculture Breeding, Fisheries College of Jimei University, Xiamen 361021, China
*
Author to whom correspondence should be addressed.
These authors contributed equally to this work.
Fishes 2025, 10(3), 134; https://doi.org/10.3390/fishes10030134
Submission received: 10 February 2025 / Revised: 13 March 2025 / Accepted: 16 March 2025 / Published: 19 March 2025
(This article belongs to the Section Aquatic Invertebrates)

Abstract

:
Cherry shrimp (Neocaridina denticulata sinensis) is one of the main ornamental shrimp because of its bright body color. β, β-carotene 9′,10′-dioxygenase (BCO2) is closely related to the body color produced by carotenoids. In order to study the role of NdBCO-like4 (homologous gene of BCO2) in the pigmentation of cherry shrimp, the expression profiles, RNA interference, and SNP genotyping were applied in this study. The NdBCO-like4 expression varied significantly among four color strains and five development stages (p < 0.05). The results showed that the NdBCO-like4 expression was the highest in the red strain and the lowest in the wild strain. During the embryonic development, the expression in the metanauplius stage was significantly lower than other stages (p < 0.05), and the expression of NdBCO-like4 was the highest in the membrane-zoea stage. In the metanauplius stage, the RNAi knockdown of NdBCO-like4 mediated the red pigment brightness value, and the pigment cell index in the treatment group was significantly lower than the control group (p < 0.05). After the first round of screening, a total of 8424 high-quality SNPs were obtained. There was one candidate SNP located on the NdBCO-like4 target gene, named G.1719G>A. The synonymous SNP exhibited significantly different genotype frequencies between the yellow and wild strains compared to other strains (p < 0.05), suggesting an association with these phenotypes. These results suggest that NdBCO-like4 has a close relation with carotenoid accumulation in cherry shrimp, providing valuable insights into the molecular mechanisms underlying pigmentation in this species.
Key Contribution: This study on the mechanism of body color formation in Neocaridina denticulata sinensis provides basic data for the mechanism of body color formation in aquatic animals through RNA interference and genotyping.

1. Introduction

Cherry shrimp (Neocaridina denticulata sinensis) belongs to Decapoda and is a small shrimp widely distributed in the freshwater of Asia [1]. Cherry shrimp has strong environmental adaptability and has a wide range of temperature and pH tolerance [2]. In natural strains of cherry shrimp, red or blue mutants are common. In the 1990s, China’s Taiwan began to cultivate red mutants and develop them into ornamental shrimp. The red cherry shrimp is particularly eye-catching in the green background of the aquatic grass landscape and has been the main species of ornamental aquariums since 2003. After imitating the breeding process of red cherry shrimp, the body color mutants were selected for multi-generation self-breeding, and various body color phenotypes were cultivated successively. Carotenoids are the main cause of color in most crustaceans [3]. Our previous data suggested that cherry shrimp derive their color primarily from various carotenoids.
Carotenoids, a type of natural pigment with the widest distribution, are found in a variety of organisms, including photosynthetic bacteria, archaea, fungi, algae, plants, and animals. For most animals, carotenoids are foreign pigments. Almost no animals can synthesize carotenoids de novo, but they can obtain carotenoids from food [4]. Animals can modify and transform exogenous carotenoids to serve their own needs. Reducing the activity of carotenoid lyase is one of the ways that animals increase the accumulation of carotenoids [5]. Intestinal epithelial cells can convert beta-carotene to vitamin A [6], and the catalytic enzyme for this action is called carotenoid cracking dioxygenase (CCD). There are two types of CCD. β-carotene oxygenase 1 (BCO1), which can decompose C15’and C15’double bonds, was identified first, and BCO2, which can split C9’and C10’double bonds, was found later [7]. BCO1 can add both oxygen atoms in the oxygen molecule to its products, but the key steps of the catalysis are still unclear [6]. There are many species of BCO2 substrates, including lycopene, zeaxanthin, lutein, and keratoxanthin, in addition to beta-carotene [6]. BCO2 substrates are species-specific, and mouse and human BCO2 can convert apocarotenoids into dicarbonyl compounds [6], but chicken BCO2 cannot catalyze this reaction [6]. BCO1 and BCO2 are mainly expressed in the intestine [8]. BCO1 is a monomeric, soluble, cytoplasmic enzyme that interacts with biofilms, lipid droplets, and proteins in the cytoplasm to obtain substrates [8]. BCO2 is located in the inner membrane of mitochondria [9], which is dependent on signal peptide localization. Studies on the function loss of BCO1 and BCO2 in mice have shown that BCO1 mainly produces vitamin A [10], and the function loss of BCO2 leads to the accumulation of carotenol in the mitochondrial membrane of liver [10]. Loss of the BCO1 or BCO2 function can lead to the accumulation of large amounts of carotenoids in liver and fat [11].
The functions of BCO1 and BCO2 are highly conserved in evolution. Both have the same RPE65 functional domain and belong to the retinal pigment epithelial membrane protein family. It is generally believed that carotenoid accumulation has many benefits for the body. BCO1 provides the body with vitamin A, while the function of BCO2 is puzzling. BCO2 deficiency is associated with oxidative stress [6], which can cause tissues to be in a state of oxidative stress and reduce the mitochondrial respiration rate [12]. In the development of vertebrate embryos, BCO2 prevents carotenoid toxicity [13]. At present, BCO2 has been found to be associated with carotenoid accumulation in a variety of animals, and the mutation of this gene will lead to a large accumulation of carotenoids, leading to an increase in body color [11,14,15].
While the functions of BCO1 and BCO2 have been extensively investigated, the carotenoid cleavage dioxygenase (CCD) family includes other homologous genes whose roles in carotenoid metabolism are less well defined. Among them, BCO-like4, which is a homolog of BCO2, deserves special attention. In several species, BCO-like4 exhibits distinct expression patterns and potentially divergent functions compared to BCO2 [16,17,18,19], indicating a unique function. However, the exact mechanisms through which BCO-like4 contributes to pigmentation remain largely unknown, particularly in Neocaridina denticulata sinensis. Therefore, this study focuses on the BCO-like4 gene in N. d.. sinensis to explore its role in pigment deposition, aiming to provide novel insights into the regulatory mechanisms underlying body color in shrimp.
In this study, the full-length cDNA sequence of NdBCO-like4, a homologous gene of BCO2 (GeneBank No. PRJNA1209643) in cherry shrimp (Neocaridina denticulata sinensis), was analyzed, and its expression was also analyzed by quantitative PCR (qPCR) in different strains and embryos of various developmental stages. In addition, the changes in the phenotype and gene expression level of the embryos after RNAi were examined. A SNP of NdBCO-like4 was identified, and its correlation analysis with color strains was processed. The purpose of this study was to gain insight into the role of NdBCO-like4 in the pigment deposition of cherry shrimp. These data might serve as a foundation for future studies to improve body color and breed novel varieties.

2. Materials and Methods

2.1. Ethical Statement

Rare or protected animals were not included in the experiments of this study. This study was approved by the Animal Care Advisory Committee of Jimei University (Approval No. 2019-0906-003, 6 September 2019).

2.2. Experimental Animals

The red, blue, yellow, and wild-type strains of cherry shrimp used in this study were derived from laboratory-owned strains [20,21]. All strains had been selectively bred for over three years to achieve consistent and uniform body coloration. Cherry shrimps were cultured in glass tanks (40 cm × 30 cm × 25 cm). Each tank was prepared by creating a partitioned area (15 cm × 30 cm × 5 cm) at the bottom, filled with Aqua Design Amano (ADA) aquarium soil to provide nutrients for the growth of benthic algae and aquatic plants, and to maintain a slightly acidic water pH. The tanks were filled with aerated tap water and disinfected with 10 mL of formaldehyde. Following the formaldehyde treatment, the water was allowed to clear, after which a 50% water change was performed, and 0.5 g of nitrifying bacteria was added to promote a healthy microbial community. Two days later, 100 g of Ceratophyllum demersum and Vesicularia dubyana was introduced to establish a micro-ecosystem, providing water purification, oxygen, and shelter for the shrimp.
Culture water consisted of tap water that had been aerated for 24 h. Fifty percent of the water was changed every three days, and the tanks were completely emptied and cleaned monthly. Water temperature was maintained at approximately 25 °C. Shrimp were fed daily with a moderate amount of No. 0 shrimp compound feed (Xiamen Jiakang Feed Co., Ltd., Xiamen, China). Each tank was stocked with 30 sexually mature females and 10 males, with each strain cultured separately. After three months, offspring were transferred to new glass tanks following birth.

2.3. Tissue Collection

Cherry shrimps with body lengths of approximately 1.2 cm were selected from the culture tanks, and these shrimp samples were used for the whole gene expression analysis. Each individual shrimp served as a biological replicate, with seven biological replicates collected per strain. All samples were immediately frozen in liquid nitrogen and stored at −80 °C.
For tissue sampling, individuals were removed from the culture tanks and placed in a small beaker containing water from the original tank. The beaker was then placed on ice to anesthetize the shrimp with cold temperature. Subsequently, the shrimp were transferred to a petri dish on ice and dissected under a dissecting microscope. Compound eyes, hepatopancreas, muscle, epidermis, and digestive tract tissues were collected, flash-frozen in liquid nitrogen, and stored at −80 °C for further research. Seven individuals were randomly selected from each strain to serve as seven biological replicates.

2.4. Full-Length cDNA Verification and Bioinformatics Analysis of NdBCO-like4

cDNA was derived from RNA reverse transcription, and we then verified its full length using full-length Polymerase Chain Reaction (PCR). ORF (open reading frame) finder (https://www.ncbi.nlm.nih.gov/orffinder/) was used to find the ORF sequence. ExPASy (https://web.expasy.org/compute_pi/) online software was used to predict the isoelectric point and molecular weight. BLAST (v2.15.0) was adopted to obtain the homology sequences of NdBCO-like4 in other species, and a phylogenetic tree was constructed using the neighbor-joining (NJ) method of MEGA7 [22]. Multiple alignments of sequences were performed using ClustalX 2.1 [23].

2.5. Collection of Embryos at Different Developmental Stages

For sampling embryos, berried red females (berried females were defined as those carrying eggs externally on their pleopods) were collected and transferred to a new glass tank. The development stage was identified by microscopic observation with an anatomic microscope. The stages of embryonic development refer to Fan [24]. Individual eggs were gently detached using a cotton swab drawn into a fine thread and transferred to individual wells of a culture dish. The chromatophores first appear at the metanauplius stage and gradually mature through the pre-zoea stage and membrane-zoea stage. The three stages, as well as the pre-nauplius stage and young cherry shrimp stage, were selected to detect gene expression. All embryos of a berried female served as a biological replicate, with seven biological replicates collected for each developmental stage. All replicates were frozen in liquid nitrogen and stored at −80 °C.

2.6. Total RNA Extraction, cDNA Synthesis, and Quantitative Polymerase Chain Reaction (qPCR)

Total RNA extraction was processed with RNA-solv reagent (Omega Bio-tek, Inc., Norcross, GA, USA) according to the manufacturer’s protocol [25]. The extracted RNA was immediately subjected to 1% agarose gel electrophoresis. At the same time, the absorbance of total RNA was determined using a NanoBio100 micro-ultraviolet spectrophotometer (OPTOSKY Co., Ltd., Xiamen, China). The electrophoretic images and absorbance values were aggregated to determine the purity, degradation degree, and concentration of total RNA. Approximately 1 μg of total RNA was used as a template to synthesize the first strand of its complementary DNA. The cDNA synthesis reagent kit was from TIANGEN (Tiangen Co., Ltd., Beijing, China). The detailed operation process was carried out according to its manual. After the reaction, 1 µL of reverse transcription mother liquor was diluted 10–100 times, and the diluent and mother liquor were stored in the refrigerator at −20 °C for later use.
Primers were designed using the online software Primer3.0 (https://sourceforge.net/projects/primer3/), synthesized by TsingKe Biotechnology Co., ltd. (Beijing, China). Six replicates per treatment were analyzed. The relative expression level of the target gene was calculated using the 2−ΔΔCt method based on the internal reference gene of glyceraldehyde-3-phosphate dehydrogenase (GAPDH, GenBank No. MZ734609) [26]. The qPCR reaction was performed in a 10 μL reaction volume, including 0.25 μL forward primer (10 mM), 0.25 μL reverse primer (10 mM), 5 μL GOY-P2028 SYBR green master mix (Coybio, China), and 4.5 μL cDNA template. qPCR was carried out on a QuantStudio 6 Flex instrument (Applied Biosystems, Carlsbad, CA, USA) with the following procedure: 95 °C for 5 min (degeneration), 40 cycles of 95 °C for 10 s, 60 °C for 10 s (annealing), and 72 °C for 10 s (elongation) [20].

2.7. Double-Stranded RNA (dsRNA) Generations

dsRNA for RNA interference was prepared by in vitro transcription [27]. In order to ensure that the target gene can be degraded at the 5′ end of the open reading frame (ORF), the sequence located at the 5′ end of the ORF should be selected as the template for the synthesis of dsRNA (about 300 bp). The PCR primers for amplified target DNA are shown in Table 1. We described the details of dsRNA synthesis in the previous paper [27]. In general, in the second PCR amplification with the addition of the T7F primer or the T7R primer, the target DNA fragment was added with the T7 promoter sequence at the 5′ end or 3′ end, respectively (Table 1), where the T7 promoter sequence was added at the 5′ end of the specific primer. The new DNA fragment with the T7 promoter sequence was chosen as the template for the sense RNA or anti-sense RNA of the target gene. After mixing positive-sense and anti-sense single-stranded RNA in equal amounts, dsRNA was obtained by annealing in the PCR process. The annealing procedure was set at 75 °C for 15 min, 65 °C for 15 min, and then dropped to 25 °C at a rate of 0.2 °C/s. The dsRNA of enhanced green fluorescent protein (EGFP) served as a negative control to eliminate the disturbance of non-specific dsRNA. All primers used in the dsRNA preparation are listed in Table 1. The concentration and purity of the dsRNA were determined by a NanoBio100 micro-ultraviolet spectrophotometer (OPTOSKY Co., Ltd., Xiamen, China). The quality and size of the dsRNA were detected by 1.5 % agarose gel electrophoresis, and the concentration was determined by 1 μL solution.
The remaining dsRNA was added with 1 μL RNase inhibitor, divided into 10 μL volumes in a 0.2 mL PCR tube, and stored in an ultra-low-temperature refrigerator at −80 °C for later use. The PCR products were recovered using the Universal DNA Purification Kit (Tiangen Co., Ltd., Beijing, China). The purified product was ligated to the pGEM-T Easy Vector (Promega, San Luis Obispo, CA, USA) containing the T7 promoter, transformed, and then verified by Sanger sequencing. The new DNA fragment with the T7 promoter sequence was chosen as the template for the sense RNA or anti-sense RNA of the target gene. The sense and anti-sense RNA strands were equivalently mixed and annealed to dsRNA (Thermo Fisher Scientific Waltham, Waltham, MA, USA).

2.8. Functional Analysis of NdBCO-like4 Gene Was Performed by RNA Interference (RNAi)

Mature female shrimp exhibiting high fecundity and carrying embryos in the metanauplius stage were selected, and embryos were collected according to the method described in Section 2.4. Embryos originating from the same female were divided into treatment and control groups, with each well containing 15 embryos. All embryos from one berried shrimp were treated with a 1–5% concentration of HClO for 1–2 min to soften the embryonic egg membrane. Then, the embryos were washed with ultra-pure water (0.01 μm) 2–3 times for 5 min each time, and the residual HClO was washed, divided into two equal parts, and put into the 24-well culture plate. An amount of 1 mL of ultra-pure water was put into each small hole and an appropriate amount of dsRNA was added to ensure that the final concentration was 5 μg/mL [28], and no dsRNA was added as a blank control group. After 12 h of interference, the ultra-pure water containing dsRNA was sucked with a disposable straw, washed twice with new ultra-pure water, and then re-added to 1 mL of ultra-pure water for 12 h, and the blank control group was treated with the same treatment. The NdBCO-like4 dsRNA was added as the treatment group (TG), and EGFP dsRNA was added as the negative control group (CG). After 24 h of interference, the phenotypic changes in the embryos were observed with Motic SM7 (MOTIC CHINA GROUP Co., Ltd., Hong Kong, China) and photographed. Embryos from one female served as one biological replicate. To ensure comparability between the treatment and control groups, phenotypic comparisons were performed exclusively using embryos derived from the same maternal shrimp. For each gene targeted by RNA interference (RNAi), five maternal shrimp were used as five independent biological replicates. Following RNAi treatment for each gene, quantitative PCR (qPCR) was performed to assess the expression level of the target gene and confirm the efficacy of the RNAi knockdown.
After the photos were taken, the image processing software Adobe Photoshop2020 [29] was used to obtain the brightness values of the regional red channel pixels and the pixel brightness values of all channels of pigment cells, and the ratio of the two was used as the brightness ratio of red pixels to measure the color depth of red body pigment cells. The pigment distribution scale was used to measure the morphology of the pigment cells [30]. Pigment cells have many branches, and particles are distributed inside the branches. The distribution scale of pigment can reflect the size of pigment cells and the number of branches. The distribution state of pigment particles is measured by the distribution index of pigment particles, which is commonly expressed by the 5-point method. Level 1 indicates the concentrated distribution of pigment particles, level 5 indicates the extreme dispersion of pigment particles, and the intermediate process is expressed by levels 2–4 [30].

2.9. Single Nucleotide Polymorphism (SNP) Identification

The high-quality clean reads were aligned to the assembled transcriptome and the HaplotypeCaller from GATK [31] software (v4.5.0.0) via default parameters to detect the potential SNPs, and then ANNOVAR4.1 [32] was applied to annotate the detected SNPs. A SNP was selected as high-quality if the QUAL score of the SNP was greater than 30, the reading depth was greater than 10, and the minimum allele frequency was greater than 0.05. The frequency of a mutant (minor) allele on each locus of each strain was calculated using the read counts of the mutant allele divided by all read counts on the locus. The frequency of the reference allele equaled 1 minus the frequency of the mutant allele. Subsequently, the heterozygosity (H) of each strain was calculated using the formula H = 2 × reference allele frequency × mutant allele frequency, and the average heterozygosity of all strains (HS) was defined as the average value of the H in all strains. Moreover, the total frequency of the reference allele and mutational allele on each locus was calculated using the total allelic read counts divided by all read counts on the monolocus of the total individuals, and the total heterozygosity (HT) was calculated using the formula HT = 2 × total reference allele frequency × total mutant allele frequency. Finally, the FST value was estimated using the following formula: FST = (HTHS)/HT.

2.10. Genotyping of Candidate SNPs

To identify SNPs potentially associated with population differentiation and adaptation, we selected the top 5% SNPs based on their FST values. SNPs with high FST values are more likely to exhibit significant allele frequency differences between populations and may be under selection pressure or linked to adaptive loci. And 5% FST is a strong choice and more reliable [33]. Candidate SNPs in NdBCO-like4 were genotyped by GT-seq (genotyping-in-thousands by sequencing). GT-seq is a method that uses next-generation multiplex PCR product sequencing to generate genotypes from thousands of individual target SNPs in a single Illumina HiSeq channel [34]. The details of GT-seq were described in our previous paper [35,36]. Individuals from four strains were genotyped. Each strain has 192 individuals. Genomic DNA of shrimp pleopods was extracted with Chelex-100.

2.11. Prediction of RNA Secondary Structure

We used the mfold UNAFold website online (http://www.unafold.org/mfold/applications/rna-folding-form-v2.php) to predict the SNP effects on the RNA secondary structure. During prediction, SNPs were submitted to the server as reference nucleotides and mutation nucleotides for prediction, and the effects of the SNPs on the secondary structure of the RNA were compared.

2.12. Data Analysis

All data were expressed as mean ± standard deviation (S.D.). The single-factor ANOVA of SPSS 22.0 [37] statistical software was used to analyze the embryo phenotype and gene expression profiles, and the T-test was used to analyze the phenotype and gene expression levels between the RNA interference treatment group and the control group. The difference was deemed significant at p < 0.05. The T-test was used to verify whether there were significant differences between the treatment group and the control group.
Clean data were obtained from raw data obtained by Trim Galore software (v0.6.7) [38] by removing low-quality bases and reads with too many unidentified bases. The sequence splicing software Pandaseq2.11 [39] was used to read the forward and reverse splicing of each sequence to obtain the FASTA format of the sequence. Bowtie2 was used to map sequencing sequences to target sequences, and the subject ID and sequence of each target sequence were obtained. Sequences that failed to map were used as the database, target sequences were used as query sequences, and the subject ID of each target sequence was obtained by using the blastn program of local BLAST software for comparison. faSomeRecords software (ucsc Genome Browser) was used to extract sequences based on the subject ID. All obtained sequence formats were arranged according to the target sequence format.
All subjects of the same target sequence were summarized into a sequence file. The “find” function of Excel 2021 software was used to determine the position of the SNP in the sequence according to the first round of the primer sequence, and the “mid” function was used to extract the base of the position. The “find” function was used to find the barcode position in the second round of primers, and the “mid” function was used to extract the 5′and 3′ barcode sequences to form individual label sequences. The number of SNP bases in each individual was counted according to the individual tag sequence, and the base number ratio was calculated as the allele ratio (AFI). Individuals with AFIs < 0.1 or AFIs > 10 were considered homozygous, those with AFIs < 0.2 or AFIs > 5 were heterozygous, and those with AFIs in other ranges were considered unclassifiable [35].
SPSS22.0 software (IBM Corp., Armonk, NY, USA) and the chi-square test were used to analyze the correlation of the SNP loci in these four strains [40]. ** represents a significant difference (p < 0.01).

3. Results

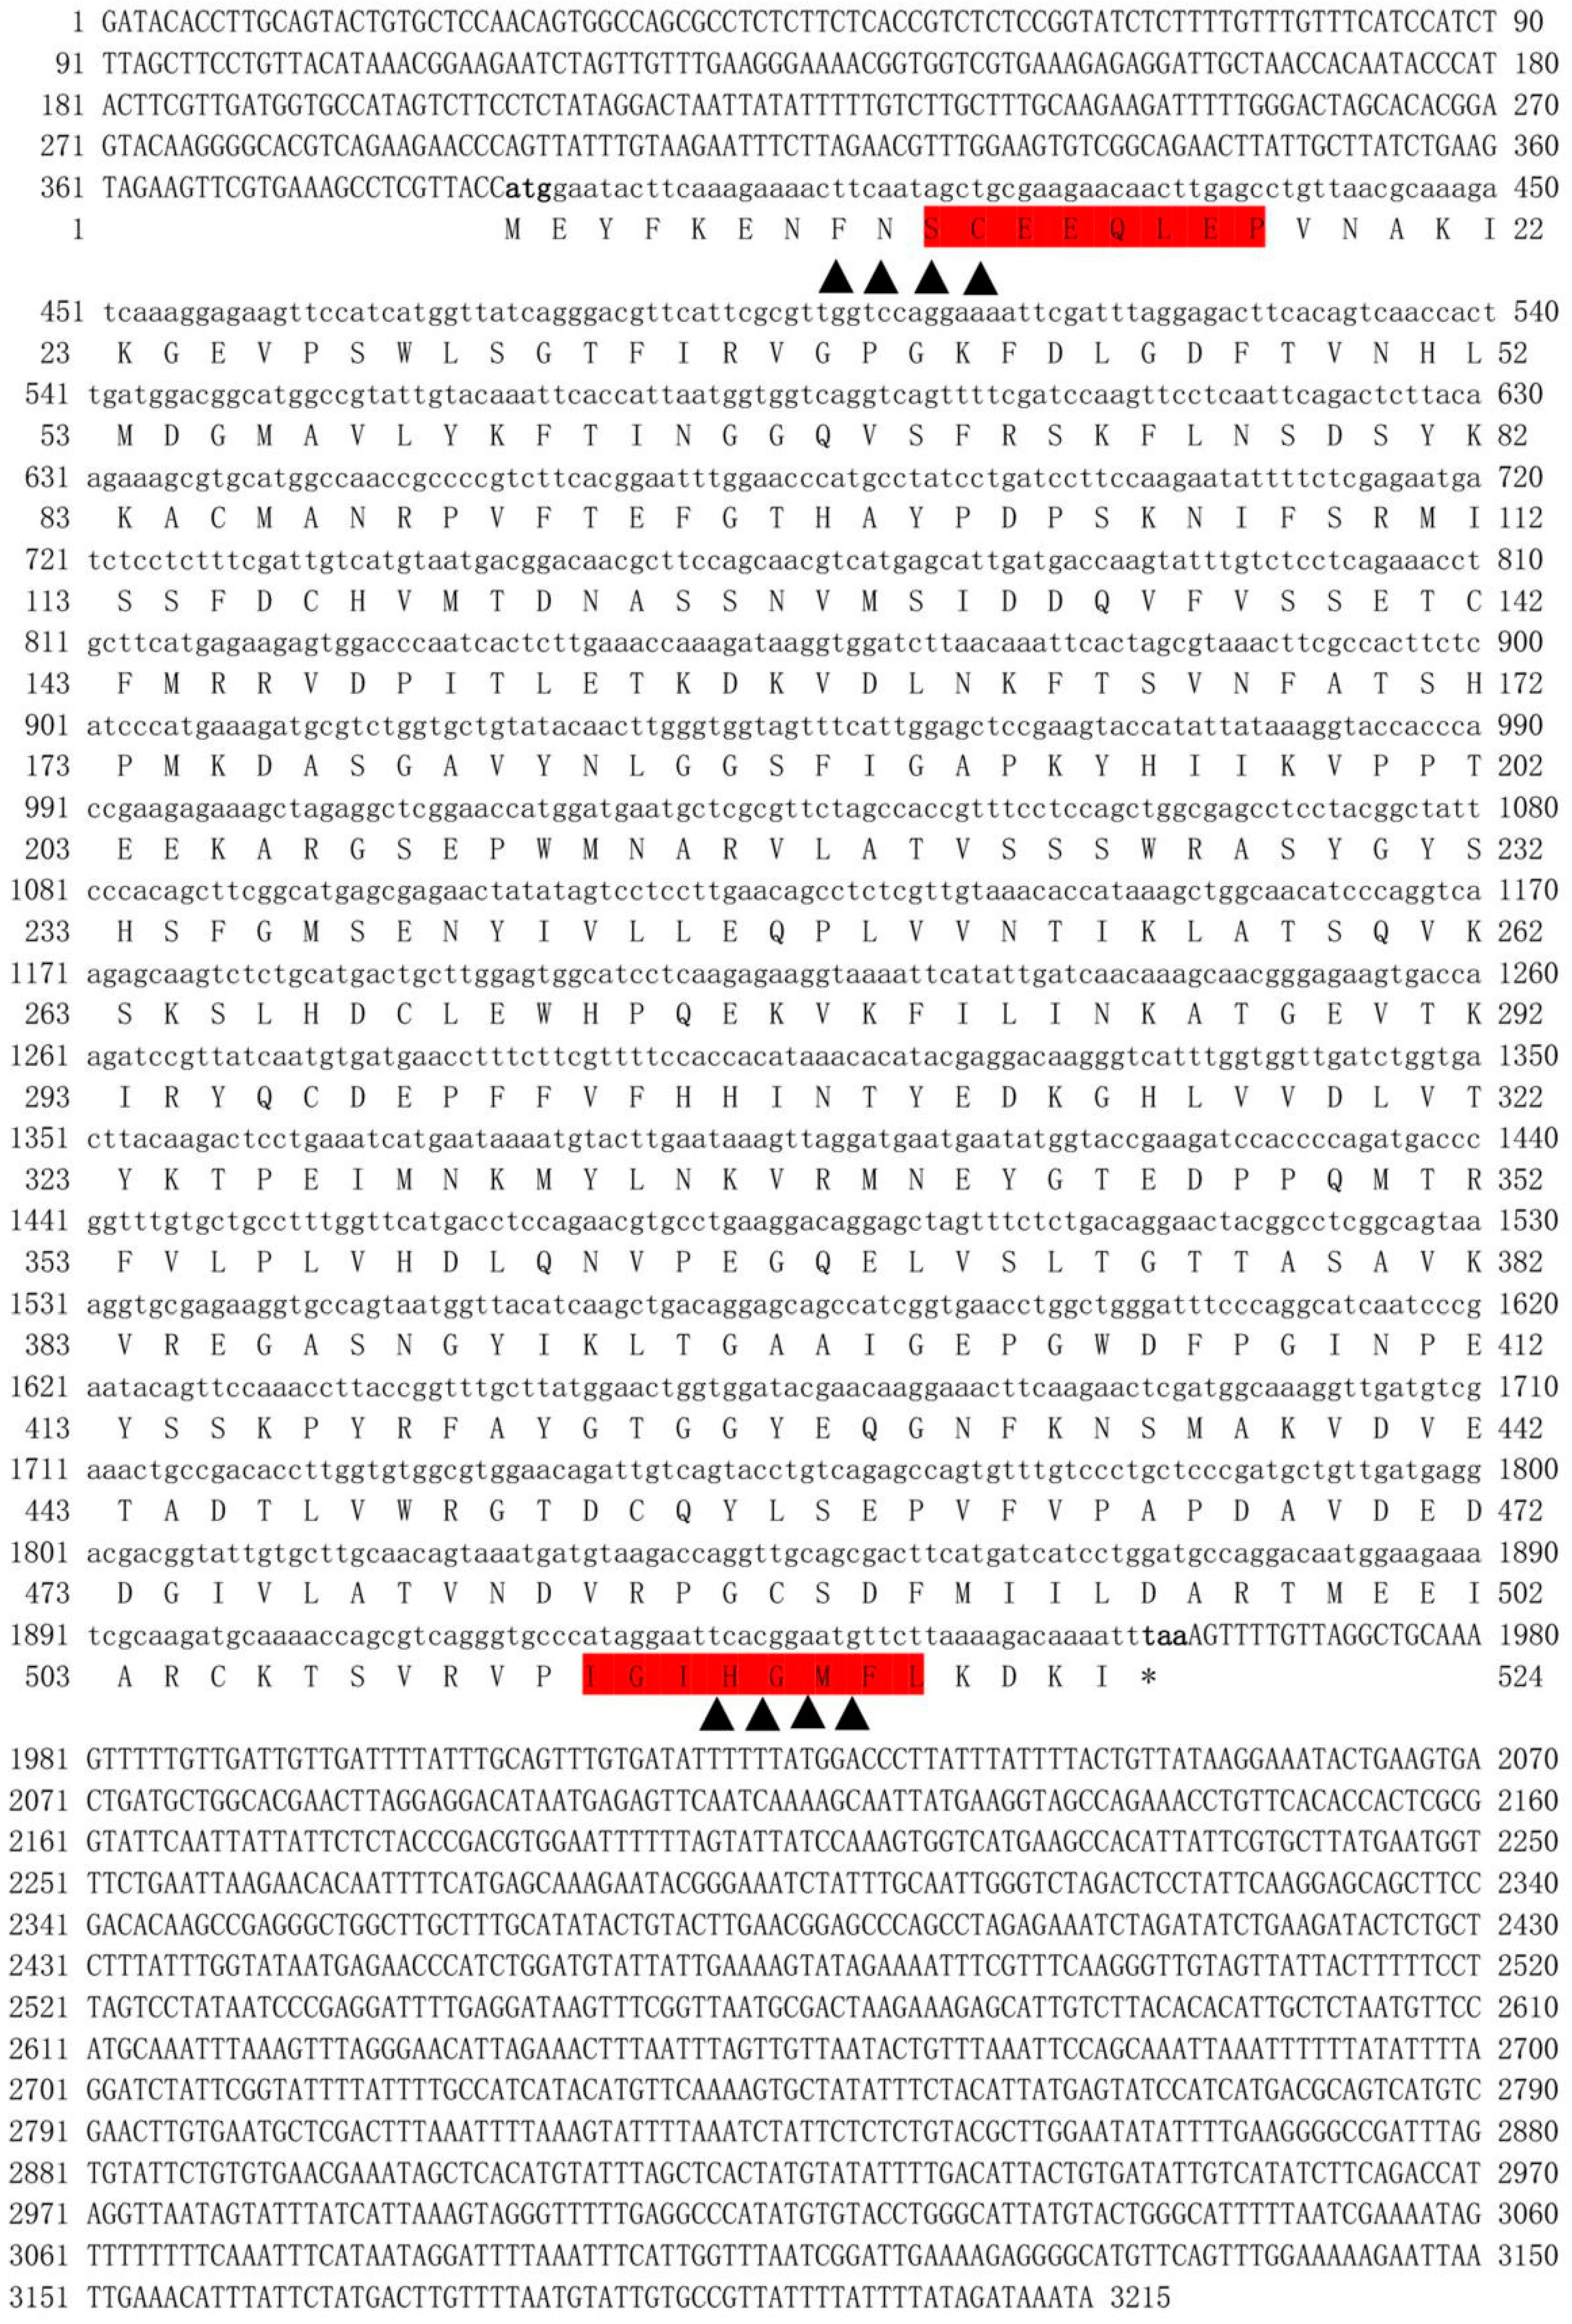
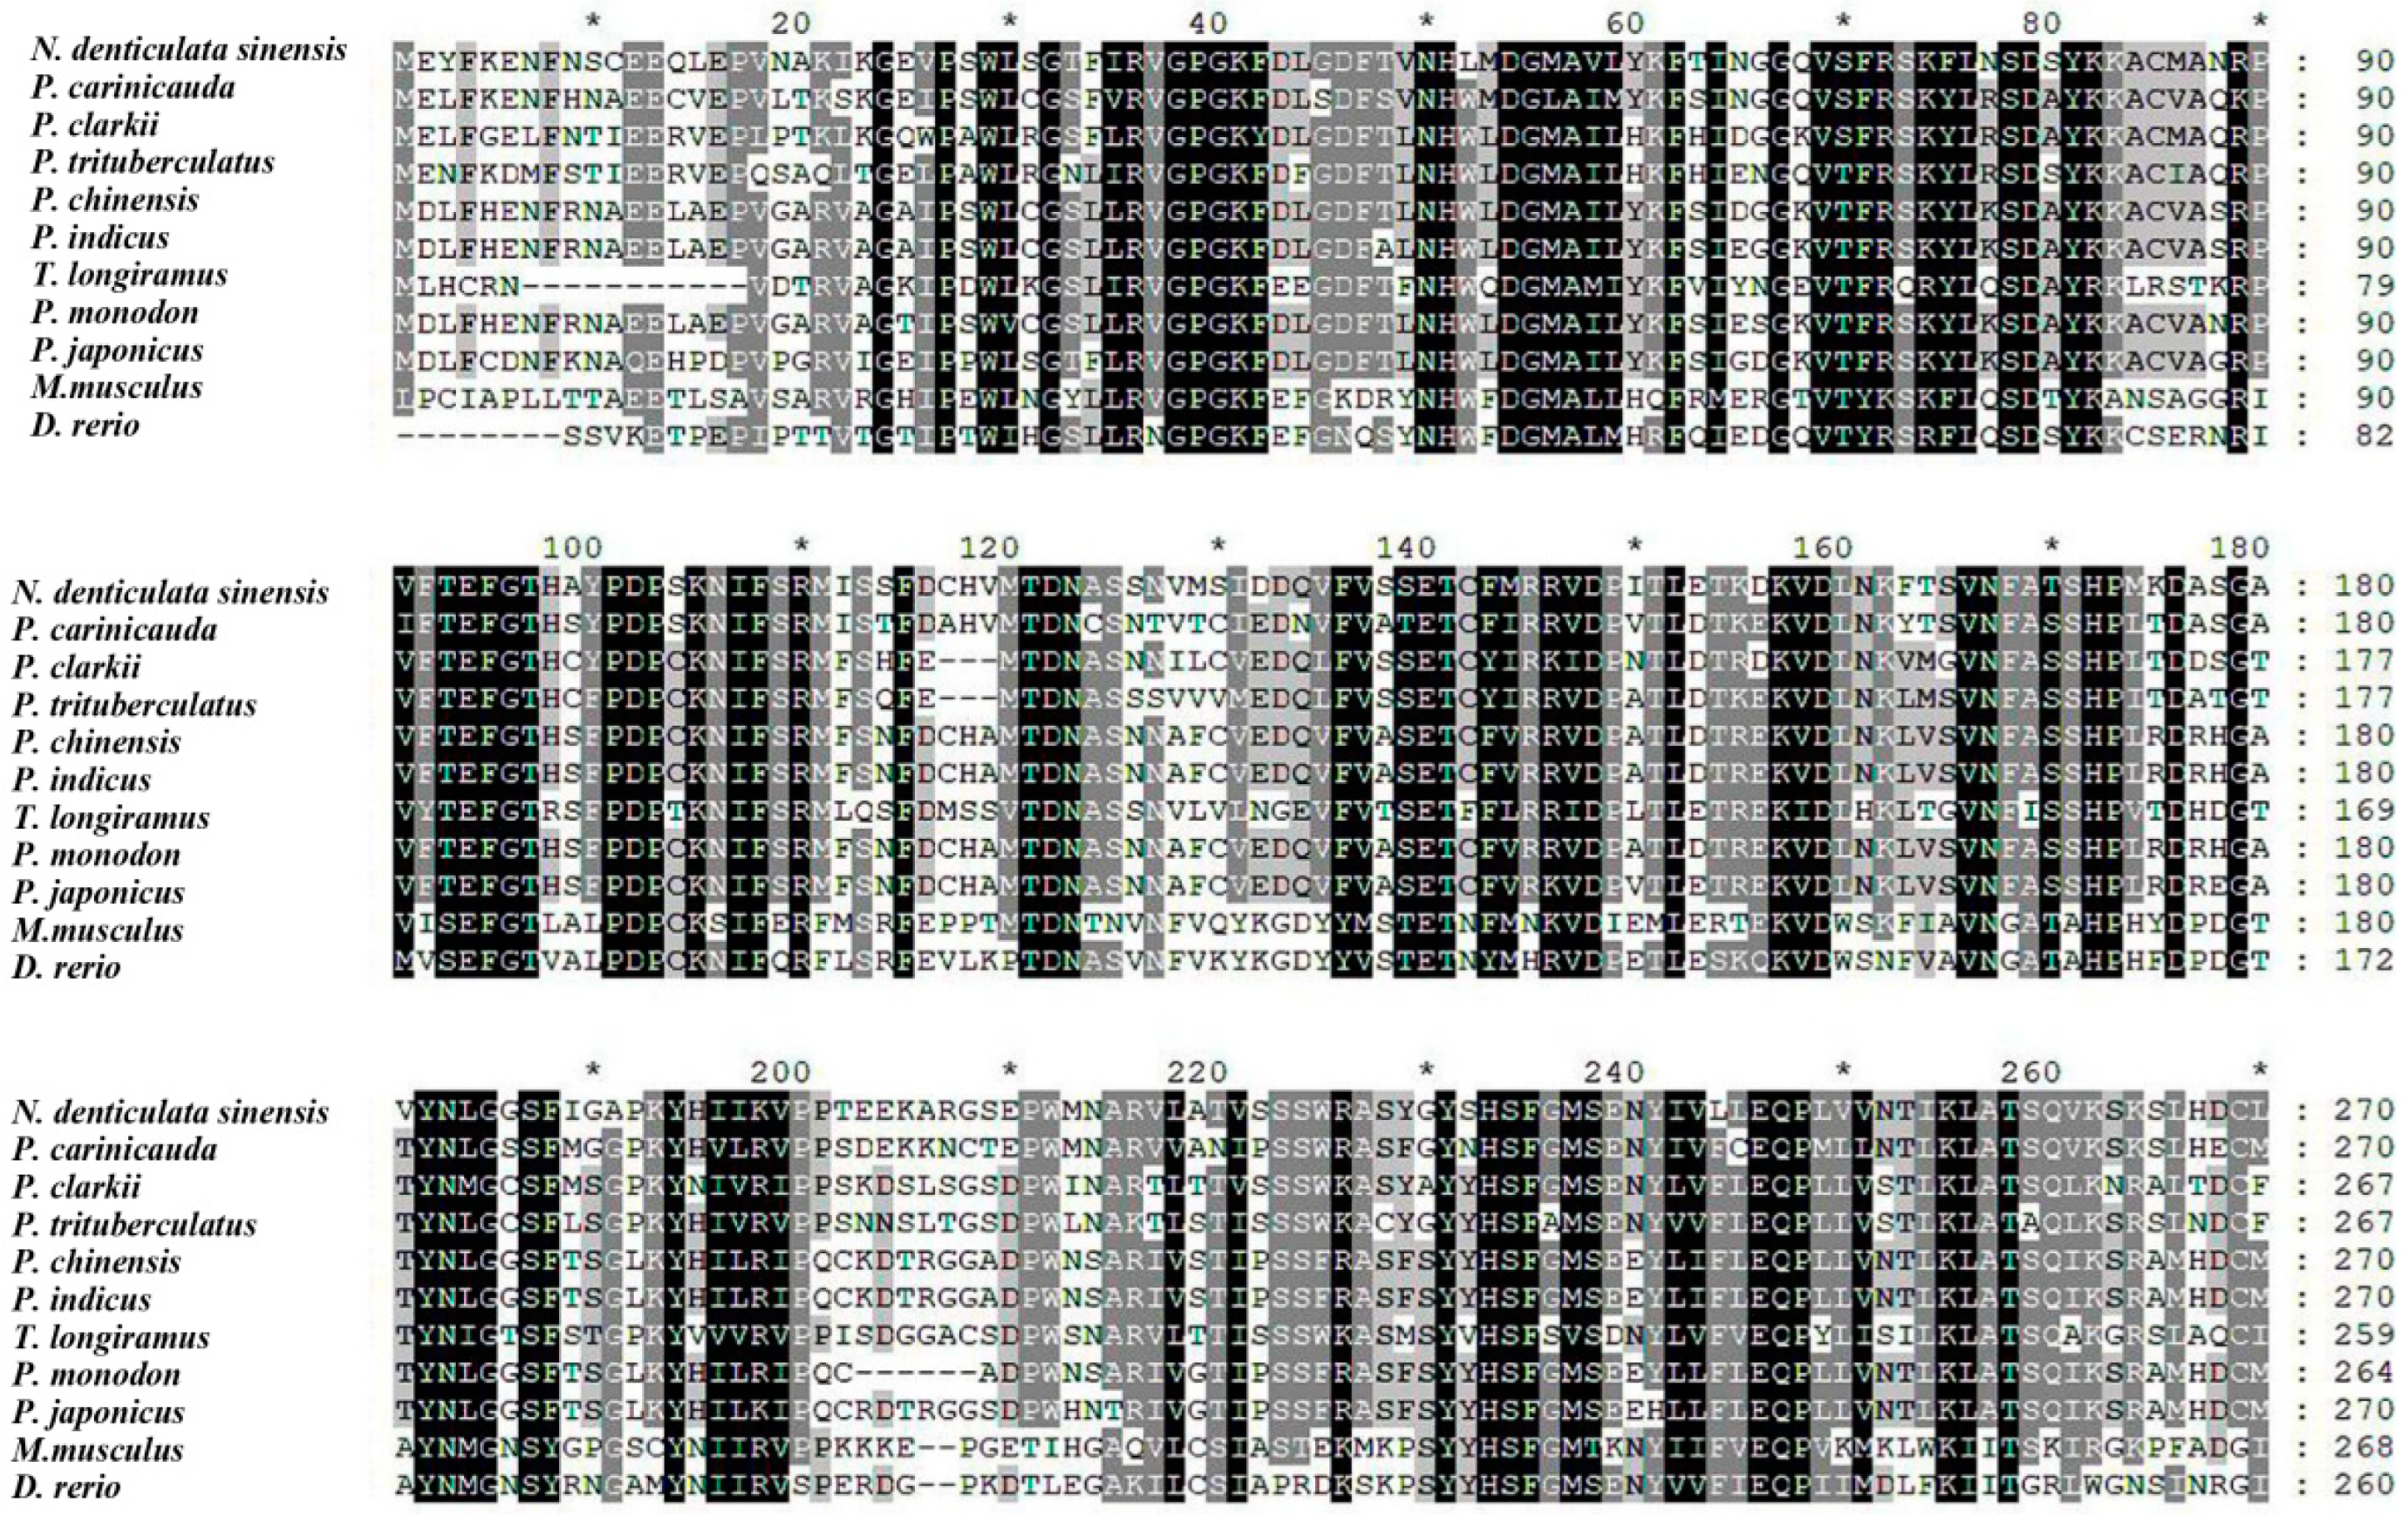
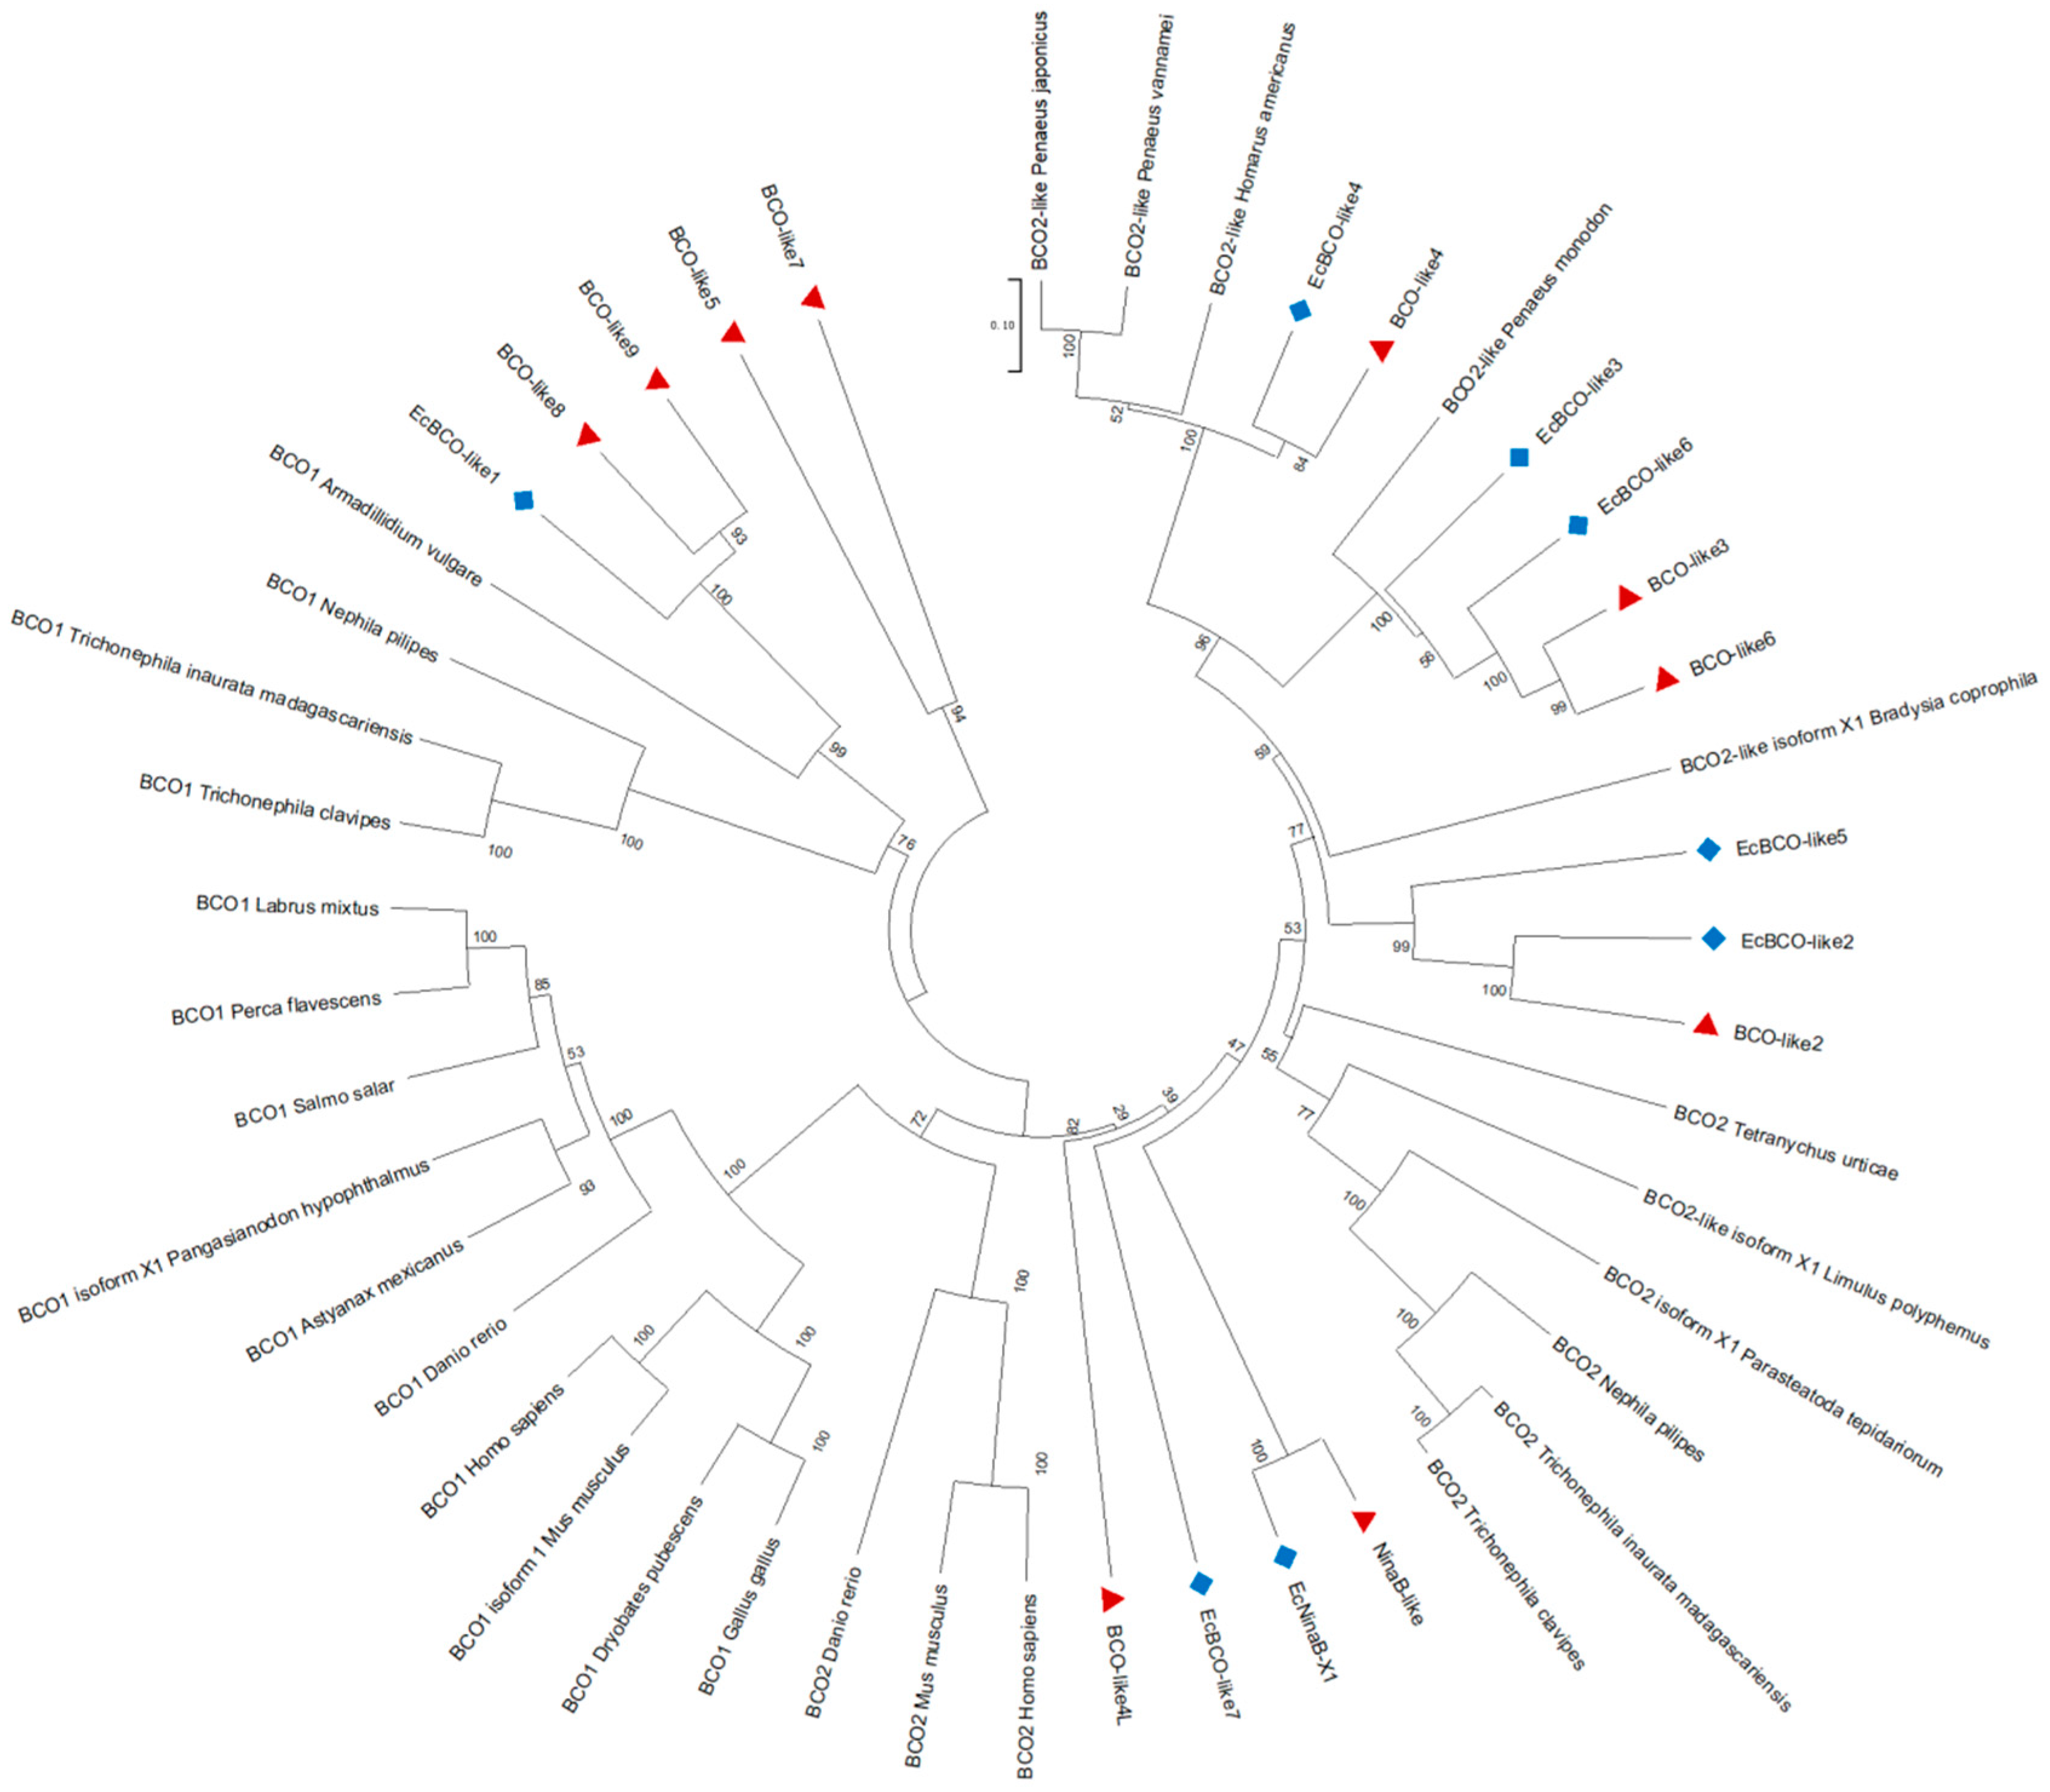
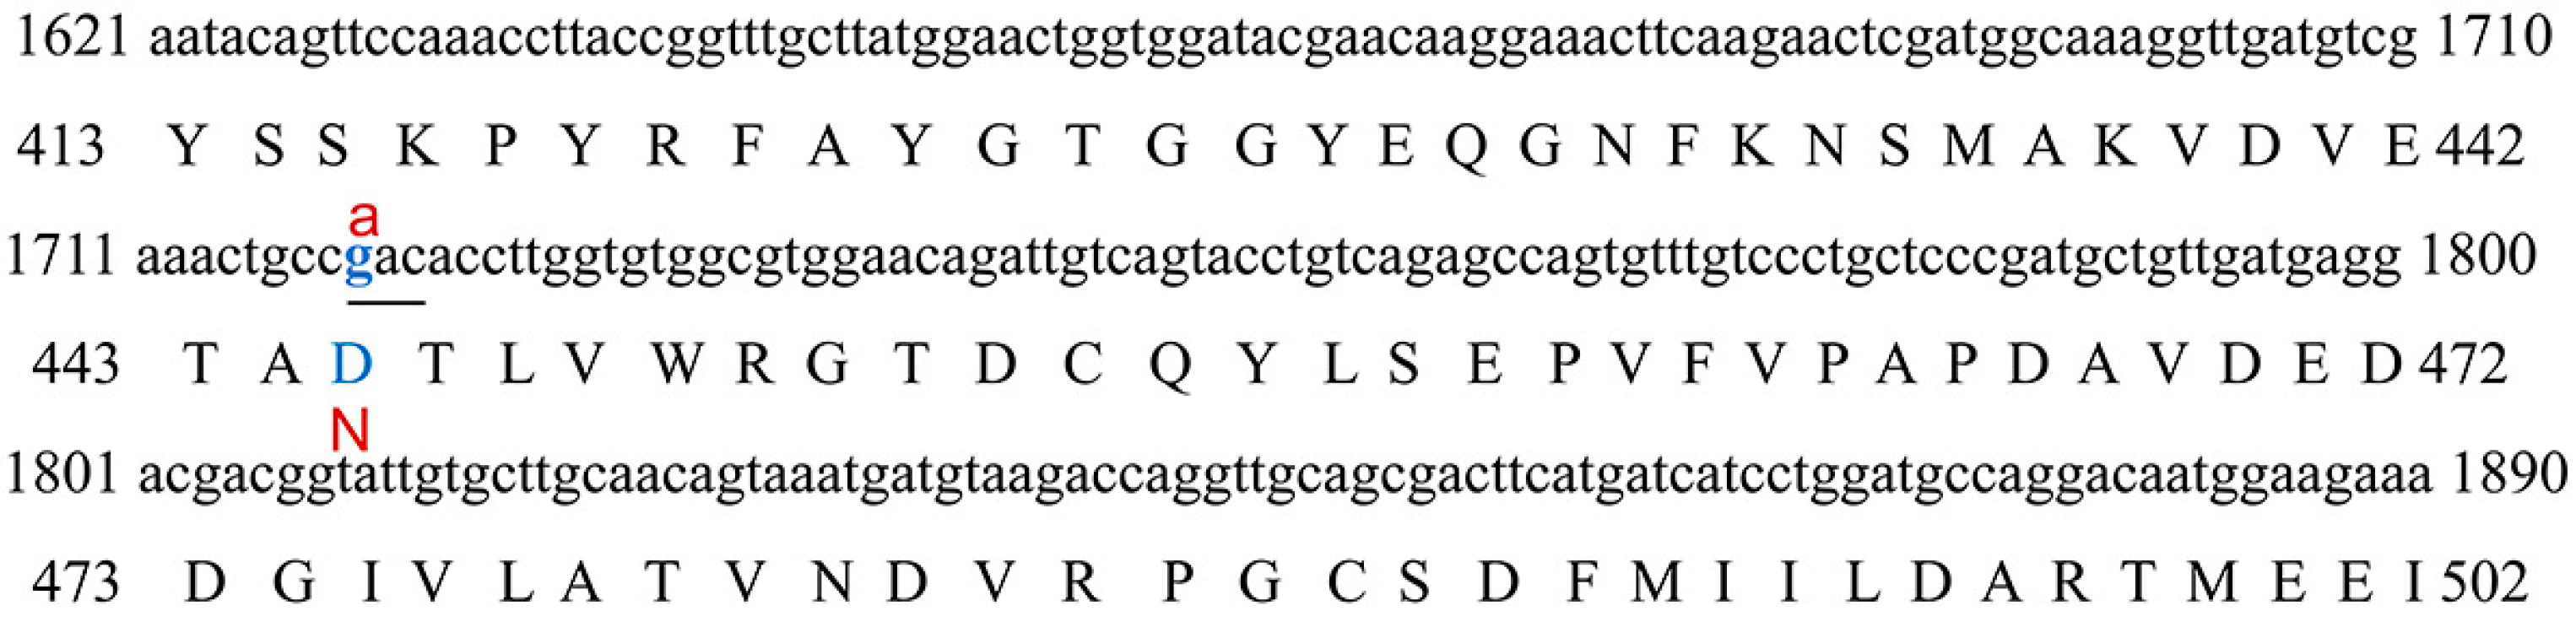
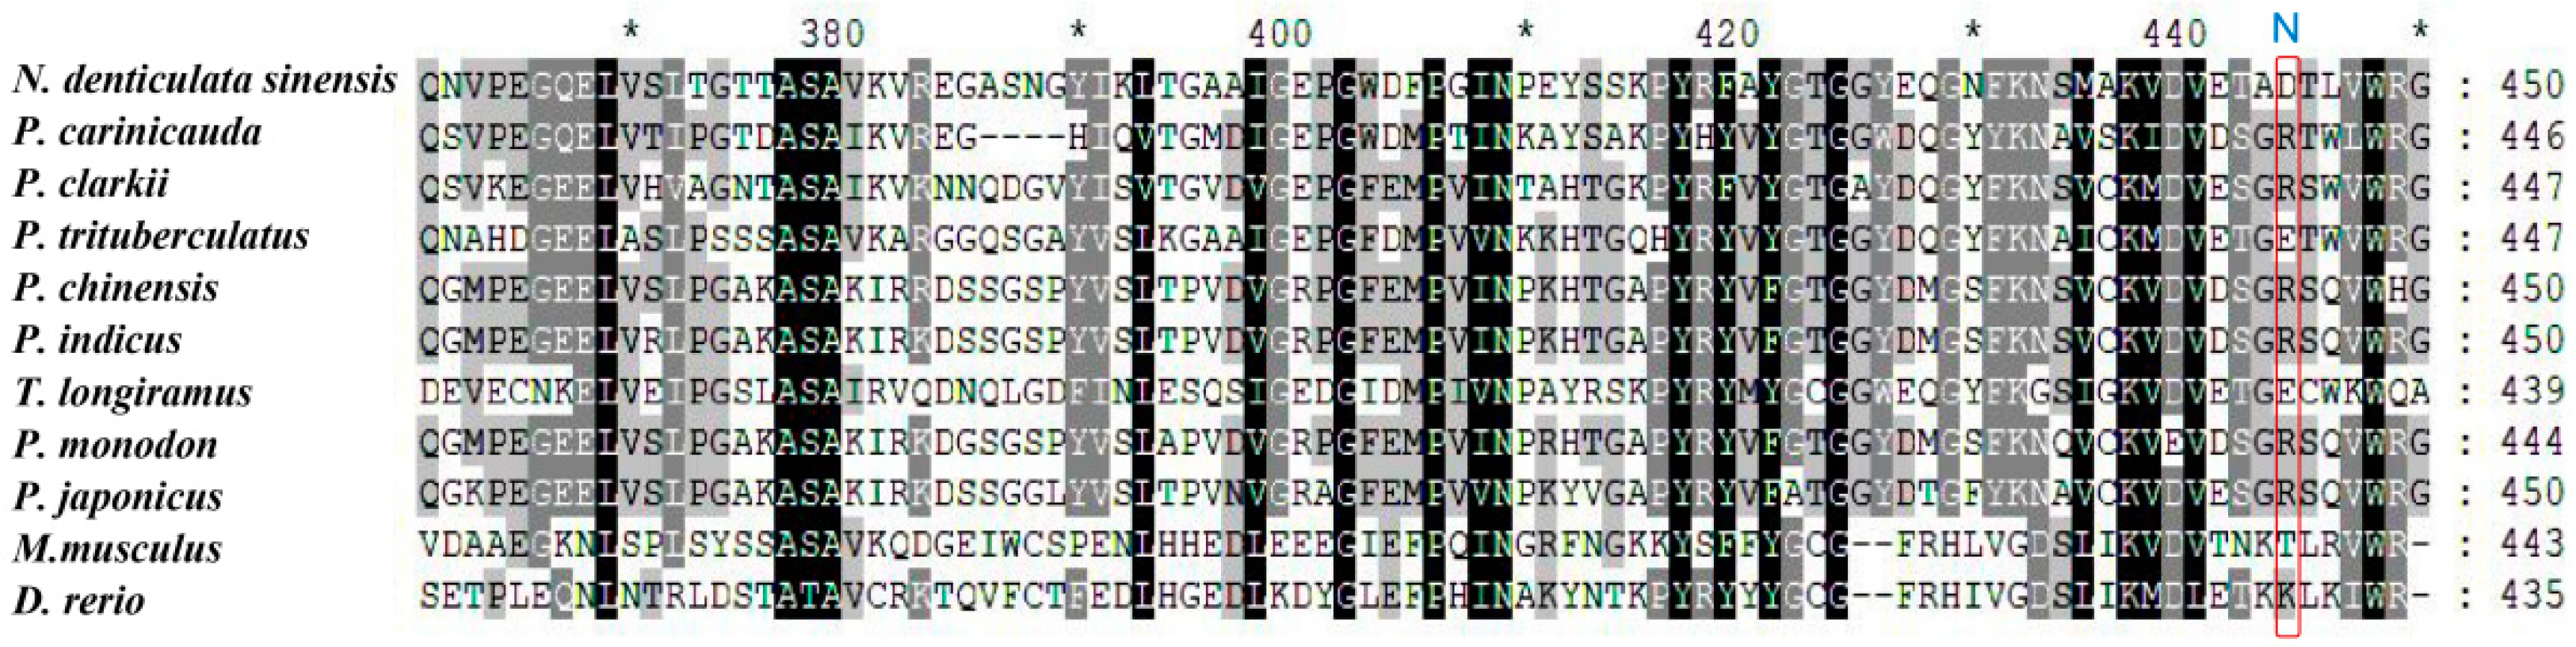
3.1. Molecular Features and Sequence Analysis of the NdBCO-like4 Gene

The full-length cDNA of NdBCO-like4 was 3215 bp, including a 1254 bp 5′ UTR and a 386 bp 3′ UTR (complete sequences are in the Figure A1). The open reading frame was 1575 bp, encoding 524 amino acids, with a predicted molecular mass of 58.65 kDa and a calculated isoelectric point of 5.78. The results of the multiple comparisons are shown in Figure 1. Phylogenetic analysis showed that the BCO1 and BCO2 in the invertebrates were separately clustered. Among these BCO-like genes, NdBCO-like4 was grouped together with BCO2-like in Penaeus japonicus and Penaeus vannamei, which was the distant cluster with BCO1 genes. The sequence characteristics of NdBCO4-like indicate that it is a homologue of BCO2 (Figure 2).

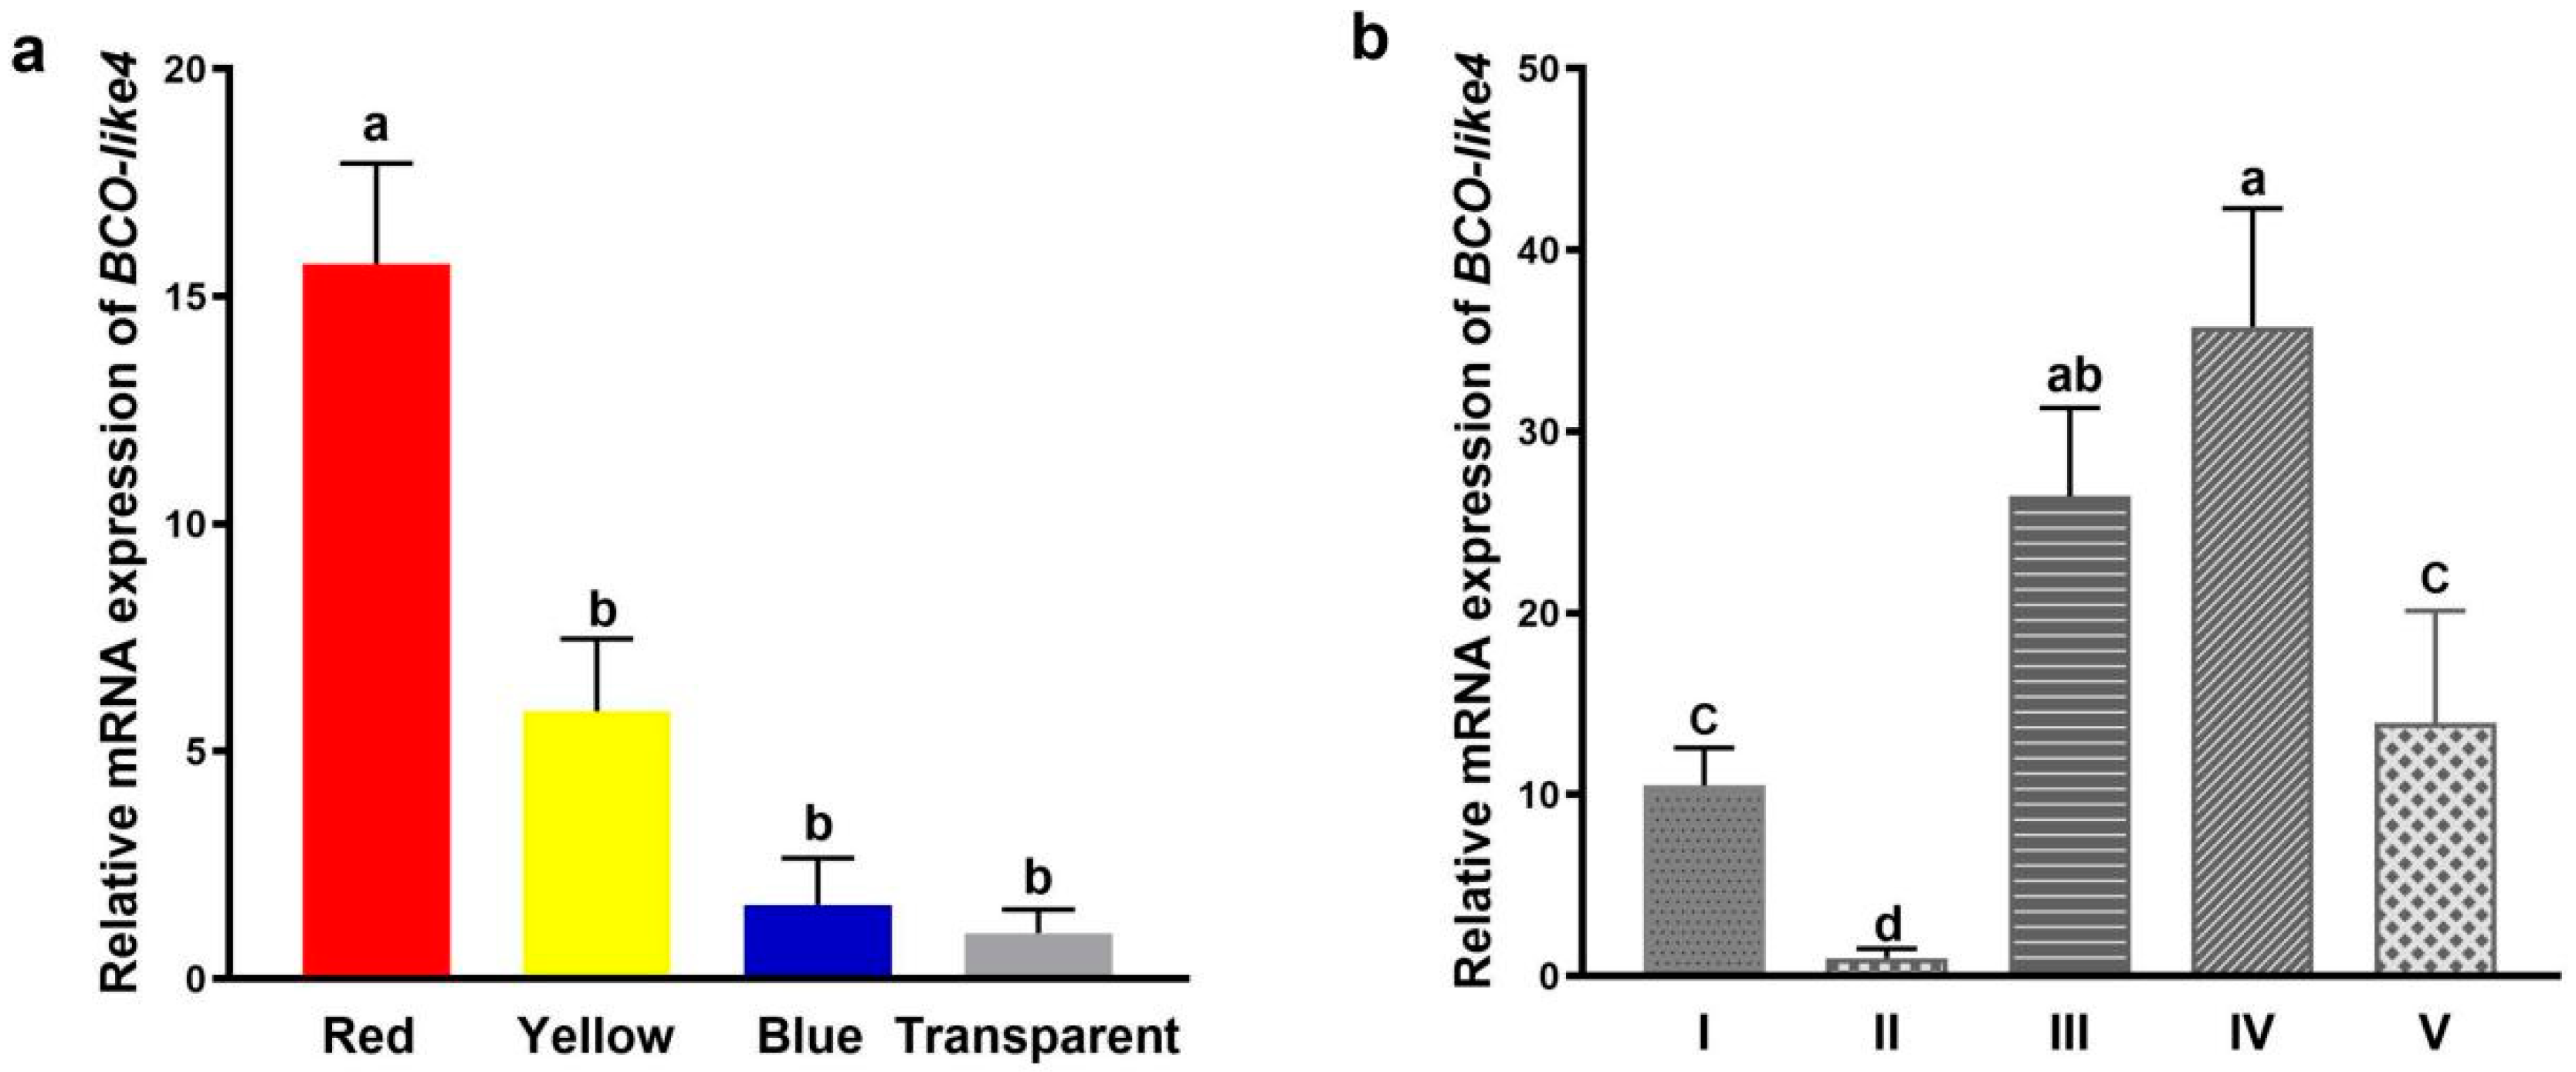
3.2. Expression of NdBCO-like4 Gene in Various Strains and Developmental Stages

NdBCO-like4 was detected in all the examined strains and tissues but exhibited a tissue-specific spatial expression pattern (Figure 3). The expression level of NdBCO-like4 in the red strain was significantly higher than the other strains (p < 0.05). Although the average expression level of the yellow strain was higher than the blue and transparent strains, there was no significant difference among the three strains (p > 0.05).
The expression of the NdBCO-like4 gene in the metanauplius stage was significantly lower than the other stages (p < 0.05), and the expression of the NdBCO-like4 gene increased sharply in the pre-zoea stage and then reached the highest in the membrane-zoea stage. There were significant differences between the membrane-zoea stage and the other three stages (p < 0.05) but no significant differences between the membrane-zoea stage and pre-zoea stage (p > 0.05).

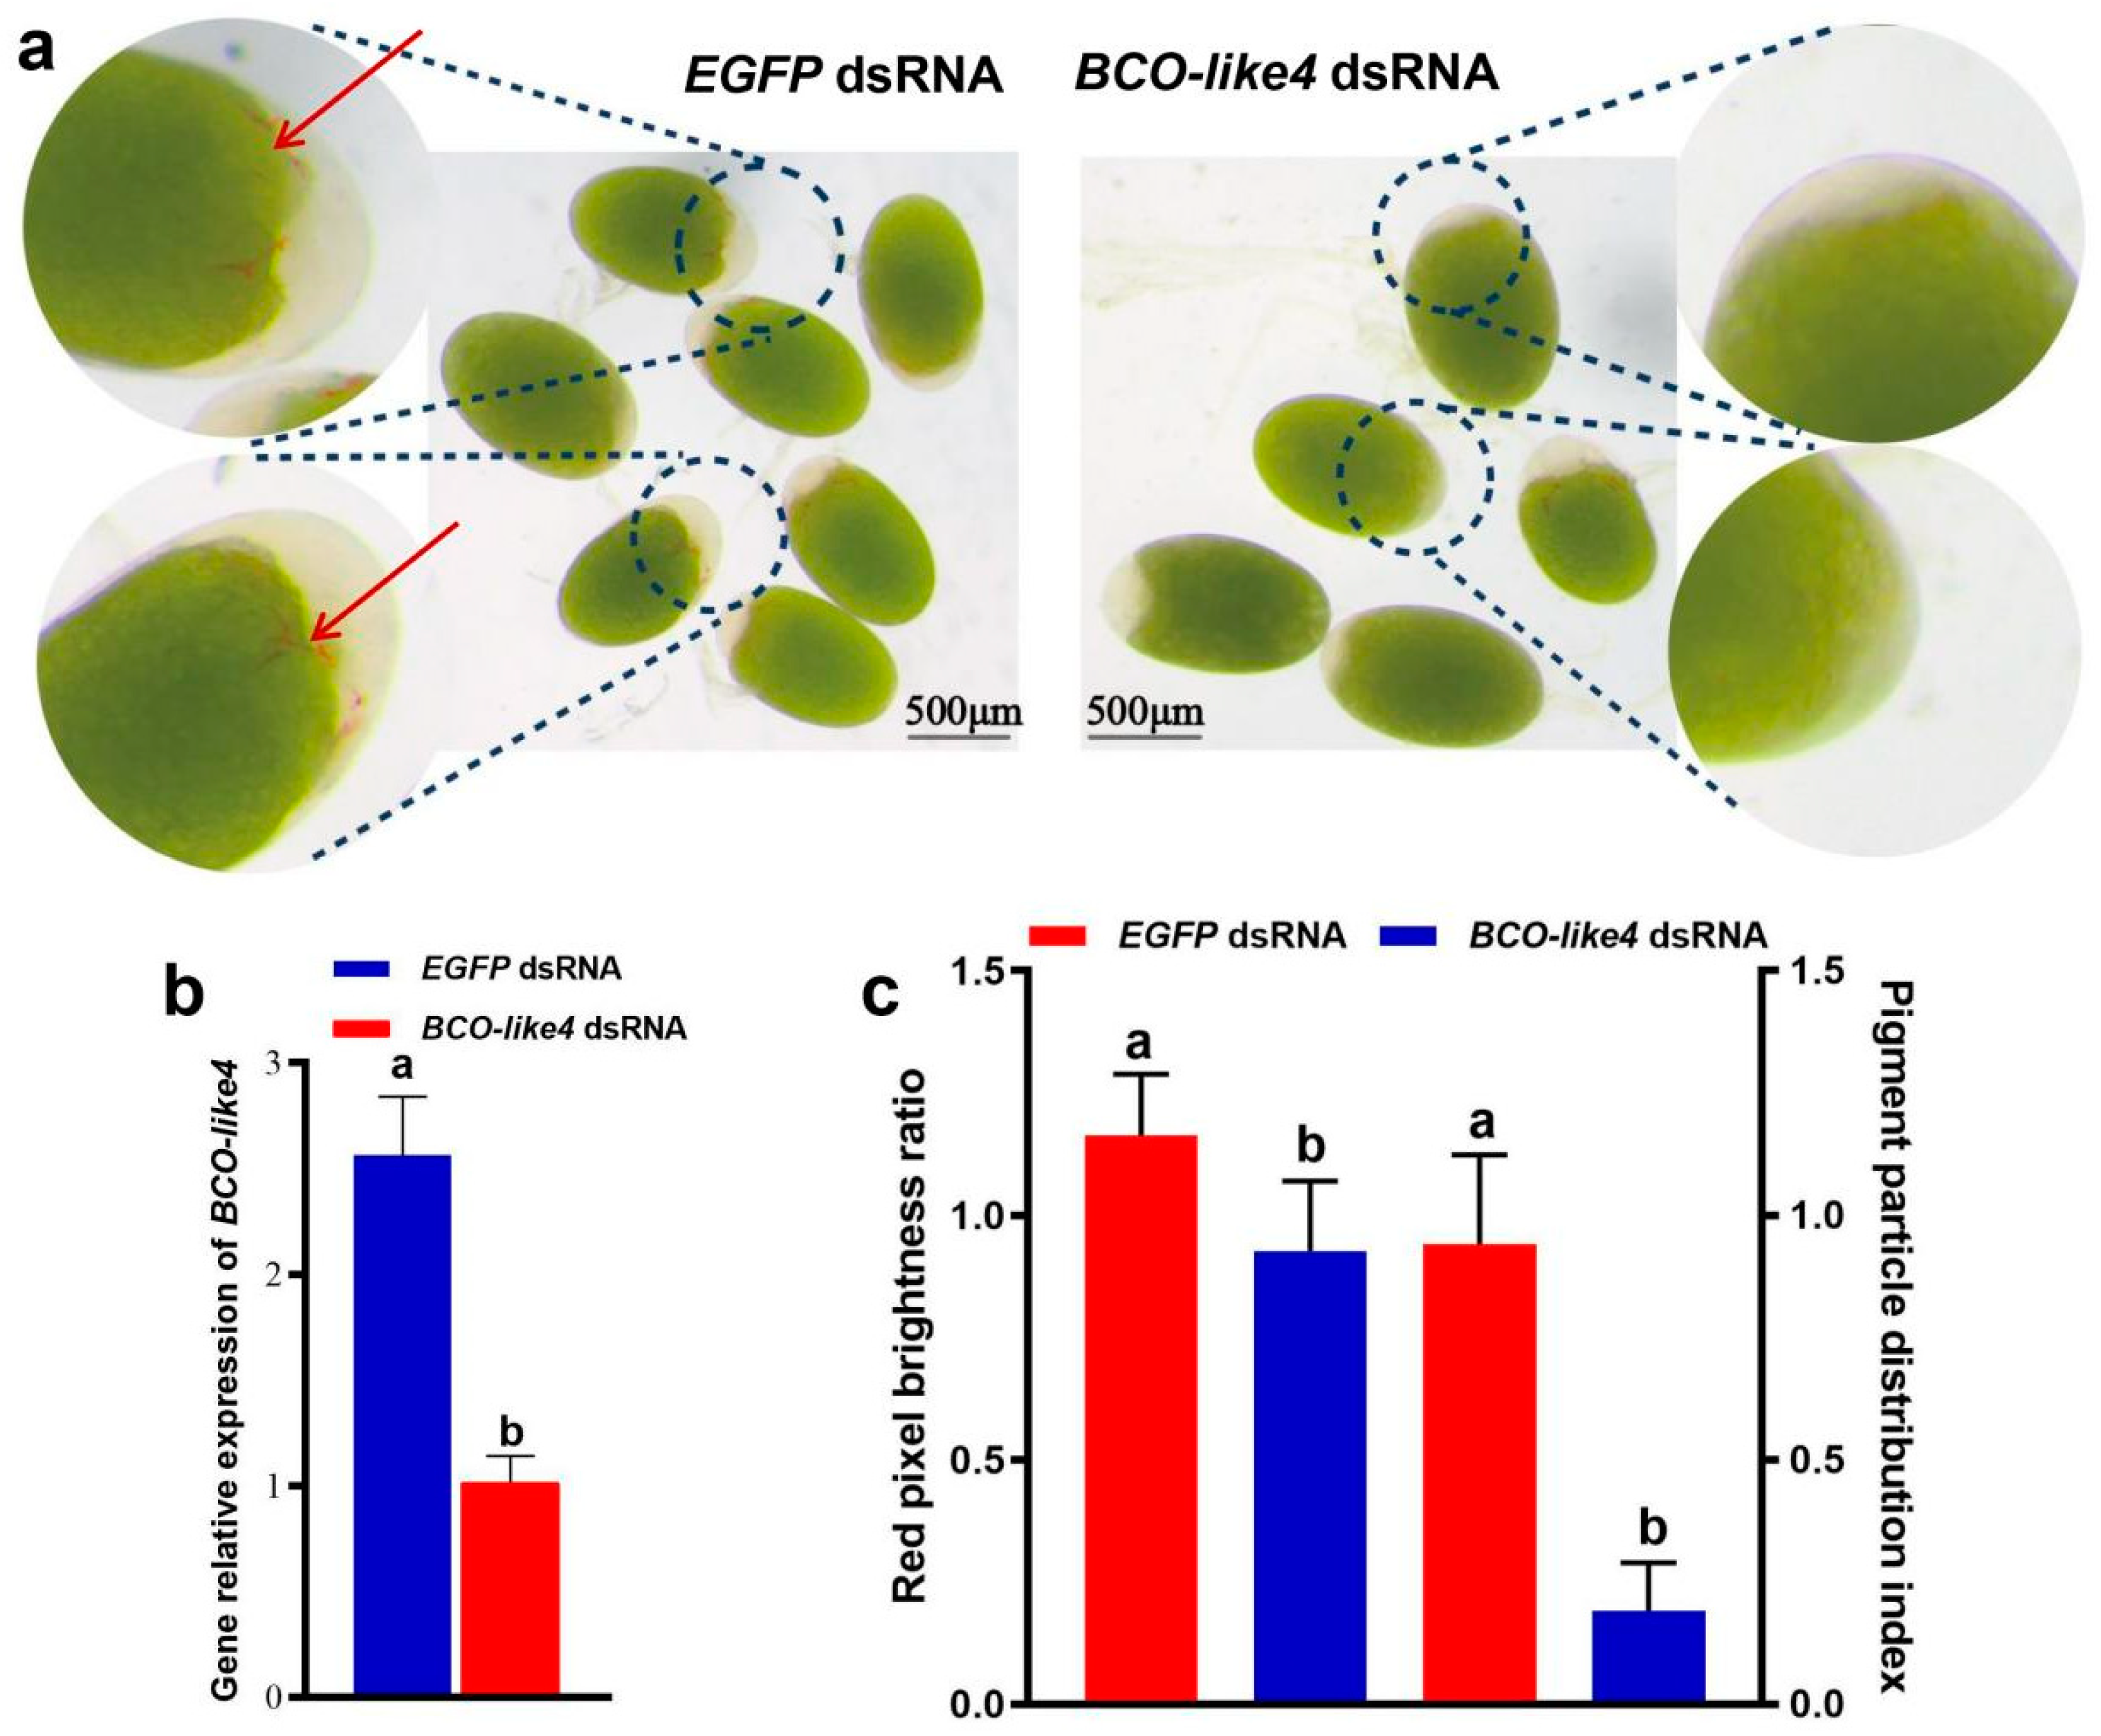
3.3. Functional Analyses of NdBCO-like4 Gene via RNA Interference

After the treatment with NdBCO-like4 dsRNA, the number of pigment cells in the treatment group was significantly less than the control group, and many pigment cells in the treatment group had yet to appear (Figure 4a). Meanwhile, the treatment of NdBCO-like4 dsRNA exposure decreased its expression (p > 0.05) at the metanauplius stage (Figure 4b). The RPB ratio in the treatment group was significantly lower than the dsEGFP control group (p < 0.05). The pigment cell index in the treatment group was significantly lower than the control group (p < 0.05) (Figure 4c).

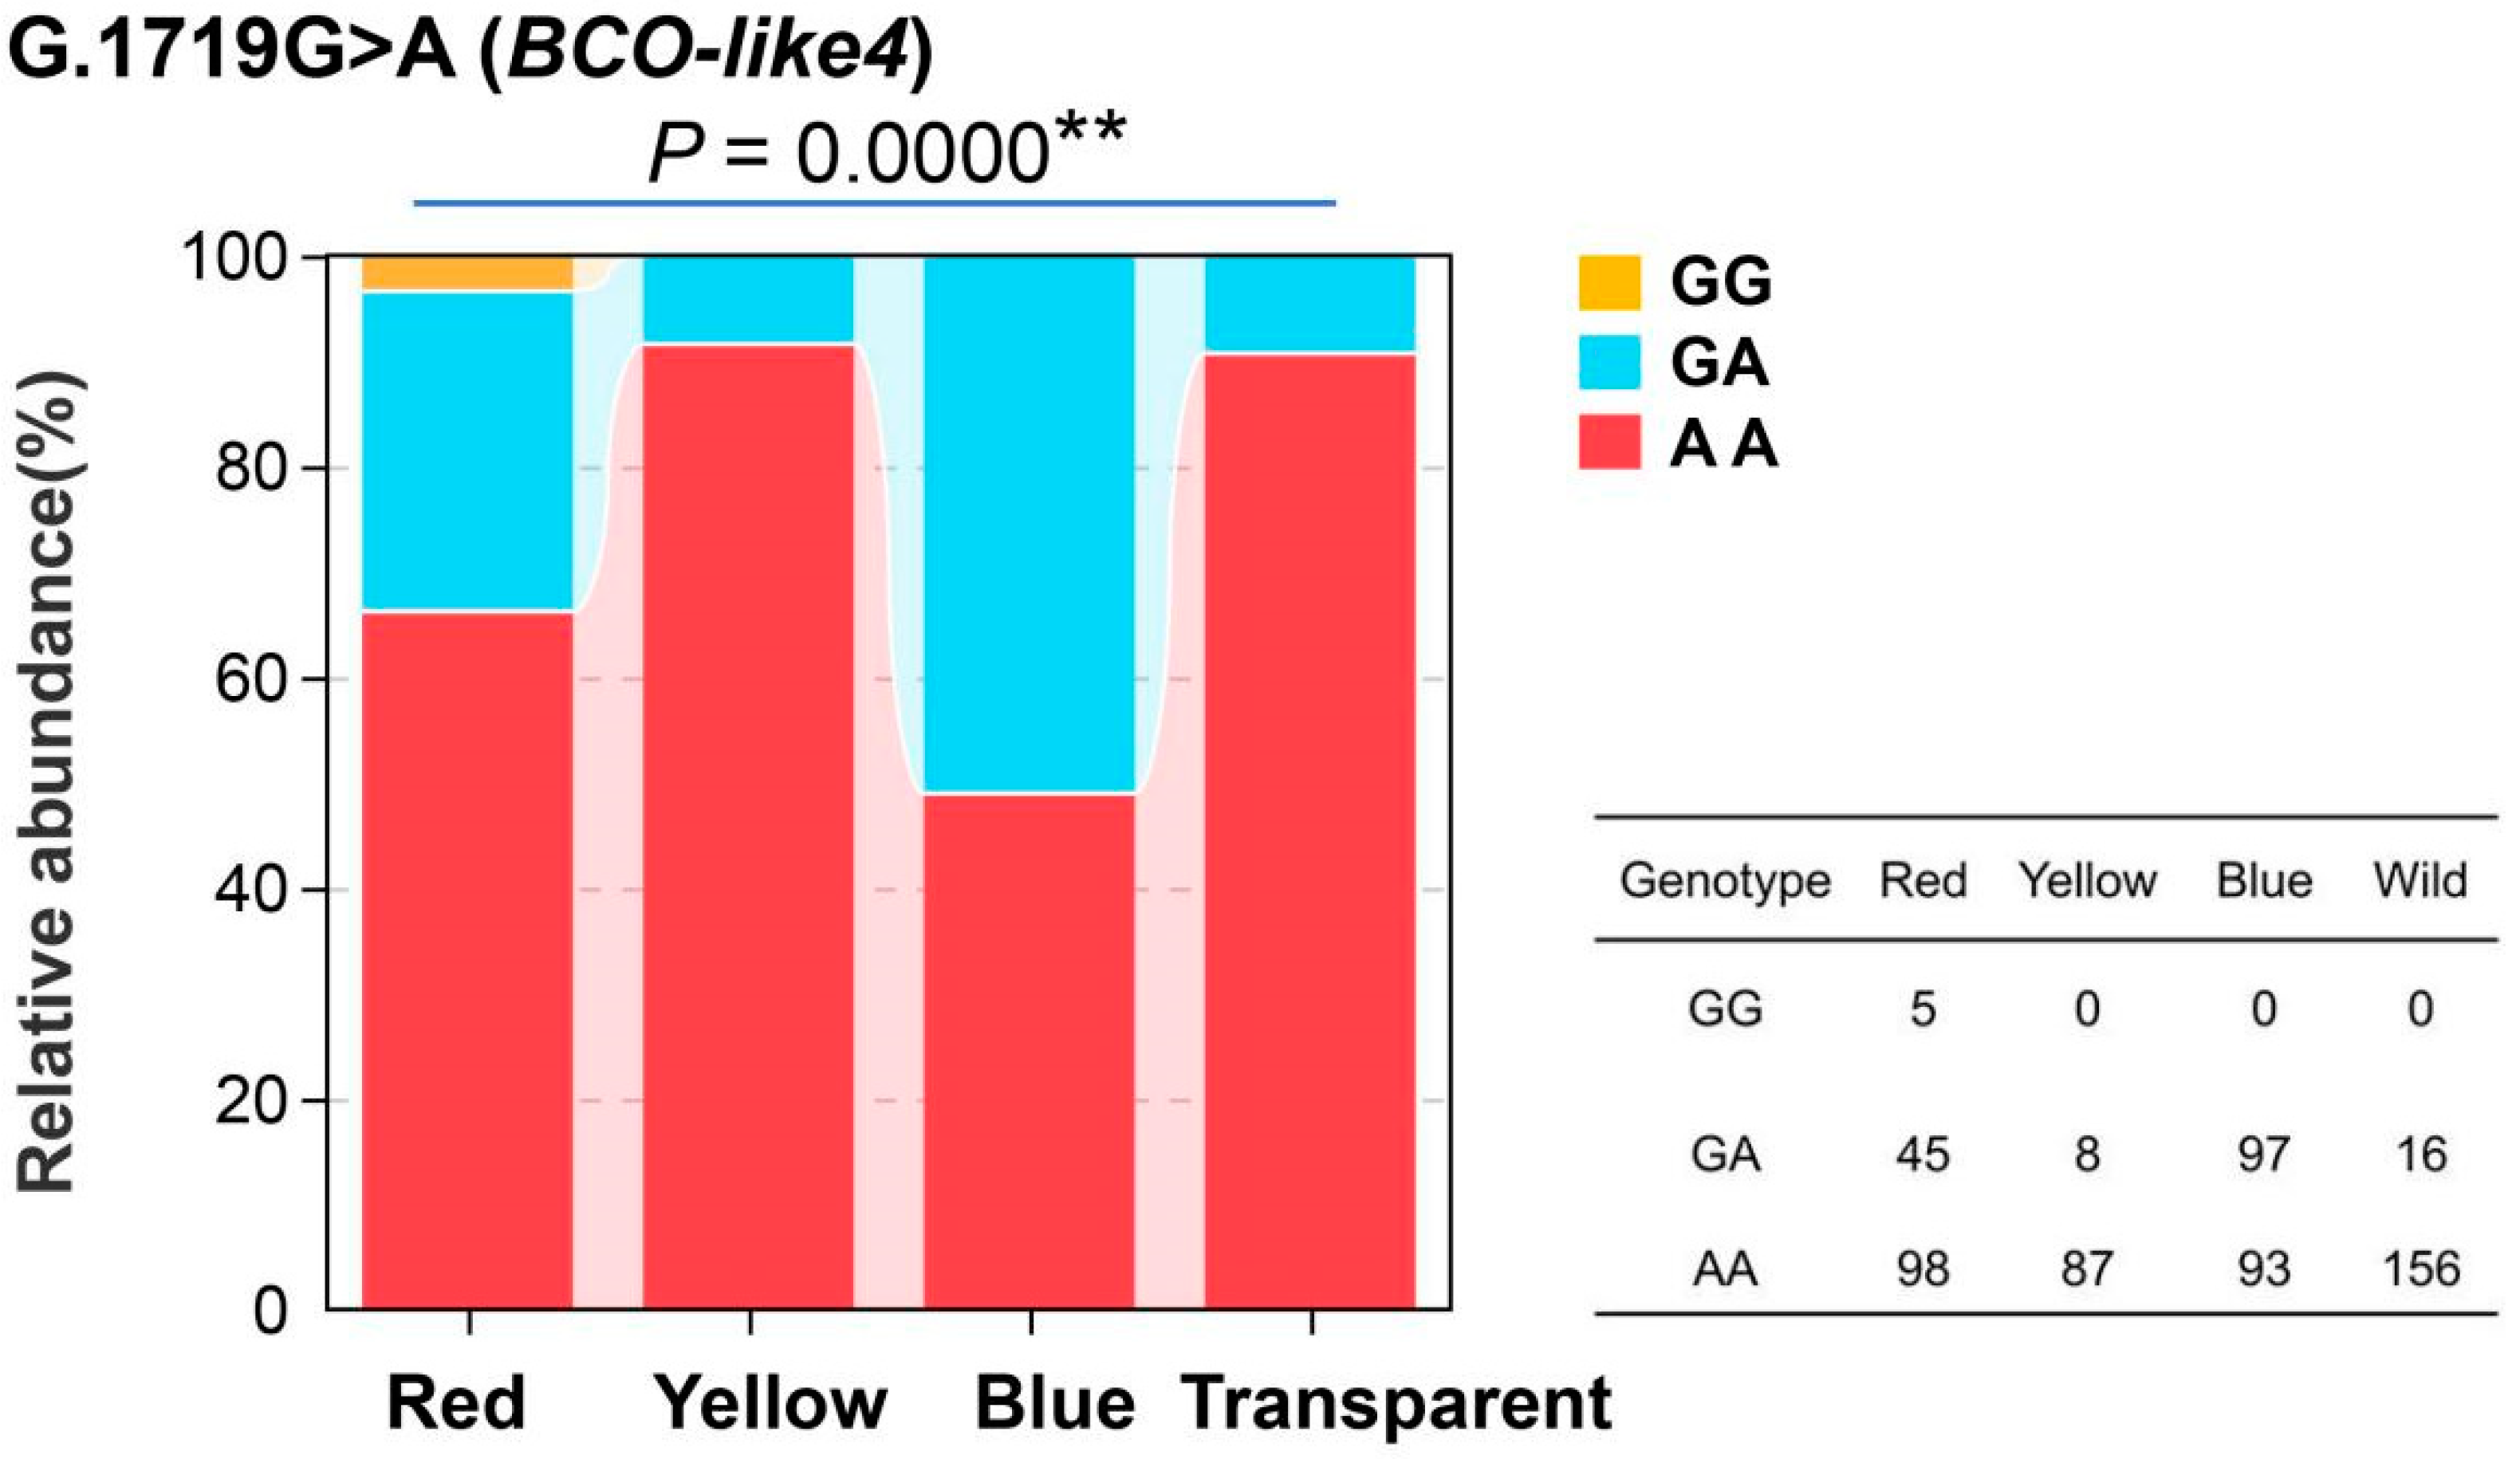
3.4. Genotyping and Correlation Analyses

A total of 326,902 SNPs were obtained from the transcriptome data of solid-color strains using GATK software, and 8424 high-quality SNPs were obtained after the first screening. The average FST of high-quality SNPs was 0.164, and the FST of candidate SNPs was greater than 0.640. Finally, there was one candidate SNP located on the NdBCO-like4 target gene, named G.1719G>A (NdBCO-like4). The candidate SNP is a missense mutation and coded aspartic acid (S445).
G.1719G>A (NdBCO-like4) is located at the third position of the aspartic acid codon (Figure 5). Amino acid No. 445 is not highly conservative by multiple comparison, and a variety of amino acid residues, such as R, E, T, and K, will appear (Figure 6).
The results showed that G.1719G>A (NdBCO-like4) was significantly different among all strains (p > 0.05) and showed polymorphism (Figure 7).

3.5. Comparison of RNA Secondary Structure

The SNP of NdBCO-like4 had no significant impact on the overall structure of the RNA, but it had an impact on the branch where 1719G>A was located, and the size and number of rings and stems had significant changes (Figure 8).

4. Discussion

The transcriptome of cherry shrimp has a total of 10 BCO homologous genes, while most animals have only two BCO genes, and decapods usually have more than four transcripts. For example, Exopalaemon carinicauda has six transcripts [41]. The BCO gene of cherry shrimp is similar to that of E. carinicauda, so it is named BCO-like by the naming method of E. carinicauda, and different genes are distinguished by numbers at the end of the name. Phylogenetic analysis showed that the BCO1 and BCO2 in the invertebrates were separately clustered. Among these BCO-like genes, NdBCO-like4 was grouped together with BCO2-like in Penaeus japonicus and Penaeus vannamei, which was the distant cluster with BCO1 genes. An online domain analysis from the NCBI of these amino acid sequences showed that they all contained the RPE65 conserved domain. The sequence characteristics of NdBCO4-like indicate that it is a homologue of BCO2.

4.1. The Expression Pattern of NdBCO-like4 Revealed by qPCR in Different Strains and Development Stages

Carotenoids are a major determinant of body color variation [42]. In the previous work of our research group, we detected carotenoid metabolites, and the content of total carotenoids was the highest in the red strain and the lowest in the wild strain. The relative expression of NdBCO-like4 in different body colors was positively correlated with the carotenoid content. The red strain had the highest carotenoid content and needed to express more BCO-like4 to degrade more carotenoids. The wild strain was low in carotenoids, so the gene expression was also the lowest. In addition, the oxidation site of animal carotenoids is mainly in the inner mitochondrial membrane [43,44], and this process may interact with the respiratory chain to some extent [45,46]. Excessive beta-carotene deposition inevitably leads to excessive respiratory chain burden, and respiratory chain-related enzymes need to be upregulated to cope with the additional burden [1,16,17]. Lacking BCO2 has shown that carotenoids can impair respiration and induce oxidative stress in mouse and human cell cultures [8]. In BCO2-deficient mice, accumulated carotenoids led to the increased production of reactive oxygen species (ROS) within the mitochondria, and this induced an increase in the key markers of mitochondrial dysfunction, such as manganese superoxide dismutase, and decreased the energy production efficiency [47]. Carotenoid accumulation leads to mitochondrial membrane depolarization and ROS production in human HepG2 cells, ultimately leading to oxidative stress and cell damage [48]. Mammalian cells therefore express mitochondrial carotenoid oxygenase, which keep carotenoids at a low level to protect these important organelles [8]. The red strain has the highest carotenoid content, and the high expression of NdBCO-like4 was consistent with the above results. It was speculated that the high expression of NdBCO-like4 in cherry shrimp is also related to preventing mitochondrial dysfunction induced by excessive carotenoids.
Pigment cells in N. d. sinensis first appear during the nauplius stage. The pigment cell number increases in the pre-zoea stage, with the distribution concentrated at the junctions of the cephalothoracic and abdominal segments. During the membrane-zoea stage, pigment cell branching increases, with a slight increase in the cell number. Following hatching, pigment cell numbers increase dramatically after the first one to two molts in post-larval shrimp. This expression pattern aligned with NdBCO-like4, which exhibited low expression during the nauplius stage, increased expression during the zoea stage, and a secondary increase in the young shrimp stage.

4.2. Validation of the NdBCO-like4 Function via RNAi at the Metanauplius Stage

Reducing the activity of carotenoid lyase is one of the ways that animals increase the accumulation of carotenoids [5]. Many studies have shown that the expression level of BCO2 is related to the degree of carotenoid deposition, but the correlation between the BCO2 level and carotenoid deposition is not consistent in different species. A negative correlation was found among mammals [49], birds [16,43], reptiles [50], and amphibians [5]; that is, the carotenoid accumulation increased when the BCO2 expression decreased. In addition, feeding carotenoids decreased the expression of BCO2 in cichlids [51], prawns [52], and oysters [53], suggesting that the expression of BCO2 was negatively correlated with carotenoid deposition. The situation of fish is more complicated; some species, such as tilapia [54], cichlids [53,55], and salmon [14], are negatively correlated, while some species, such as carp [56], are positively correlated. In E. carinicauda, the knockout of EcNinaB-like [57], or RNA-interfered EcBCO-like6 [41], caused the hepatopancreas to become red and dark in color. Because the relative expression of NdBCO-like4 was the highest in the red strain, the interference experiment was conducted with the embryos of the red strain. The interference results of NdBCO-like4 were confusing. Quantitative results showed that RNA interference significantly reduced the expression of NdBCO-like4, but the phenotype RPB and PDS of the embryos were significantly decreased, suggesting that NdBCO-like4 played other non-functions different from degrading enzymes or had more complex regulatory mechanisms involved.
While NdBCO-like4 is primarily known for its role in cleaving carotenoids, particularly β-carotene, into smaller apocarotenoids like retinal and β-ionone, accumulating evidence suggests it possesses other, less conventional functions. These non-canonical roles are still under investigation, but some examples exist. In mice models, the ablation of BCO2 results in alterations in lipid metabolism, characterized by hepatic steatosis [18,58]. Feeding diets supplemented with 0.2% carotenoids decrease the serum total cholesterol, non-high-density lipoprotein cholesterol (non-HDL-C), and atherogenic index. Concomitantly, the hepatic total lipid and cholesterol contents are diminished. These changes are associated with the decreased expression of genes involved in cholesterol homeostasis, specifically SREBP-2 (Sterol Regulatory Element-Binding Protein 2), HMG-coA (HMG-CoA Reductase), and LDLR (Low-Density Lipoprotein Receptor) [59]. Furthermore, BCO2 deficiency in both mice and human cell culture systems has been shown to impair mitochondrial respiration and induce oxidative stress [8]. Based on these unconventional functions of NdBCO-like4, we propose three possible hypotheses.
One possible explanation is that NdBCO-like4 might have specific physiological functions beyond the cleavage of carotenoids. In mice, ablation of BCO2 results in decreased fatty acid oxidation, impaired lipid sensing, and altered normal lipid and cholesterol metabolism [18]. The deficiency in BCO1 directly leads to the occurrence of hepatic steatosis [58]. In addition, the oxidative stress levels were increased and the lipid metabolism was altered in the liver of BCO2 knockout mice compared with the liver of wild-type mice [19]. In Atlantic salmon, the knockout of ABCG2, BCO1, and BCO1-like affected lipid metabolism, and ABCG2 had the greatest effect [60]. Due to the hydrophobic nature of carotenoids, they form micelles in the small intestine with amphiphilic and hydrophobic compounds (bile salts, cholesterol, fatty acids, monoacylglycerides, phospholipids, etc.) and then enter the blood through the lymphatic system through the intestinal brush border. Natural carotenoids exist mostly in the form of fatty acid esters [6], which are decomposed into free carotenol by trypanoxylate lipase and then absorbed by the intestine [6]. The previous work of the research group showed that the expression of vitellogenin (Vtg) was the highest in the red strain [20]. The yolk of cherry shrimp eggs is rich in lipids, and carotenoids usually bind to vitellogenin in cherry shrimp eggs to form vitellin, which gives the eggs color. After RNAi, the decreased expression of the NdBCO-like4 gene may indirectly affect the utilization of vitellogenin, resulting in a slow speed of erythrophore occurrence. There was more yolk in the RNAi treatment embryo, which suggested that the embryo developed slowly.
The second possible explanation is that the absorption and transportation of carotenoids were affected. There are many genes related to the absorption, transport, or storage of carotenoids in cherry shrimp, and these genes may interact with each other. Reducing the expression of the NdBCO-like4 gene may affect the efficiency of the carotenoid absorption in yolk, or it may affect the transport of carotenoids from yolk to erythrophores and eventually lead to lower carotenoid contents of erythrophores.
The third explanation is that compensatory mechanisms may have been triggered. Organisms often evolve complex compensatory mechanisms to maintain homeostasis, and reducing the expression of the NdBCO-like4 gene may activate other carotenoid degradation pathways in cherry shrimp. For example, reducing the expression of the BCO2 gene may lead to an increase in compensatory BCO1 [61]. Eroglu and Harrison (2013) showed that knocking out the BCO1 gene promoted the expression of BCO2 in mice [62]. These results suggest that there is a bidirectional compensatory mechanism between BCO1 and BCO2, and the absence of either promotes the expression of the other. Carotenoids can also be degraded by oxidative pathways, for example, through the action of cytochrome P450 enzymes or peroxidase [63,64]. In the case of reduced BCO2 activity, carotenoids may be degraded more by oxidative pathways and ultimately lead to the reduction in the carotenoid supply to erythrophores.

4.3. Genotyping and RNA Secondary Structure

In non-model organisms, gene function verification and genetic manipulation are difficult, so a genotypic and phenotypic association analysis of candidate genes is a good way to understand the genetic and developmental mechanisms of pigmentation [6]. A human carotenoid-related gene genotype and phenotype analysis showed that many SNPs were correlated with the serum carotenoid content [65]. The nonsense mutation C.196C > T in sheep causes the appearance of yellow fat [66]. In cows, BCO2 mutations cause significant differences in the beta-carotene concentration and subcutaneous fat color in cows with different genotypes [67]. The deletion of the codon of the BCO2 gene also resulted in increased concentrations of beta-carotene and alpha-tocopherol in rabbit adipose tissue, resulting in the yellow-fat trait [68]. The SNP 1719G>A is a non-synonymous mutation leading to a change from aspartic acid to asparagine at position 445. The non-synonymous mutation occurred in the conserved functional domain, and the secondary structure of the 1719G>A branch changed greatly and therefore affected the protein structure and function. At present, BCO2 has been found to be related to carotenoid accumulation in a variety of animals, and the mutation of this gene will lead to a large accumulation of carotenoids and an increase in body color [11,14,15]. The yellow-legged phenotype of Gallus gallus domesticus [69] and the yellow phenotype of Ranitomeya sirensis [5] are both associated with this gene mutation. In Chinook salmon, the SNP polymorphism of the BCO2-L gene was significantly correlated with the flesh color [14], and in Cyprinus carpio, the SNPs of bcmo1 and bco2 were significantly correlated with body color differentiation [70]. The genotyping of 1719G>A showed that the SNP was associated with body color. Mutant homozygote AA was the major genotype in the yellow and wild strain. It is concluded that the 445D>N mutation of the yellow strain NdBCO-like4 may reduce the cleavage of β-carotene, resulting in higher β-carotene contents in the yellow strain, and so the body color is yellow. According to the previous results of carotenoid-targeted metabolite detection, the total carotenoid content of the wild strain was very low. The very low levels of carotenoids in the body suggest a defect in the absorption process. So, although mutant genotypes are high in the wild, they may not accumulate enough carotenoids to change body color due to insufficient intake.

5. Conclusions

Carotenoid deposition is an extremely complex biological process. In recent years, although the research on the molecular mechanism has gradually deepened, the molecular mechanism is still not fully understood. In this article, we demonstrate that cherry shrimp’s NdBCO-like4 is a member of the BCO family. The qPCR results showed that the relative expression level of NdBCO-like4 was significantly different in cherry shrimp with different body colors and at different embryonic development stages. But the phenotype of the RNAi results was inconsistent with the function of NdBCO-like4 as a carotenoid-degrading enzyme. We hypothesize that NdBCO-like4 performed other functions during interference, but our current study cannot prove this, and there are no references to verify the nontraditional functional domains of NdBCO-like4 or other homologous BCO genes. Perhaps in the future, site-directed mutagenesis studies targeting the extra-regional regions of the catalytic structure can reveal the residues necessary for non-canonical functions. This will provide strong evidence for the nontraditional function of the BCO gene.
In addition, we emphasize that BCO2-related genes may influence lipid metabolism, thereby reducing lipid binding to carotenoids in eggs, leading to a decline in the embryonic RPB and PDS. Finally, the experiments related to mitochondrial oxidative stress need to be further carried out. This study provides basic data information for the mechanism of body color formation, which helps to elucidate the transport and metabolism of carotenoids in crustaceans and thus contributes to the development of more attractive aquatic animals. Analysis of genetic differences in carotenoid uptake, transport, and metabolism is a promising area, but the data obtained to date are fragmented and further functional validation is needed to identify genes associated with body color.

Author Contributions

Z.H.: validation, formal analysis, writing—original draft. H.L.: validation, formal analysis, writing—original draft. G.W.: conceptualization, methodology, writing—review and editing, funding acquisition. T.Z.: resources, supervision. All authors have read and agreed to the published version of the manuscript.

Funding

This research was supported by the earmarked fund for the National Natural Science Foundation of China (grant number 31702339), and by the Natural Science Foundation of Fujian Province (grant number 2020J01669).

Institutional Review Board Statement

Rare or protected animals were not included in the experiments of this study. This study was approved by the Animal Care Advisory Committee of Jimei University (Approval No. 2019-0906-003, 6 September 2019).

Informed Consent Statement

Not applicable.

Data Availability Statement

All data used in this study are available upon request from the corresponding author.

Acknowledgments

We are grateful to all those who contributed to this manuscript.

Conflicts of Interest

The authors declare that there are no conflicts of interest.

Abbreviations

The following abbreviations are used in this manuscript:
BCO2β, β-carotene 9′ 10 ′-dioxygenase
SNPSingle-nucleotide polymorphism
CCDCarotenoid cracking dioxygenase
BCO1β-carotene oxygenase 1
qPCRQuantitative PCR
RNAiRNA interference
ORFOpen reading frame
NJNeighbor joining
dsRNADouble-stranded RNA
EGFPEnhanced green fluorescent protein
TGTreated group
CGControl group
AFIAllele frequency imbalance
RPBRed pigment brightness
PDSPigment distribution scale
GATKGenome Analysis ToolKit
BCOβ-carotene oxygenase
HHeterozygosity
FSTF-statistics
GAPDHGlyceraldehyde-3-phosphate dehydrogenase

Appendix A

Figure A1. Nucleotide and amino acid sequence of NdBCO-like4. Highlighted in red is the representative domain: RPE65(10-520). The triangle represents the Caroteniod_oase family(8-520), BETE-CAROTENE DIOXYGENASE(8-520).
Fishes 10 00134 g0a1

References

  1. Flores, E.E.; Chien, Y.-H. Chromatosomes in three phenotypes of Neocaridina denticulata Kemp, 1918: Morphological and chromatic differences measured non-invasively. J. Crustac. Biol. 2011, 31, 590–597. [Google Scholar] [CrossRef]
  2. Mykles, D.L.; Hui, J.H. Neocaridina denticulata: A decapod crustacean model for functional genomics. Integr. Comp. Biol. 2015, 55, 891–897. [Google Scholar] [CrossRef] [PubMed]
  3. Bjerkeng, B. Carotenoids in Aquaculture: Fish and Crustaceans. In Carotenoids: Volume 4: Natural Functions; Britton, G., Liaaen-Jensen, S., Pfander, H., Eds.; Birkhäuser: Basel, Switzerland, 2008; pp. 237–254. [Google Scholar] [CrossRef]
  4. Maoka, T. Carotenoids as natural functional pigments. J. Nat. Med. 2020, 74, 1–16. [Google Scholar] [CrossRef] [PubMed]
  5. Twomey, E.; Johnson, J.D.; Castroviejo-Fisher, S.; Van Bocxlaer, I. A ketocarotenoid-based colour polymorphism in the Sira poison frog Ranitomeya sirensis indicates novel gene interactions underlying aposematic signal variation. Mol. Ecol. 2020, 29, 2004–2015. [Google Scholar] [CrossRef]
  6. von Lintig, J.; Moon, J.; Lee, J.; Ramkumar, S. Carotenoid metabolism at the intestinal barrier. Biochim. Biophys. Acta (BBA)-Mol. Cell Biol. Lipids 2020, 1865, 158580. [Google Scholar] [CrossRef]
  7. dela Seña, C.; Narayanasamy, S.; Riedl, K.M.; Curley, R.W.; Schwartz, S.J.; Harrison, E.H. Substrate specificity of purified recombinant human β-carotene 15,15′-oxygenase (BCO1). J. Biol. Chem. 2013, 288, 37094–37103. [Google Scholar] [CrossRef]
  8. Amengual, J.; Widjaja-Adhi, M.A.K.; Rodriguez-Santiago, S.; Hessel, S.; Golczak, M.; Palczewski, K.; Von Lintig, J. Two Carotenoid Oxygenases Contribute to Mammalian Provitamin A Metabolism. J. Biol. Chem. 2013, 288, 34081–34096. [Google Scholar] [CrossRef]
  9. Raghuvanshi, S.; Reed, V.; Blaner, W.S.; Harrison, E.H. Cellular localization of β-carotene 15,15′ oxygenase-1 (BCO1) and β-carotene 9′,10′ oxygenase-2 (BCO2) in rat liver and intestine. Arch. Biochem. Biophys. 2015, 572, 19–27. [Google Scholar] [CrossRef]
  10. Wu, L.; Guo, X.; Lyu, Y.; Clarke, S.L.; Lucas, E.A.; Smith, B.J.; Hildebrand, D.; Wang, W.; Medeiros, D.M.; Shen, X. Targeted metabolomics reveals abnormal hepatic energy metabolism by depletion of β-carotene oxygenase 2 in mice. Sci. Rep. 2017, 7, 14624. [Google Scholar] [CrossRef]
  11. Guo, X.; Wu, L.; Lyu, Y.; Chowanadisai, W.; Clarke, S.L.; Lucas, E.A.; Smith, B.J.; He, H.; Wang, W.; Medeiros, D.M. Ablation of β, β-carotene-9′, 10′-oxygenase 2 remodels the hypothalamic metabolome leading to metabolic disorders in mice. J. Nutr. Biochem. 2017, 46, 74–82. [Google Scholar] [CrossRef]
  12. Palczewski, G.; Widjaja-Adhi, M.A.; Amengual, J.; Golczak, M.; von Lintig, J. Genetic dissection in a mouse model reveals interactions between carotenoids and lipid metabolism. J. Lipid Res. 2016, 57, 1684–1695. [Google Scholar] [CrossRef] [PubMed]
  13. Asson-Batres, M.A.; Rochette-Egly, C. Biochemistry of Retinoid Signaling II; Springer: Dordrecht, The Netherlands, 2016. [Google Scholar]
  14. Lehnert, S.; Christensen, K.; Vandersteen, W.; Sakhrani, D.; Pitcher, T.; Heath, J.; Koop, B.; Heath, D.; Devlin, R. Carotenoid pigmentation in salmon: Variation in expression at BCO2-l locus controls a key fitness trait affecting red coloration. Proc. R. Soc. B 2019, 286, 20191588. [Google Scholar] [CrossRef] [PubMed]
  15. Von Lintig, J. Colors with functions: Elucidating the biochemical and molecular basis of carotenoid metabolism. Annu. Rev. Nutr. 2010, 30, 35–56. [Google Scholar] [CrossRef]
  16. Hill, G.E.; Hood, W.R.; Ge, Z.; Grinter, R.; Greening, C.; Johnson, J.D.; Park, N.R.; Taylor, H.A.; Andreasen, V.A.; Powers, M.J.; et al. Plumage redness signals mitochondrial function in the house finch. Proc. R. Soc. B 2019, 286, 20191354. [Google Scholar] [CrossRef] [PubMed]
  17. Kedishvili, N.Y. Enzymology of retinoic acid biosynthesis and degradation: Thematic Review Series: Fat-Soluble Vitamins: Vitamin A. J. Lipid Res. 2013, 54, 1744–1760. [Google Scholar] [CrossRef]
  18. Lim, J.Y.; Liu, C.; Hu, K.-Q.; Smith, D.E.; Wang, X.-D. Ablation of carotenoid cleavage enzymes (BCO1 and BCO2) induced hepatic steatosis by altering the farnesoid X receptor/miR-34a/sirtuin 1 pathway. Arch. Biochem. Biophys. 2018, 654, 1–9. [Google Scholar] [CrossRef]
  19. Wu, L. Functional Impact of β,β-Carotene-9′,10′-Oxygenase 2 (Bco2) in Hepatic Mitochondria. Bachelor’s Thesis, Nanjing Agricultural University, Nanjing, China, 2015. [Google Scholar]
  20. Huang, Y.; Zhang, L.; Wang, G.; Huang, S. De novo assembly transcriptome analysis reveals the genes associated with body color formation in the freshwater ornamental shrimps Neocaridina denticulate sinensis. Gene 2022, 806, 145929. [Google Scholar] [CrossRef]
  21. Lin, S. Discovery and Identification of Pigment-Related Genes in Serratus Sinensis. Master’s Thesis, Jimei University, Xiamen, China, 2017. [Google Scholar]
  22. Kumar, S.; Stecher, G.; Tamura, K. MEGA7: Molecular evolutionary genetics analysis version 7.0 for bigger datasets. Mol. Biol. Evol. 2016, 33, 1870–1874. [Google Scholar] [CrossRef]
  23. Aiyar, A. The use of CLUSTAL W and CLUSTAL X for multiple sequence alignment. In Bioinformatics Methods and Protocols; Humana: Totowa, NJ, USA, 1999; pp. 221–241. [Google Scholar]
  24. Fan, C. Gonadal Development and Germ Cell Genesis in Neocaridina Denticulata Sinensis. Master’s Thesis, Hebei University, Baoding, China, 2007. [Google Scholar]
  25. Xie, J.; Huang, H.; Wei, X.; Tan, P.; Ouyang, L.; Wang, L.; Liu, D.; Wang, F.; Wang, Z.; Tu, P. Boswellia carterii n-hexane extract suppresses breast cancer growth via induction of ferroptosis by downregulated GPX4 and upregulated transferrin. Sci. Rep. 2024, 14, 14307. [Google Scholar] [CrossRef]
  26. Livak, K.J.; Schmittgen, T.D. Analysis of relative gene expression data using real-time quantitative PCR and the 2−ΔΔCT method. Methods 2001, 25, 402–408. [Google Scholar] [CrossRef]
  27. Lu, X.; Zhang, L.; Wang, G.; Huang, S.; Zhang, Y.; Xie, Y. The occurrence process of chromatophores in three body color strains of the ornamental shrimp Neocaridina denticulata sinensis. Zoomorphology 2022, 141, 283–295. [Google Scholar] [CrossRef]
  28. Wang, G.; Li, N.; Zhang, L.; Zhang, L.; Zhang, Z.; Wang, Y. IGFBP7 is involved in abalone metamorphosis. Aquaculture 2016, 451, 377–384. [Google Scholar] [CrossRef]
  29. McLean, D. Adobe photoshop and illustrator techniques. J. Audiov. Media Med. 2002, 25, 79–81. [Google Scholar] [CrossRef]
  30. McNamara, J.C.; Milograna, S.R. Adaptive Color Change and the Molecular Endocrinology of Pigment Translocation in Crustacean Chromatophores. In The Natural History of the Crustacea; Oxford University Press: Oxford, UK, 2015. [Google Scholar]
  31. Van der Auwera, G.A.; Carneiro, M.O.; Hartl, C.; Poplin, R.; Del Angel, G.; Levy-Moonshine, A.; Jordan, T.; Shakir, K.; Roazen, D.; Thibault, J. From FastQ data to high-confidence variant calls: The genome analysis toolkit best practices pipeline. Curr. Protoc. Bioinform. 2013, 43, 11.10.1–11.10.33. [Google Scholar] [CrossRef]
  32. Wang, K.; Li, M.; Hakonarson, H. ANNOVAR: Functional annotation of genetic variants from high-throughput sequencing data. Nucleic Acids Res. 2010, 38, e164. [Google Scholar] [CrossRef]
  33. Narum, S.R.; Hess, J.E. Comparison of FST outlier tests for SNP loci under selection. Mol. Ecol. Resour. 2011, 11, 184–194. [Google Scholar] [CrossRef]
  34. Campbell, N.R.; Harmon, S.A.; Narum, S.R. Genotyping-in-Thousands by sequencing (GT-seq): A cost effective SNP genotyping method based on custom amplicon sequencing. Mol. Ecol. Resour. 2015, 15, 855–867. [Google Scholar] [CrossRef] [PubMed]
  35. Wang, Y.; Wang, G.; Zhang, L.; Liang, Q. Analysis of biochemical, genetic, and morphological adaptation focused on metamorphosis from Heliocidaris crassispina based on the transcriptomic and accurate genotyping strategy. Aquaculture 2024, 585, 740740. [Google Scholar] [CrossRef]
  36. Wang, Y.; Wang, G.; Zhang, L.; Xu, W.; Zhang, G.; Ge, H. A genome-wide association study and an accurate genotyping strategy to identify and validate the SNPs related to the larval period in bullfrog Aquarana catesbeiana. Aquac. Int. 2024, 32, 8267–8286. [Google Scholar] [CrossRef]
  37. Park, H.M. Comparing Group Means: T-Tests and One-Way ANOVA Using Stata, SAS, R, and SPSS; The Trustees of Indiana University: Indianapolis, IN, USA, 2009. [Google Scholar]
  38. Krueger, F. Trim Galore!: A Wrapper Around Cutadapt and FastQC to Consistently Apply Adapter and Quality Trimming to FastQ Files, with Extra Functionality for RRBS Data; Babraham Institute: Babraham, UK, 2015. [Google Scholar]
  39. Masella, A.P.; Bartram, A.K.; Truszkowski, J.M.; Brown, D.G.; Neufeld, J.D. PANDAseq: Paired-end assembler for illumina sequences. BMC Bioinform. 2012, 13, 31. [Google Scholar] [CrossRef]
  40. Wan, S.-M.; Xiong, X.-M.; Tomljanović, T.; Chen, Y.-L.; Liu, H.; Treer, T.; Gao, Z.-X. Identification and mapping of SNPs associated with number of intermuscular bone in blunt snout bream. Aquaculture 2019, 507, 75–82. [Google Scholar] [CrossRef]
  41. Jin, Y.; Yu, Y.; Zhang, C.; Li, S.; Zhang, X.; Li, F. Characterization and function analysis of the beta-carotene oxygenase-like genes in carotenoids metabolism of the ridgetail white prawn Exopalaemon carinicauda. Front. Physiol. 2020, 11, 745. [Google Scholar] [CrossRef] [PubMed]
  42. Gross, J. Carotenoids. In Pigments in Vegetables: Chlorophylls and Carotenoids; Springer: New York, NY, USA, 1991; pp. 75–278. [Google Scholar]
  43. Lopes, R.J.; Johnson, J.D.; Toomey, M.B.; Ferreira, M.S.; Araujo, P.M.; Melo-Ferreira, J.; Andersson, L.; Hill, G.E.; Corbo, J.C.; Carneiro, M. Genetic basis for red coloration in birds. Curr. Biol. 2016, 26, 1427–1434. [Google Scholar] [CrossRef] [PubMed]
  44. Mundy, N.I.; Stapley, J.; Bennison, C.; Tucker, R.; Twyman, H.; Kim, K.-W.; Burke, T.; Birkhead, T.R.; Andersson, S.; Slate, J. Red carotenoid coloration in the zebra finch is controlled by a cytochrome P450 gene cluster. Curr. Biol. 2016, 26, 1435–1440. [Google Scholar] [CrossRef]
  45. Hill, G.E. Condition-dependent traits as signals of the functionality of vital cellular processes. Ecol. Lett. 2011, 14, 625–634. [Google Scholar] [CrossRef]
  46. Johnson, J.D.; Hill, G.E. Is carotenoid ornamentation linked to the inner mitochondria membrane potential? A hypothesis for the maintenance of signal honesty. Biochimie 2013, 95, 436–444. [Google Scholar] [CrossRef] [PubMed]
  47. Wu, L.; Guo, X.; Wong, S.Y.; Lu, P.; Hartson, S.D.; Medeiros, D.M.; Wang, W.; Clarke, S.L.; Lucas, E.A.; Smith, B.J. Deficiency of β-carotene oxygenase 2 induces mitochondrial fragmentation and activates the STING-IRF3 pathway in the mouse hypothalamus. J. Nutr. Biochem. 2021, 88, 108542. [Google Scholar] [CrossRef]
  48. Guo, X.; Wu, L.; Soh, T.; Chowanadisai, W.; Clarke, S.; Lucas, E.; Smith, B.; Wang, W.; Medeiros, D.; Lin, D. Altered fatty acid metabolism remodels the hypothalamic metabolome to stimulate feeding behavior in BCO2 knockout mice. FASEB J. 2016, 30, 271.6. [Google Scholar] [CrossRef]
  49. Våge, D.I.; Boman, I.A. A nonsense mutation in the beta-carotene oxygenase 2 (BCO2) gene is tightly associated with accumulation of carotenoids in adipose tissue in sheep (Ovis aries). BMC Genet. 2010, 11, 10. [Google Scholar] [CrossRef]
  50. Guo, L.; Kruglyak, L. Genetics and biology of coloration in reptiles: The curious case of the Lemon Frost geckos. Comp. Physiol. Genom. 2023, 55, 479–486. [Google Scholar] [CrossRef]
  51. Poon, Z.W.J.; Shen, X.; Uichanco, J.A.; Terence, C.; Chua, S.W.G.; Domingos, J.A. Comparative transcriptome analysis reveals factors involved in the influence of dietary astaxanthin on body colouration of Malabar Snapper (Lutjanus malabaricus). Aquaculture 2023, 562, 738874. [Google Scholar] [CrossRef]
  52. Xie, W.; Du, G.; Deng, H.; Ma, Y.; Gao, M.; Duan, H.; Yik Yeong, S.; Sui, L. Transcriptomes of Litopenaeus vannamei reveal modulation of antioxidant system induced by dietary archaeal carotenoids. J. Oceanol. Limnol. 2023, 41, 2010–2019. [Google Scholar] [CrossRef]
  53. Wan, S.; Li, Q.; Yu, H.; Liu, S.; Kong, L. Transcriptome analysis based on dietary beta-carotene supplement reveals genes potentially involved in carotenoid metabolism in Crassostrea gigas. Gene 2022, 818, 146226. [Google Scholar] [CrossRef] [PubMed]
  54. Judan Cruz, K.G.; Landingin, E.P.; Gajeton, M.B.; Fernando, S.I.D.; Watanabe, K. Carotenoid coloration and coloration-linked gene expression in red tilapia (Oreochromis sp.) tissues. BMC Vet. Res. 2021, 17, 314. [Google Scholar] [CrossRef]
  55. Ahi, E.P.; Lecaudey, L.A.; Ziegelbecker, A.; Steiner, O.; Glabonjat, R.; Goessler, W.; Hois, V.; Wagner, C.; Lass, A.; Sefc, K.M. Comparative transcriptomics reveals candidate carotenoid color genes in an East African cichlid fish. BMC Genom. 2020, 21, 54. [Google Scholar] [CrossRef] [PubMed]
  56. Gazda, M.A.; Araújo, P.M.; Lopes, R.J.; Toomey, M.B.; Andrade, P.; Afonso, S.; Marques, C.; Nunes, L.; Pereira, P.; Trigo, S. A genetic mechanism for sexual dichromatism in birds. Science 2020, 368, 1270–1274. [Google Scholar] [CrossRef]
  57. Sun, Y.; Yan, C.; Liu, M.; Liu, Y.; Wang, W.; Cheng, W.; Yang, F.; Zhang, J. CRISPR/Cas9-mediated deletion of one carotenoid isomerooxygenase gene (EcNinaB-X1) from Exopalaemon carinicauda. Fish Shellfish. Immunol. 2020, 97, 421–431. [Google Scholar] [CrossRef]
  58. Clugston, R.D. Carotenoids and fatty liver disease: Current knowledge and research gaps. Biochim. Biophys. Acta (BBA)-Mol. Cell Biol. Lipids 2020, 1865, 158597. [Google Scholar] [CrossRef]
  59. Silva, L.S.e.; de Miranda, A.M.; de Brito Magalhães, C.L.; Dos Santos, R.C.; Pedrosa, M.L.; Silva, M.E. Diet supplementation with beta-carotene improves the serum lipid profile in rats fed a cholesterol-enriched diet. J. Physiol. Biochem. 2013, 69, 811–820. [Google Scholar] [CrossRef]
  60. Kuhn, B.N. Phenotypic Effects of Knocking Out the Pigmentation Related Genes, abcg2, bco1, and bco1-like in Atlantic Salmon. Master’s Thesis, Norwegian University of Life Sciences, Ås, Norway, 2022. [Google Scholar]
  61. Praud, C.; Al Ahmadieh, S.; Voldoire, E.; Le Vern, Y.; Godet, E.; Couroussé, N.; Graulet, B.; Duval, E.L.B.; Berri, C.; Duclos, M.J. Beta-carotene preferentially regulates chicken myoblast proliferation withdrawal and differentiation commitment via BCO1 activity and retinoic acid production. Exp. Cell Res. 2017, 358, 140–146. [Google Scholar] [CrossRef]
  62. Eroglu, A.; Harrison, E.H. Carotenoid metabolism in mammals, including man: Formation, occurrence, and function of apocarotenoids: Thematic Review Series: Fat-Soluble Vitamins: Vitamin A. J. Lipid Res. 2013, 54, 1719–1730. [Google Scholar] [CrossRef]
  63. Black, S.D. Membrane topology of the mammalian P450 cytochromes. FASEB J. 1992, 6, 680–685. [Google Scholar] [CrossRef]
  64. Urlacher, V.B.; Girhard, M. Cytochrome P450 monooxygenases in biotechnology and synthetic biology. Trends Biotechnol. 2019, 37, 882–897. [Google Scholar] [CrossRef]
  65. Reboul, E. Mechanisms of carotenoid intestinal absorption: Where do we stand? Nutrients 2019, 11, 838. [Google Scholar] [CrossRef] [PubMed]
  66. Hill, F. Xanthophyll pigmentation in sheep fat. Nature 1962, 194, 865–866. [Google Scholar] [CrossRef] [PubMed]
  67. Berry, S.; Davis, S.; Beattie, E.; Thomas, N.; Burrett, A.; Ward, H.; Stanfield, A.; Biswas, M.; Ankersmit-Udy, A.; Oxley, P. Mutation in bovine β-carotene oxygenase 2 affects milk color. Genetics 2009, 182, 923–926. [Google Scholar] [CrossRef] [PubMed]
  68. Strychalski, J.; Gugołek, A.; Brym, P.; Antoszkiewicz, Z.; Chwastowska-Siwiecka, I. Polymorphism of the BCO2 gene and the content of carotenoids, retinol, and α-tocopherol in the liver and fat of rabbits. Rev. Bras. Zootec. 2019, 48, e20180243. [Google Scholar] [CrossRef]
  69. Eriksson, J.; Larson, G.; Gunnarsson, U.; Bed’Hom, B.; Tixier-Boichard, M.; Strömstedt, L.; Wright, D.; Jungerius, A.; Vereijken, A.; Randi, E. Identification of the yellow skin gene reveals a hybrid origin of the domestic chicken. PLoS Genet. 2008, 4, e1000010. [Google Scholar] [CrossRef]
  70. Shi, X.; Zhu, W.; Guo, J.; Lin, K.; Fu, J.; Wang, L.; Dong, Y.; Luo, M.; Dong, Z. Genome-wide association study reveals candidate genes critical for skin pigmentation in common carp (Cyprinus carpio) strains including koi. Aquaculture 2024, 590, 741075. [Google Scholar] [CrossRef]
Figure 1. Multiple-sequence alignment of Neocaridina denticulata sinensis NdBCO-like4. Amino acid sequences of Palaemon carinicauda (QIC55133.1), Procambarus clarkii (XP_045595941.1), Portunus trituberculatus (XP_045120543.1), Penaeus chinensis (XP_047500873.1), Penaeus indicus (XP_063594566.1), Trinorchestia longiramus (KAF2349598.1), Penaeus monodon (XP_037795664.1), Penaeus japonicus (XP_042873992.1), Mus musculus (NP_573480.1), and Danio rerio (XP_002662060.4) were compared. A black background indicates that the amino acid at this location is identical in all comparison species, and a gray background indicates that the amino acid at this location is similar in all comparison species.
Fishes 10 00134 g001
Figure 2. Phylogenetic analysis of BCO coding proteins. The red triangle represents the protein encoded by the BCO gene of the cherry shrimp, and the blue diamond represents the protein encoded by the BCO gene of the ridge-tailed white shrimp Exopalaemon carinicauda.
Fishes 10 00134 g002
Figure 3. Relative expression of NdBCO-like4 in Neocaridina denticulata sinensis. (a) The relative expression of NdBCO-like4 in different strains. (b) The relative expression of NdBCO-like4 in different developmental stages: I: pre-nauplius stage; II: metanauplius stage; III: pre-zoea stage; IV: membrane-zoea stage; V: young shrimp stage. Different lowercase letters indicate significant differences (p < 0.05). Error bars represent the mean ± standard error.
Fishes 10 00134 g003
Figure 4. The effect of chromatophores after NdBCO-like4 interference in Neocaridina denticulata sinensis embryos. (a) The metanauplius stage after NdBCO-like4 interference. EGFP dsRNA was the negative control and NdBCO-like4 dsRNA was the NdBCO-like4 interference group. In the round boxes are the corresponding enlarged images, and the red arrows indicate an erythrophore. (b) The relative expression of NdBCO-like4 in metanauplius stage after NdBCO-like4 interference. (c) The ratio of red pigment brightness (RPB) and the distribution scale of pigment particles (PDS) of metanauplius. Embryos come from the same female shrimp. Different lowercase letters indicate significant differences (p < 0.05). Error bars represent the mean ± standard error.
Fishes 10 00134 g004
Figure 5. Locus and encoding amino acid of G.1719G>A (NdBCO-like4). Uppercase letters are amino acids, lowercase letters are nucleotides, blue letters are original amino acids or nucleotides, red letters are mutated amino acids or nucleotides, and underscores are triple codons. The short black line represents an amino acid. Only a partial sequence is listed here.
Fishes 10 00134 g005
Figure 6. Multiple alignment of single-nucleotide polymorphism (SNP) encoded amino acids and nearby sequences. The red box is the amino acid encoded by the SNP of cherry shrimp and the corresponding position of the amino acid of other species, and the upper letter of the box represents the amino acid of cherry shrimp after mutation. A black background indicates that the amino acid at this location is identical in all comparison species, and a gray background indicates that the amino acid at this location is similar in all comparison species.
Fishes 10 00134 g006
Figure 7. Single-nucleotide polymorphism (SNP) genotyping of NdBCO-like4 in different Neocaridina denticulata sinensis color strains. The bar chart indicates the genotype and allele frequency, the table indicates the frequency of the genotype and allele, and ** indicates that the frequency is very significantly different from that of other strains (p < 0.01).
Fishes 10 00134 g007
Figure 8. Effect of SNP on RNA secondary structure of NdBCO-like4. The black lines are the RNA secondary structure, the color map is a magnification of the corresponding box portion, and the arrows point to the exact location of the SNP. (a) The original RNA structure prediction of NdBCO-like4. (b) The influence of 1719G>A change on the secondary structure of RNA.
Fishes 10 00134 g008
Table 1. The PCR primers used in this study.
Primer NamePrimer Sequences (5′–3′)Application
NdBCO-like4 FqGAACTCGCGCTTATCCTGACqPCR
NdBCO-like4 RqCATTCACAGCGCAGTTGTCTqPCR
NdBCO-like4 FdGCCCAGTACATAATGCCCAGdsRNA generation
NdBCO-like4 RdCGCAGTCATGTCGAACTTGTdsRNA generation
NdBCO-like4 F1CATTCTCCGGGAAGTGGTAATarget sequence amplification
NdBCO-like4 R1ACTTACCCGTTAACGCCACATarget sequence amplification
NdBCO-like4 F2CGACAGGTTCAGAGTTCTACAGCCGACGATCCATTCTCCGGGAAGTGGTAAAdd adapter
NdBCO-like4 R2GCTCGTCGTGACGCCATGACGGACTTACCCGTTAACGCCACAAdd adapter
ds-EGFP FGGTGAACTTCAAGATCCGCCdsRNA generation
ds-EGFP RCTTGTACAGCTCGTCCATGCdsRNA generation
GADPH FqCGGTGCTGCTCAGAATATCAqPCR
GADPH RqTTACCAAGGCGAACGGTAAGqPCR
T7FTAATACGACTCACTATAGGGAdapter
T7RCCCTATAGTGAGTCGTATTAAdapter
Disclaimer/Publisher’s Note: The statements, opinions and data contained in all publications are solely those of the individual author(s) and contributor(s) and not of MDPI and/or the editor(s). MDPI and/or the editor(s) disclaim responsibility for any injury to people or property resulting from any ideas, methods, instructions or products referred to in the content.

