Effects of Feeding Frequency on Turbot (Scophthalmus maximus) Performance, Water Quality and Microbial Community in Recirculating Aquaculture Systems

Abstract
1. Introduction
2. Materials and Methods
2.1. Experimental Systems
2.2. Experimental Design
2.3. Growth Performance
2.4. Water Quality Parameters
2.5. DNA Extraction, PCR Amplification and Sequencing
2.6. Processing of Sequencing Data
2.7. Bioinformatics Analysis
2.8. Ethics Statement
2.9. Statistical Analysis
3. Result
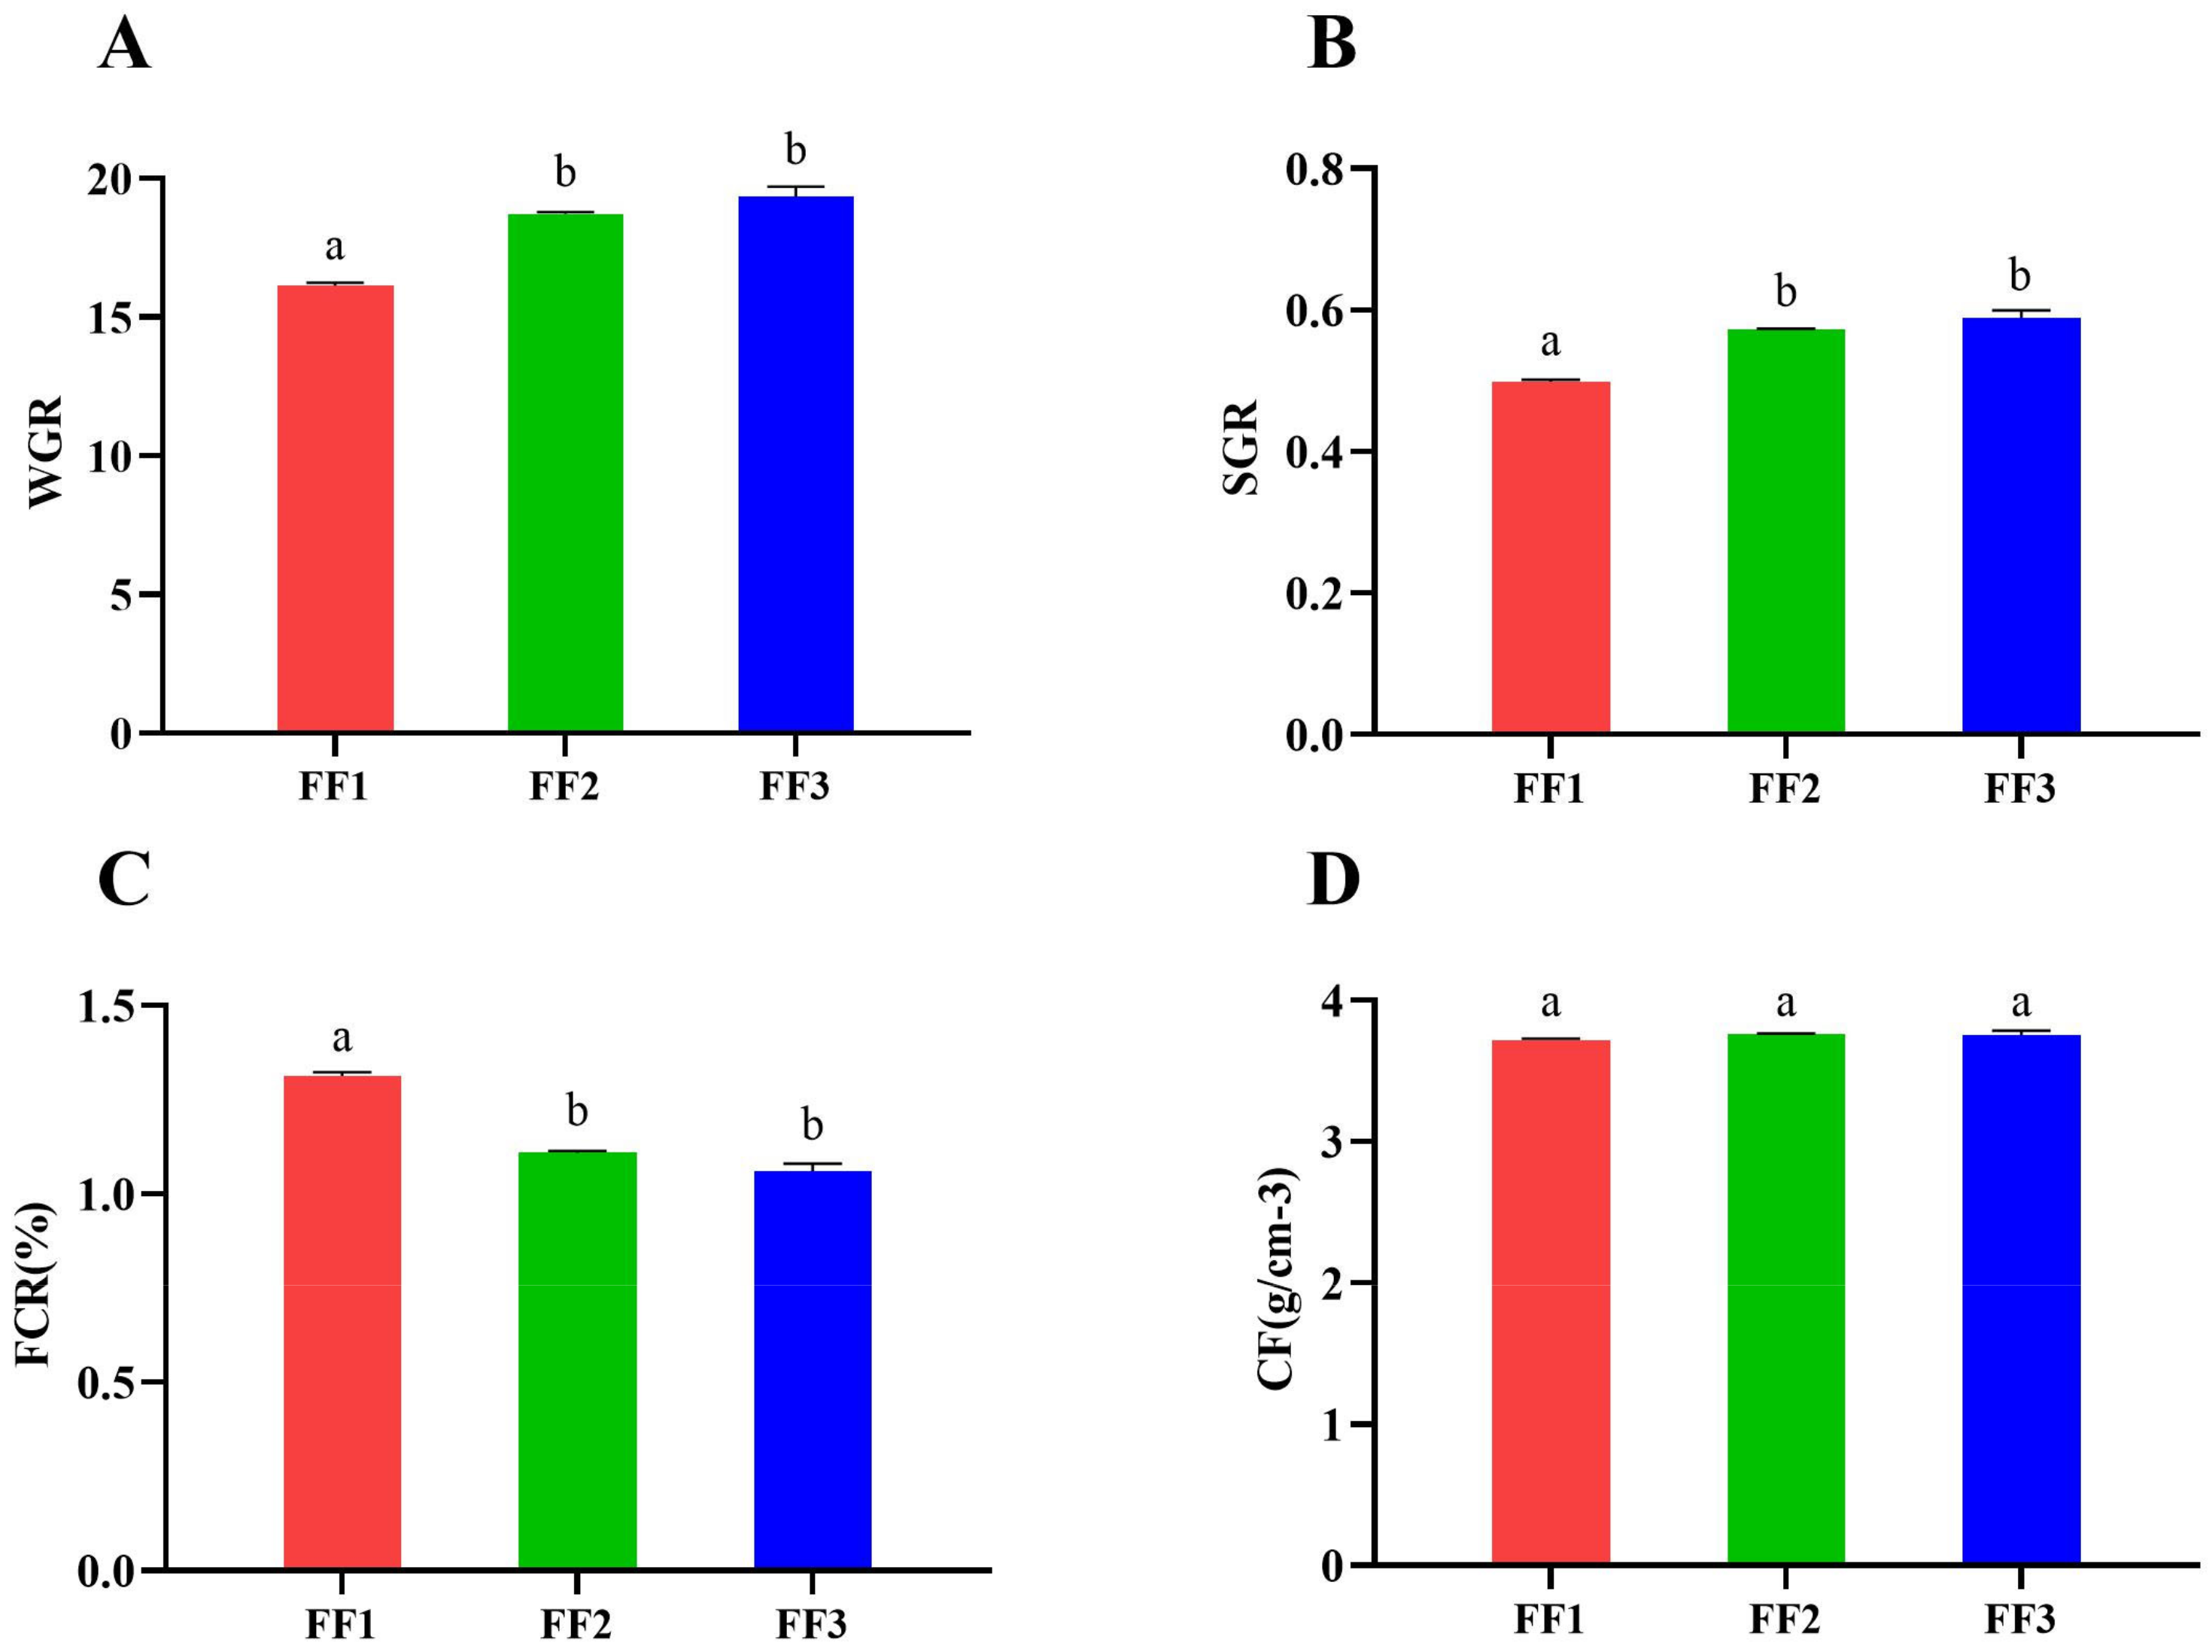
3.1. Turbot Growth
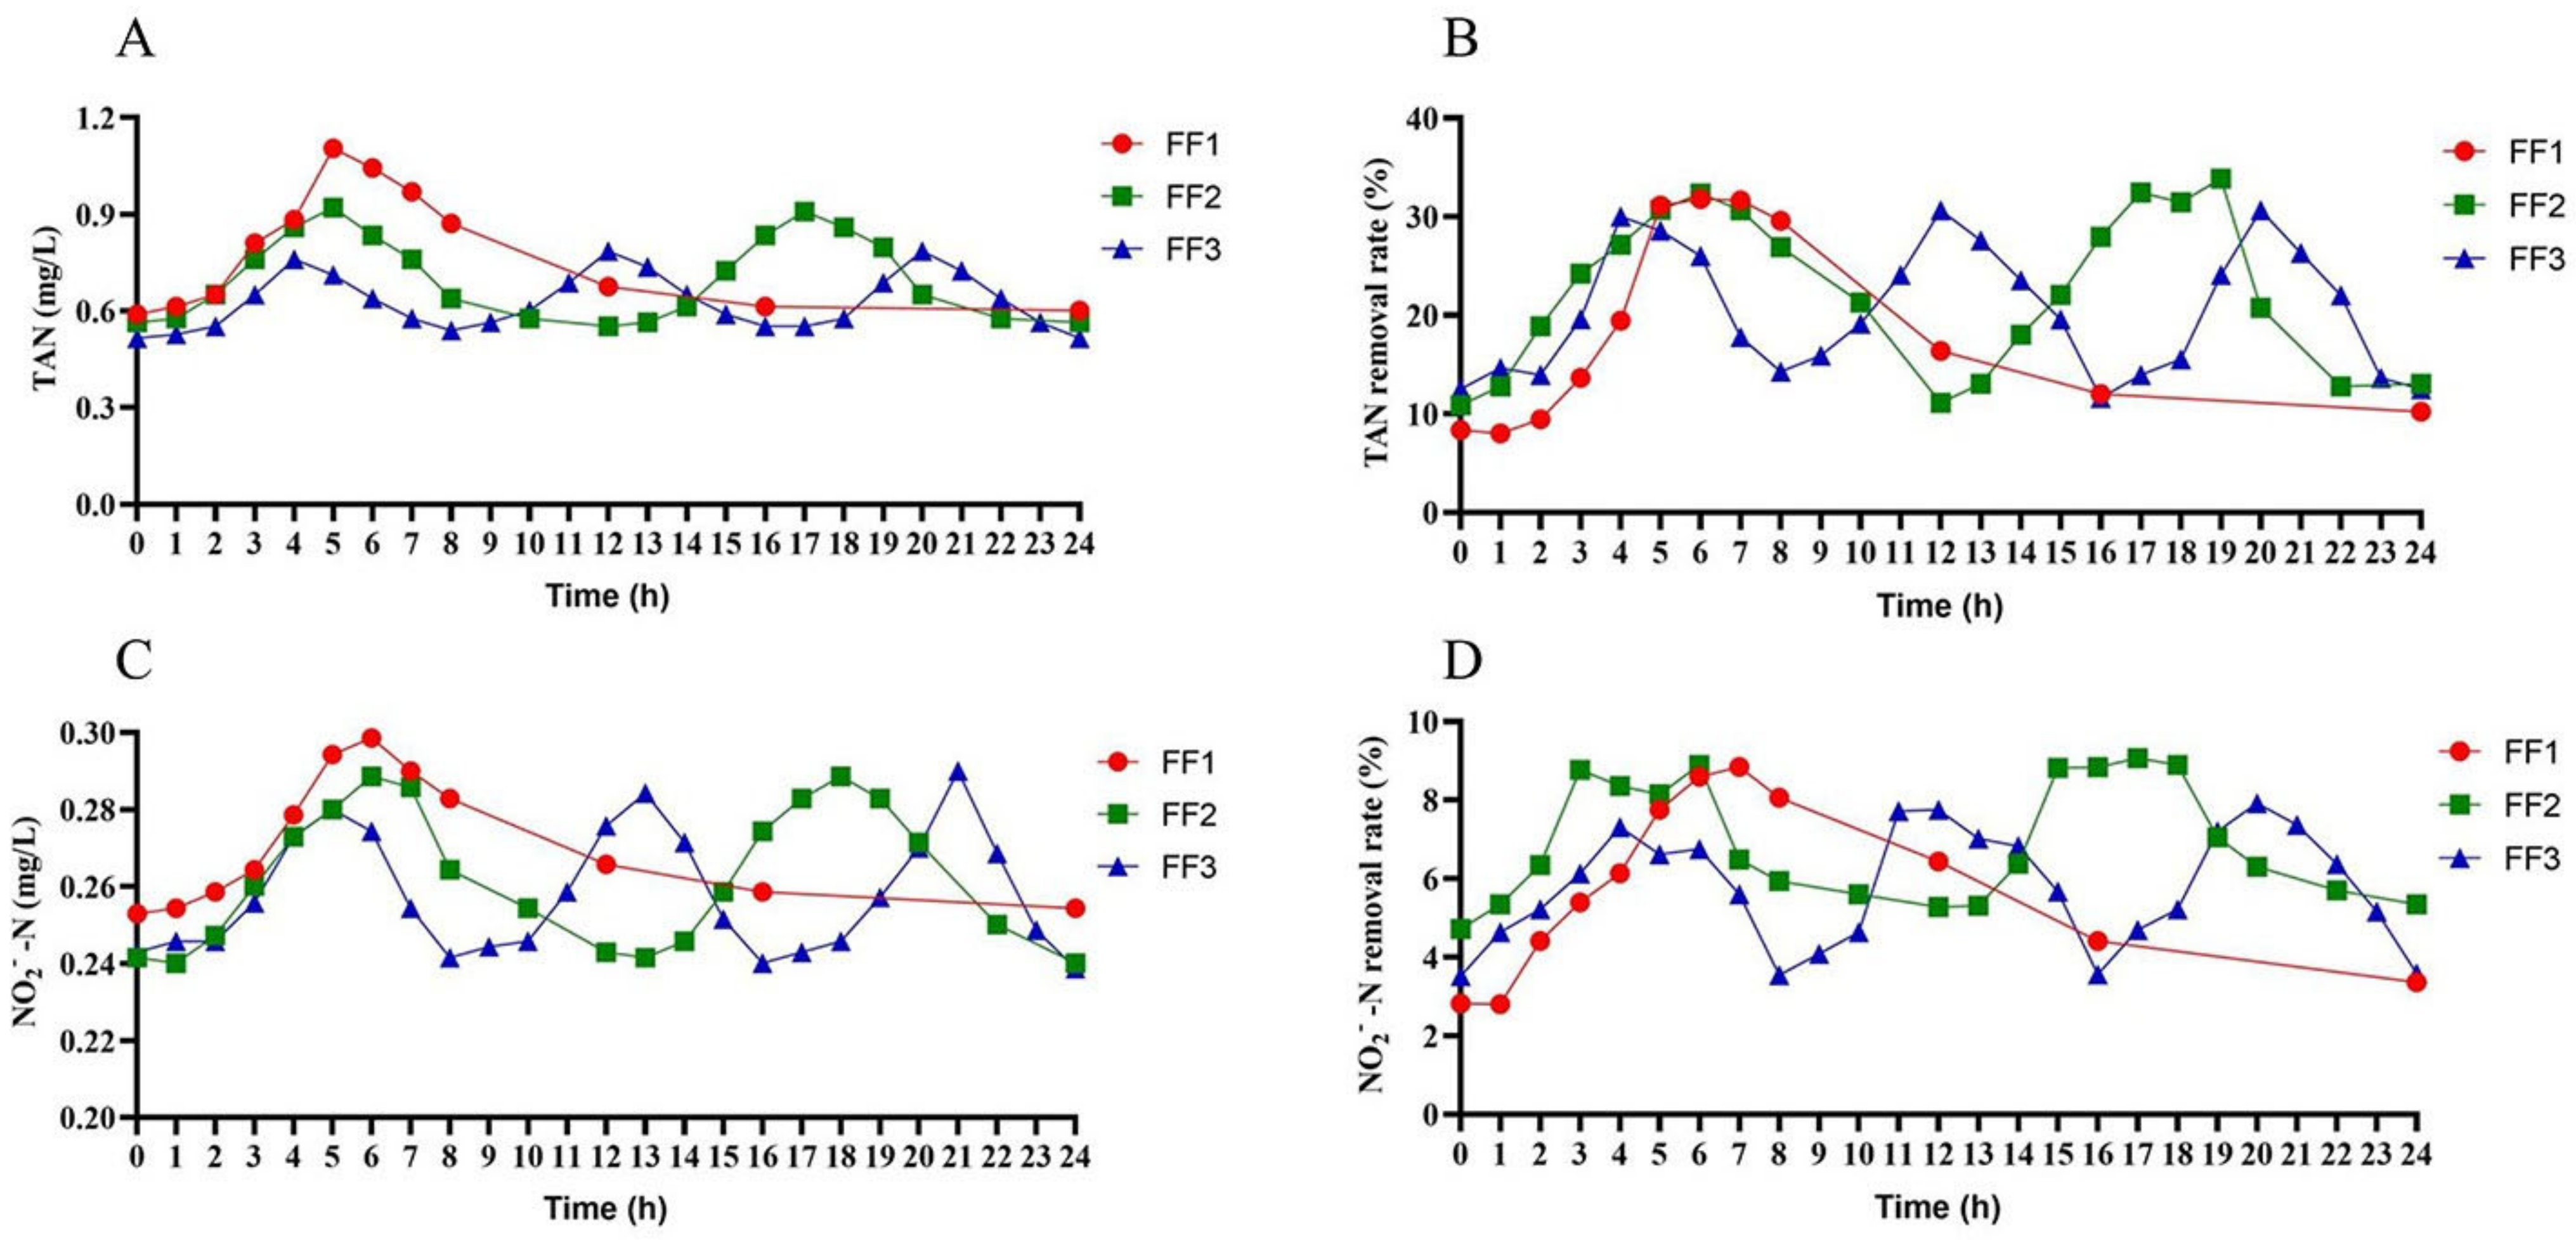
3.2. Water Quality
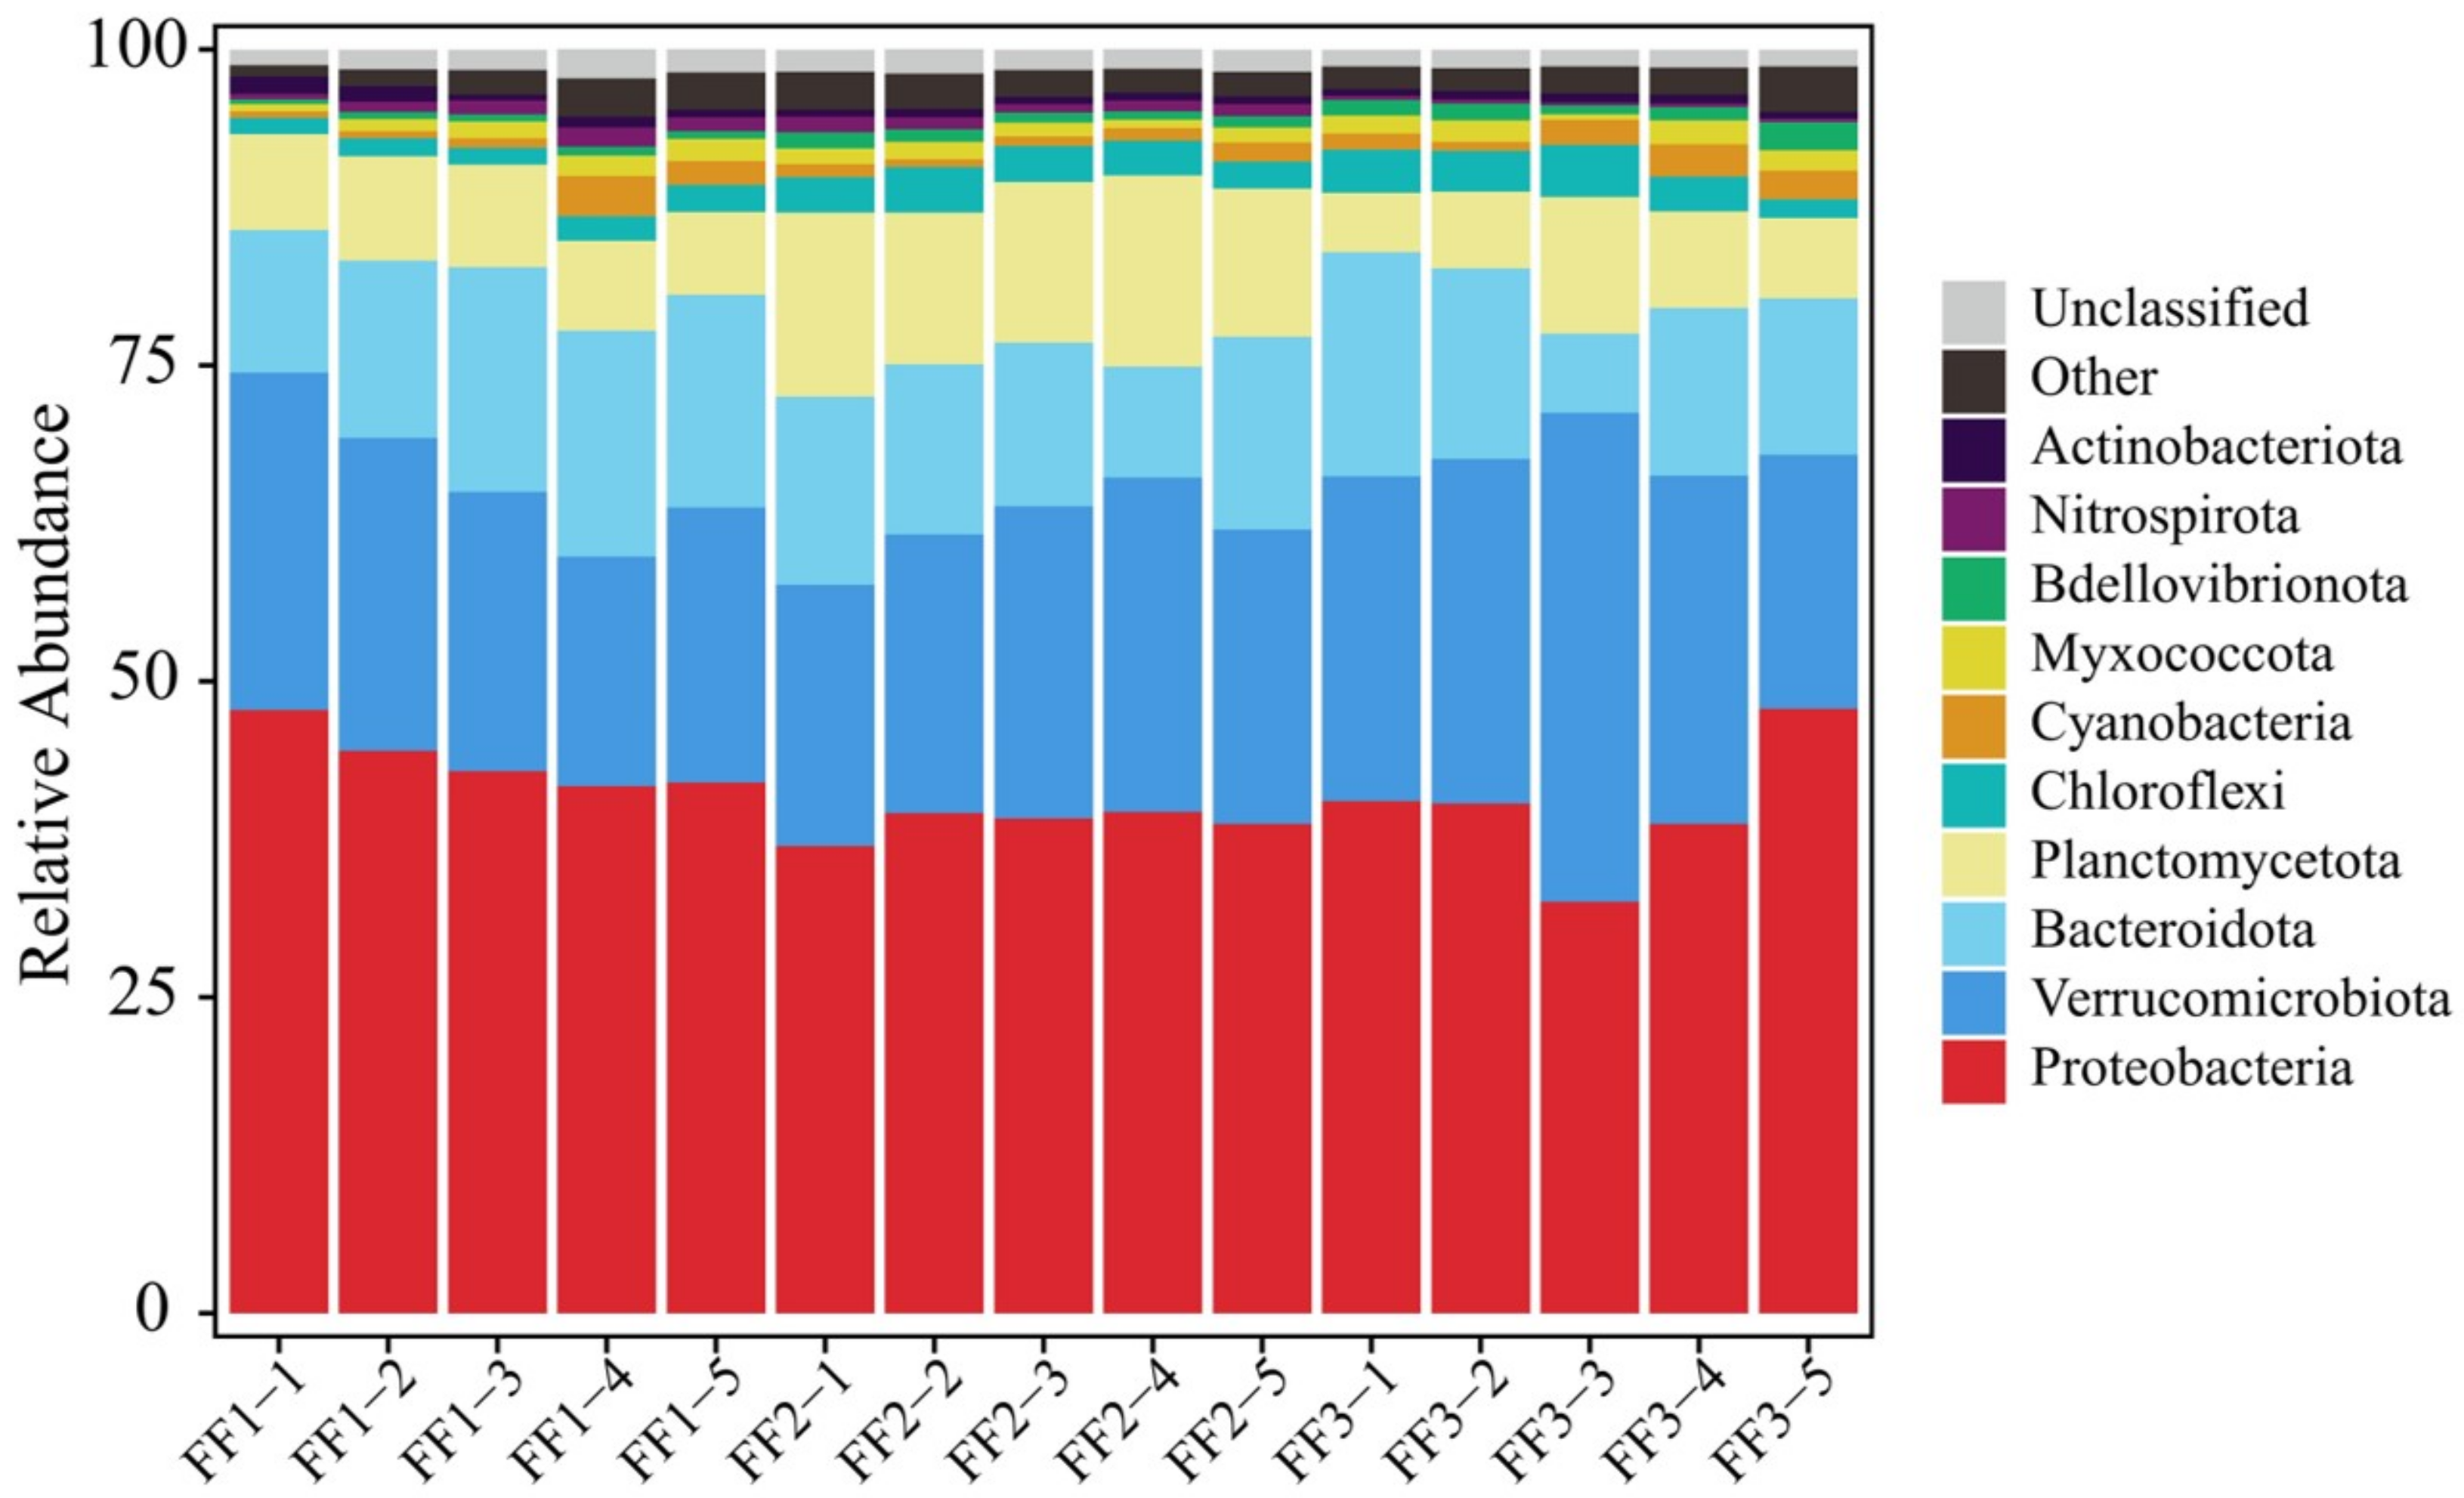
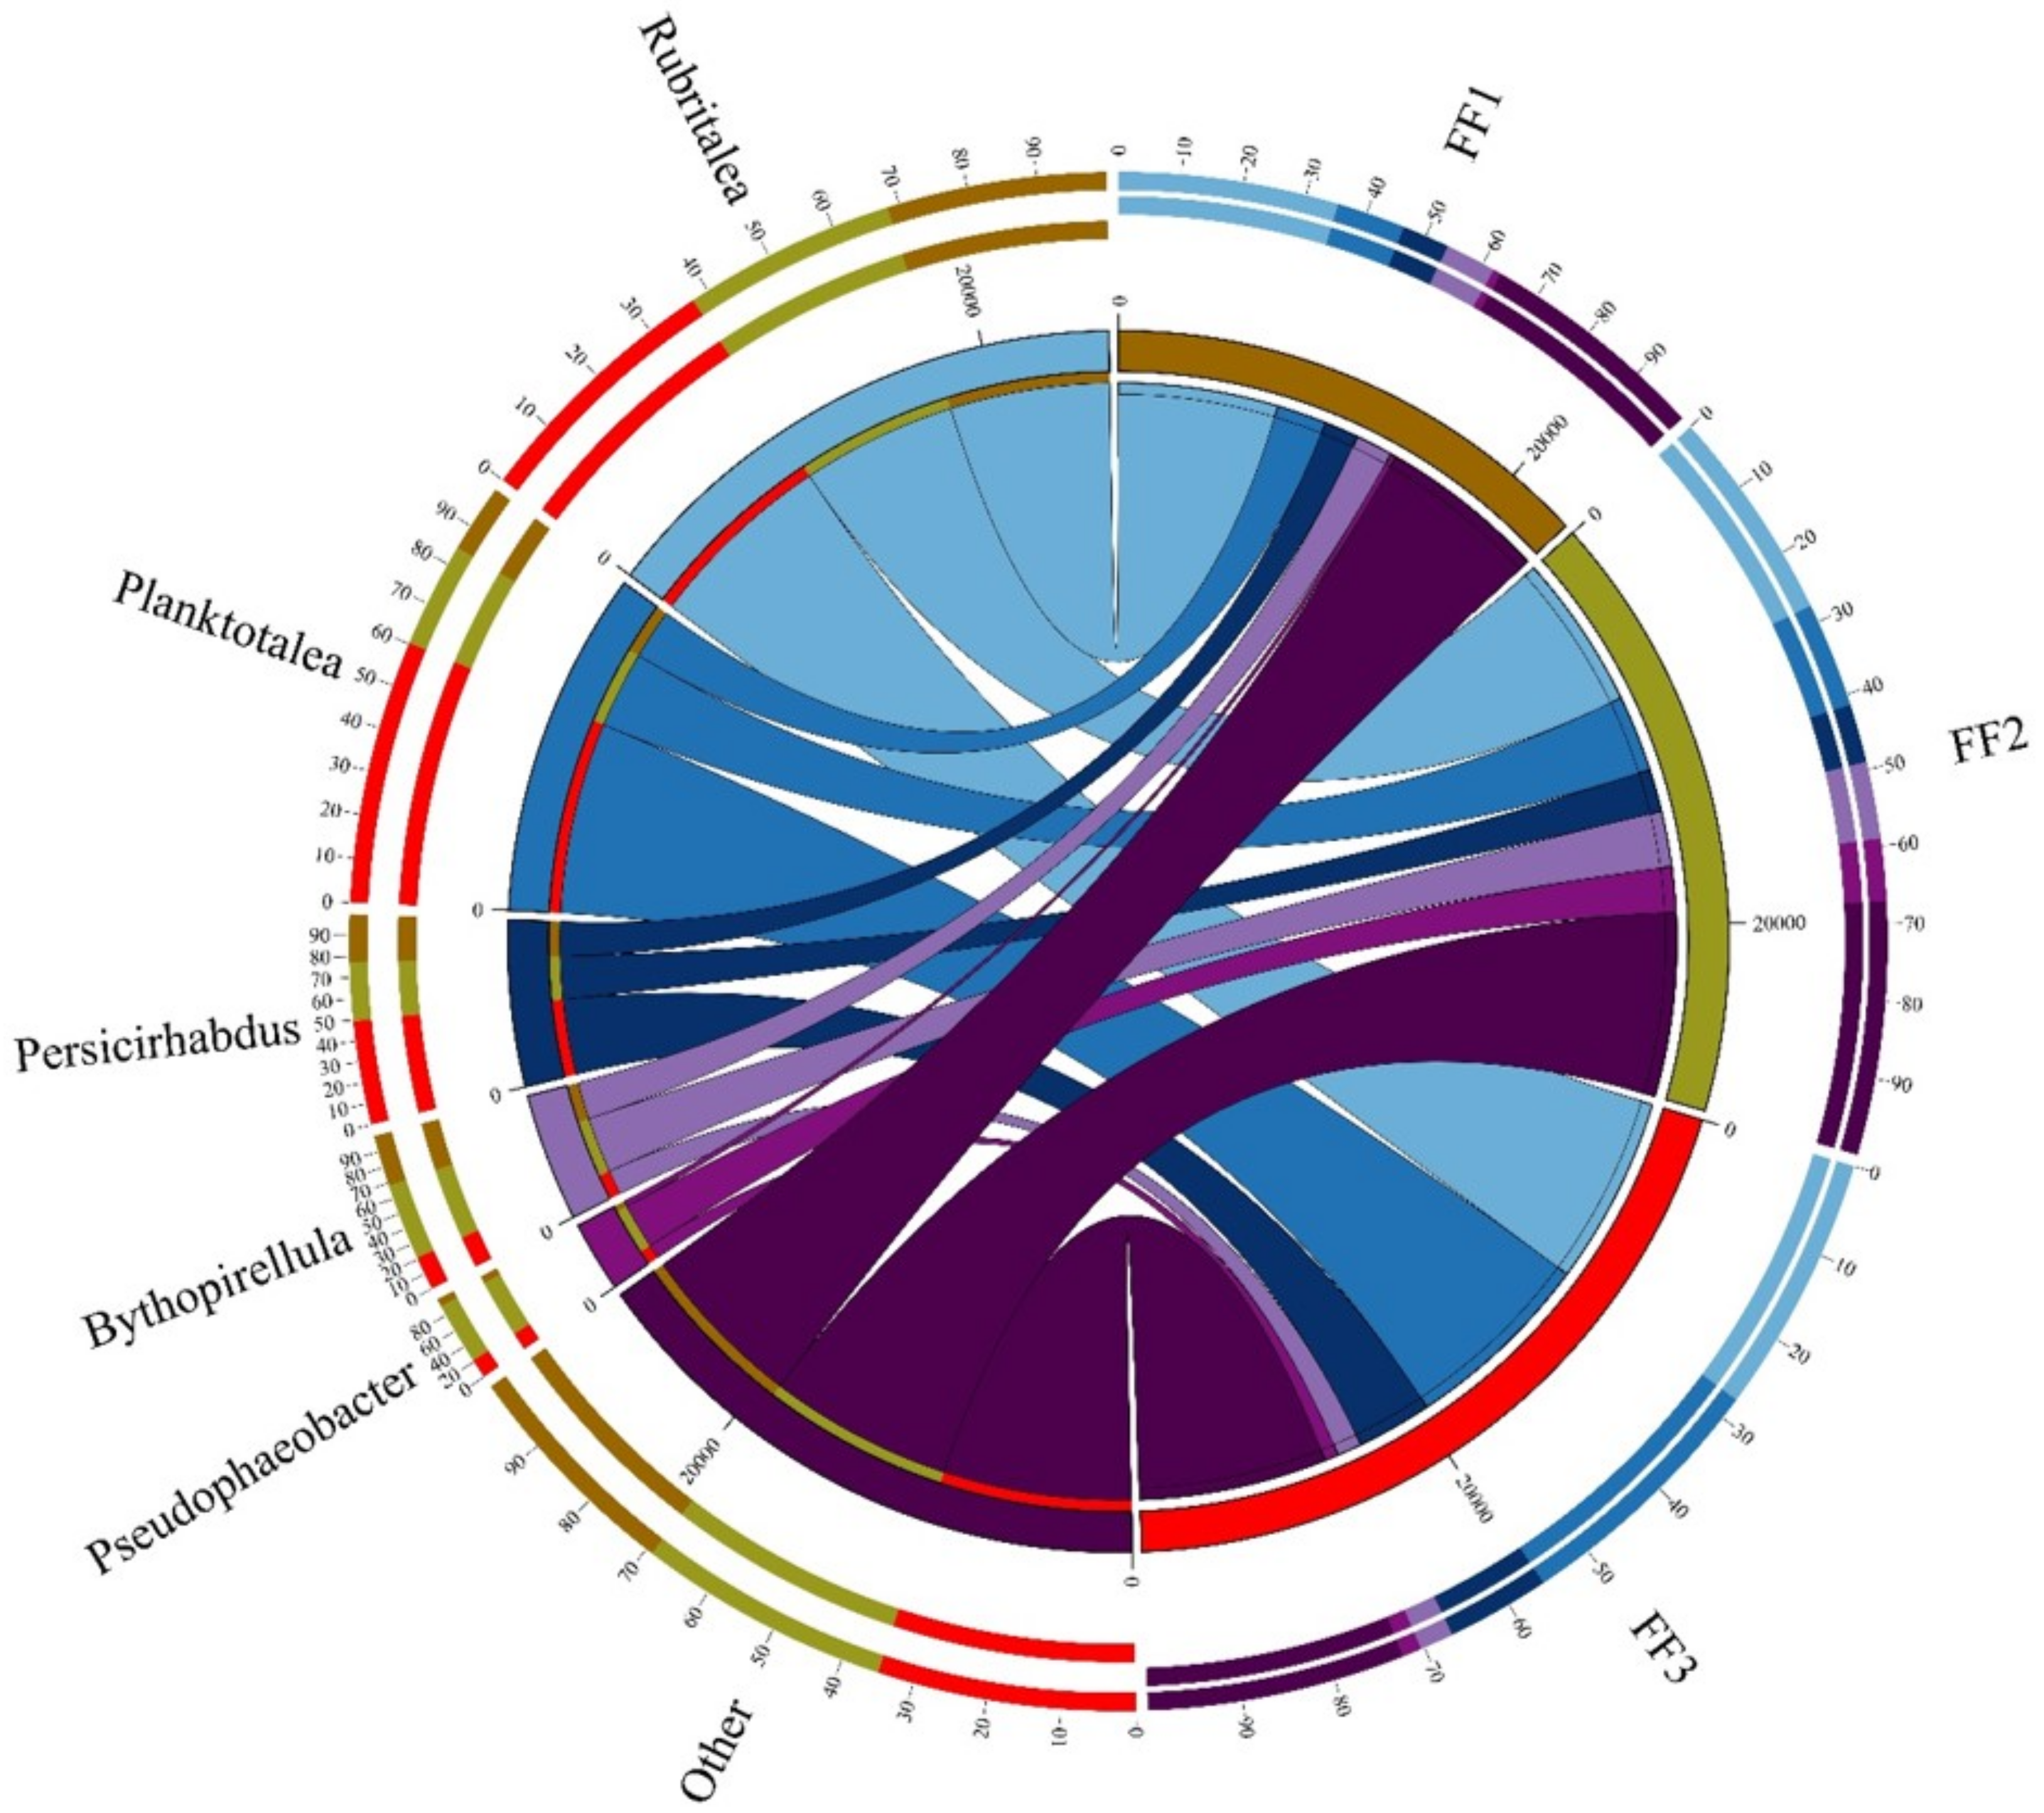
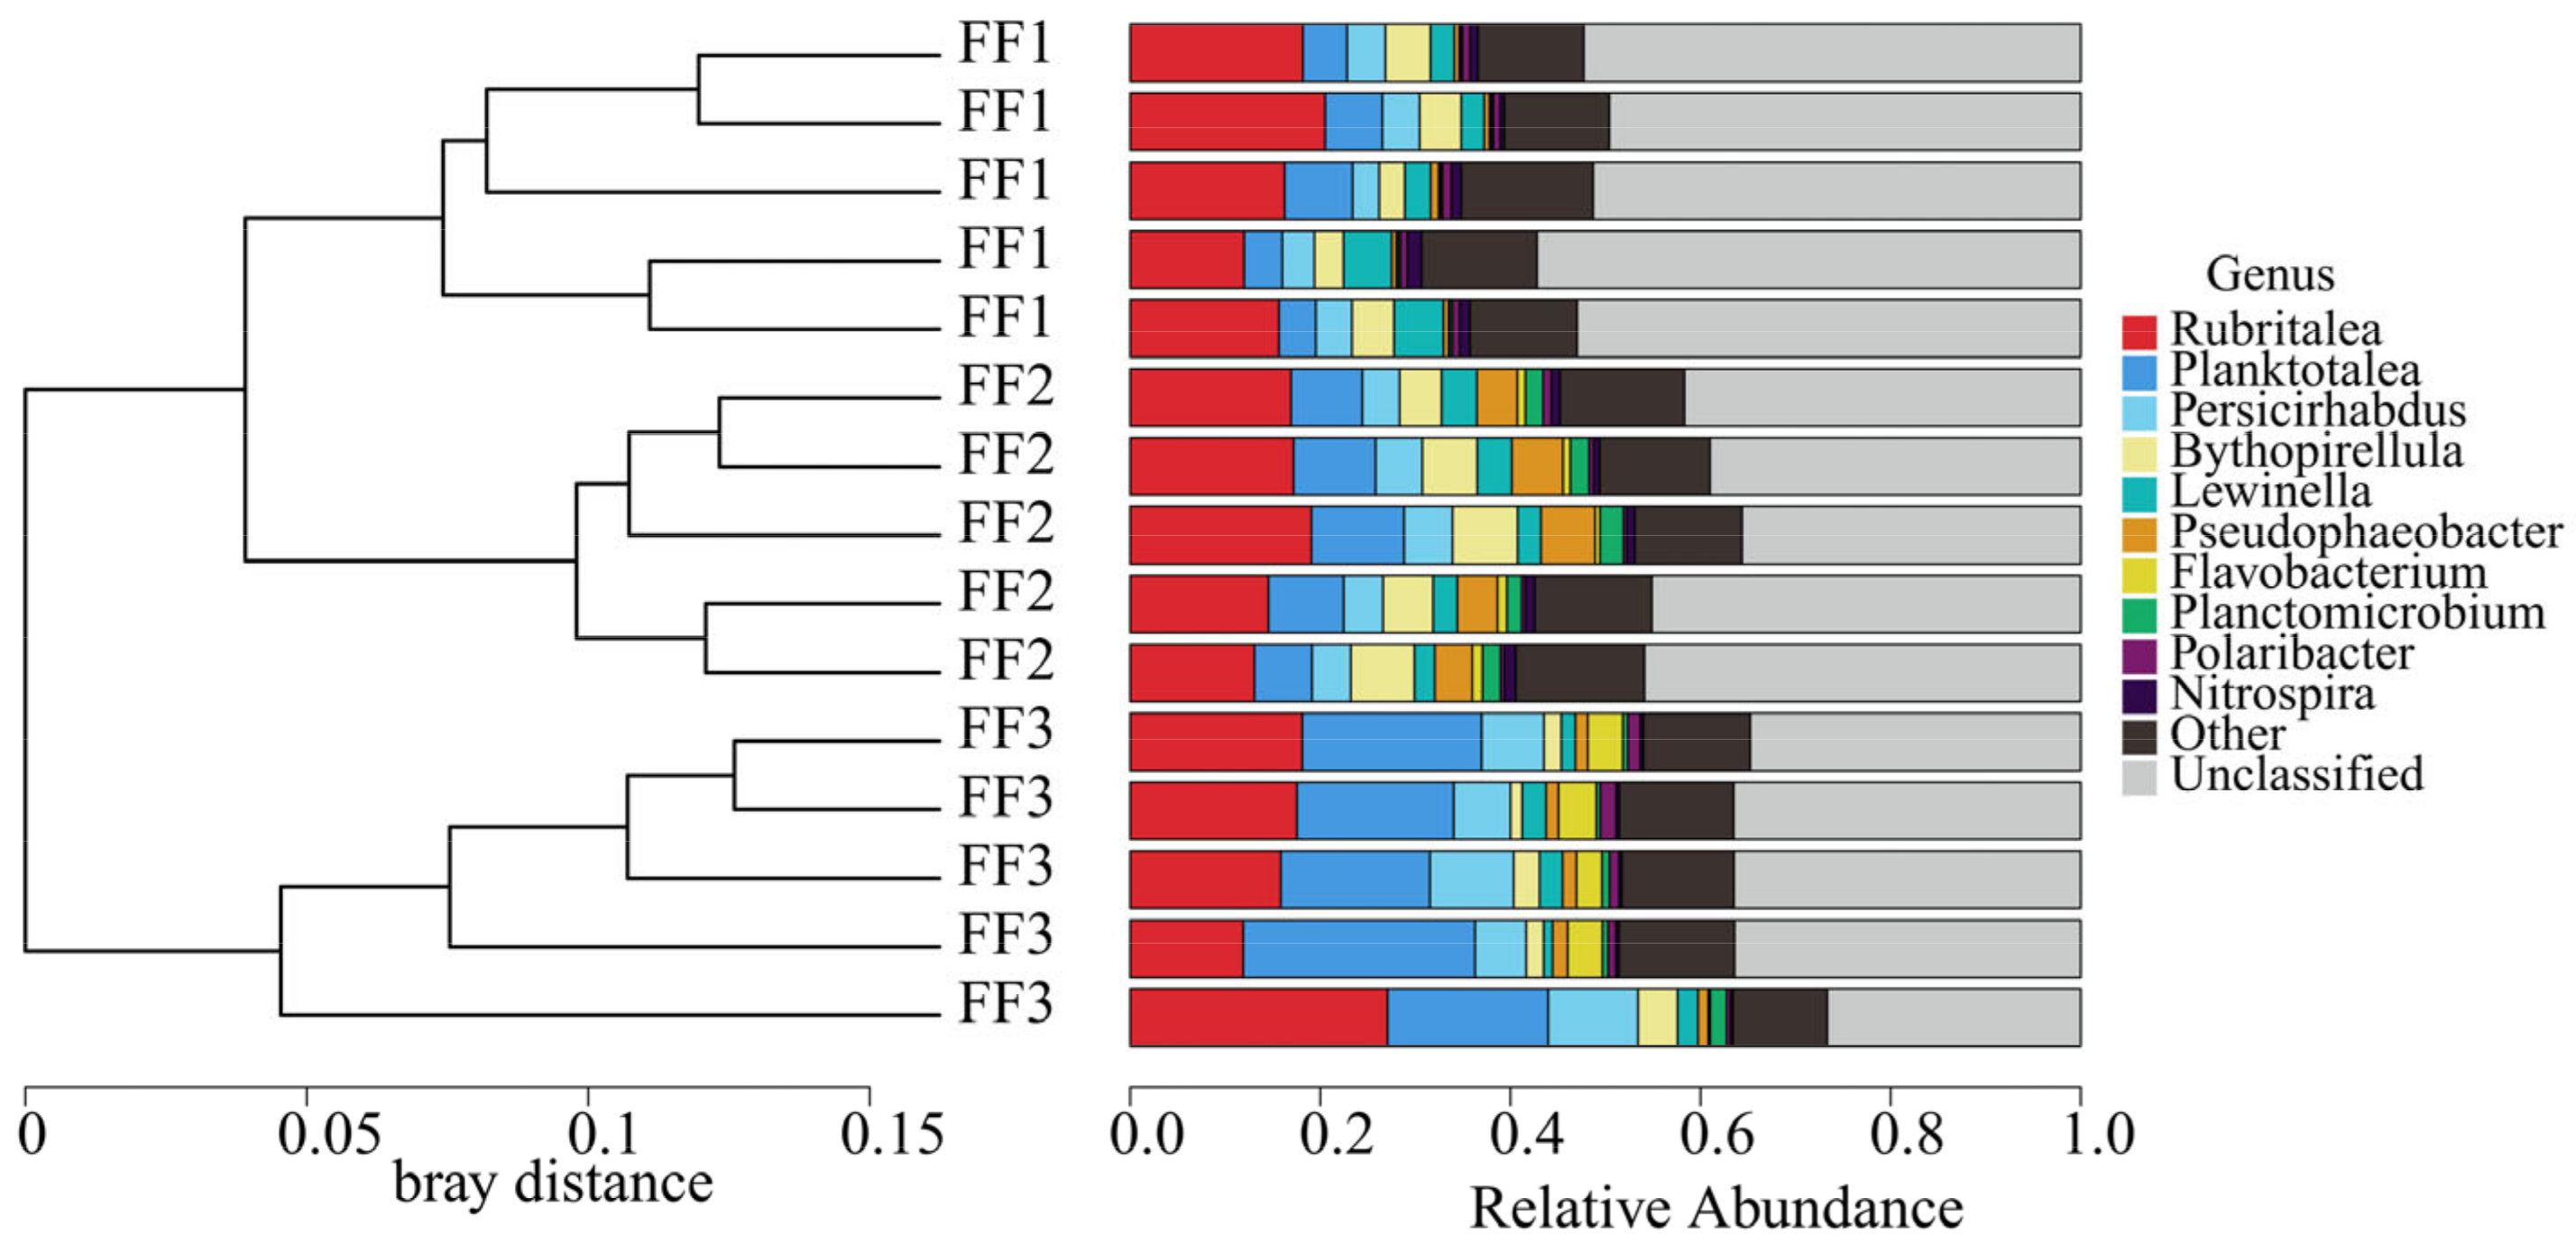
3.3. Microbial Community Composition and Structure
3.4. Microbial Community Diversity
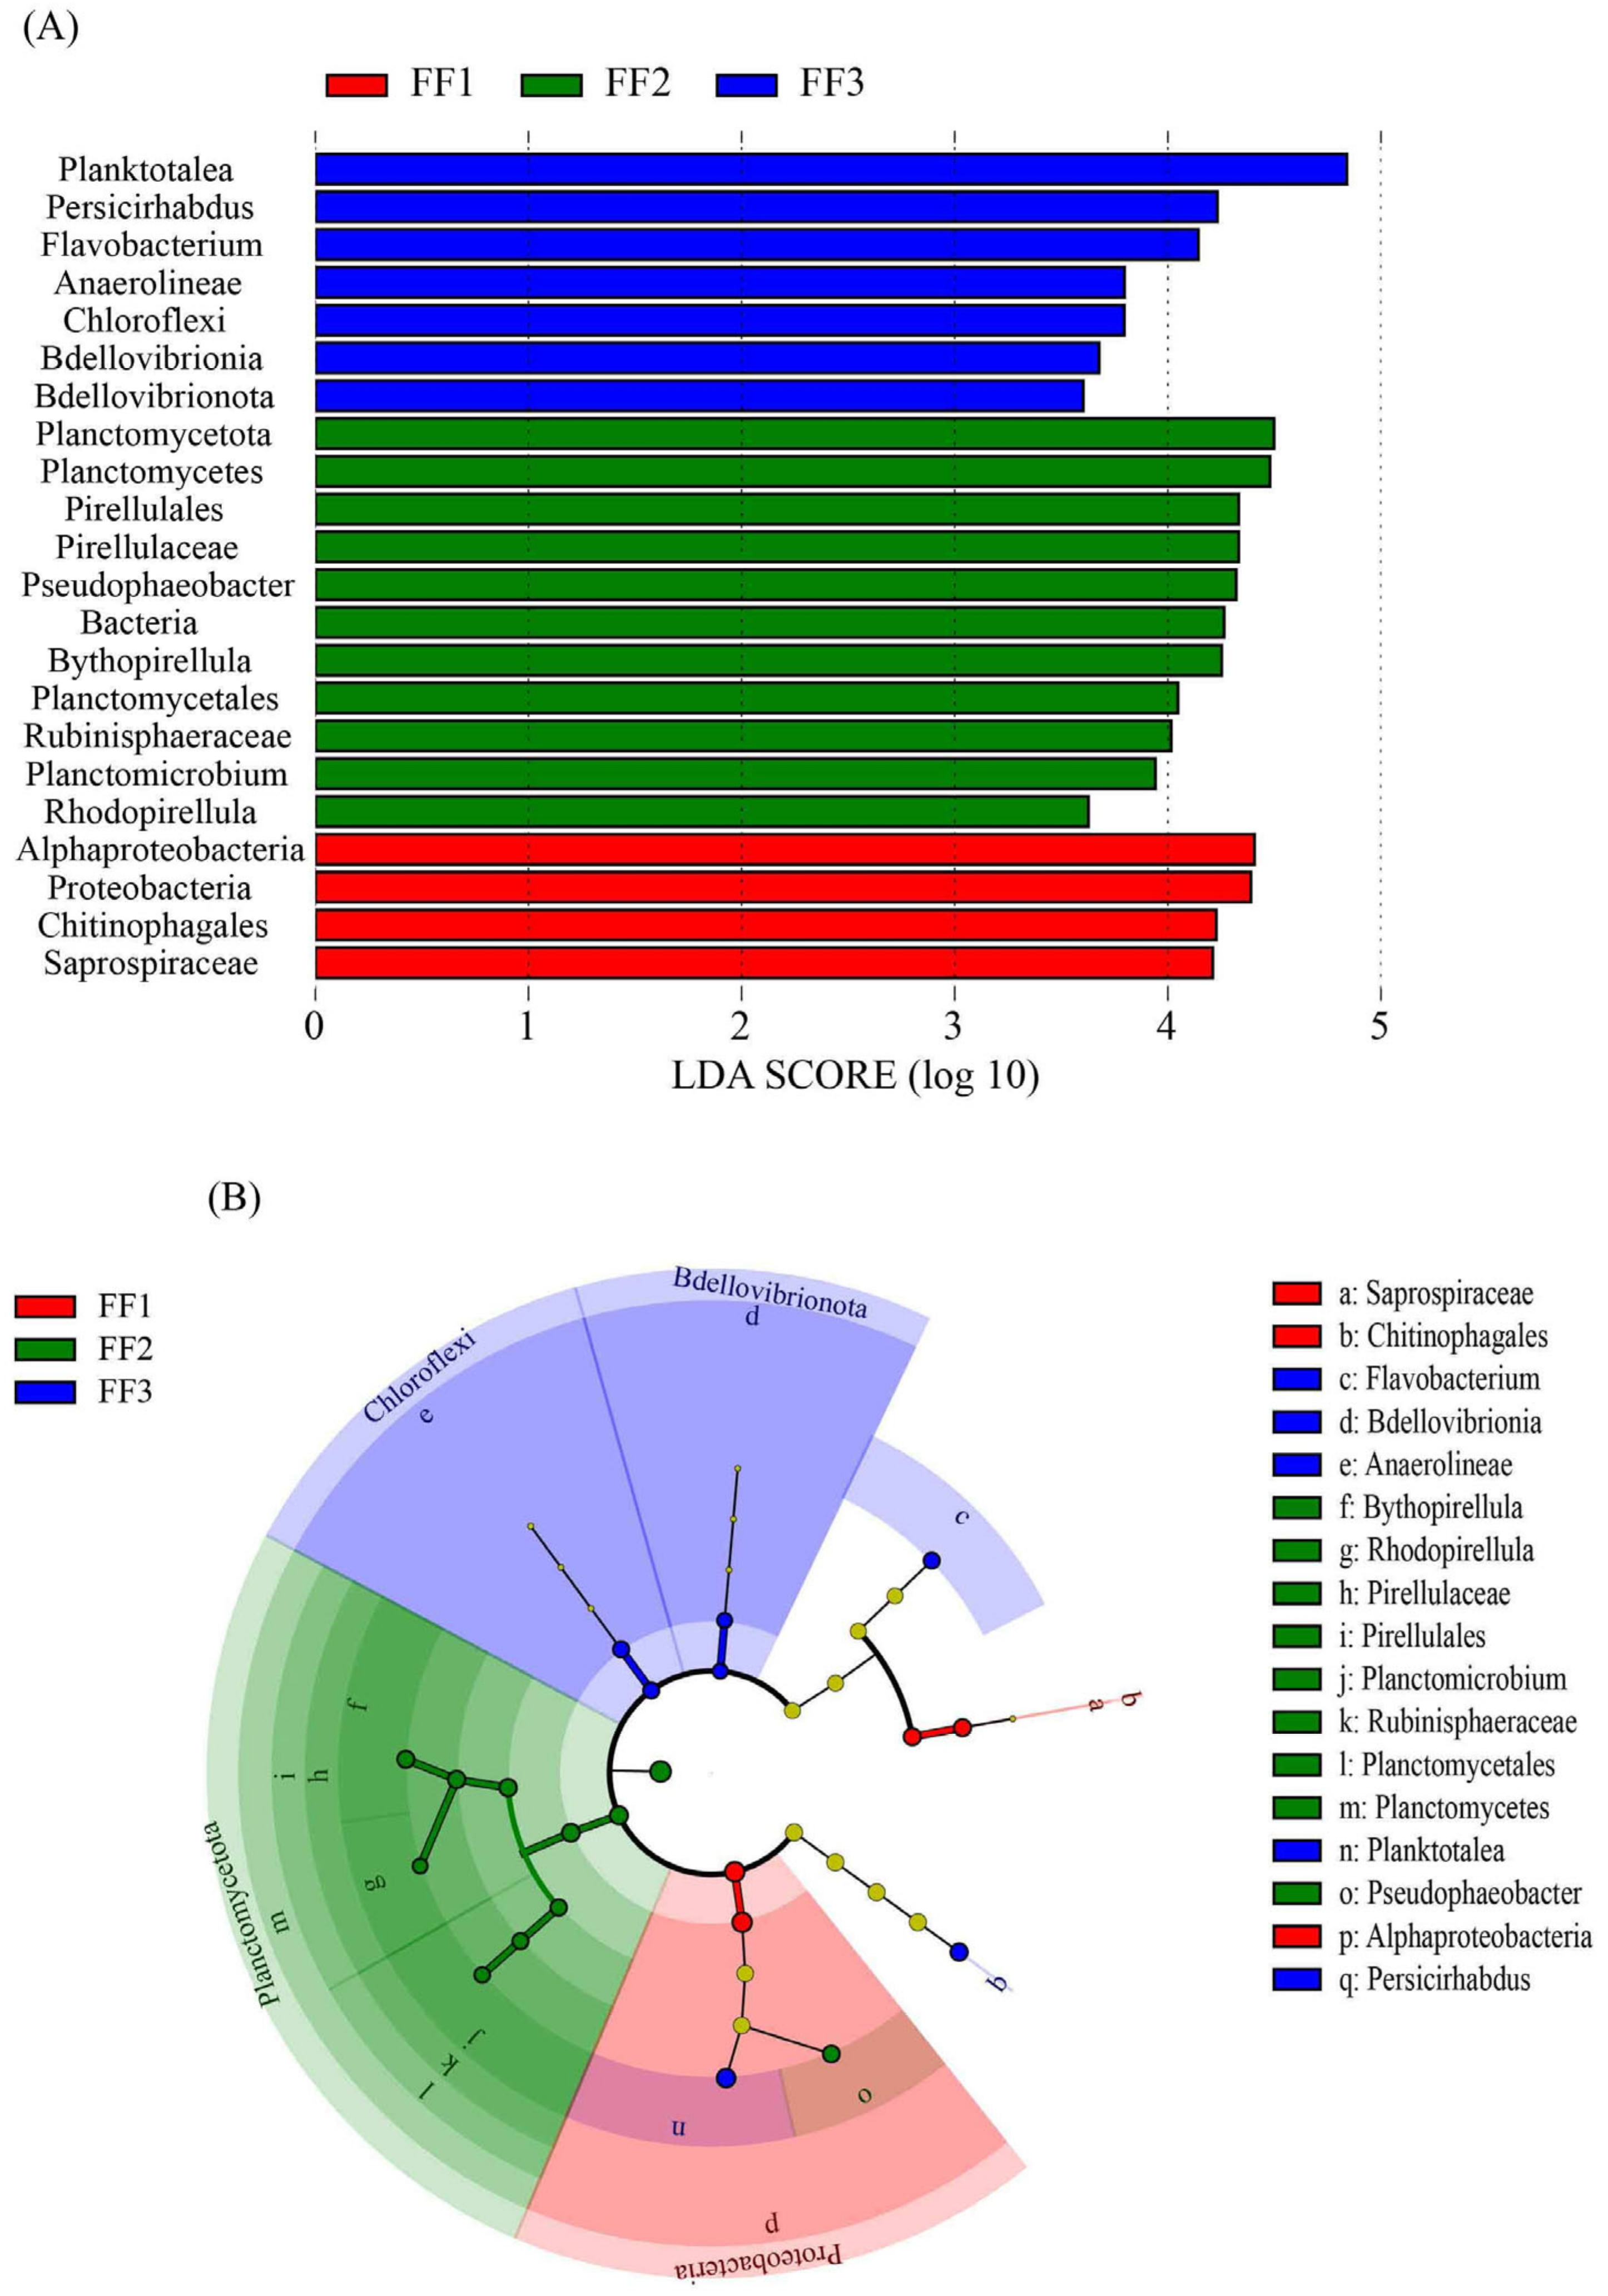
3.5. Microbial Community Differences
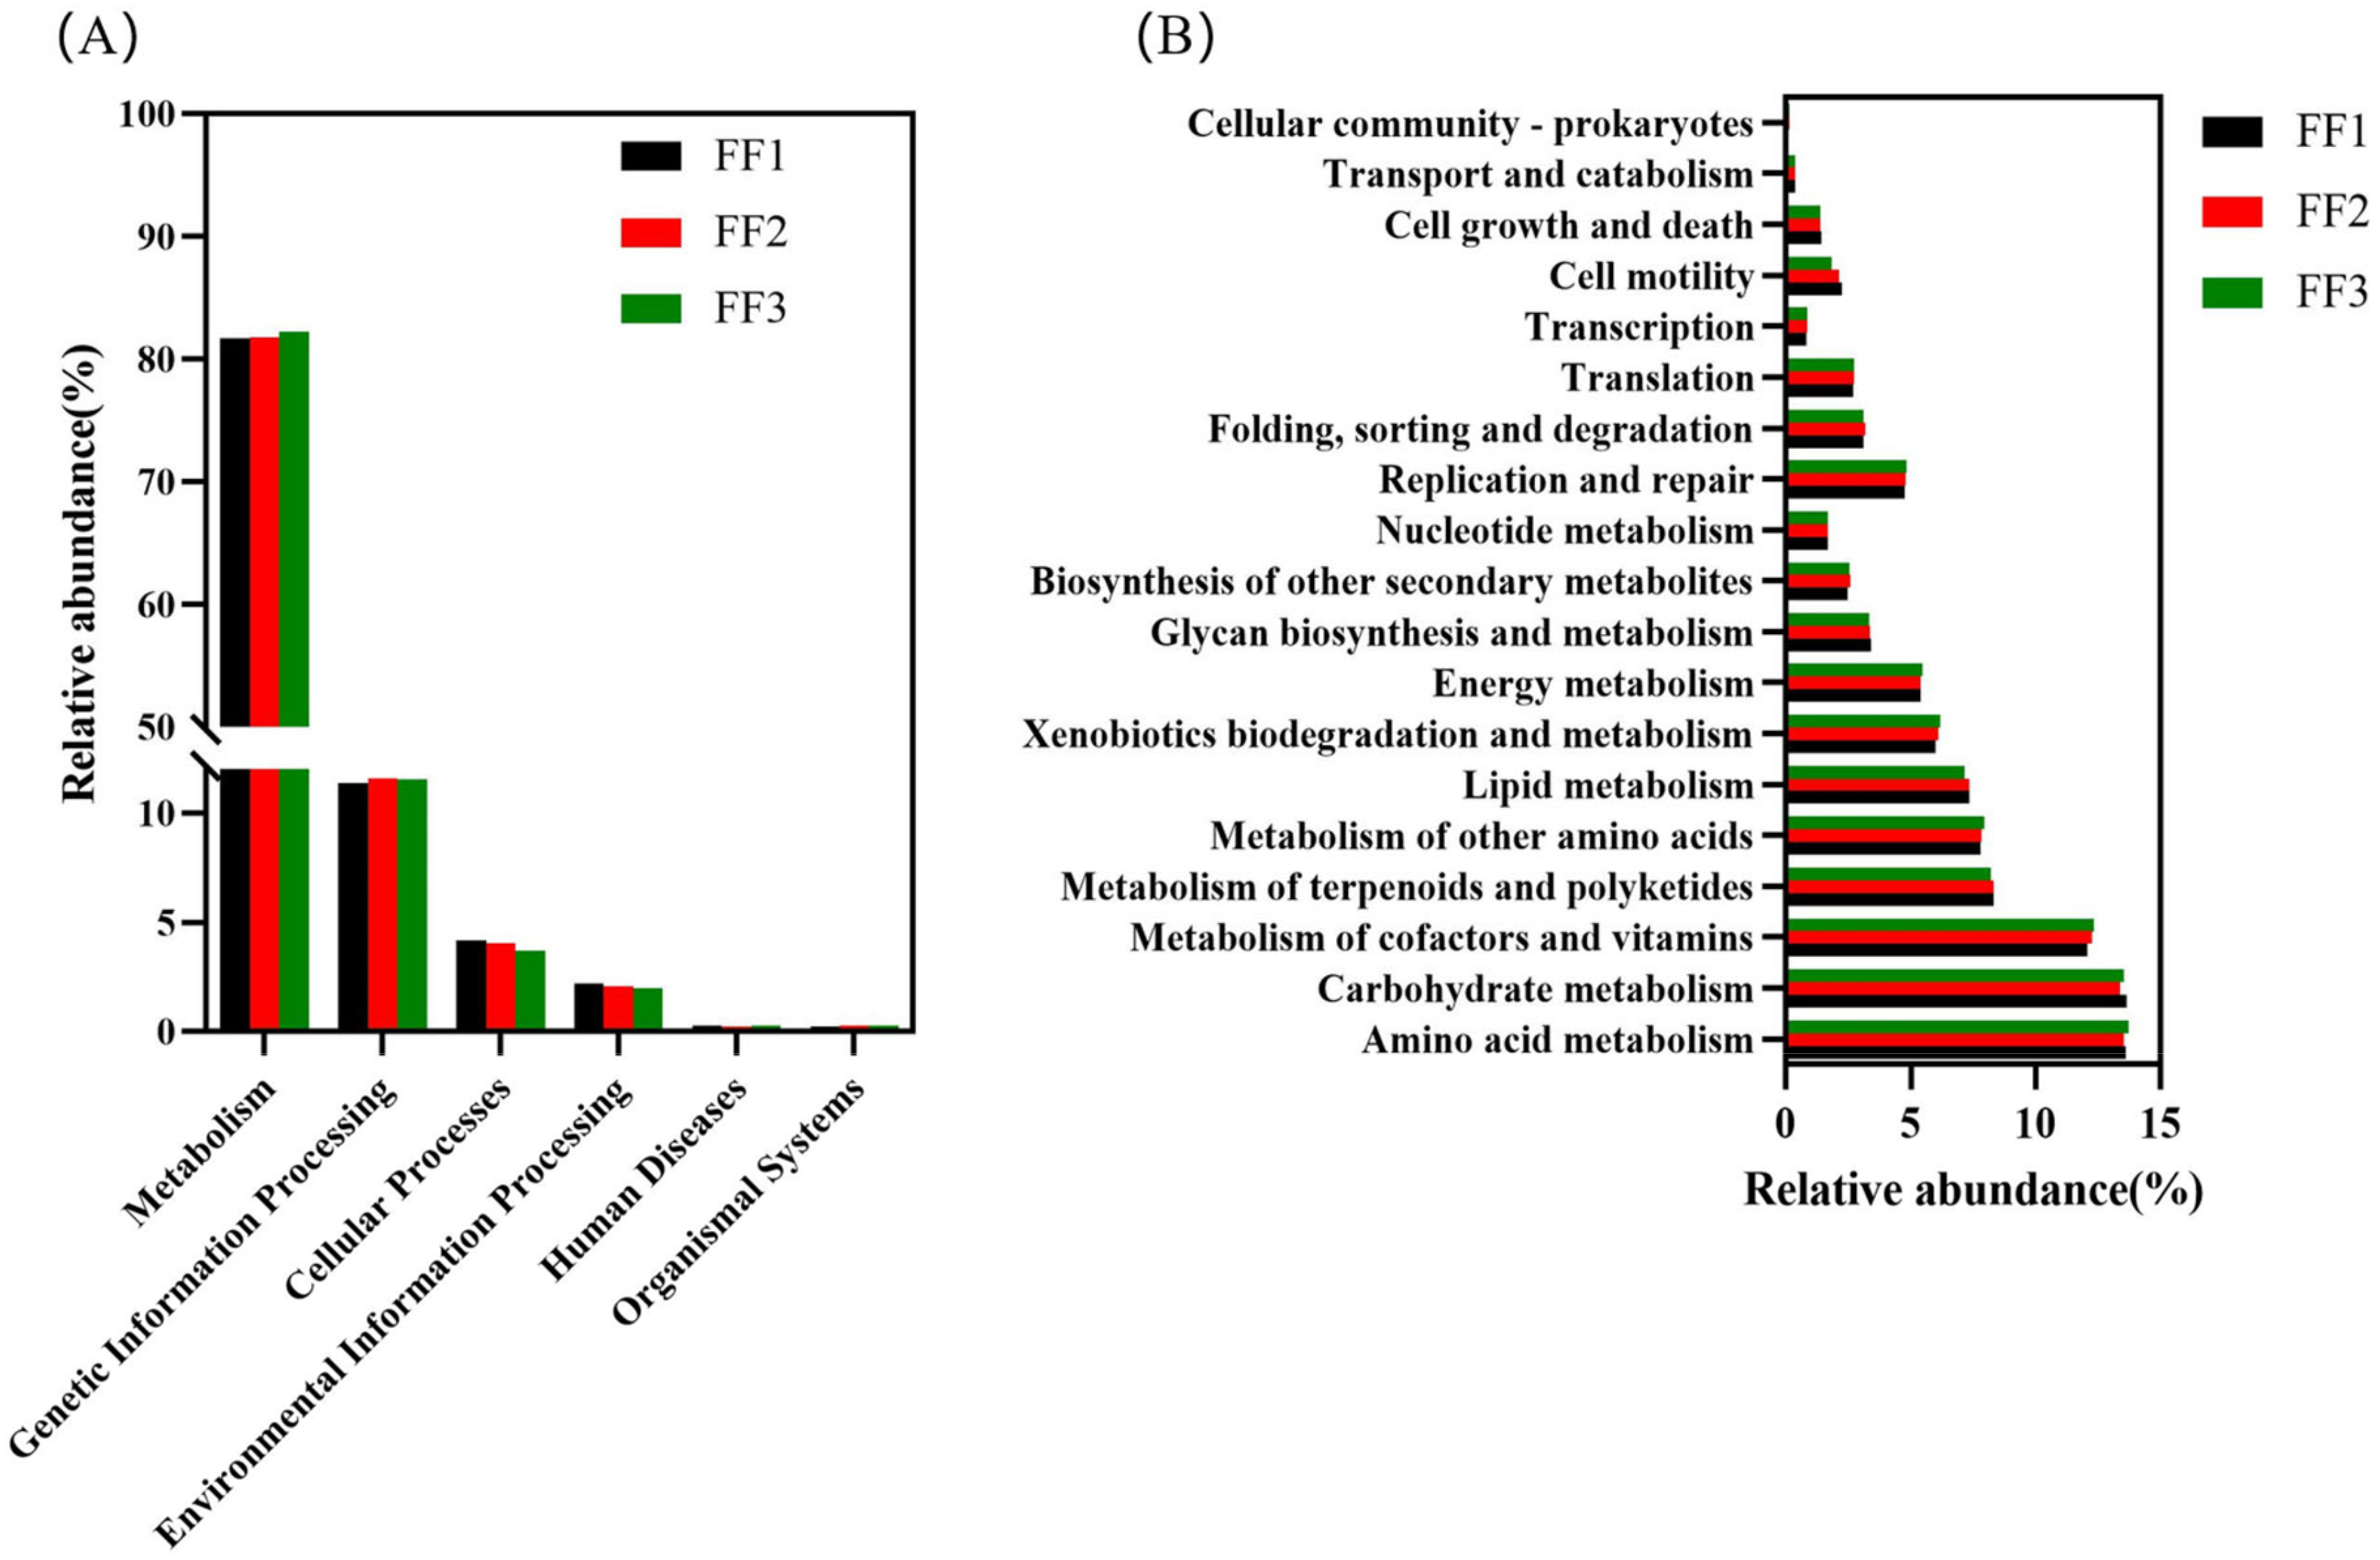
3.6. Functional Prediction
4. Discussion
5. Conclusions
Author Contributions
Funding
Institutional Review Board Statement
Informed Consent Statement
Data Availability Statement
Acknowledgments
Conflicts of Interest
References
- Xiao, R.; Wei, Y.; An, D.; Li, D.; Ta, X.; Wu, Y.; Ren, Q. A review on the research status and development trend of equipment in water treatment processes of recirculating aquaculture systems. Rev. Aquac. 2019, 11, 863–895. [Google Scholar] [CrossRef]
- Bovendeur, J.; Eding, E.; Henken, A. Design and performance of a water recirculation system for high-density culture of the African catfish, Clarias gariepinus (Burchell 1822). Aquaculture 1987, 63, 329–353. [Google Scholar] [CrossRef]
- Freitag, A.R.; Thayer, L.R.; Leonetti, C.; Stapleton, H.M.; Hamlin, H.J. Effects of elevated nitrate on endocrine function in Atlantic salmon, Salmo salar. Aquaculture 2015, 436, 8–12. [Google Scholar] [CrossRef]
- Read, P.; Fernandes, T. Management of environmental impacts of marine aquaculture in Europe. Aquaculture 2003, 226, 139–163. [Google Scholar] [CrossRef]
- Kawasaki, N.; Kushairi, M.; Nagao, N.; Yusoff, F.; Imai, A.; Kohzu, A. Release of nitrogen and phosphorus from aquaculture farms to Selangor River, Malaysia. Int. J. Environ. Sci. Dev. 2016, 7, 113. [Google Scholar] [CrossRef]
- Losordo, T.M.; Hobbs, A.O. Using computer spreadsheets for water flow and biofilter sizing in recirculating aquaculture production systems. Aquac. Eng. 2000, 23, 95–102. [Google Scholar] [CrossRef]
- Godoy-Olmos, S.; Jauralde, I.; Monge-Ortiz, R.; Milián-Sorribes, M.C.; Jover-Cerdá, M.; Tomás-Vidal, A.; Martínez-Llorens, S. Influence of diet and feeding strategy on the performance of nitrifying trickling filter, oxygen consumption and ammonia excretion of gilthead sea bream (Sparus aurata) raised in recirculating aquaculture systems. Aquac. Int. 2022, 30, 581–606. [Google Scholar] [CrossRef]
- Kenter, L.W.; Skillings, C.M.; Berlinsky, D.L. Effects of Feeding Strategies on Growth Performance of F1 Gulf Coast Striped Bass Strains in Recirculating Aquaculture Systems. N. Am. J. Aquac. 2022, 84, 427–431. [Google Scholar] [CrossRef]
- Hou, M.; Zhang, L.; Han, H.; Jiang, X.; Wang, Z.; Liu, X. Effect of feeding strategy of Oncorhynchus mykiss on water quality in recirculating aquaculture system. Trans. Oceanol. Limnol. 2020, 3, 120–126. [Google Scholar]
- Thorarensen, H.; Farrell, A.P. The biological requirements for post-smolt Atlantic salmon in closed-containment systems. Aquaculture 2011, 312, 1–14. [Google Scholar] [CrossRef]
- Dauda, A.B.; Ajadi, A.; Tola-Fabunmi, A.S.; Akinwole, A.O. Waste production in aquaculture: Sources, components and managements in different culture systems. Aquac. Fish. 2019, 4, 81–88. [Google Scholar] [CrossRef]
- Yu, G.; Wang, J.; Liu, L.; Li, Y.; Zhang, Y.; Wang, S. The analysis of groundwater nitrate pollution and health risk assessment in rural areas of Yantai, China. BMC Public Health 2020, 20, 437. [Google Scholar] [CrossRef]
- Kim, J.-H.; Cho, J.-H.; Kim, S.-R.; Hur, Y.B. Toxic effects of waterborne ammonia exposure on hematological parameters, oxidative stress and stress indicators of juvenile hybrid grouper, Epinephelus lanceolatus male × Epinephelus fuscoguttatus female. Environ. Toxicol. Pharmacol. 2020, 80, 103453. [Google Scholar] [CrossRef] [PubMed]
- Abu Bakar, N.S.; Nasir, N.M.; Lananan, F.; Hamid, S.H.A.; Lam, S.S.; Jusoh, A. Optimization of C/N ratios for nutrient removal in aquaculture system culturing African catfish, (Clarias gariepinus) utilizing Bioflocs Technology. Int. Biodeterior. Biodegrad. 2015, 102, 100–106. [Google Scholar] [CrossRef]
- Nootong, K.; Pavasant, P.; Powtongsook, S. Effects of Organic Carbon Addition in Controlling Inorganic Nitrogen Concentrations in a Biofloc System. J. World Aquac. Soc. 2011, 42, 339–346. [Google Scholar] [CrossRef]
- Blancheton, J.P.; Attramadal, K.J.K.; Michaud, L.; d’Orbcastel, E.R.; Vadstein, O. Insight into bacterial population in aquaculture systems and its implication. Aquac. Eng. 2013, 53, 30–39. [Google Scholar] [CrossRef]
- Faust, K.; Raes, J. Microbial interactions: From networks to models. Nat. Rev. Microbiol. 2012, 10, 538–550. [Google Scholar] [CrossRef]
- Bartelme, R.P.; Smith, M.C.; Sepulveda-Villet, O.J.; Newton, R.J. Component Microenvironments and System Biogeography Structure Microorganism Distributions in Recirculating Aquaculture and Aquaponic Systems. Msphere 2019, 4, e00143-19. [Google Scholar] [CrossRef]
- Schreier, H.J.; Mirzoyan, N.; Saito, K. Microbial diversity of biological filters in recirculating aquaculture systems. Curr. Opin. Biotechnol. 2010, 21, 318–325. [Google Scholar] [CrossRef]
- Chen, Z.; Chang, Z.; Zhang, L.; Wang, J.; Qiao, L.; Song, X.; Li, J. Effects of carbon source addition on microbial community and water quality in recirculating aquaculture systems for Litopenaeus vannamei. Fish. Sci. 2020, 86, 507–517. [Google Scholar] [CrossRef]
- Choudhary, A.; Kaur, N.; Sharma, A.; Kumar, A. Evaluation and screening of elite wheat germplasm for salinity stress at the seedling phase. Physiol. Plant. 2021, 173, 2207–2215. [Google Scholar] [CrossRef] [PubMed]
- Bernhard, A.E.; Tucker, J.; Giblin, A.E.; Stahl, D.A. Functionally distinct communities of ammonia-oxidizing bacteria along an estuarine salinity gradient. Environ. Microbiol. 2007, 9, 1439–1447. [Google Scholar] [CrossRef] [PubMed]
- Suhr, K.I.; Pedersen, P.B. Nitrification in moving bed and fixed bed biofilters treating effluent water from a large commercial outdoor rainbow trout RAS. Aquac. Eng. 2010, 42, 31–37. [Google Scholar] [CrossRef]
- Emparanza, E.J.M. Problems affecting nitrification in commercial RAS with fixed-bed biofilters for salmonids in Chile. Aquac. Eng. 2009, 41, 91–96. [Google Scholar] [CrossRef]
- Poxton, M.G.; Allouse, S.B. Cyclical fluctuations in ammonia and nitrite-nitrogen resulting from the feeding of turbot, Scophthalmus-maximus (L.), in recirculating systems. Aquac. Eng. 1987, 6, 301–322. [Google Scholar] [CrossRef]
- Satanwat, P.; Pungrasmi, W.; Powtongsook, S. Effects of Salinity and Immobilization Period on the Nitrification and Denitrification Co-processes during Biofilter Acclimation in a Marine Recirculating Aquaculture System. J. Water Environ. Technol. 2019, 17, 89–99. [Google Scholar] [CrossRef]
- Brailo, M.; Schreier, H.J.; McDonald, R.; Marsic-Lucic, J.; Gavrilovic, A.; Pecarevic, M.; Jug-Dujakovic, J. Bacterial community analysis of marine recirculating aquaculture system bioreactors for complete nitrogen removal established from a commercial inoculum. Aquaculture 2019, 503, 198–206. [Google Scholar] [CrossRef]
- Huang, F.; Pan, L.; Song, M.; Tian, C.; Gao, S. Microbiota assemblages of water, sediment, and intestine and their associations with environmental factors and shrimp physiological health. Appl. Microbiol. Biotechnol. 2018, 102, 8585–8598. [Google Scholar] [CrossRef]
- Chen, W.; Dai, X.; Cao, D.; Wang, S.; Hu, X.; Liu, W.; Yang, D. Performance and microbial ecology of a nitritation sequencing batch reactor treating high-strength ammonia wastewater. Sci. Rep. 2016, 6, 35693. [Google Scholar] [CrossRef]
- Roalkvam, I.; Dronen, K.; Dahle, H.; Wergeland, H.I. Comparison of active biofilm carriers and commercially available inoculum for activation of biofilters in marine recirculating aquaculture systems (RAS). Aquaculture 2020, 514, 734480. [Google Scholar] [CrossRef]
- Li, X.; Ji, L.; Wu, L.; Gao, X.; Li, X.; Li, J.; Liu, Y. Effect of flow velocity on the growth, stress and immune responses of turbot (Scophthalmus maximus) in recirculating aquaculture systems. Fish Shellfish. Immunol. 2019, 86, 1169–1176. [Google Scholar] [CrossRef]
- Devauchelle, N.; Alexandre, J.C.; Le Corre, N.; Letty, Y. Spawning of turbot (Scophthalmus maximus) in captivity. Aquaculture 1988, 69, 159–184. [Google Scholar] [CrossRef]
- Lin, Y.; Miao, L.-H.; Pan, W.-J.; Huang, X.; Dengu, J.M.; Zhang, W.-X.; Ge, X.-P.; Liu, B.; Ren, M.-C.; Zhou, Q.-L.; et al. Effect of nitrite exposure on the antioxidant enzymes and glutathione system in the liver of bighead carp, Aristichthys nobilis. Fish Shellfish. Immunol. 2018, 76, 126–132. [Google Scholar] [CrossRef] [PubMed]
- Wu, H.; Cao, A. Preparation and Adding Methods of Nessler’s Reagent Having Effects on Determination of Water Quality Ammonia Nitrogen. In Proceedings of the 2nd International Conference on Energy and Environmental Protection (ICEEP 2013), Guilin, China, 19–21 April 2013; pp. 1362–1366. [Google Scholar]
- Zhang, W.; Liu, B.; Sun, Z.; Wang, T.; Tan, S.; Fan, X.; Zou, D.; Zhuang, Y.; Liu, X.; Wang, Y.; et al. Comparision of nitrogen removal characteristic and microbial community in freshwater and marine recirculating aquaculture systems. Sci. Total Environ. 2023, 878, 162870. [Google Scholar] [CrossRef] [PubMed]
- Guo, M.; Wu, F.; Hao, G.; Qi, Q.; Li, R.; Li, N.; Wei, L.; Chai, T. Bacillus subtilis Improves Immunity and Disease Resistance in Rabbits. Front. Immunol. 2017, 8, 354. [Google Scholar] [CrossRef] [PubMed]
- Magoc, T.; Salzberg, S.L. FLASH: Fast length adjustment of short reads to improve genome assemblies. Bioinformatics 2011, 27, 2957–2963. [Google Scholar] [CrossRef]
- Bokulich, N.A.; Subramanian, S.; Faith, J.J.; Gevers, D.; Gordon, J.I.; Knight, R.; Mills, D.A.; Caporaso, J.G. Quality-filtering vastly improves diversity estimates from Illumina amplicon sequencing. Nat. Methods 2013, 10, 57. [Google Scholar] [CrossRef]
- Caporaso, J.G.; Kuczynski, J.; Stombaugh, J.; Bittinger, K.; Bushman, F.D.; Costello, E.K.; Fierer, N.; Pena, A.G.; Goodrich, J.K.; Gordon, J.I.; et al. QIIME allows analysis of high-throughput community sequencing data. Nat. Methods 2010, 7, 335–336. [Google Scholar] [CrossRef]
- Edgar, R.C.; Haas, B.J.; Clemente, J.C.; Quince, C.; Knight, R. UCHIME improves sensitivity and speed of chimera detection. Bioinformatics 2011, 27, 2194–2200. [Google Scholar] [CrossRef] [PubMed]
- Wang, Q.; Garrity, G.M.; Tiedje, J.M.; Cole, J.R. Naive Bayesian classifier for rapid assignment of rRNA sequences into the new bacterial taxonomy. Appl. Environ. Microbiol. 2007, 73, 5261–5267. [Google Scholar] [CrossRef]
- Pruesse, E.; Quast, C.; Knittel, K.; Fuchs, B.M.; Ludwig, W.; Peplies, J.; Gloeckner, F.O. SILVA: A comprehensive online resource for quality checked and aligned ribosomal RNA sequence data compatible with ARB. Nucleic Acids Res. 2007, 35, 7188–7196. [Google Scholar] [CrossRef]
- Wickham, H.; Chang, W. An Implementation of the Grammar of Graphics. 2016. Available online: https://citeseerx.ist.psu.edu/document?repid=rep1&type=pdf&doi=7f3e2207d2ef8fc0cee74069879c8adf35303a91 (accessed on 1 January 2022).
- Krzywinski, M.; Schein, J.; Birol, I.; Connors, J.; Gascoyne, R.; Horsman, D.; Jones, S.J.; Marra, M.A. Circos: An information aesthetic for comparative genomics. Genome Res. 2009, 19, 1639–1645. [Google Scholar] [CrossRef]
- Oksanen, J. vegan: Community Ecology Package-R Package Version 1.17-8. 2011. Available online: http://CRAN.R-project.org/package=vegan (accessed on 8 September 2023).
- Conway, J.R.; Lex, A.; Gehlenborg, N. UpSetR: An R package for the visualization of intersecting sets and their properties. Bioinformatics 2017, 33, 2938–2940. [Google Scholar] [CrossRef] [PubMed]
- Chen, H.; Boutros, P.C. VennDiagram: A package for the generation of highly-customizable Venn and Euler diagrams in R. BMC Bioinform. 2011, 12, 35. [Google Scholar] [CrossRef]
- Segata, N.; Izard, J.; Waldron, L.; Gevers, D.; Miropolsky, L.; Garrett, W.S.; Huttenhower, C. Metagenomic biomarker discovery and explanation. Genome Biol. 2011, 12, R60. [Google Scholar] [CrossRef] [PubMed]
- Langille, M.G.I.; Zaneveld, J.; Caporaso, J.G.; McDonald, D.; Knights, D.; Reyes, J.A.; Clemente, J.C.; Burkepile, D.E.; Thurber, R.L.V.; Knight, R.; et al. Predictive functional profiling of microbial communities using 16S rRNA marker gene sequences. Nat. Biotechnol. 2013, 31, 814–821. [Google Scholar] [CrossRef]
- Melo, N.; Moreira Konig, I.F.; Gisela Rios-Duran, M.; Navarrete-Ramirez, P.; Antonio Martinez-Palacios, C.; Solis Murgas, L.D.; Cristian Martinez-Chavez, C. Feeding frequency has a determinant role in growth performance, skeletal deformities, and body composition in the Mexican pike silverside (Chirostoma estor), an agastric short-intestine fish (Teleostei: Atheriniformes). Aquaculture 2023, 562, 738766. [Google Scholar] [CrossRef]
- Petereit, J.; Lannig, G.; Baßmann, B.; Bock, C.; Buck, B.J.M. Circadian rhythm in turbot (Scophthalmus maximus): Daily variation of blood metabolites in recirculating aquaculture systems. Metabolomics 2024, 20, 23. [Google Scholar] [CrossRef] [PubMed]
- Sun, G.; Liu, Y.; Qiu, D.; Yi, M.; Li, X.; Li, Y. Effects of feeding rate and frequency on growth performance, digestion and nutrients balances of Atlantic salmon (Salmo salar) in recirculating aquaculture systems (RAS). Aquac. Res. 2016, 47, 176–188. [Google Scholar] [CrossRef]
- Gao, X.Q.; Wang, X.; Wang, X.Y.; Li, H.X.; Xu, L.; Huang, B.; Meng, X.-S.; Zhang, T.; Chen, H.B.; Xing, R.; et al. Effects of different feeding frequencies on the growth, plasma biochemical parameters, stress status, and gastric evacuation of juvenile tiger puffer fish (Takifugu rubripes). Aquaculture 2022, 548, 737718. [Google Scholar] [CrossRef]
- Rahman, M.M.; Lee, S.-M. Effect of Dietary Lipid Level and Feeding Frequency on the Growth, Feed Utilization, and Body Composition of Juvenile Spotted Seabass, Lateolabrax maculatus. J. World Aquac. Soc. 2017, 48, 634–642. [Google Scholar] [CrossRef]
- Li, H.-H.; Wu, L.-X.; Jiang, Z.-Q.; Rong, A.; Chen, W.; Li, H.-Y.; Dong, Y.-Y. Effects of ration level and feeding frequency on the growth and biochemical components of juvenile turbot (Scophthalmus maximus). Shengtaixue Zazhi 2013, 32, 1844–1849. [Google Scholar]
- de Verdal, H.; Komen, H.; Quillet, E.; Chatain, B.; Allal, F.; Benzie, J.A.H.; Vandeputte, M. Improving feed efficiency in fish using selective breeding: A review. Rev. Aquac. 2018, 10, 833–851. [Google Scholar] [CrossRef]
- Zhan, P.; Liu, W. Use of fluidized bed biofilter and immobilized Rhodopseudomonas palustris for ammonia removal and fish health maintenance in a recirculation aquaculture system. Aquac. Res. 2013, 44, 327–334. [Google Scholar]
- Jia, R.; Han, C.; Lei, J.-L.; Liu, B.-L.; Huang, B.; Huo, H.-H.; Yin, S.-T. Effects of nitrite exposure on haematological parameters, oxidative stress and apoptosis in juvenile turbot (Scophthalmus maximus). Aquat. Toxicol. 2015, 169, 1–9. [Google Scholar] [CrossRef] [PubMed]
- Lorgen-Ritchie, M.; Clarkson, M.; Chalmers, L.; Taylor, J.F.; Migaud, H.; Martin, S.A.M. A Temporally Dynamic Gut Microbiome in Atlantic Salmon During Freshwater Recirculating Aquaculture System (RAS) Production and Post-seawater Transfer. Front. Mar. Sci. 2021, 8, 711797. [Google Scholar] [CrossRef]
- Dosdat, A.; Servais, F.; Metailler, R.; Huelvan, C.; Desbruyeres, E. Comparison of nitrogenous losses in five teleost fish species. Aquaculture 1996, 141, 107–127. [Google Scholar] [CrossRef]
- Fang, L.; Bai, X.-L.; Liang, X.-F.; He, S.; Guo, X.-Z.; Li, L.; Li, B.; Shen, D.; Tao, Y.-X. Ammonia nitrogen excretion in Mandarin Fish (Siniperca chuatsi) and Grass Carp (Ctenopharyngodon idellus) fed practical diets: Theeffects of water temperature. Aquac. Res. 2017, 48, 836–843. [Google Scholar] [CrossRef]
- Zakęś, Z.; Szczepkowski, M.; Demska-Zakęś, K.; Jesiołowski, M. Oxygen consumption and ammonia excretion by juvenile pike, Esox lucius L. Fish. Aquat. Life 2007, 15, 79–92. [Google Scholar]
- Zakes, Z.; Demska-Zakes, K.; Jarocki, P.; Stawecki, K. The effect of feeding on oxygen consumption and ammonia excretion of juvenile tench Tinca tinca (L.) reared in a water recirculating system. Aquac. Int. 2006, 14, 127–140. [Google Scholar] [CrossRef]
- Phillips, T.A.; Summerfelt, R.C.; Clayton, R.D. Feeding frequency effects on water quality and growth of walleye fingerlings in intensive culture. Progress. Fish-Cult. 1998, 60, 1–8. [Google Scholar] [CrossRef]
- Lee, D.-E.; Lee, J.; Kim, Y.-M.; Myeong, J.-I.; Kim, K.-H. Uncultured bacterial diversity in a seawater recirculating aquaculture system revealed by 16S rRNA gene amplicon sequencing. J. Microbiol. 2016, 54, 296–304. [Google Scholar] [CrossRef] [PubMed]
- Ruan, Y.-J.; Guo, X.-S.; Ye, Z.-Y.; Liu, Y.; Zhu, S.-M. Bacterial Community Analysis of Different Sections of a Biofilter in a Full-Scale Marine Recirculating Aquaculture System. N. Am. J. Aquac. 2015, 77, 318–326. [Google Scholar] [CrossRef]
- Huepeden, J.; Wemheuer, B.; Indenbirken, D.; Schulzd, C.; Spieck, E. Taxonomic and functional profiling of nitrifying biofilms in freshwater, brackish and marine RAS biofilters. Aquac. Eng. 2020, 90, 102094. [Google Scholar] [CrossRef]
- Huang, Z.; Wan, R.; Song, X.; Liu, Y.; Hallerman, E.; Dong, D.; Zhai, J.; Zhang, H.; Sun, L. Metagenomic analysis shows diverse, distinct bacterial communities in biofilters among different marine recirculating aquaculture systems. Aquac. Int. 2016, 24, 1393–1408. [Google Scholar] [CrossRef]
- Gonzalez-Silva, B.M.; Jonassen, K.R.; Bakke, I.; Ostgaard, K.; Vadstein, O. Nitrification at different salinities: Biofilm community composition and physiological plasticity. Water Res. 2016, 95, 48–58. [Google Scholar] [CrossRef] [PubMed]
- Sichert, A.; Corzett, C.H.; Schechter, M.S.; Unfried, F.; Markert, S.; Becher, D.; Fernandez-Guerra, A.; Liebeke, M.; Schweder, T.; Polz, M.F.; et al. Verrucomicrobia use hundreds of enzymes to digest the algal polysaccharide fucoidan. Nat. Microbiol. 2020, 5, 1026–1039. [Google Scholar] [CrossRef] [PubMed]
- Ruiz, P.; Miguel Vidal, J.; Sepulveda, D.; Torres, C.; Villouta, G.; Carrasco, C.; Aguilera, F.; Ruiz-Tagle, N.; Urrutia, H. Overview and future perspectives of nitrifying bacteria on biofilters for recirculating aquaculture systems. Rev. Aquac. 2020, 12, 1478–1494. [Google Scholar] [CrossRef]
- Bartelme, R.P.; McLellan, S.L.; Newton, R.J. Freshwater Recirculating Aquaculture System Operations Drive Biofilter Bacterial Community Shifts around a Stable Nitrifying Consortium of Ammonia-Oxidizing Archaea and Comammox Nitrospira. Front. Microbiol. 2017, 8, 101. [Google Scholar] [CrossRef]
- Herlemann, D.P.R.; Lundin, D.; Labrenz, M.; Juergens, K.; Zheng, Z.; Aspeborg, H.; Andersson, A.F. Metagenomic De Novo Assembly of an Aquatic Representative of the Verrucomicrobial Class Spartobacteria. Mbio 2013, 4, e00569-12. [Google Scholar] [CrossRef]
- Zwart, G.; Hiorns, W.D.; Methe, B.A.; Van Agterveld, M.P.; Huismans, R.; Nold, S.C.; Zehr, J.P.; Laanbroek, H.J. Nearly identical 16S rRNA sequences recovered from lakes in North America and Europe indicate the existence of clades of globally distributed freshwater bacteria. Syst. Appl. Microbiol. 1998, 21, 546–556. [Google Scholar] [CrossRef]
- He, S.; Stevens, S.L.R.; Chan, L.-K.; Bertilsson, S.; del Rio, T.G.; Tringe, S.G.; Malmstrom, R.R.; McMahon, K.D. Ecophysiology of Freshwater Verrucomicrobia Inferred from Metagenome-Assembled Genomes. Msphere 2017, 2, e00277-17. [Google Scholar] [CrossRef] [PubMed]
- Lu, Y.; Zeng, J.; Zhao, J.; Wang, B.; Zhang, S.; Xininigen; Yu, J. Spatial characteristics of denitrifying bacterial communities in different habitats from typical steppe. Microbiol. China 2019, 46, 707–720. [Google Scholar]
- Fan, J.; Cao, L.; Gao, C.; Ye, J.; Ji, B.; Zhang, H. Effect of light and dark environment on performance of activated sludge process. J. Saf. Environ. 2019, 19, 2159–2166. [Google Scholar]
- Zure, M.; Fernandez-Guerra, A.; Munn, C.B.; Harder, J. Geographic distribution at subspecies resolution level: Closely related Rhodopirellula species in European coastal sediments. Isme J. 2017, 11, 478–489. [Google Scholar] [CrossRef] [PubMed]
- Frank, C.S.; Langhammer, P.; Fuchs, B.M.; Harder, J. Ammonium and attachment of Rhodopirellula baltica. Arch. Microbiol. 2011, 193, 365–372. [Google Scholar] [CrossRef] [PubMed]
- He, D.; Li, G.; Xie, H.; Liu, S.; Luo, Y. Effects of Feeding Frequency on the Post-Feeding Oxygen Consumption and Ammonia Excretion of the Juvenile Snakehead. Turk. J. Fish. Aquat. Sci. 2015, 15, 295–303. [Google Scholar]
- Guan, M.; Zhang, D.; Sun, X.; Shu, D.; Rao, J.; Tang, D. Effect of feeding frequency on growth performance, feed transit and digestive enzyme activity of Acipenser dabryanus juveniles. Aquac. Res. 2022, 53, 5885–5901. [Google Scholar] [CrossRef]
- Brown, M.N.; Briones, A.; Diana, J.; Raskin, L. Ammonia-oxidizing archaea and nitrite-oxidizing nitrospiras in the biofilter of a shrimp recirculating aquaculture system. Fems Microbiol. Ecol. 2013, 83, 17–25. [Google Scholar] [CrossRef] [PubMed]
- Wang, M.; Wu, Y.; Zhu, J.; Wang, C.; Zhu, Y.; Tian, Q. The New Developments Made in the Autotrophic and Heterotrophic Ammonia Oxidation. IOP Conf. Ser. Earth Environ. Sci. 2018, 178, 012016. [Google Scholar] [CrossRef]
- Caranto, J.D.; Lancaster, K.M. Nitric oxide is an obligate bacterial nitrification intermediate produced by hydroxylamine oxidoreductase. Proc. Natl. Acad. Sci. USA 2017, 114, 8217–8222. [Google Scholar] [CrossRef] [PubMed]
- Sedlacek, C.J.; Nielsen, S.; Greis, K.D.; Haffey, W.D.; Revsbech, N.P.; Ticak, T.; Laanbroek, H.J.; Bollmann, A. Effects of Bacterial Community Members on the Proteome of the Ammonia-Oxidizing Bacterium Nitrosomonas sp. Strain Is79. Appl. Environ. Microbiol. 2016, 82, 4776–4788. [Google Scholar] [CrossRef] [PubMed]
- Daims, H.; Luecker, S.; Wagner, M. A New Perspective on Microbes Formerly Known as Nitrite-Oxidizing Bacteria. Trends Microbiol. 2016, 24, 699–712. [Google Scholar] [CrossRef] [PubMed]
- Hou, L.; Xie, X.; Wan, X.; Kao, S.-J.; Jiao, N.; Zhang, Y. Niche differentiation of ammonia and nitrite oxidizers along a salinity gradient from the Pearl River estuary to the South China Sea. Biogeosciences 2018, 15, 5169–5187. [Google Scholar] [CrossRef]
- Breuillin-Sessoms, F.; Venterea, R.T.; Sadowsky, M.J.; Coulter, J.A.; Clough, T.J.; Wang, P. Nitrification gene ratio and free ammonia explain nitrite and nitrous oxide production in urea-amended soils. Soil Biol. Biochem. 2017, 111, 143–153. [Google Scholar] [CrossRef]
- Beman, J.M.; Sachdeva, R.; Fuhrman, J.A. Population ecology of nitrifying Archaea and Bacteria in the Southern California Bight. Environ. Microbiol. 2010, 12, 1282–1292. [Google Scholar] [CrossRef]
- Monsees, H.; Klatt, L.; Kloas, W.; Wuertz, S. Chronic exposure to nitrate significantly reduces growth and affects the health status of juvenile Nile tilapia (Oreochromis niloticus L.) in recirculating aquaculture systems. Aquac. Res. 2017, 48, 3482–3492. [Google Scholar] [CrossRef]
- Van Rijn, J.; Tal, Y.; Schreier, H.J. Denitrification in recirculating systems: Theory and applications. Aquac. Eng. 2006, 34, 364–376. [Google Scholar] [CrossRef]
- Hamlin, H.J. Nitrate toxicity in Siberian sturgeon (Acipenser baeri). Aquaculture 2006, 253, 688–693. [Google Scholar] [CrossRef]
- Pochana, K.; Keller, J.; Lant, P. Model development for simultaneous nitrification and denitrification. Water Sci. Technol. 1999, 39, 235–243. [Google Scholar] [CrossRef]
- van Niftrik, L.; Jetten, M.S.M. Anaerobic Ammonium-Oxidizing Bacteria: Unique Microorganisms with Exceptional Properties. Microbiol. Mol. Biol. Rev. 2012, 76, 585–596. [Google Scholar] [CrossRef] [PubMed]
- Hu, D.; Wang, L.; Zhao, R.; Zeng, J.; Shao, Z. Core microbiome involved in nitrite removal in shrimp culture ponds. Aquac. Res. 2022, 53, 1663–1675. [Google Scholar] [CrossRef]


Disclaimer/Publisher’s Note: The statements, opinions and data contained in all publications are solely those of the individual author(s) and contributor(s) and not of MDPI and/or the editor(s). MDPI and/or the editor(s) disclaim responsibility for any injury to people or property resulting from any ideas, methods, instructions or products referred to in the content. |
© 2025 by the authors. Licensee MDPI, Basel, Switzerland. This article is an open access article distributed under the terms and conditions of the Creative Commons Attribution (CC BY) license (https://creativecommons.org/licenses/by/4.0/).
Share and Cite
Guo, X.; Li, J.; Xu, S.; Jiang, X.; Guo, T.; Liu, F.; Gao, G.; Li, J.; Wang, Y.; Jiang, W. Effects of Feeding Frequency on Turbot (Scophthalmus maximus) Performance, Water Quality and Microbial Community in Recirculating Aquaculture Systems. Fishes 2025, 10, 125. https://doi.org/10.3390/fishes10030125
Guo X, Li J, Xu S, Jiang X, Guo T, Liu F, Gao G, Li J, Wang Y, Jiang W. Effects of Feeding Frequency on Turbot (Scophthalmus maximus) Performance, Water Quality and Microbial Community in Recirculating Aquaculture Systems. Fishes. 2025; 10(3):125. https://doi.org/10.3390/fishes10030125
Chicago/Turabian StyleGuo, Xiaoyang, Jiyuan Li, Shihong Xu, Xin Jiang, Teng Guo, Feng Liu, Guang Gao, Jun Li, Yanfeng Wang, and Wei Jiang. 2025. "Effects of Feeding Frequency on Turbot (Scophthalmus maximus) Performance, Water Quality and Microbial Community in Recirculating Aquaculture Systems" Fishes 10, no. 3: 125. https://doi.org/10.3390/fishes10030125
APA StyleGuo, X., Li, J., Xu, S., Jiang, X., Guo, T., Liu, F., Gao, G., Li, J., Wang, Y., & Jiang, W. (2025). Effects of Feeding Frequency on Turbot (Scophthalmus maximus) Performance, Water Quality and Microbial Community in Recirculating Aquaculture Systems. Fishes, 10(3), 125. https://doi.org/10.3390/fishes10030125