Article

The Effects of Two Different Aquaculture Methods on Water Quality, Microbial Communities, Production Performance, and Health Status of Penaeus monodon

1
College of Fisheries and Life Science, Shanghai Ocean University, Shanghai 201306, China
2
South China Sea Fisheries Research Institute, Chinese Academy of Fishery Sciences, Southern Marine Science and Engineering Guangdong Laboratory (Zhuhai), Guangzhou 510300, China
3
Sanya Tropical Fisheries Research Institute, Sanya 572018, China
4
Key Laboratory of South China Sea Fishery Resources Exploitation & Utilization, Ministry of Agriculture and Rural Affairs, Guangdong Provincial Key Laboratory of Fishery Ecology and Environment, Guangzhou 510300, China
5
Key Laboratory of Efficient Utilization and Processing of Marine Fishery Resources of Hainan Province, Sanya 572426, China
*
Authors to whom correspondence should be addressed.
Fishes 2025, 10(3), 106; https://doi.org/10.3390/fishes10030106
Submission received: 24 January 2025 / Revised: 25 February 2025 / Accepted: 27 February 2025 / Published: 1 March 2025
(This article belongs to the Special Issue Advances in Shrimp Aquaculture: Management and Sustainability)

Abstract

The tiger shrimp Penaeus monodon is a commercially important species; however, the intensification of the farming of this species has led to the production and release of significant amounts of organic waste. Traditional aquaculture uses water exchange for waste removal, which may cause pollution and infection of reared species with external pathogens. This study aimed to evaluate the effects of two different aquaculture modes on the antioxidant status, nonspecific immune response, and growth performance of P. monodon, and reveal differences in their microbial communities. The experiment was divided into two groups: one using bioflocs and zero water exchange (Group ZC), and the other using a clear water system (Group C). The results showed that, compared with those in Group C, P. monodon in Group ZC exhibited a higher final body weight, lower feed conversion ratio, higher survival rate, and higher unit yield. Additionally, P. monodon in Group ZC showed higher antioxidant and digestive enzyme activities, as well as upregulated expression of immune-related genes (such as lysozyme, anti-lipopolysaccharide factor, and Toll-like receptors). Therefore, biofloc technology can improve the growth performance, immunity, and antioxidant capacity of P. monodon, offering an environmentally friendly and efficient aquaculture model for P. monodon farming.
Key Contribution: Using bioflocs in a zero-water-exchange system for the culture of Penaeus monodon is an effective and environmentally friendly method. It can improve water quality, promote P. monodon growth, enhance the immune and antioxidant capacities, and increase aquaculture efficiency.

1. Introduction

The tiger shrimp Penaeus monodon (P. monodon) is a highly valued marine aquaculture species worldwide, with 696 million kilograms being produced in 2021 [1]. In recent years, owing to the massive outbreak of diseases and low price of the whiteleg shrimp P. vannamei, the production and aquaculture area of P. monodon have increased greatly in China [2]. However, as the intensity of the culture mode increases, the concentrations of organic waste significantly increase, which can cause severe oxygen depletion and produce toxic nitrogen substances, such as total ammonia nitrogen (TAN) and nitrite nitrogen (NO2-N). To remove these harmful substances from traditional aquaculture systems, large amounts of water must be replaced, which may cause environmental problems due to pollution and increase the risk of infection with pathogens from the external environment [3]. Therefore, minimal/zero-exchange intensive aquaculture systems offer an environmentally attractive method for shrimp farming.
Biofloc technology (BFT) has been applied to improve water quality and allows P. monodon and other animals to grow at high densities with little water exchange [4,5]. BFT is based on culturing bioflocs of a specific microbial community, and carbon sources are usually added to BFT systems to increase the total organic carbon/total nitrogen (C/N) ratio in water [6]. A high C/N ratio promotes the utilisation of nitrogen by heterotrophic bacteria for microbial proteins and allows them to maintain inorganic nitrogen levels within limits [7]. Heterotrophic bacteria play a central role in maintaining the ecological balance of aquatic systems through the efficient degradation of dissolved organic matter and cycling of nutrients, such as nitrogen and phosphorus [8]. In addition to heterotrophic bacteria, chemoautotrophic nitrifying bacteria can convert toxic TAN and NO2-N into nitrate nitrogen (NO3-N), which is much less toxic. Chemoautotrophic bacteria require less oxygen and have higher toxic nitrogen removal efficiency. However, chemoautotrophic bacteria require a longer generation time and thus develop much more slowly [9]. The microbial community is also affected by many other external factors, such as carbohydrate sources, environmental factors, and the animals being farmed via aquaculture [10]. Therefore, to optimise system functioning, a beneficial microbial community should be developed and sustained. This requires knowledge of and the ability to monitor changes in the composition of the microbial community.
In addition to improving water quality, bioflocs can provide packaging for microbial proteins and nutrients that are directly accessible to cultured animals, resulting in an improved growth rate, feed conversion ratio (FCR), and weight gain [11,12]. Previous studies have shown that bioflocs enhance the growth performance of shrimp and fish [13,14,15,16,17]. In addition to serving as a source of quality proteins, bioflocs are a rich source of growth promoters and bioactive compounds [18], which enhance digestive enzymes [19] and the health status of cultured shrimp, such as the immune cellular response and antioxidant status [18,20].
To date, there have been few studies on the application of BFT to P. monodon cultures. It was recently demonstrated that supplementation with carbohydrates or bioflocs improves immune responses, metabolic activities, and growth in juvenile P. monodon [17,21]. However, there is a dearth of information supporting the application of bioflocs to adult P. monodon. Hence, this study aimed to assess the contribution of bioflocs to the antioxidant status, non-specific immune response, and growth performance of P. monodon and to reveal the relationship between microbial structure and water quality parameters.

2. Materials and Methods

2.1. Experimental P. monodon

Fifteen-day-old post-larval P. monodon (0.03 ± 0.01 g, 1.3 ± 0.1 cm) were obtained from Zhanjiang Haiyi Aquatic Seed Co., Ltd., Zhanjiang City, China, and stocked in tanks at Guangdong Guanlida Ocean Biological Co., Ltd., Maoming City, Guangdong Province, China.

2.2. Production of Nitrifying Biofloc

Bioflocs were cultivated in three indoor tanks made of fibre-reinforced plastic, each with a capacity of 1000 L and a base area of 2 m2. The tanks were filled with 500 L of water under continuous aeration, and the following nutrients were then added: (NH4)2SO4 0.1 g, NaCl 0.03 g, FeSO4 0.03 g, KH2PO4 0.05 g, MgSO4 0.03 g, MnSO4 0.01 g, NaCO3 0.1 g, K2HPO4 0.05 g, NaNO2 0.1 g, feed 0.2 g, and 1000 mL water. Nitrifying, photosynthetic, and effective microorganisms bacteria were used as the strains for biofloc domestication (purchased from Guangzhou Xin Hai li sheng Biotechnology Co., Ltd., Guangzhou, China).
Sucrose was added to the experimental setup to ensure a carbon/nitrogen ratio of 12:1. Quantitative assessments of TAN, NO2-N, NO3-N, and the biofloc biomass volume were conducted daily. The observed increase in the NO3-N concentrations, concomitant with the decreases in TAN and NO2-N levels, served as an indicator of the onset of the nitrification process.

2.3. Experimental Design

The experiment included two groups with three replicates each: one group was treated with bioflocs and zero water exchange (Group ZC), and the other group was treated with clean water exchange daily (Group C). Prior to the experiment, brackish water (15 ppt) was introduced into each tank and disinfected with trichloroisocyanuric acid at a concentration of 15 ppm. Following the elimination of residual chlorine, P. monodon individuals were introduced into culture tanks at a density of 200 individuals per cubic metre (0.2 individuals per litre), with each tank exhibiting a diameter of 7.0 m and a depth of 1.5 m. Subsequently, P. monodon was cultivated for a period of 120 days. Continuous aeration was provided to all tanks using a roots blower (Jinan Xu’s Precision Engineering Co., Ltd., Jinan, China) with a power rating of 7.5 kW. In the experiment, the feeding strategy for P. monodon was as follows: at body lengths of less than 1 cm, 1–3 cm, 3–7 cm, 7–10 cm, and greater than 10 cm, the feeding amounts were 10%, 8.0%, 4.0%, 3.5%, and 3% of the body weight, respectively, with commercial feed (moisture, 12.0%; crude protein, 45%; crude fat, 9.0%; ash, 15.0%; crude fibre, 4.5%) four times daily.

2.3.1. Description of the Zero Water Exchange Systems

Three days before stocking, feed and sucrose were supplied daily to fertilise the water, maintaining a constant C/N ratio of 15:1. Meanwhile, 20 L of mature nitrifying bioflocs was added daily. Following the stocking of P. monodon, a daily regimen of carbon-rich sucrose was administered to maintain a C/N ratio of 12:1. This management strategy was employed until the TAN levels decreased below 1.0 mg·L−1. Sucrose was added to maintain the C/N ratio at 6:1, and after NO2-N decreased below 1.0 mg·L−1, sucrose addition ceased. The water was not exchanged during the experiment.

2.3.2. Description of the Clear Water Systems

After stocking with P. monodon, the brackish water was exchanged daily to control the TAN and NO2-N below 1.0 mg·L−1. The water was treated by sand filtration, but no disinfection was performed before it was introduced into the tanks. Sucrose or probiotics were not added to the culture system during the experiments.

2.4. Water Quality, Biofloc Volume and Morphostructure

Temperature, dissolved oxygen, pH, and salinity were recorded daily at 08:30 h in every tank using a YSI Model 556 device (YSI Incorporated, Yellow Springs, OH, USA). Weekly analyses in each tank included measurements of TAN, NO2-N, NO3-N, orthophosphate (PO43−), total nitrogen (TN), total phosphorus (TP), total suspended solids (TSSs), and chemical oxygen demand (COD). The mass concentrations of TAN, NO2-N, NO3-N, PO43−, TN, TP, and TSS were determined using the indophenol blue, diazo-diazo photometric, zinc-cadmium reduction, phosphomolybdic blue spectrophotometry, persulfate potassium oxidation, and persulfate potassium oxidation methods, respectively. The weight difference was calculated and the TSSs were estimated. Alkalinity was measured following procedure 2320 B of the APHA. Sodium bicarbonate or sodium carbonate was added to maintain the alkalinity above 150 mg CaCO3 L−1, and the COD was determined using the alkaline potassium permanganate method [22].
The biofloc volume (BFV) was assessed weekly by collecting 1000 mL of water and transferring it to multiple Imhoff cones at 10:00 a.m. The floc plug volume settling at the base of the cone was measured after a 30 min settling period. Subsequently, the floc plug was extracted using a turn knob located at the bottom tip of the cone, and its morphology was analysed under a biological microscope (BX51, Olympus Corporation, Tokyo, Japan).

2.5. Microbial Sampling, DNA Extraction and qPCR Analysis

For microbial analysis, culture water containing the bioflocs was collected from each tank using sterile bottles at three time points during the trial: day 0 (initial phase), day 60 (midpoint), and day 120 (final phase). A 200 mL portion of the collected water was promptly passed through a polycarbonate membrane filter with a pore size of 0.2 µm (Millipore Corporation, Billerica, MA, USA) to isolate the bioflocs. Microbial DNA was subsequently extracted from the biofloc samples using the E.Z.N.A.® Soil DNA Kit (Omega Bio-tek, Norcross, GA, USA) following the manufacturer’s instructions. DNA concentration and quality were assessed using a Nanodrop 2000 spectrophotometer (NanoDrop Technologies, Wilmington, DE, USA), and the DNA was preserved at −20 °C for subsequent analysis. The V4 region of the 16S rRNA gene was amplified utilising the primers 515F (5′-GTGYCAGCMGCCGCGGTAA-3′) and 907R (5′-GGACTCANVGGG TWTCTAAT-3′) [23]. Sequencing was performed using an Illumina MiSeq platform (Illumina, Inc., San Diego, CA, USA) by Hangzhou Mingke Bio Co., Ltd. (Hangzhou, China). Raw sequencing data were processed and analysed using Quantitative Insights into Microbial Ecology (QIIME) version 1.9.1, with quality filtering and chimaera elimination performed using USEARCH software. The remaining sequences were grouped into operational taxonomic units based on a 97% sequence similarity threshold using the pick_open_reference_otus.py script. Alpha diversity indices were calculated using QIIME 1.9.1, and the coefficient of variation was determined by dividing the standard deviation by the group mean. Non-metric multidimensional scaling employing Bray–Curtis dissimilarity metrics was used to analyse the relationships among bacterial abundances across different rearing periods. The microbial community composition was visualised using bar plots. Significant differences in microbial abundance (p < 0.05) across samples were identified through a one-way analysis of variance (ANOVA) performed using SPSS (v17.0), with 26 degrees of freedom.

2.6. P. monodon Growth Performance

The body weight and length of P. monodon were measured every seven days during the culture period. Thirty P. monodon individuals were randomly collected from each culture pond, body mass and length were measured using an electronic balance and Vernier calliper, respectively, and the final weight and final length were recorded. The hepatopancreas of five shrimp from each tank were collected and preserved in RNAlater and sterile saline solutions for measurement.
The weight gain, FCR, specific growth rate of weight gain (SGR), and survival rate (SR) were calculated as follows:
W G = W t W 0
S R = N t N 0 × 100
S G R = l n W t l n W 0 t × 100
F C R = f e e d c o n s u m e d W t W 0
W a t e r   u s a g e = v o l u m e w a t e r s h r i m p y i e l d
where W0 is the initial weight of P. monodon; Wt is the weight of P. monodon at the end of the culture period; and Nt and N0 are the initial and end-of-culture numbers of P. monodon.

2.7. Analysis of Digestive Enzymes and Antioxidant Enzyme

The P. monodon hepatopancreas was weighed and thoroughly homogenised in chilled sterile saline solution using a handheld glass homogeniser under ice-cold conditions. The resulting homogenate was subjected to centrifugation at 5000 rpm (3000× g) for 20 min at 4 °C using an Eppendorf centrifuge (Eppendorf AG, Hamburg, Germany). Following centrifugation, the lipid layer floating on top was carefully removed, and the supernatant was portioned into aliquots, which were then transferred to 1.5 mL Eppendorf tubes. The activities of digestive and antioxidant enzymes were analysed using commercial assay kits provided by the Nanjing Jiancheng Institute (Nanjing, China) following the manufacturer’s protocols. Amylase activity was assessed based on the method described by Robyt and Whelan [24] using soluble starch as a substrate. One unit of amylase activity was defined as the amount required to hydrolyse 10 mg of starch within 30 min at 37 °C. The lipase activity was measured using the procedure described by Winkler and Stuckman [25] and defined as the amount of enzyme required to release 1 μmol of p-nitrophenyl palmitate from its substrate per minute at 37 °C. Trypsin activity was assayed using Na-benzoyl-DL-arginine-p-nitroanilide as a substrate [26]. Trypsin activity was quantified as the amount of enzyme needed to release 1 μmol of nitroanilide from the substrate within 1 min at 37 °C. The soluble protein concentration was measured in diluted homogenates following the Bradford method [27] using bovine serum albumin as the standard. Trypsin and lipase activities are reported as specific activities in units per gram of protein (U g⁻1), while amylase activity is expressed in units per milligram of protein (U mg⁻1).
Superoxide dismutase (SOD) activity was evaluated based on its capacity to inhibit superoxide anions production by the xanthine–xanthine oxidase reaction system. One unit of SOD activity was defined as the amount of enzyme required to achieve a 50% inhibition rate in a 1 mL reaction mixture (U mL⁻1). Catalase (CAT) activity was measured using assay kits, with one unit of CAT activity defined as the quantity of enzyme catalysing the breakdown of 1 µmol of H₂O₂ per second (U mL⁻1).
Acid phosphatase (ACP) activity was assessed using disodium phenyl phosphate as the substrate and chemical detection kits provided by the Nanjing Jiancheng Bioengineering Institute (China). A single unit of ACP activity was defined as the amount of enzyme necessary to generate 1 µmol of phenol per minute (U mL⁻1).

2.8. RNA Extraction and Gene Expression

Total RNA was isolated using TRIzol reagent (Life Technology, Carlsbad, CA, USA) according to the manufacturer’s protocols. RNA integrity was evaluated by electrophoresis on 1.2% denaturing agarose gels, and RNA concentration and purity were determined using a NanoDrop 2000 spectrophotometer (NanoDrop Technologies Inc., Wilmington, DE, USA). Following this, first-strand cDNA was generated using the PrimeScript™ 200 RT Reagent Kit (TaKaRa, Kusatsu, Shiga, Japan) in accordance with the instructions provided by the manufacturer. Next, the real-time quantitative PCR (RT-qPCR) system was 10 μL and established using the TaKaRa kit, and quantitative fluorescence determination of gene expression was performed in accordance with the LightCycler/LightCycler480 System operating method. The reaction programme was 95 °C pre-denaturation for 30 s, 95 °C for 5 s, and 60 °C for 30 s, for a total of 40 cycles. The relative expression levels of the target gene were calculated using the 2−∆∆Ct method, normalised to an internal reference gene, and compared with the control group. The housekeeping gene 18S rRNA served as a reference, and all gene-specific primers utilised in this study were designed using Primer Express 2.0 (Table 1).

2.9. Statistical Analysis

Data were statistically analysed using SPSS software (version 17.0; SPSS Inc., Chicago, IL, USA). Prior to conducting the analyses, normality was assessed using probability plots, and Levene’s test was conducted to evaluate the homogeneity of variances. For variables involving comparisons between two groups, the Student’s t-test was used to determine significant differences (p < 0.05). Additionally, a two-way ANOVA was performed to assess the interaction effects between groups and sampling times. When significant main effects were identified, Tukey’s test was conducted for post hoc multiple comparisons. Probability levels of 95% and 99% were considered statistically significant.

3. Results

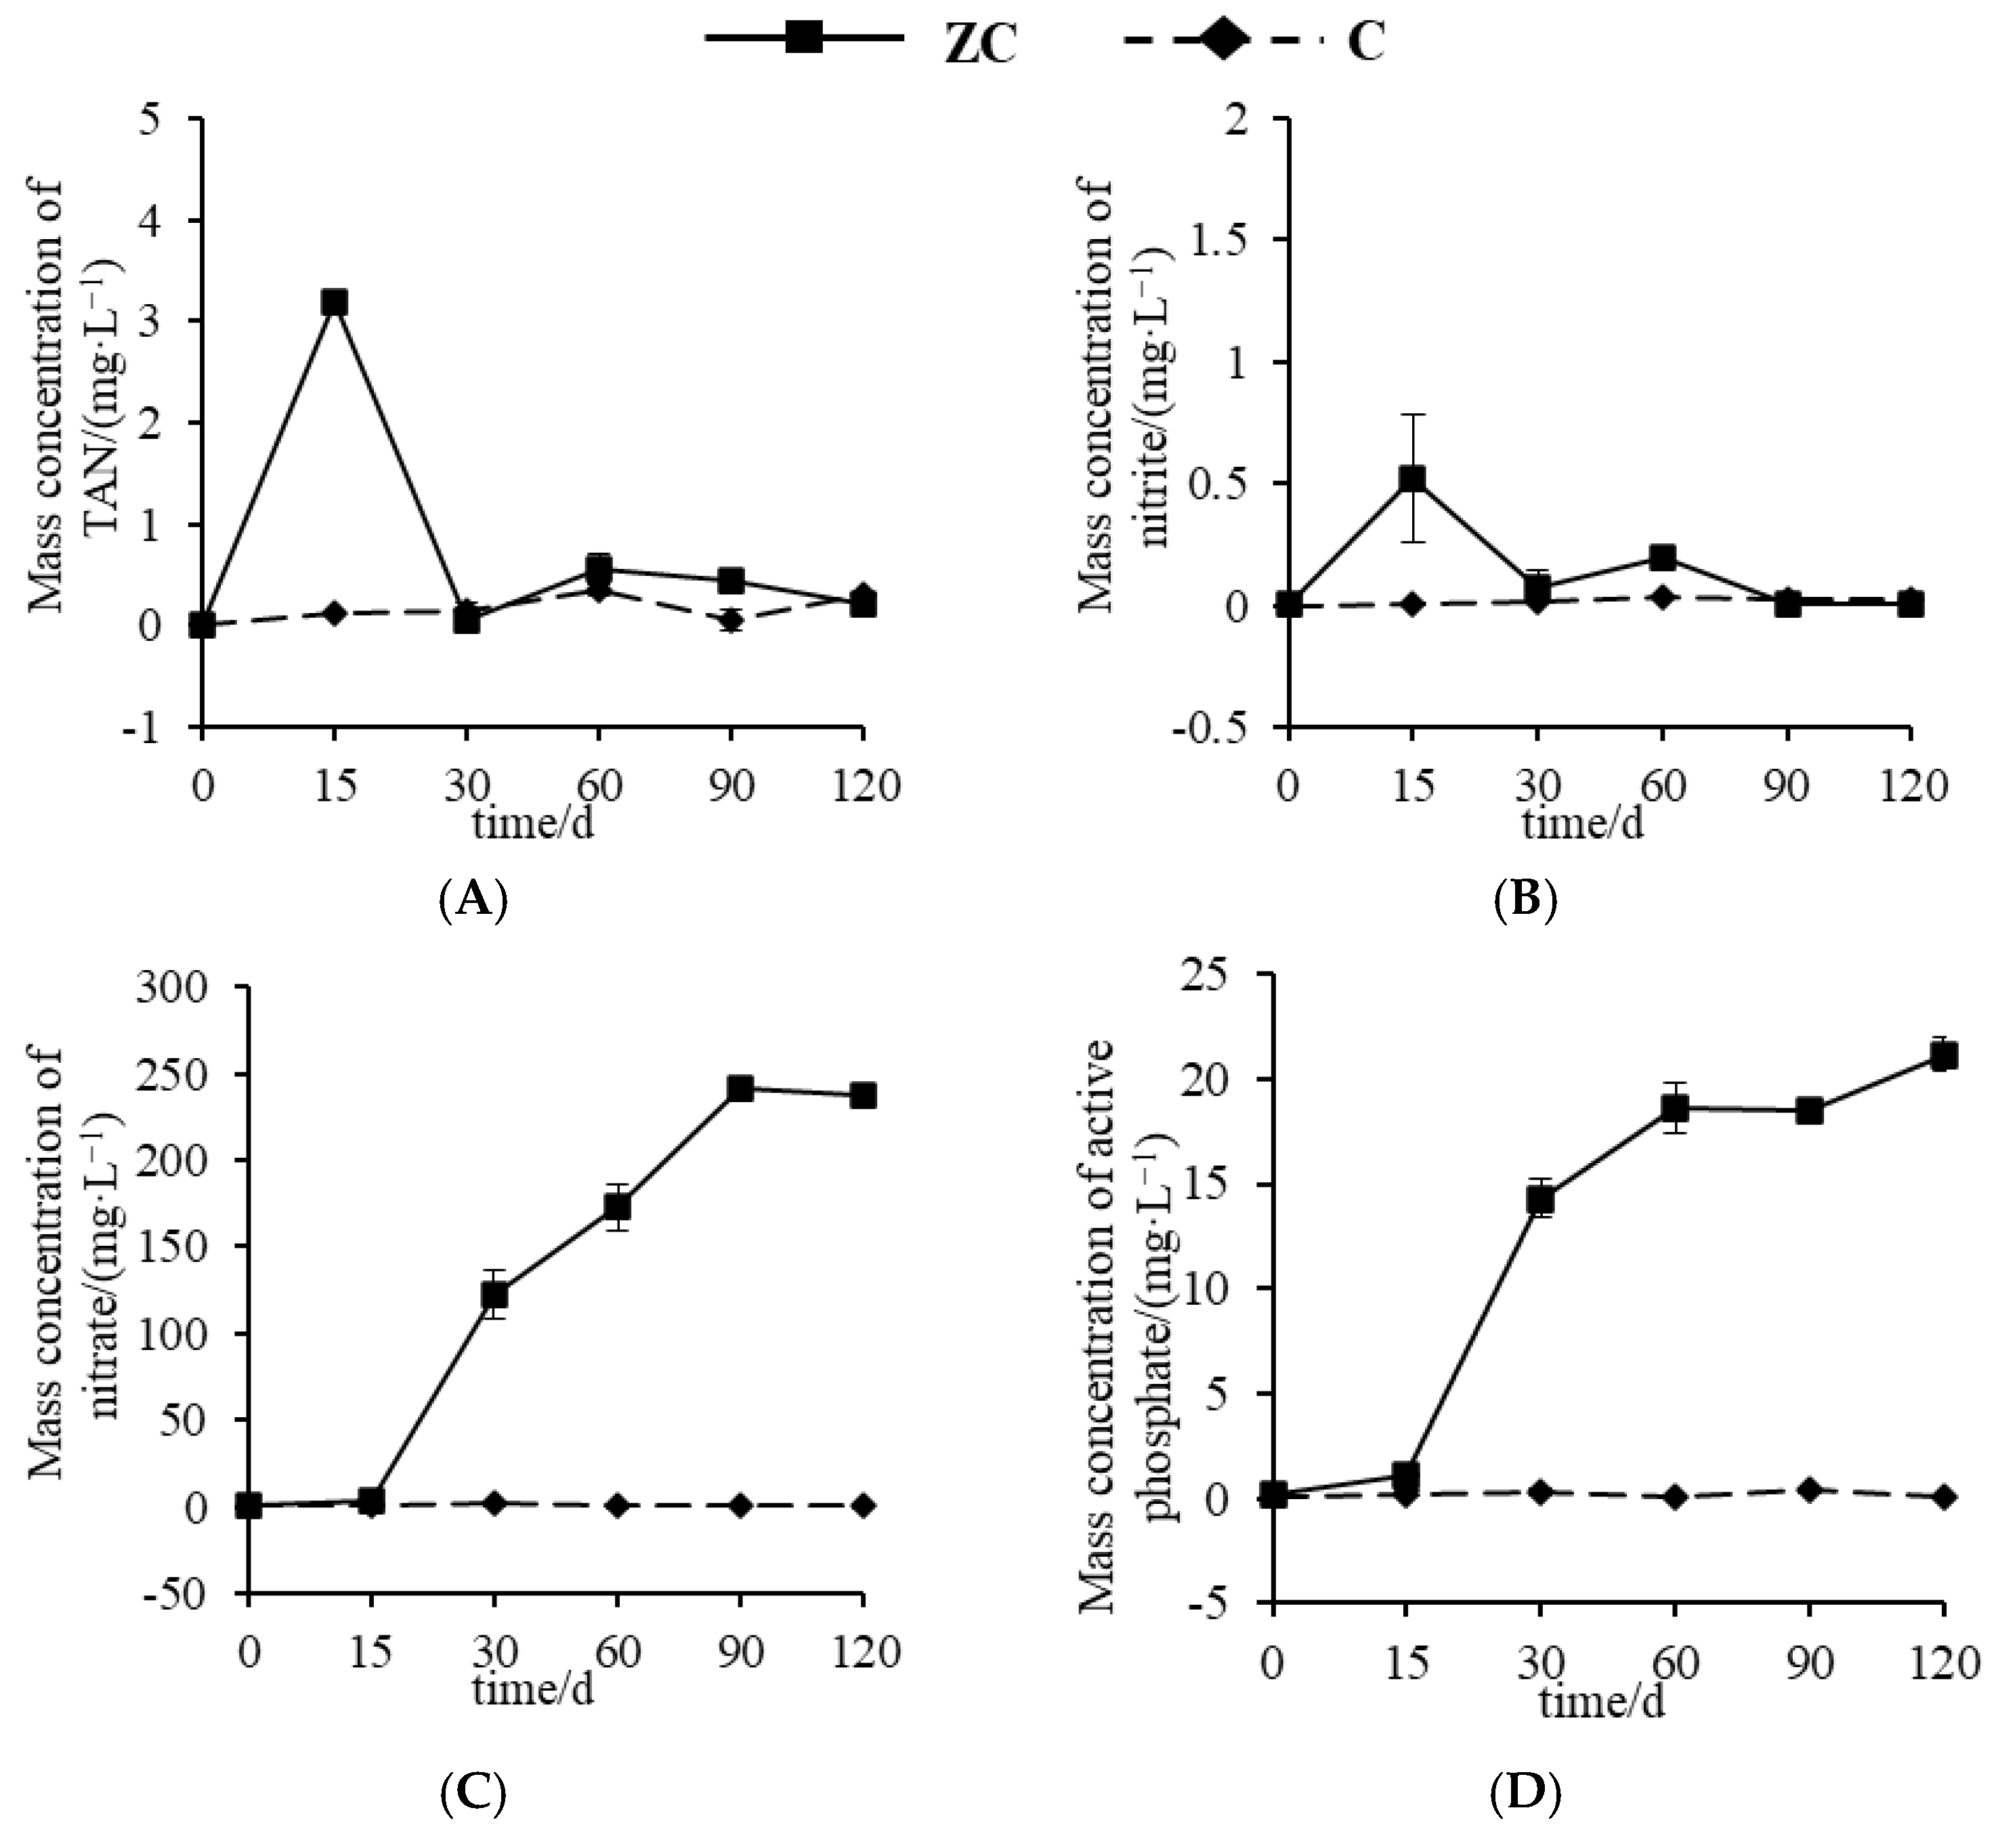
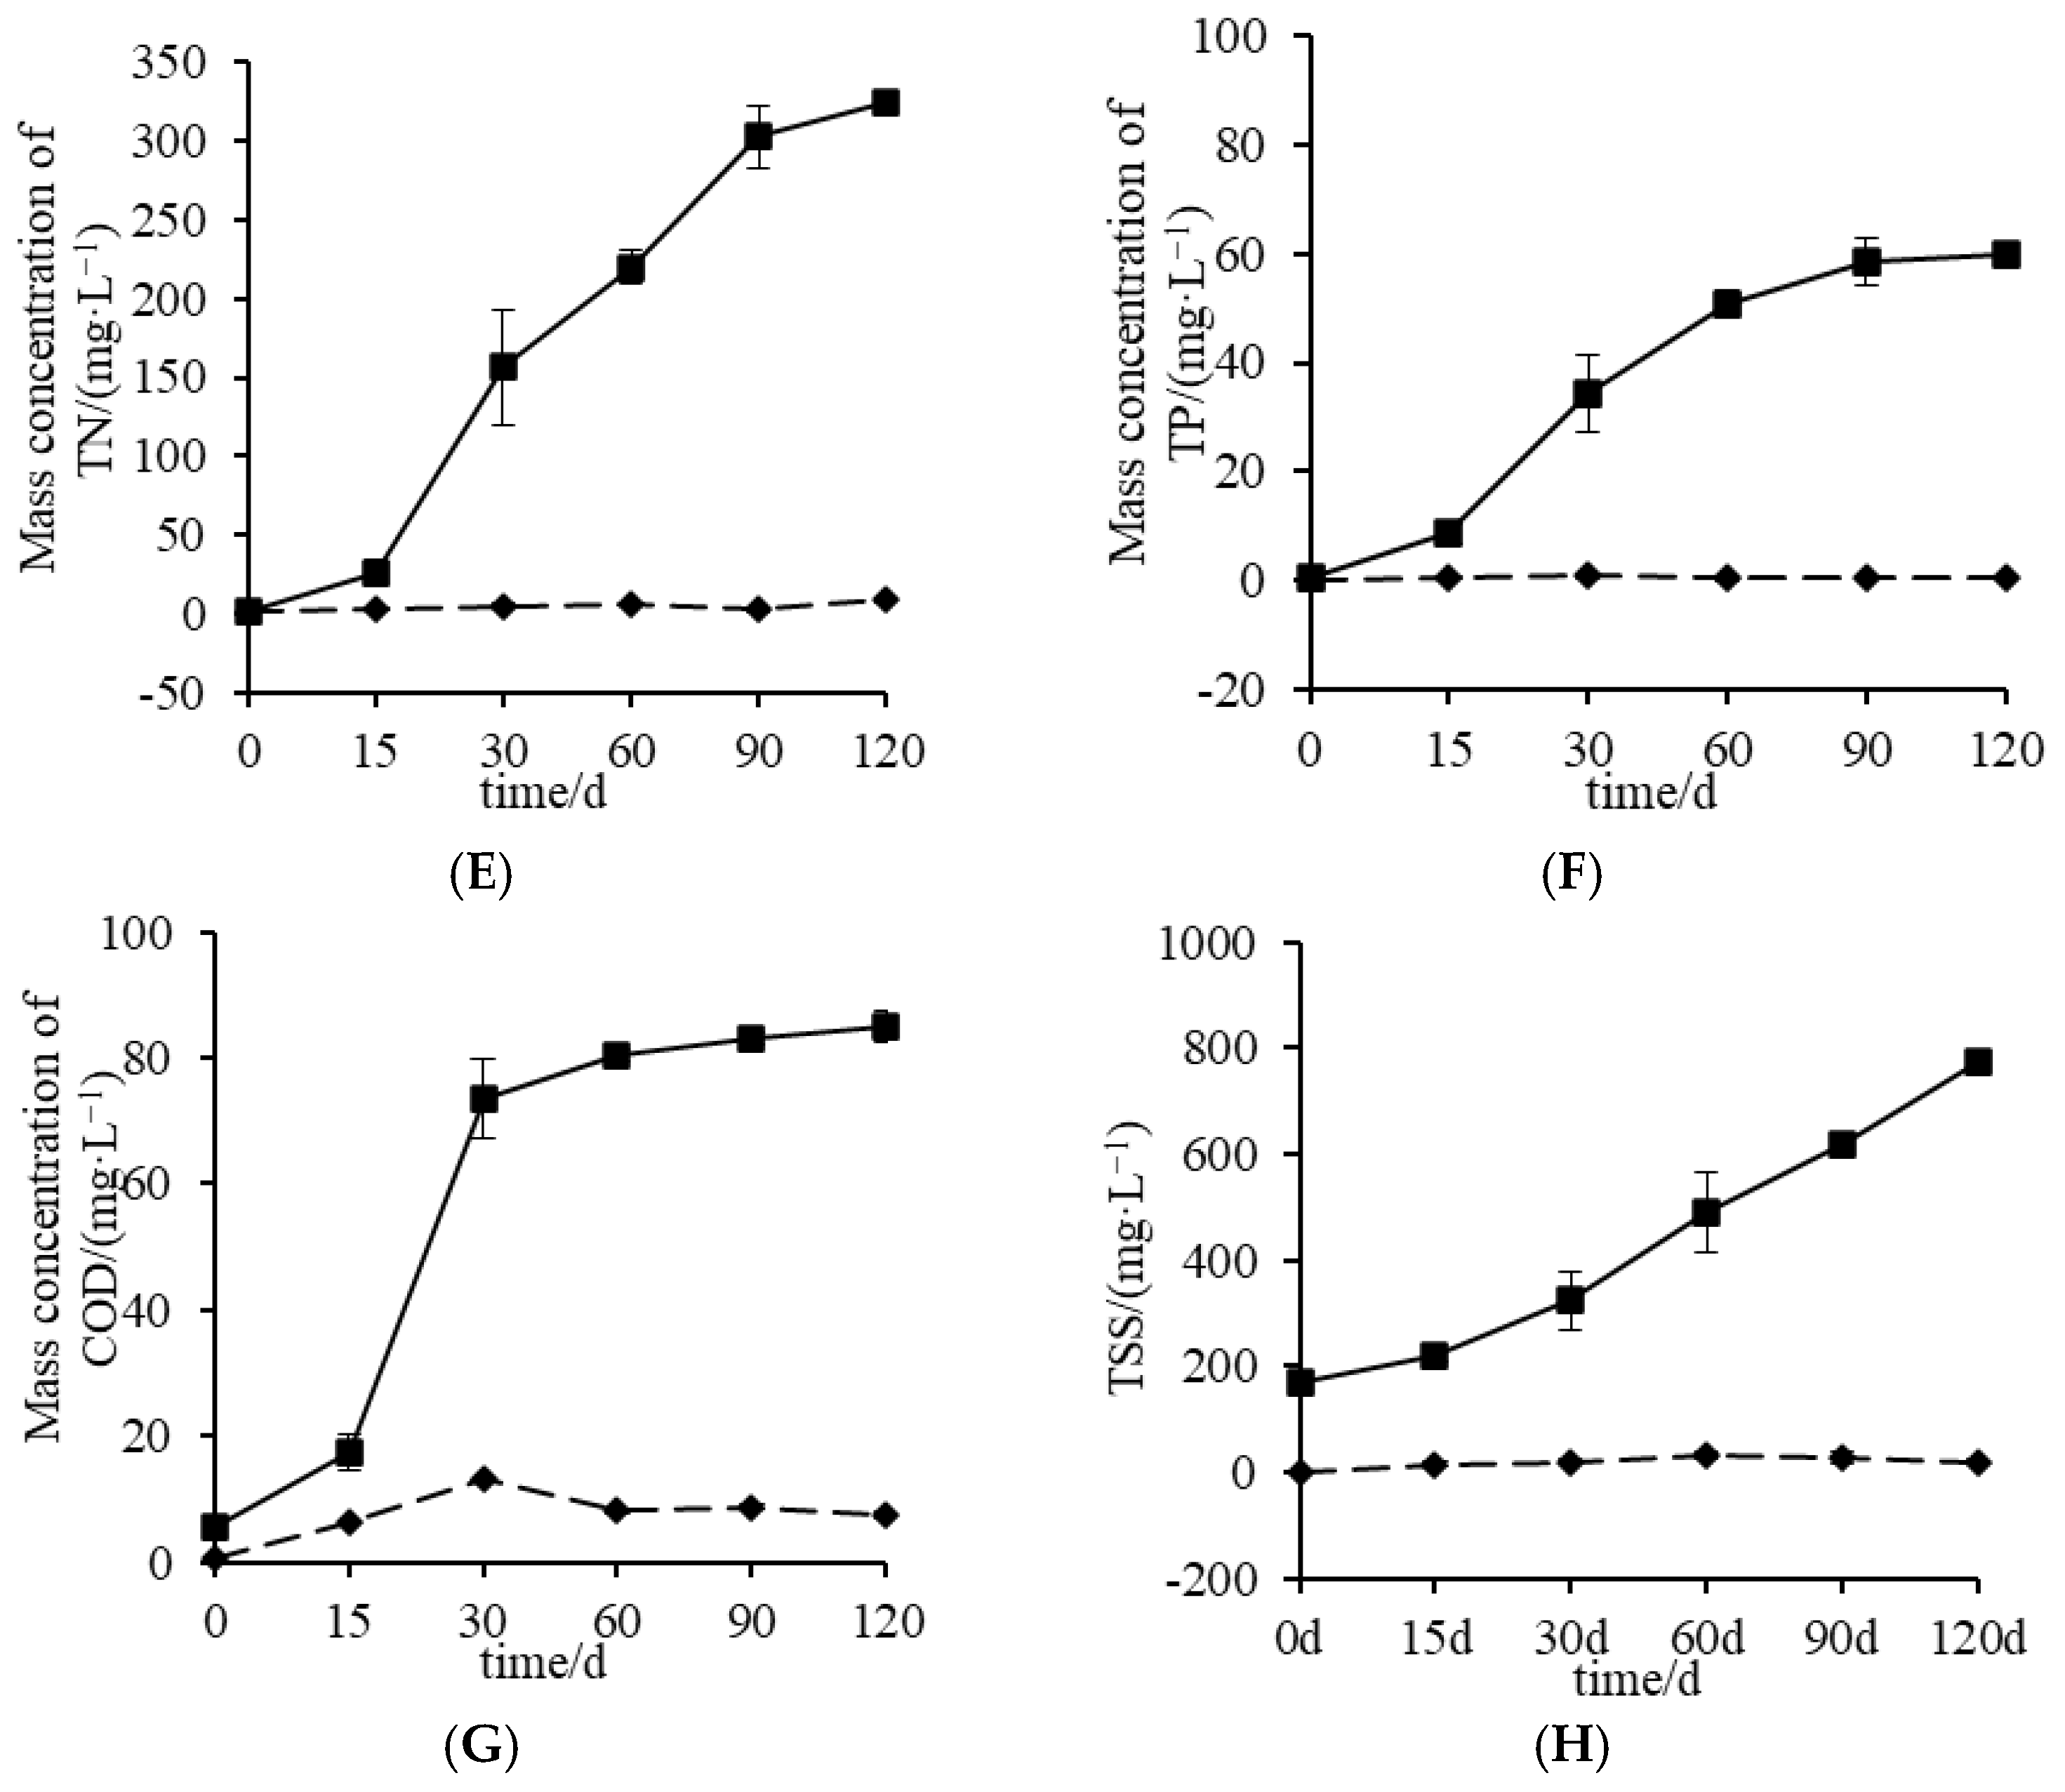
3.1. Characteristics of Water Environmental Factors in P. monodon Culture

The features and variation trends of the water quality factors are summarised in Table 2 and Figure 1. The temperatures in Group ZC and C tanks were approximately 26.98 and 26.11 °C, respectively. pH differed by 0.4 between the two groups. The pH values in Group ZC tanks decreased over the culture period and were thus maintained above 7.6 by adding sodium carbonate and sodium bicarbonate. The DO during the culture period remained above 5.0 mg·L−1 in each tank, but the value in Group ZC tanks was lower than that in Group C tanks. In Group ZC, salinity increased from 14 to 18 over the culture period, while it varied with water exchange in Group C.
The other environmental factors, including TAN, NO2-N, NO3-N, PO43−, TN, TP, COD and TSS, changed weakly and remained at a low level in Group C. However, in Group ZC, the TAN concentration peaked on day 15, at 3.2 mg·L−1, and then decreased rapidly to below 0.5 mg·L−1. Similarly, the TAN concentration peaked at 0.52 mg·L−1 on day 15 and then dropped quickly to 0.1 mg·L−1. The concentrations of NO3-N, PO43−, TN, TP, COD and TSS all persistently increased over the culture period and peaked on day 120 at 237.01, 21.15, 325.45, 59.87, 85.01, and 782 mg/L, respectively.

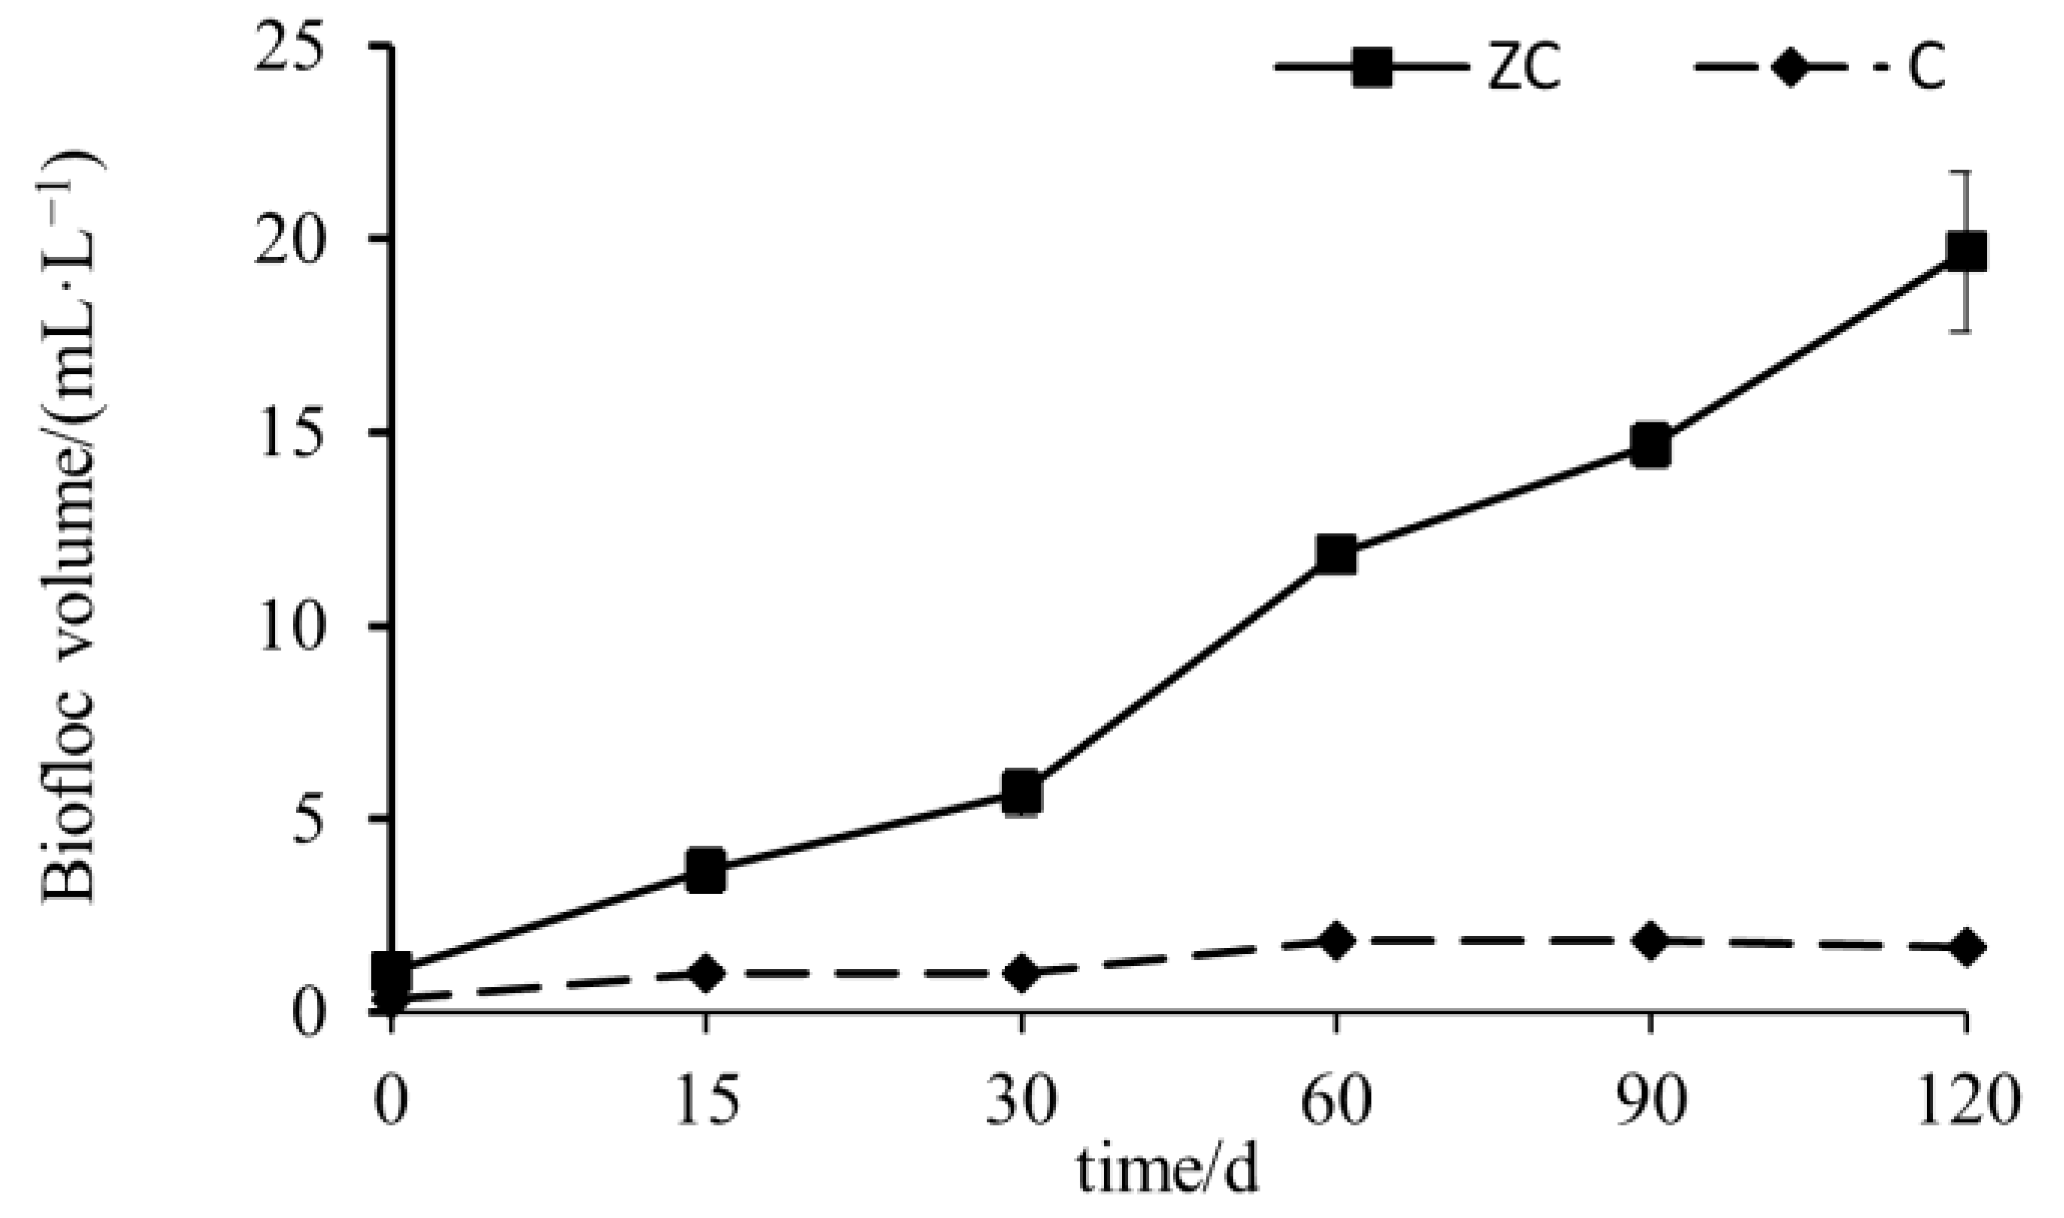
3.2. The Characteristics of Biofloc Volume Changes

As shown in Figure 2, the bioflocs in Group C exhibited no evident changes, and the floc volume remained below 2.0 mL·L−1. In Group ZC, the bioflocs grew rapidly. During the early stage, the floc size was small with a loose structure, and the volume was approximately 1.0 mL·L−1. During the middle and later stages of culturing, the floc size increased, and the structure became more compact. The volume of the flocs on Day 120 reached 19.6 mL·L−1.

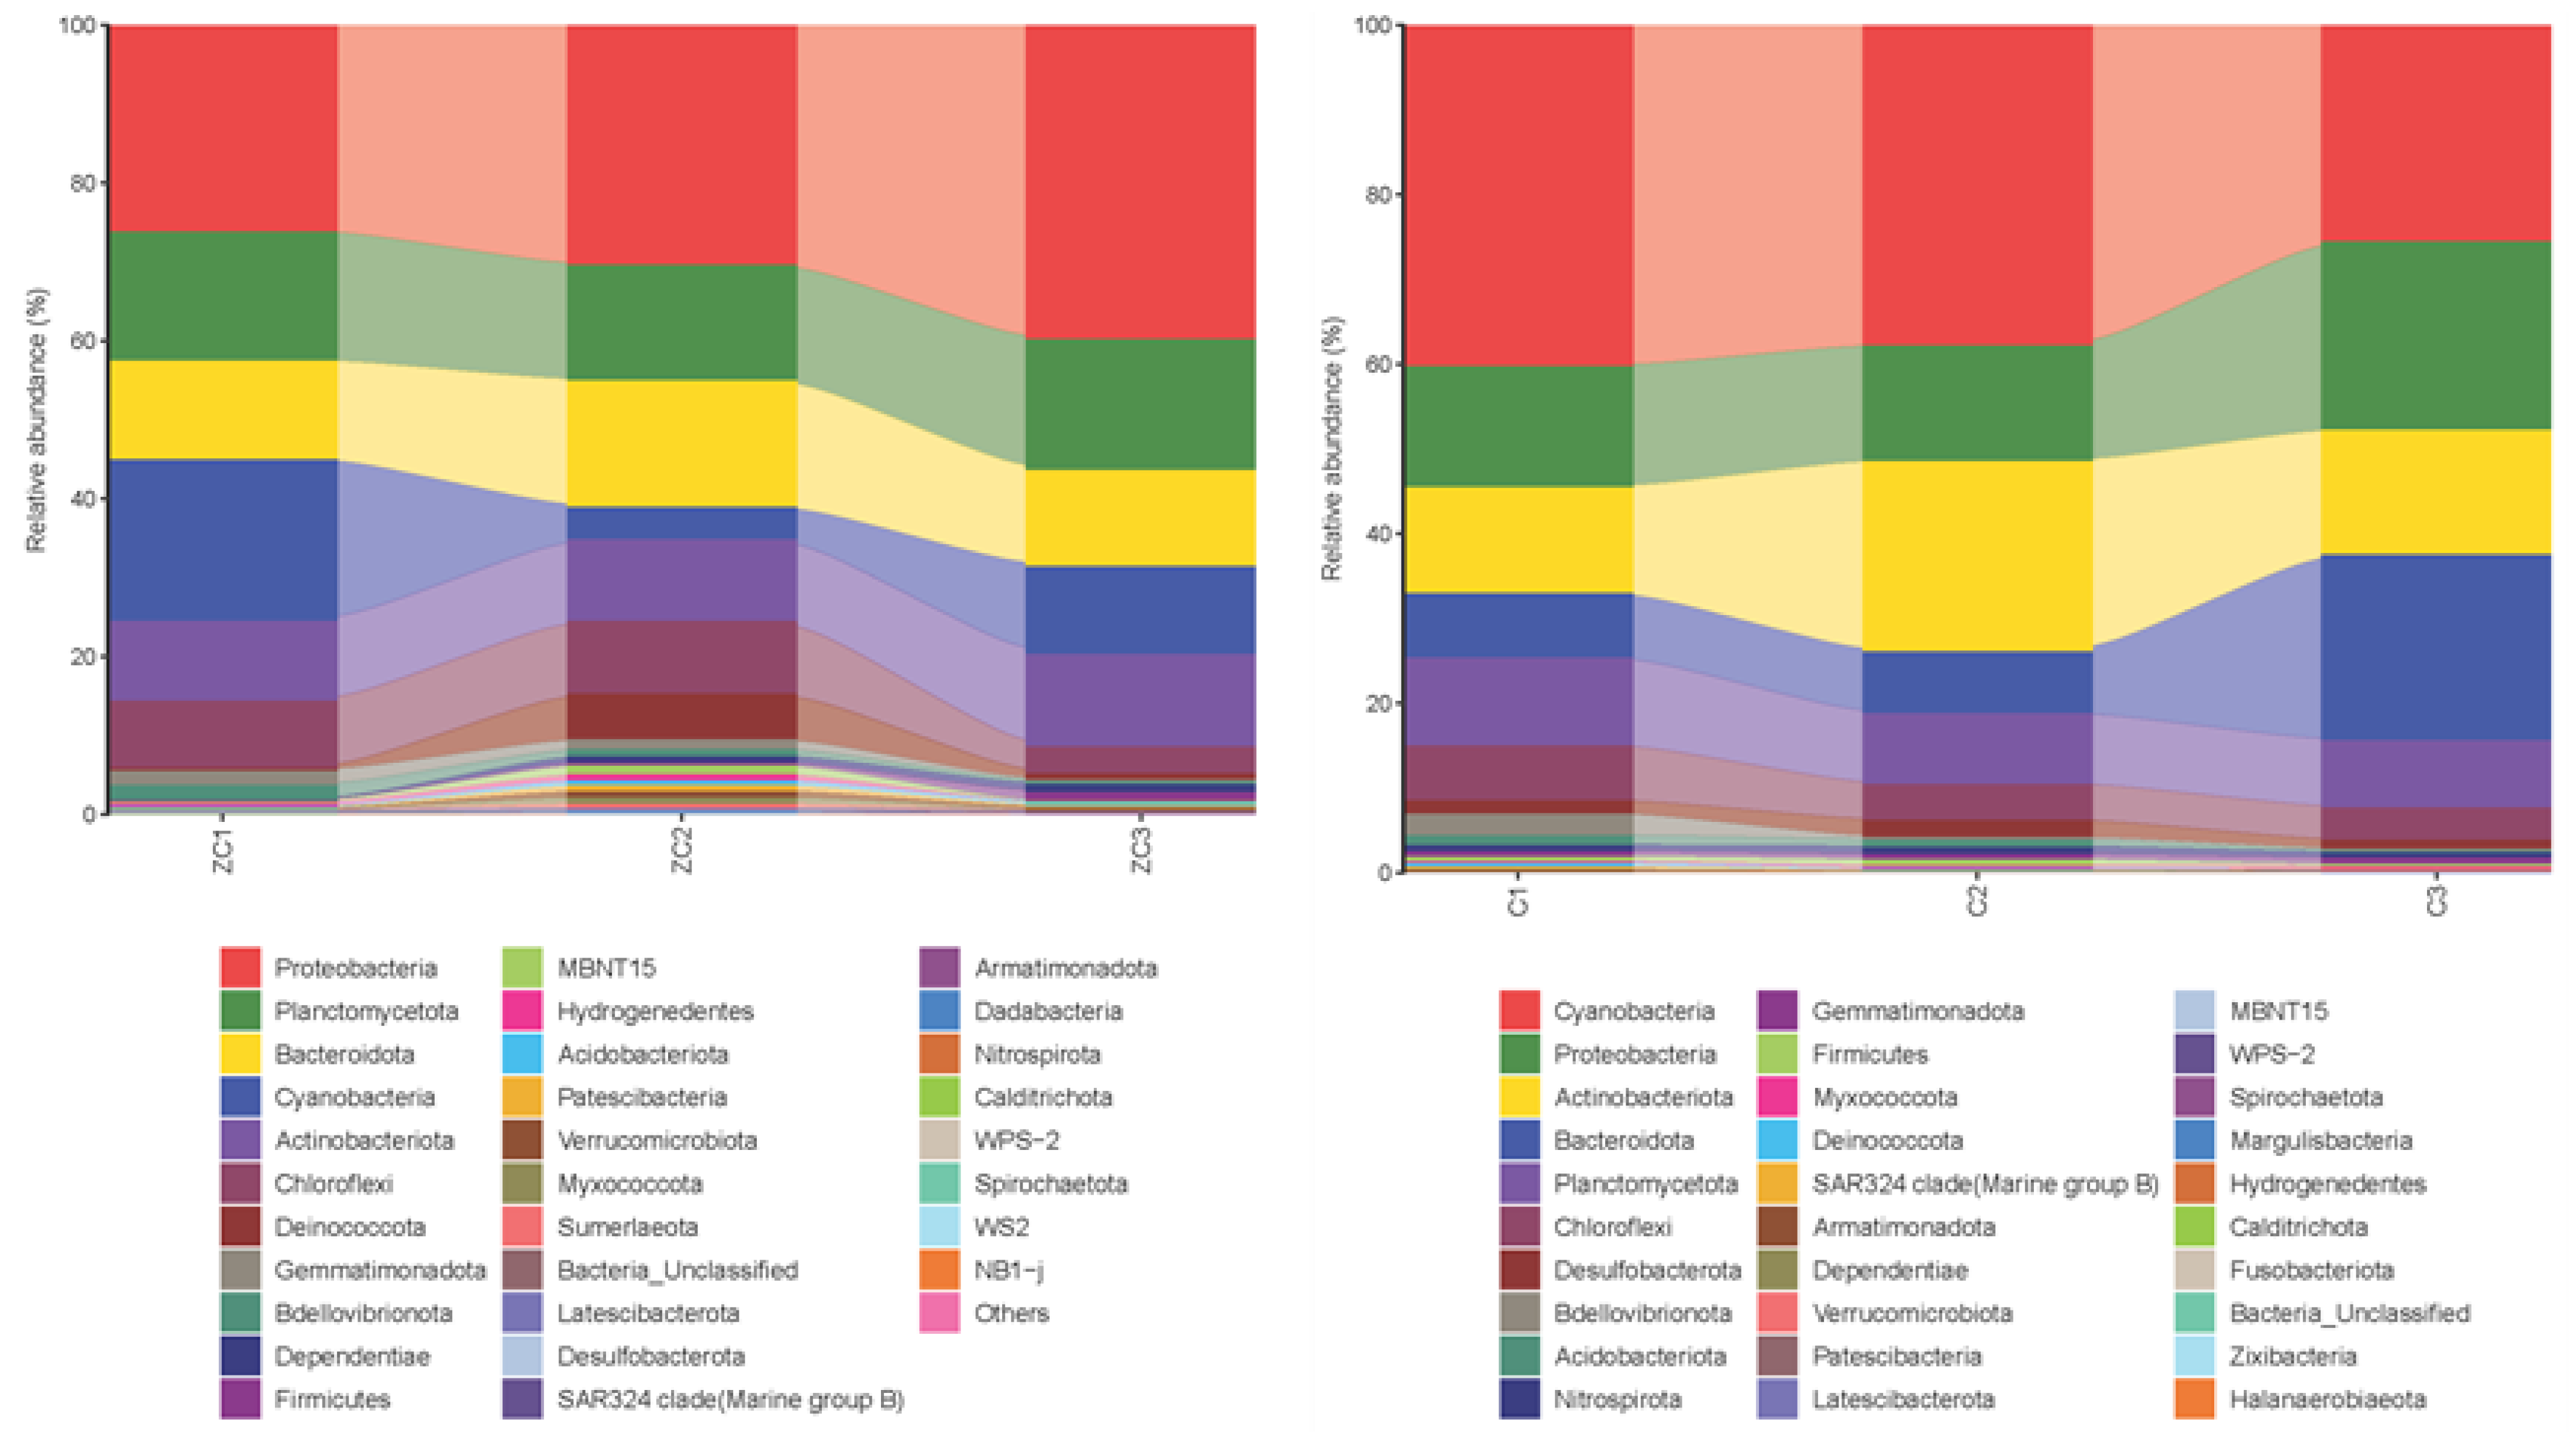
3.3. The Microbial Communities’ Diversity and Compositional Characteristics in P. monodon Farms

A total of 56,339 (C1, C2, and C3) and 61,458 (ZC1, ZC2, and ZC3) high-quality bacterial 16S rRNA gene sequences were obtained using Illumina sequencing in the water change and zero water change groups, and a total of 1152, 1171, 1180, 733, 768, and 675 amplicon sequence variants (ASVs) with 100% similarity threshold were generated in C1, C2, C3, ZC1, ZC2, and ZC3, respectively. The Chao1 and Shannon indices ranged from 672.942 to 1179.00 (C3 > C2 > C1 > ZC2 > ZC1 > ZC3) and 6.590 to 8.109 (C3 > C1 > C2 > ZC2 > ZC1 > ZC3), respectively. The Pielou evenness values ranged from 0.794 to 0.791 (C3 > C1 > C2 > ZC2 > ZC1 > ZC3). Good coverage exceeded 0.999, indicating that the sequencing results accurately represented the situation of the microorganisms in the sample. According to the results, the sequence values showed that more bacteria were present in Group ZC; however, the Chao1 and Shannon values indicated lower bacterial richness and diversity within Group ZC. These results suggest that biofloc cultivation could increase the bacterial count, and the addition of target bacteria may quickly build a competitive advantage and minimise the growth of other bacteria (Table 3).
In Group ZC, the dominant bacterial community throughout the entire culture period was Proteobacteria, with its relative abundance increasing from 26.04% at the beginning of the culture period (Figure 3) to 30.27% at 60 days, and finally to 39.75% at 120 days. The second-most-abundant community was Cyanobacteria. However, with the management practices of Group ZC, the relative abundance decreased from 20.48% at the start of the experiment to 11.15% at 120 days. By the end of the 120-day culture period, in Group ZC, the dominant communities were Proteobacteria (39.75%), Planctomycetota (16.58%), Bacteroidetes (12.09%), Actinobacteria (11.81%), and Cyanobacteria (11.15%), accounting for a total of 91.39%.
The dominant community in Group C throughout the culture period was Cyanobacteria. Its relative abundance decreased from 40.11% at the start to 37.72% at 60 days, and finally to 25.42% at 120 days. The second-most-abundant community in the water-change Group was Proteobacteria, with its relative abundance increasing from 14.33% at the start of the experiment to 22.27% at day 120. By the end of the 120 d culture period, in Group C, the dominant communities were Cyanobacteria (25.42%), Proteobacteria (22.27%), Bacteroidota (21.97%), Actinobacteriota (14.67%), and Planctomycetota (7.90%), totalling 92.23%.

3.4. The Growth Performance of P. monodon

The growth performance of P. monodon during the study period is summarised in Table 4. The final body weight of individuals in Group ZC (11.46 ± 0.61 g) was significantly higher than that of individuals in Group C (9.38 ± 0.12 g, p < 0.05). The FCR and SR were significantly different between the two Groups (p < 0.05). Group ZC demonstrated a significantly improved FCR of 1.90 ± 0.04, which was notably lower compared with that of Group C (3.44 ± 0.35). Similarly, significantly higher SR (75.90 ± 2.50) was observed in Group ZC compared with that in Group C (35.76 ± 4.83). Additionally, the unit yield of Group ZC (1.31 ± 0.03 kg m−3) was higher than that of Group C (0.15 ± 0.01 kg m−3) (p < 0.05). However, significantly lower water consumption (0.98 ± 0.02 m3 kg−1) was observed in Group ZC compared with that in Group C (16.02 ± 1.63 m3 kg−1).

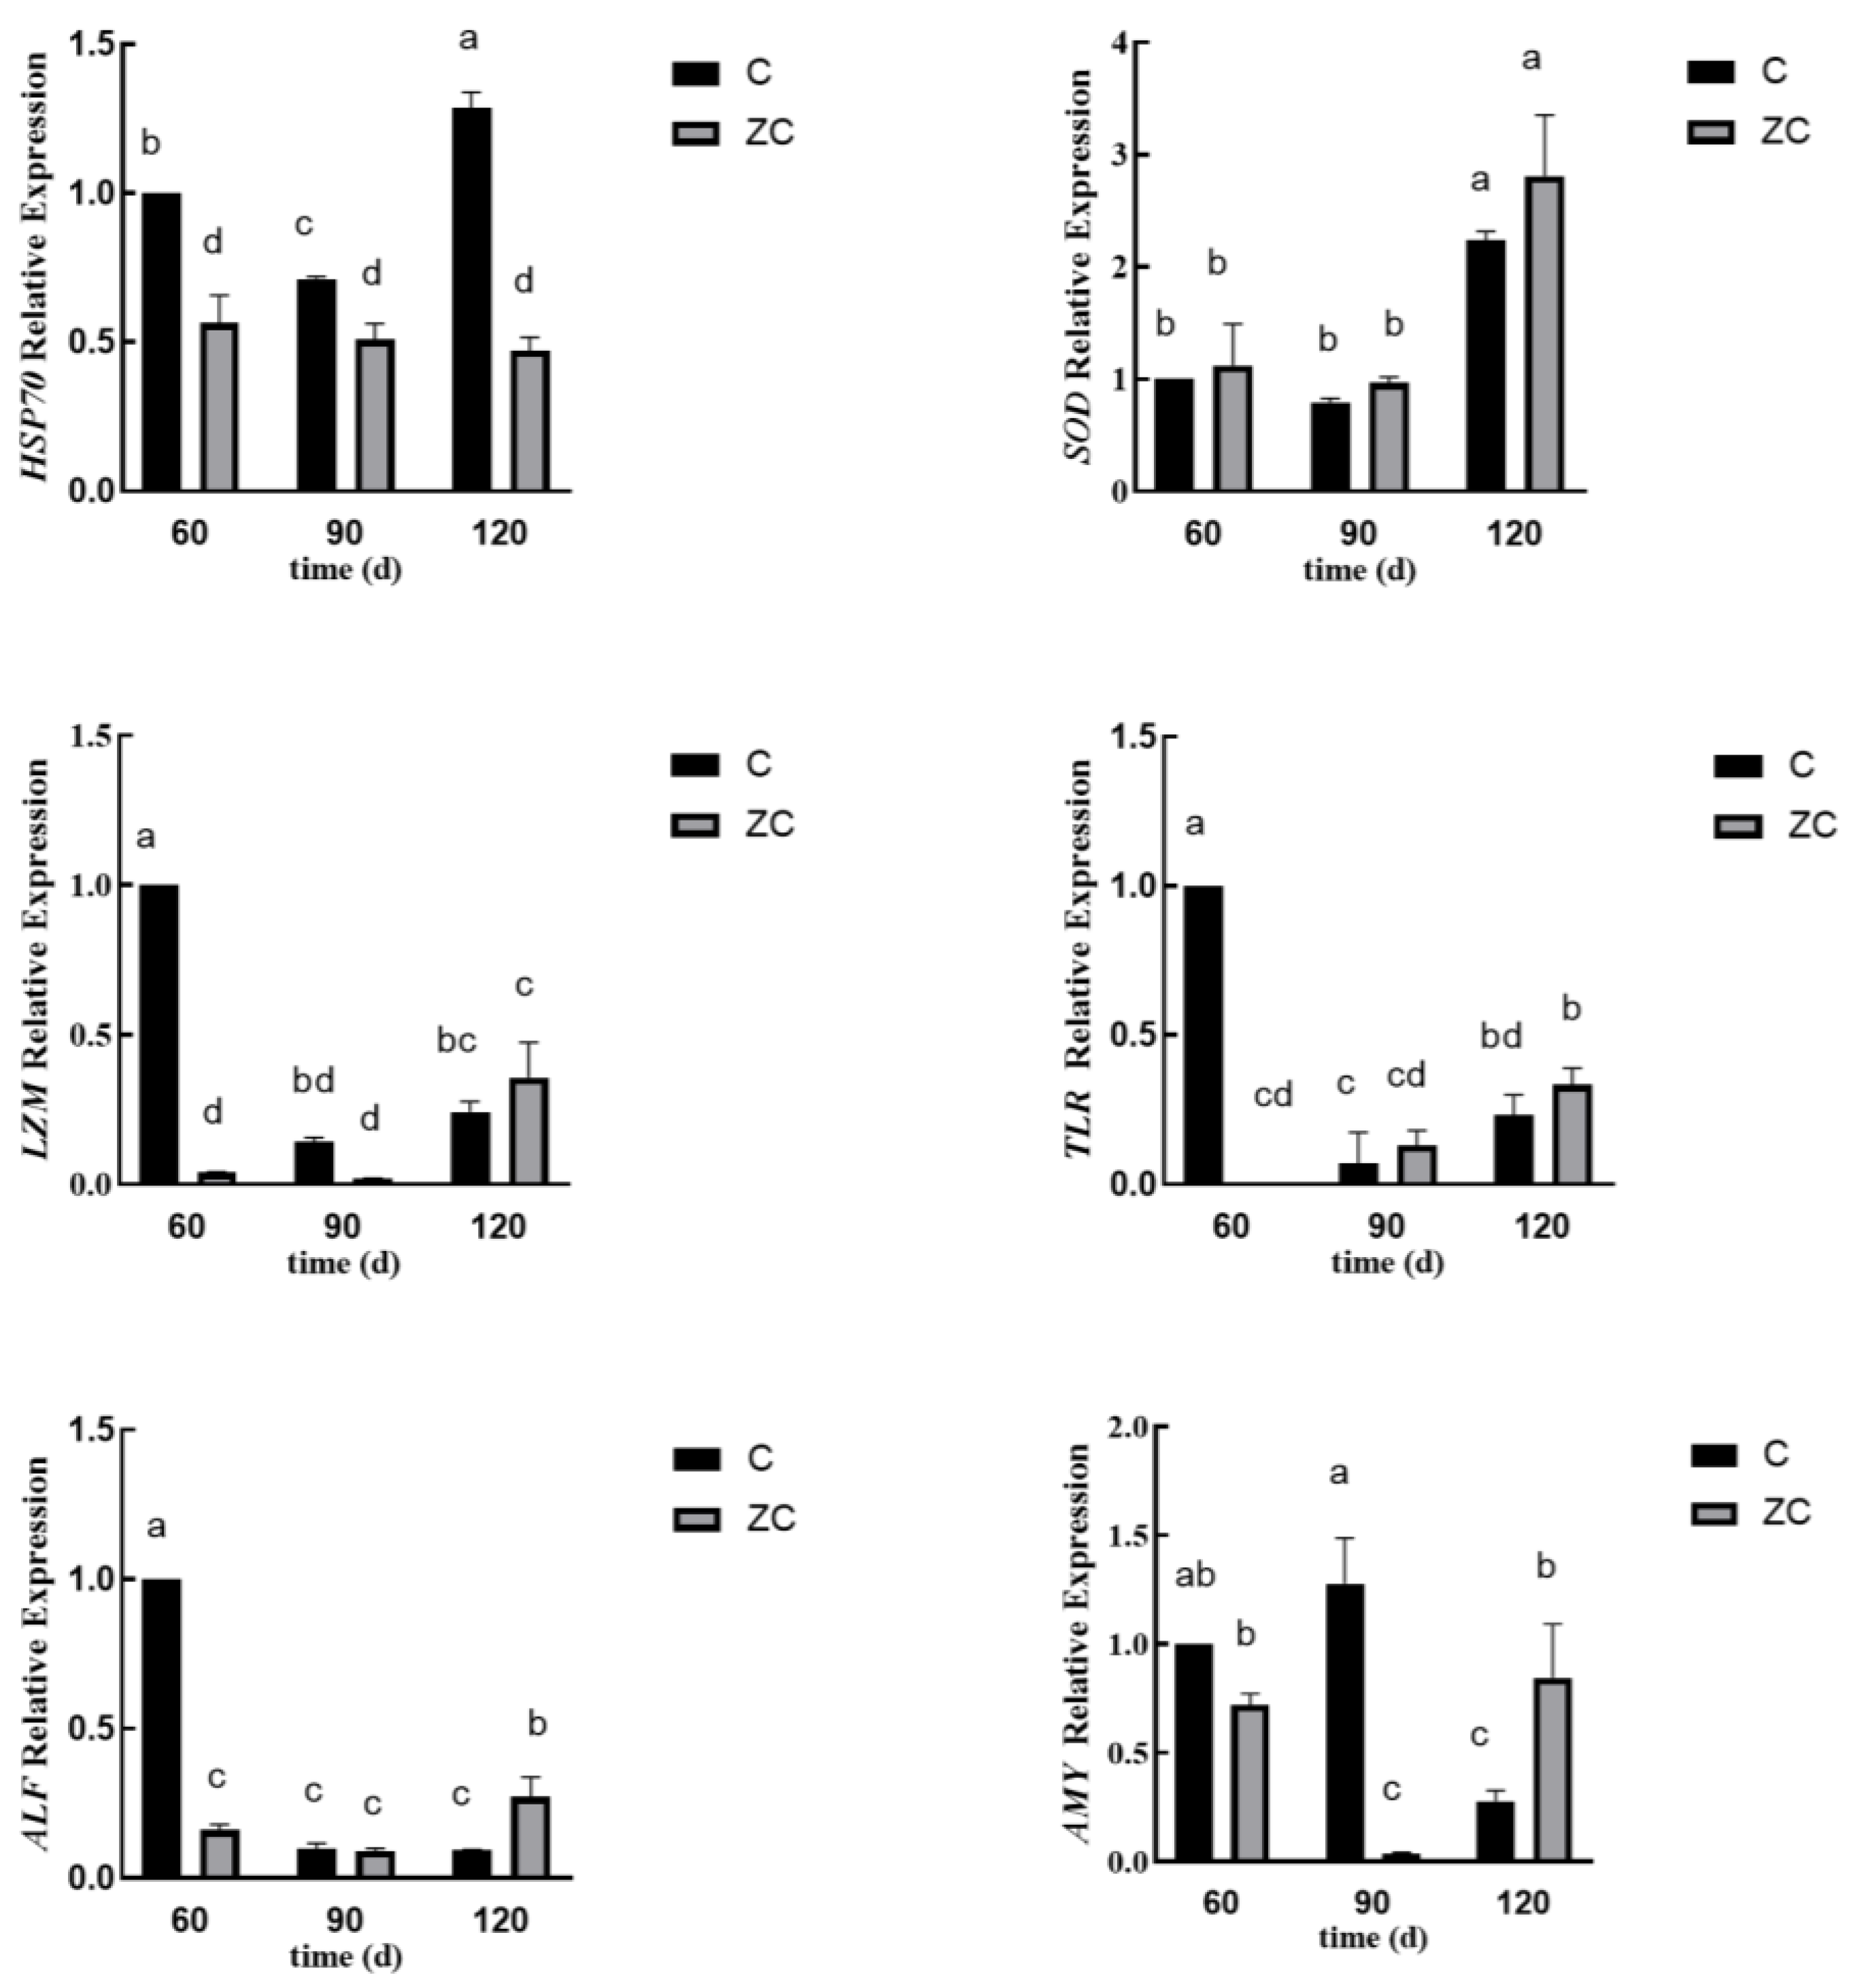
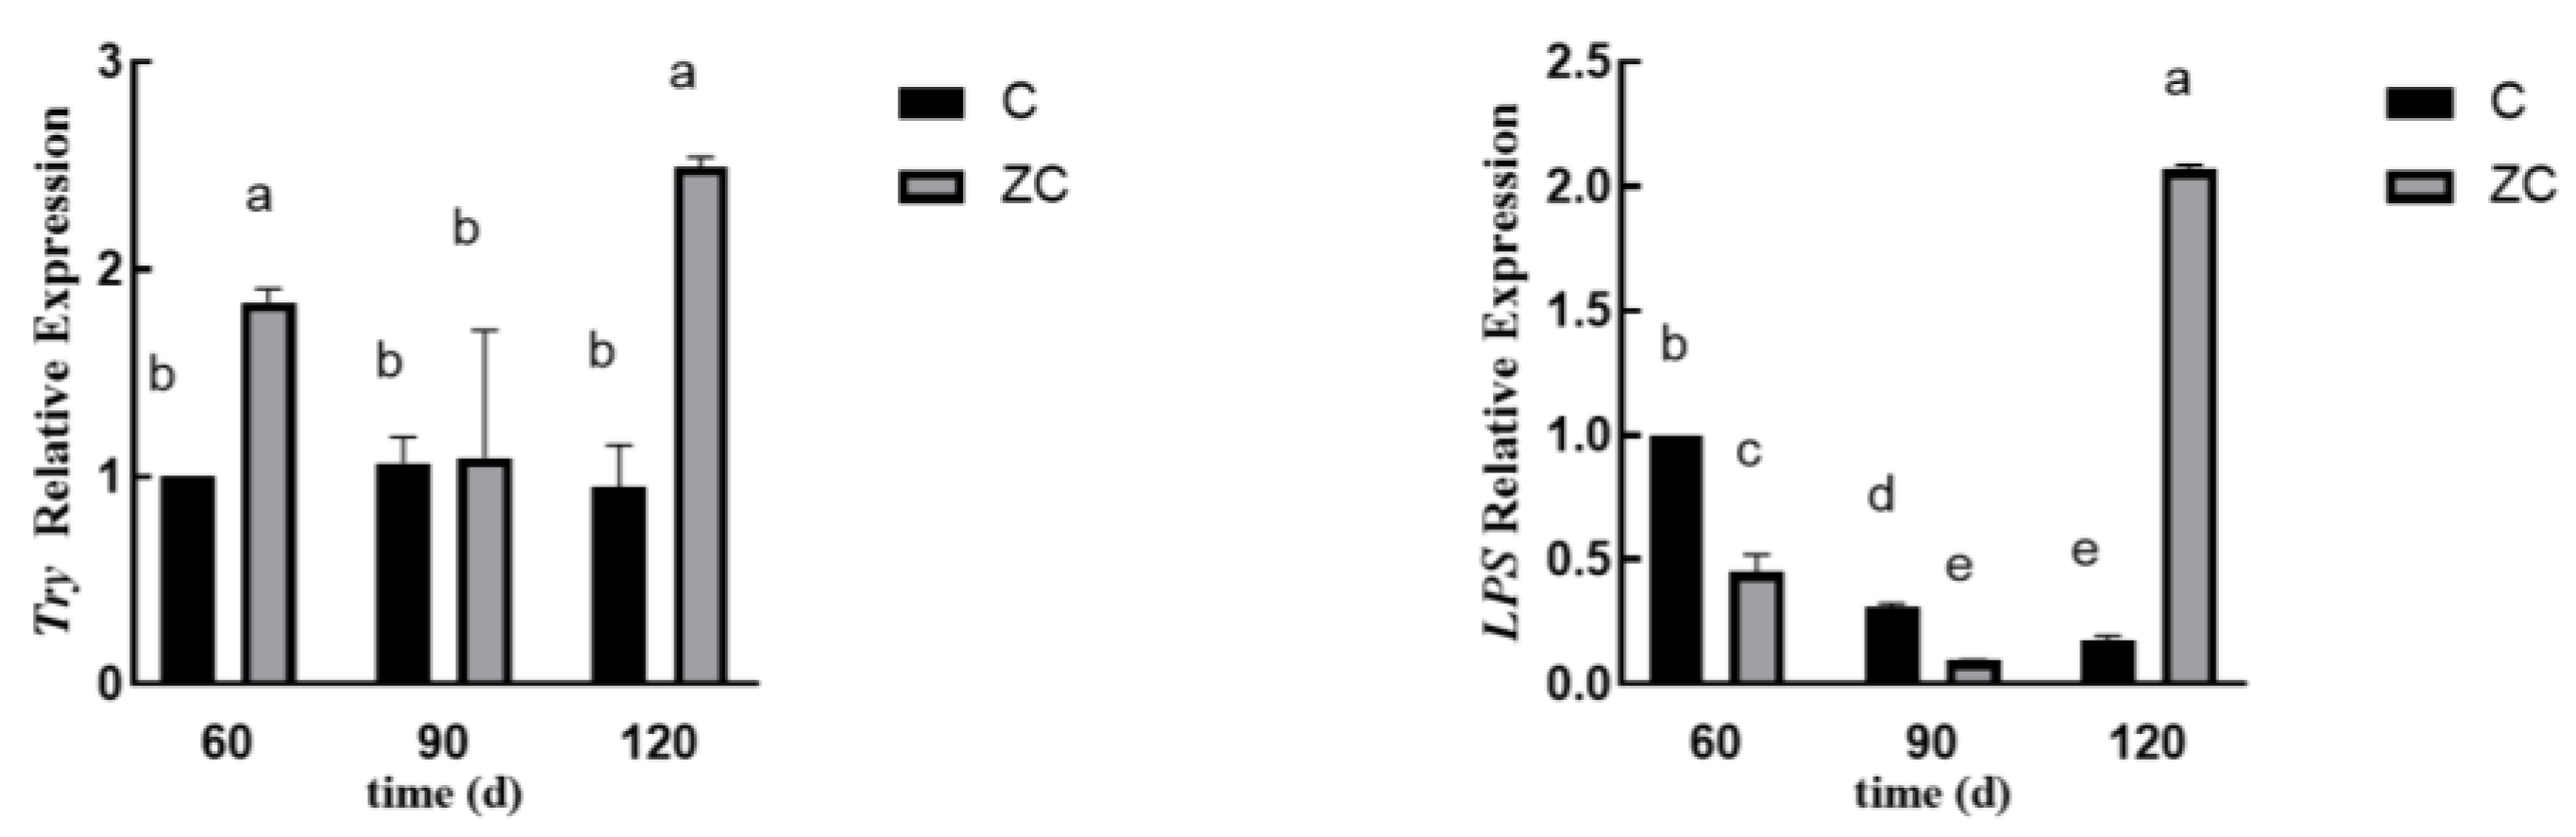
3.5. The Greatly Differential Expressed Genes Between Two Groups

In this study, the expression levels of eight genes were analysed in the hepatopancreas during the middle and late stages of the culture period. As illustrated in Figure 4, Group ZC exhibited no significant change in the expression of heat shock protein 70 (HSP70), whereas it was upregulated in Group C. On day 120, Superoxide dismutase (SOD) expression was significantly upregulated (p < 0.05). In Group ZC, lysozyme (LZM) and anti-lipopolysaccharide factor (ALF) expression levels significantly increased (p < 0.05), whereas both genes were markedly downregulated in Group C. The expression of Toll-like receptors (TLRs) was upregulated in Group ZC, but downregulated in Group C. The expression levels of amylase (AMY) and trypsin (Try) remained unchanged and showed no significant differences (p > 0.05). However, the lipase (LPS) transcription level was significantly upregulated in Group ZC (p < 0.05) and markedly downregulated in Group C.

4. Discussion

Water temperature, pH, and DO are the most important factors directly affecting shrimp growth [28]. In this study, the temperature was suitable for P. monodon, and the water temperature of Group ZC was one degree higher than that of Group C, which may be related to the vital activity of biofloc bacteria. Generally, pH affects shrimp and fish [28], but it can be altered by several microorganisms, including bacteria and algae [29]. The pH of the water for Group ZC in this study decreased rapidly when the biofloc volume increased and TAN decreased. It has been reported that acidification is accompanied by the reaction of heterotrophic bacteria assimilating ammonia nitrogen and nitration by nitrifying bacteria [30]. Hence, sodium carbonate and sodium bicarbonate were used to maintain the pH and total alkalinity in this study. TAN and NO2-N have toxic effects on aquatic animals, including tissue damage and immunosuppression [30]. Therefore, to ensure the health of P. monodon, the TAN and NO2-N concentrations are usually maintained at relatively low levels. In this study, the concentrations of TAN and NO2-N were maintained at low levels by water exchange in Group C and by the bioflocs in Group ZC. Water exchange can remove TAN and NO2-N quickly and effectively; however, it causes significant organic pollution to the surrounding environment and results in a higher risk of pathogen infection [31]. However, BFT has been proven to be safer and more environmentally friendly. Bioflocs have shown good application in controlling inorganic nitrogen in minimal or zero-water-exchange aquaculture systems [30]. The concentrations of NO3-N and PO43− showed an increasing trend and reached high levels, indicating that microalgal cells and denitrifying bacteria in the water were lacking. The turbidity of the water increased as the TSS increased, which greatly affected the microalgae growth of microalgae; during culture, the high DO level inhibited the growth of denitrifying bacteria.
Bioflocs, which consist of heterotrophic bacteria and algae, are microbial aggregates [32]. Natural biofloc formation is regulated through intricate intracellular mechanisms that involve interactions among diverse species and responses to various environmental signals [33]. Generally, an organic carbon source is added to promote the growth of heterotrophic bacteria and shorten the floc formation time [34]. Mature bioflocs can trap cells within their matrices, resulting in higher cell concentrations and longer retention times. This process is beneficial for regulating the quality of water in aquaculture systems [35]. The bacterial community diversity and structure significantly differed between Groups ZC and C. Group C exhibited higher bacterial community diversity. However, it is noteworthy that the dominant bacterial phylum in Group C throughout the culture period was Cyanobacteria. Studies have indicated that cyanobacteria can produce cyanotoxins that greatly endanger the health of cultured organisms and cause significant stress in aquaculture [36]. Although Group ZC exhibited slightly lower bacterial community diversity, the dominant bacterial phyla throughout the culture period were Proteobacteria, Planctomycetota, Bacteroidota, and Actinobacteriota. Research has shown that most of these bacteria are heterotrophic and play roles in organic matter removal and water purification [37]. Therefore, Group ZC, with its dominant bacteria with multiple water purification functions, experienced lower environmental stress during the culture period. This is also one of the reasons for the significantly higher aquaculture production in Group ZC than that in Group C, in addition to the differences in culture management.
Although water exchange can rapidly remove ammonia and nitrite nitrogen, frequent water exchange may lead to instability in the shrimp growth environment and increase the risk of pathogenic infections. In contrast, the biofloc system maintains stable water quality through microbial action, decreases the frequency of water exchange, and provides a more stable growth environment for P. monodon. In this study, the use of bioflocs promoted the survival and growth performance of P. monodon and decreased the need for water exchange during the culture period. Bioflocs contain bacteria, microalgae, fungi, and zooplankton [3]. These microorganisms provide proteins, lipids, essential fatty acids, minerals, vitamins, carotenoids, and exogenous digestive enzymes, all of which may enhance the nutritional quality of fish and shrimp [18,38]. Other studies have also shown that fish or shrimp fed with biofloc supplementation or reared under biofloc systems exhibit higher growth performance and production [39,40,41]. The significantly higher final weight and survival rate in Group ZC compared to Group C indicate that the zero-water-exchange mode provides a more stable growth environment, reducing stress and disease risks for shrimp. In terms of unit yield, Group ZC also outperformed Group C, further demonstrating the zero-water-exchange mode’s advantage in resource utilisation efficiency. Meanwhile, the significantly lower water consumption in Group ZC not only reduces dependence on water resources but also aligns with the requirements of sustainable development. In this study, a low stocking density led to a relatively low final yield, which may have been due to the slower growth rate of shrimp under low-density conditions. Moreover, the frequent water exchange in Group C may have caused instability in the shrimp growth environment, further affecting growth and yield. In future experiments, it will be necessary to select an appropriate stocking density and decrease the water exchange frequency to assess their impacts on shrimp growth and yield.
The heat shock protein family is crucial for cellular responses to various environmental stresses, including hypoxia, high temperatures, heavy metal exposure, and viral or bacterial infections [42]. Hence, the shrimp in Group C in this study were subjected to environmental stress during the culture period. It has been reported that HSP70 is typically expressed at low levels in shrimp under normal conditions. However, its expression can be significantly increased in response to environmental stressors, such as heat stress or exposure to pathogenic bacteria [43,44]. SOD is the primary antioxidant enzyme that protects shrimp from the damaging effects of reactive oxygen species. Several studies have indicated that SOD activity is significantly higher in shrimp reared in BFT systems [39]. In this study, SOD expression was significantly upregulated on day 120 (p < 0.05). Xu et al. proposed that the increase in antioxidant activity observed in BFT could be attributed to the presence of bioactive compounds, including carotenoids, vitamin C, and essential fatty acids [38]. Antimicrobial peptides, including LZM and ALFs, are the most important components of the crustacean immune system [45]. LZM targets the β-1,4-glycosidic bonds in bacterial cell walls and exhibits bactericidal properties, particularly against Gram-positive bacteria [46]. ALFs can bind to lipopolysaccharides and exhibit potent antimicrobial activity against Gram-negative bacteria [45]. In this study, the expression of both LZM and ALF was significantly upregulated in Group ZC (p < 0.05) and significantly downregulated in Group C (p < 0.05). Bioflocs have been reported to upregulate LZM expression in Apostichopus japonicus sea cucumber [47] and Nile tilapia [41] tissues. Enhanced transcript levels of LZM and ALF may improve defence against pathogens. TLRs are highly conserved proteins found on immune cell membranes. They rapidly recognise pathogen-associated molecular patterns in microorganisms and enhance immune responses [48]. Chen et al. found that the expression of TLRs in A. japonicus was enhanced by the use of bioflocs, indicating improved pathogen recognition and activation of immune signalling pathways [42]. In this study, TLR2 expression was upregulated in Group ZC and downregulated in Group C, reflecting the different immune statuses of P. monodon individuals cultured in different systems. Amylase, tryptic enzymes, and lipase are the most important digestive enzymes in P. monodon, with their activities directly influencing the growth of P. monodon. The expression of amylase and tryptic enzymes did not significantly change in this study (p > 0.05), whereas the lipase transcript level was significantly upregulated in Group ZC (p > 0.05) and significantly downregulated in Group C (p > 0.05). Supplementing the diet with bioflocs has been reported to significantly enhance (p < 0.05) the activity of digestive enzymes in P. monodon and A. japonicus [39,42]. Jin et al. reported significantly elevated amylase, trypsin, and lipase activities in largemouth bass reared in a biofloc system (p < 0.05) [49]. Additionally, this study demonstrated that bioflocs may enhance the antioxidant capacity, antimicrobial activity, and digestive activity of P. monodon by promoting functional gene transcription.

5. Conclusions

This study provides new insights into how Biofloc Technology (BFT) can not only improve water quality but also enhance the sustainability of aquaculture systems by promoting growth performance, boosting immunity, and increasing antioxidant capacity. With the support of bioflocs, the zero-water-exchange system minimises environmental pollution and reduces the risk of pathogen infection, serving as a sustainable alternative to traditional clear-water systems. Amidst the growing demand for sustainable aquaculture practices, the potential benefits of BFT in improving resource utilisation efficiency, such as reducing water consumption and enhancing feed conversion rates, present significant opportunities for the aquaculture industry. Moreover, the microbial communities within bioflocs offer new avenues for advancing sustainable farming practices, including nutrient cycling and bioremediation. Managing optimal environmental conditions within BFT systems, such as temperature, pH levels, and dissolved oxygen levels, is crucial for system stability and performance. Although BFT has achieved success in small-scale operations, further research is needed to address challenges like increased turbidity and nitrate accumulation when transitioning to large-scale commercial applications. Further advancements in microbial management and system optimisation are essential for enhancing the scalability of BFT to accommodate larger commercial operations. In conclusion, biofloc technology represents a promising future for the aquaculture industry, offering opportunities for both economic and environmental benefits. Continuous research and development will be key to overcoming existing challenges and ensuring its widespread adoption in the global aquaculture industry.

Author Contributions

Conceptualization, G.W. and Y.X.; methodology, G.W.; software, L.J.; formal analysis, L.J.; investigation, H.R., X.H. and Y.C.; data curation, H.R.; writing—original draft preparation, H.R.; writing—review and editing, H.S. and Y.X.; supervision, G.W. and Y.C.; funding acquisition, G.W. and Y.X. All authors have read and agreed to the published version of the manuscript.

Funding

This research was funded by the project supported by National Key R&D Program of China (2023YFD2401703), the Hainan Provincial Natural Science Foundation of China (322QN437), the Southern Marine Science and Engineering Guangdong Laboratory (Zhuhai) (SML2023SP236), the earmarked fund for CARS-48, Central Public-interest Scientific Institution Basal Research Fund, CAFS (2023TD57), the Central Public-Interest Scientific Institution Basal Research Fund, South China Sea Fisheries Research Institute, CAFS (2023XK02), and the 2024 Provincial Rural Revitalization Strategy Special Fund Seed Industry Revitalization Project (2024-SPY-00-002).

Institutional Review Board Statement

The animal study protocol was approved by the Animal Care and Use Committee of the South China Sea Fisheries Research Institute, Chinese Academy of Fishery Sciences (SCSFRI-CAFS, No. nhdf2025-03; Approval date: 9 January 2025).

Informed Consent Statement

Not applicable.

Data Availability Statement

The datasets generated and analysed during the current study are available from the corresponding author upon reasonable request.

Conflicts of Interest

The authors declare no conflicts of interest.

References

  1. FAO. The state of world fisheries and aquaculture 2021. In Sustainability in Action; FAO: Rome, Italy, 2021. [Google Scholar]
  2. Fisheries Administration Bureau, Ministry of Agriculture. China Fishery Statistics Year Book (2024); Beijing China Agriculture Press: Beijing, China, 2024. [Google Scholar]
  3. Khanjani, M.H.; Mohammadi, A.; Emerenciano, M.G.C. Microorganisms in biofloc aquaculture system. Aquac. Rep. 2022, 26, 101300. [Google Scholar] [CrossRef]
  4. Crab, R.; Defoirdt, T.; Bossier, P.; Verstraete, W. Biofloc technology in aquaculture: Beneficial effects and future challenges. Aquaculture 2012, 356, 351–356. [Google Scholar] [CrossRef]
  5. Martínez-Córdova, L.R.; Emerenciano, M.; Miranda-Baeza, A.; Martínez-Porchas, M. Microbial-based systems for aquaculture of fish and shrimp: An updated review. Rev. Aquac. 2014, 7, 131–148. [Google Scholar] [CrossRef]
  6. Xu, W.-J.; Morris, T.C.; Samocha, T.M. Effects of C/N ratio on biofloc development, water quality, and performance of Litopenaeus vannamei juveniles in a biofloc-based, high-density, zero-exchange, outdoor tank system. Aquaculture 2016, 453, 169–175. [Google Scholar] [CrossRef]
  7. Avnimelech, Y. Carbon/nitrogen ratio as a control element in aquaculture systems. Aquaculture 1999, 176, 227–235. [Google Scholar] [CrossRef]
  8. Ebeling, J.M.; Timmons, M.B.; Bisogni, J.J. Engineering analysis of the stoichiometry of photoautotrophic, autotrophic, and heterotrophic removal of ammonia–nitrogen in aquaculture systems. Aquaculture 2006, 257, 346–358. [Google Scholar] [CrossRef]
  9. Song, H.L.; Yang, X.L.; Xia, M.Q.; Chen, M. Co-metabolic degradation of steroid estrogens by heterotrophic bacteria and nitrifying bacteria in MBRs. J. Env. Sci. Health A 2017, 52, 778–784. [Google Scholar] [CrossRef]
  10. Schmautz, Z.; Espinal, C.A.; Bohny, A.M.; Rezzonico, F.; Junge, R.; Frossard, E.; Smits, T.H.M. Environmental parameters and microbial community profiles as indication towards microbial activities and diversity in aquaponic system compartments. BMC Microbiol. 2021, 21, 12. [Google Scholar] [CrossRef]
  11. Avnimelech, Y. Biofloc Technology: A Practical Guide Book; The World Aquaculture Society: Baton Rouge, LA, USA, 2009. [Google Scholar]
  12. Burford, M.A.; Thompson, P.J.; McIntosh, R.P.; Bauman, R.H.; Pearson, D.C. The contribution of flocculated material to shrimp (Litopenaeus vannamei) nutrition in a high-intensity, zero-exchange system. Aquaculture 2004, 232, 525–537. [Google Scholar] [CrossRef]
  13. Deng, Y.; Borewicz, K.; van Loo, J.; Olabarrieta, M.Z.; Kokou, F.; Sipkema, D.; Verdegem, M.C.J. In-Situ Biofloc Affects the Core Prokaryotes Community Composition in Gut and Enhances Growth of Nile Tilapia (Oreochromis niloticus). Microb. Ecol. 2022, 84, 879–892. [Google Scholar] [CrossRef]
  14. Khanjani, M.H.; Sharifinia, M.; Emerenciano, M.G.C. Biofloc Technology (BFT) in Aquaculture: What Goes Right, What Goes Wrong? A Scientific-Based Snapshot. Aquac. Nutr. 2024, 2024, 7496572. [Google Scholar] [CrossRef] [PubMed]
  15. Kumar, S.; Anand, P.S.S.; De, D.; Ghoshal, T.K.; Alavandi, S.V.; Vijayan, K.K. Integration of substrate in biofloc based system: Effects on growth performance, water quality and immune responses in black tiger shrimp, Penaeus monodon culture. Aquac. Res. 2019, 50, 2986–2999. [Google Scholar] [CrossRef]
  16. Uawisetwathana, U.; Situmorang, M.L.; Arayamethakorn, S.; Haniswita; Suantika, G.; Panya, A.; Karoonuthaisiri, N.; Rungrassamee, W. Supplementation of Ex-Situ Biofloc to Improve Growth Performance and Enhance Nutritional Values of the Pacific White Shrimp Rearing at Low Salinity Conditions. Appl. Sci. 2021, 11, 4598. [Google Scholar] [CrossRef]
  17. Kumar, S.; Anand, P.S.S.; De, D.; Sundaray, J.K.; Raja, R.A.; Biswas, G.; Ponniah, A.G.; Ghoshal, T.K.; Deo, A.D.; Panigrahi, A.; et al. Effects of carbohydrate supplementation on water quality, microbial dynamics and growth performance of giant tiger prawn (Penaeus monodon). Aquac. Int. 2014, 22, 901–912. [Google Scholar] [CrossRef]
  18. Ju, Z.Y.; Forster, I.; Conquest, L.; Dominy, W. Enhanced growth effects on shrimp (Litopenaeus vannamei) from inclusion of whole shrimp floc or floc fractions to a formulated diet. Aquac. Nutr. 2008, 14, 533–543. [Google Scholar] [CrossRef]
  19. Xu, W.-J.; Pan, L.-Q. Effects of bioflocs on growth performance, digestive enzyme activity and body composition of juvenile Litopenaeus vannamei in zero-water exchange tanks manipulating C/N ratio in feed. Aquaculture 2012, 356, 147–152. [Google Scholar] [CrossRef]
  20. Kumar, V.; Roy, S.; Behera, B.K.; Swain, H.S.; Das, B.K. Biofloc Microbiome with Bioremediation and Health Benefits. Front Microbiol 2021, 12, 741164. [Google Scholar] [CrossRef]
  21. Shyne Anand, P.S.; Kumar, S.; Kohli, M.P.S.; Sundaray, J.K.; Sinha, A.; Pailan, G.H.; Dam Roy, S. Dietary biofloc supplementation in black tiger shrimp, Penaeus monodon: Effects on immunity, antioxidant and metabolic enzyme activities. Aquac. Res. 2017, 48, 4512–4523. [Google Scholar] [CrossRef]
  22. GB 17378.4-2007; Marine Monitoring Specifications—Part 4: Seawater Analysis. General Administration of Quality Supervision, Inspection and Quarantine of the People’s Republic of China. Standardization Administration of China: Beijing, China, 2007.
  23. Burian, A.; Pinn, D.; Peralta-Maraver, I.; Sweet, M.; Mauvisseau, Q.; Eyice, O.; Bulling, M.; Rothig, T.; Kratina, P. Predation increases multiple components of microbial diversity in activated sludge communities. ISME J. 2022, 16, 1086–1094. [Google Scholar] [CrossRef]
  24. Radley, J.A. Starch and Its Derivatives; Chapman & Hall: London, UK, 1968. [Google Scholar]
  25. Winkler, U.K.; Stuckmann, M. Glycogen, hyaluronate, and some other polysaccharides greatly enhance the formation of exolipase by Serratia marcescens. J. Bacteriol. 1979, 138, 663–670. [Google Scholar] [CrossRef]
  26. Erlanger, B.F.; Kokowsky, N.; Cohen, W. The preparation and properties of two new chromogenic substrates of trypsin. Arch. Biochem. Biophys. 1961, 95, 271–278. [Google Scholar] [CrossRef] [PubMed]
  27. Bradford, M.M. A rapid and sensitive method for the quantitation of microgram quantities of protein utilizing the principle of protein-dye binding. Anal. Biochem. 1976, 72, 248–254. [Google Scholar] [CrossRef] [PubMed]
  28. Mengal, K.; Kor, G.; Kozak, P.; Niksirat, H. Effects of environmental factors on the cellular and molecular parameters of the immune system in decapods. Comp. Biochem. Physiol. A-Mol. Integr. Physiol. 2023, 276, 111332. [Google Scholar] [CrossRef] [PubMed]
  29. Zhang, K.; Pan, L.; Chen, W.; Wang, C. Effect of using sodium bicarbonate to adjust the pH to different levels on water quality, the growth and the immune response of shrimp Litopenaeus vannamei reared in zero-water exchange biofloc-based culture tanks. Aquac. Res. 2017, 48, 1194–1208. [Google Scholar] [CrossRef]
  30. Jamal, M.T.; Broom, M.; Al-Mur, B.A.; Al Harbi, M.; Ghandourah, M.; Al Otaibi, A.; Haque, M.F. Biofloc Technology: Emerging Microbial Biotechnology for the Improvement of Aquaculture Productivity. Pol. J. Microbiol. 2020, 69, 401–409. [Google Scholar] [CrossRef]
  31. Guo, H.; Fu, X.; He, J.; Wang, R.; Yan, M.; Wang, J.; Dong, P.; Huang, L.; Zhang, D. Gut bacterial consortium enriched in a biofloc system protects shrimp against Vibrio parahaemolyticus infection. Microbiome 2023, 11, 230. [Google Scholar] [CrossRef]
  32. Tảo, C.T.; Khoa TN, D.; Hòa, N.V.; Hải, T.N. Effects of carbon sources on nursing white-leg shrimp (Litopenaeus vannamei) larvae applying biofloc technology. CTU J. 2020, 56, 29. [Google Scholar]
  33. Sharma, A.; Bandhana, R.S.; Sangotra, R. Comparison of water quality and composition of bioflocs reared in indoor and outdoor conditions. Int. Res. J. Biol. Sci. 2018, 7, 1–9. [Google Scholar]
  34. Jiang, W.; Ren, W.; Li, L.; Dong, S.; Tian, X. Light and carbon sources addition alter microbial community in biofloc-based Litopenaeus vannamei culture systems. Aquaculture 2020, 515, 734572. [Google Scholar] [CrossRef]
  35. Irankhah, S.; Ali, A.A.; Soudi, M.R.; Gharavi, S.; Ayati, B. Highly efficient phenol degradation in a batch moving bed biofilm reactor: Benefiting from biofilm-enhancing bacteria. World J. Microbiol. Biotechnol. 2018, 34, 164. [Google Scholar] [CrossRef]
  36. Kordahi, M.A.; Ayoub, G.M.; Zayyat, R.M. A critical review of current research on cyanobacterial cells and associated toxins in aquatic environments: Occurrence, impact, and treatment methods. J. Environ. Chem. Eng. 2024, 12, 113931. [Google Scholar] [CrossRef]
  37. Øvreås, L.; Kallscheuer, N.; Calisto, R.; Bordin, N.; Storesund, J.E.; Jogler, C.; Devos, D.; Lage, O. Comparative genomic analyses of aerobic planctomycetes isolated from the deep sea and the ocean surface. Antonie Leeuwenhoek 2025, 118, 33. [Google Scholar] [CrossRef] [PubMed]
  38. Xu, W.J.; Pan, L.Q.; Sun, X.H.; Huang, J. Effects of bioflocs on water quality, and survival, growth and digestive enzyme activities of Litopenaeus vannamei (Boone) in zero-water exchange culture tanks. Aquac. Res. 2013, 44, 1093–1102. [Google Scholar] [CrossRef]
  39. Anand, P.S.S.; Kohli, M.P.S.; Kumar, S.; Sundaray, J.K.; Roy, S.D.; Venkateshwarlu, G.; Sinha, A.; Pailan, G.H. Effect of dietary supplementation of biofloc on growth performance and digestive enzyme activities in Penaeus monodon. Aquaculture 2014, 418, 108–115. [Google Scholar] [CrossRef]
  40. Panigrahi, A.; Das, R.R.; Sivakumar, M.R.; Saravanan, A.; Saranya, C.; Sudheer, N.S.; Kumaraguru Vasagam, K.P.; Mahalakshmi, P.; Kannappan, S.; Gopikrishna, G. Bio-augmentation of heterotrophic bacteria in biofloc system improves growth, survival, and immunity of Indian white shrimp Penaeus indicus. Fish Shellfish Immunol. 2020, 98, 477–487. [Google Scholar] [CrossRef] [PubMed]
  41. Outama, P.; Le Xuan, C.; Wannavijit, S.; Lumsangkul, C.; Linh, N.V.; Montha, N.; Tongsiri, S.; Chitmanat, C.; Van Doan, H. Modulation of growth, immune response, and immune-antioxidant related gene expression of Nile tilapia (Oreochromis niloticus) reared under biofloc system using mango peel powder. Fish Shellfish Immunol. 2022, 131, 1136–1143. [Google Scholar] [CrossRef]
  42. Chen, J.; Ren, Y.; Li, Y.; Xia, B. Regulation of growth, intestinal microbiota, non-specific immune response and disease resistance of sea cucumber Apostichopus japonicus (Selenka) in biofloc systems. Fish Shellfish Immunol. 2018, 77, 175–186. [Google Scholar] [CrossRef]
  43. Junprung, W.; Supungul, P.; Tassanakajon, A. Litopenaeus vannamei heat shock protein 70 (LvHSP70) enhances resistance to a strain of Vibrio parahaemolyticus, which can cause acute hepatopancreatic necrosis disease (AHPND), by activating shrimp immunity. Dev. Comp. Immunol. 2019, 90, 138–146. [Google Scholar] [CrossRef]
  44. Rungrassamee, W.; Leelatanawit, R.; Jiravanichpaisal, P.; Klinbunga, S.; Karoonuthaisiri, N. Expression and distribution of three heat shock protein genes under heat shock stress and under exposure to Vibrio harveyi in Penaeus monodon. Dev. Comp. Immunol. 2010, 34, 1082–1089. [Google Scholar] [CrossRef]
  45. Jiang, H.S.; Lv, L.X.; Wang, J.X. Anti-lipopolysaccharide factor D from kuruma shrimp exhibits antiviral activity. Mar. Life Sci. Technol. 2022, 4, 52–61. [Google Scholar] [CrossRef]
  46. Liang, Q.; Yuan, M.; Xu, L.; Lio, E.; Zhang, F.; Mou, H.; Secundo, F. Application of enzymes as a feed additive in aquaculture. Mar. Life Sci. Technol. 2022, 4, 208–221. [Google Scholar] [CrossRef] [PubMed]
  47. Chen, J.; Ren, Y.; Wang, G.; Xia, B.; Li, Y. Dietary supplementation of biofloc influences growth performance, physiological stress, antioxidant status and immune response of juvenile sea cucumber Apostichopus japonicus (Selenka). Fish Shellfish Immunol. 2018, 72, 143–152. [Google Scholar] [CrossRef] [PubMed]
  48. Ghani, M.U.; Chen, J.; Khosravi, Z.; Wu, Q.; Liu, Y.; Zhou, J.; Zhong, L.; Cui, H. Unveiling the multifaceted role of toll-like receptors in immunity of aquatic animals: Pioneering strategies for disease management. Front. Immunol. 2024, 15, 1378111. [Google Scholar] [CrossRef]
  49. Jin, Y.; Meng, S.; Xu, H.; Song, C.; Fan, L.; Qiu, L.; Li, D. Responses of Digestive, Antioxidant, Immunological and Metabolic Enzymes in the Intestines and Liver of Largemouth Bass (Micropterus salmoides) under the Biofloc Model. Antioxidants 2024, 13, 736. [Google Scholar] [CrossRef] [PubMed]
Figure 1. Changes in water quality parameters under two different culture modes. (A): TAN. (B): NO2-N. (C): NO3-N. (D): PO43−. (E): TN. (F): TP. (G): COD. (H): TSS. Error bars are standard deviations (SD).
Fishes 10 00106 g001aFishes 10 00106 g001b
Figure 2. Changes in BFV 30 min (a) during the culture period, n = 3.
Fishes 10 00106 g002
Figure 3. Characteristics of microbial community changes in water during the aquaculture process in zero water change and water change groups.
Fishes 10 00106 g003
Figure 4. Changes in the relative expression levels of HSP70, SOD, LZM, TLR, ALF, AMY, Try, and LPS over time under two different culture modes. Different superscript letters within each row indicate statistically significant differences between two groups (p < 0.05).
Fishes 10 00106 g004aFishes 10 00106 g004b
Table 1. Primer sequences of the genes used for RT-qPCR.
GenePrimer Sequence (5′-3′)LengthTm (°C)
PmEF1F-GGTGCTGGACAAGCTGAAGGC2164.10
R-CGTTCCGGTGATCATGTTCTTGATG2562.41
PmSODF-GCTGCTACAAAGAAGTTGGT2056.26
R-GGACTGGAATGATCCAAAGC2056.47
Hsp70F-CTTCGACAACCGCATGGTGA2060.95
R-GAAGAGGGAGCCGATCTCCA2060.76
PmALFF-GCCACCACAAGAACCTTAGA2057.44
R-ACTGCTCCGGTTTAGAGAAAG2157.68
PmLZMF-TGGTGTGGCAGCGATTATG1958.22
R-GATCGAGGTCGCGATTCTTAC2158.69
PmTLRF-CTTAGCCTTGGAGACAAC1852.26
R-GATGCTTAACAGCTCCTC1852.46
PmAMYF-TGTCGGATGCGATTGCTCC1960.52
R-TGAATGCCCTCGGTGATGC1960.45
PmPTLF-GCGTTTGAATGGAGGGTTGG2059.76
R-TGCGTGTTGTCACTCCGTAA2059.90
PmTryF-CAGGGCGATGACTTTGATAAT2156.10
R-ACTGATGGTGAAGCCGTTGTA2159.65
Table 2. The physicochemical factors measured in P. monodon farming tanks.
FactorsZCC
Temprature (°C)26.98 ± 1.9726.11 ± 2.15
pH7.67 ± 0.118.05 ± 0.05
DO (mg·L−1)5.65 ± 0.326.10 ± 0.52
Salinity (‰)15.61 ± 1.3714.16 ± 4.24
Table 3. The microbial community diversity in the zero water change and water change groups.
Sample IDSequencesASVsChao1Goods CoveragePielou EvennessShannon
C15633911521153.6250.9990.7797.926
C25633911711172.0520.9990.7677.816
C35633911801179.0001.0000.7948.109
ZC161458733733.2340.9990.7096.753
ZC261458768768.0001.0000.7647.329
ZC361458675672.9420.9990.7016.590
Table 4. Final P. monodon production data between the two treatments at the end of the study.
IndicatorZCCp Value
Final weight (g)11.46 ± 0.619.38 ± 0.120.004
Weight gain (g)11.43 ± 0.619.33 ± 0.360.007
Survival rate (%)75.90 ± 2.5035.76 ± 4.83<0.001
Unit yield (kg·m−3)1.31 ± 0.030.15 ± 0.01<0.001
Specific growth rate (% day−1)4.95 ± 0.044.39 ± 0.03<0.001
Feed conversion ratio1.90 ± 0.043.44 ± 0.350.002
shrimp Water usage (m3·kg−1)0.98 ± 0.0216.02 ± 1.63<0.001
Each value represents mean ± SD., N = 3; The p-value indicates the significance of differences between the two groups.
Disclaimer/Publisher’s Note: The statements, opinions and data contained in all publications are solely those of the individual author(s) and contributor(s) and not of MDPI and/or the editor(s). MDPI and/or the editor(s) disclaim responsibility for any injury to people or property resulting from any ideas, methods, instructions or products referred to in the content.

