Article

Microsatellite-Based Evaluation of Genetic-Distance-Driven Crossbreeding in the Endangered Freshwater Fish Pseudopungtungia nigra

by
Kang-Rae Kim
1 and
In-Chul Bang
2,*
1
Southeast Sea Fisheries Research Institute, National Institute of Fisheries Science, Namhae 52440, Republic of Korea
2
Department of Life Science, Soonchunhyang University, Asan 31538, Republic of Korea
*
Author to whom correspondence should be addressed.
Fishes 2025, 10(12), 603; https://doi.org/10.3390/fishes10120603
Submission received: 29 October 2025 / Revised: 20 November 2025 / Accepted: 24 November 2025 / Published: 25 November 2025

Abstract

Artificial crossbreeding is a critical strategy in the restoration of endangered freshwater fishes with small, fragmented populations, where natural spawning alone cannot reverse genetic erosion. This study examined the genetic diversity and fitness traits of crosses between genetically distant (HGD) and closely related (LGD) broodstock individuals of Pseudopungtungia nigra, an endangered Korean freshwater fish. Using ten microsatellite loci, we evaluated genetic diversity, population structure, and early survival performance among crossbreeds and their broodstock. Both HGD and LGD progenies showed deviations from Hardy–Weinberg equilibrium and exhibited higher observed heterozygosity than expected, indicating the influence of artificial selection. The broodstock and both crossbred groups displayed bottleneck signals, while LD-based effective population size was infinite for the broodstock and HGD but finite for LGD, suggesting estimation bias because the parameter was undeterminable due to small sample size (each group, n = 28–30). STRUCTURE and DAPC analyses revealed that HGD_20 was most genetically similar to the broodstock population, while LGD and HGD_19 formed distinct clusters. Hatching rate was 1.5-fold higher in HGD compared with LGD (p < 0.05), although survival did not differ significantly (p > 0.05). These results highlight that crossbreeding based on genetic distance can enhance genetic diversity and hatching performance without causing excessive genetic divergence from the parental population, offering a practical model for the genetic management of endangered fish restoration.
Key Contribution: This study shows that genetic-distance-based artificial crossing in the endangered freshwater fish Pseudopungtungia nigra can improve hatching performance while preserving genetic similarity to the broodstock, providing a practical approach for balancing genetic diversity and fidelity in conservation breeding programs.

Graphical Abstract

1. Introduction

Restoring endangered fishes is unlikely to reverse genetic erosion through natural spawning alone, because population sizes are extremely small, sex ratios are skewed, and generation intervals are irregular [1,2,3]. Habitat fragmentation and environmental variability inflate variance in reproductive success and can concentrate reproduction in a few broodstock fish [4,5,6]. Under these conditions, genetic drift intensifies, rare alleles are lost rapidly, and autonomous recovery is slow in the absence of immigration or managed gene flow [1,2,7]. Consistent with this logic, Lutz et al. [8] demonstrated that reintroducing the endangered freshwater fish Macquaria australasica from multiple, genetically differentiated source populations produced a genetically diverse, self-recruiting population, reducing the risk of harmful inbreeding and enhancing survival and growth. Artificial breeding is an essential management tool in terms of equalizing broodstock contributions, increasing genetic diversity, alleviating family size dispersion through factorial crosses, and providing short-term buffering of bottleneck signals [9,10].
Pseudopungtungia nigra is an endangered fish found only in the Geumgang and Mangyeonggang Rivers of the Korean Peninsula [11,12]. Although previous population genetic and ecological studies provide a favorable basis for restoration planning [11,12], the broodstock available for release are constrained by collection limits, as the Korean government restricts the number of captive broodstock to fewer than 30 individuals, thereby limiting the effectiveness of artificial insemination-based programs [12]. Under such conditions, where only small broodstock pools can be maintained, hybridization strategies that increase or at least maintain genetic diversity become essential for successful restoration [7,13,14].
The long-term sustainability of restored populations of endangered species relies on high genetic diversity [2,15]. Genetic diversity is associated with environmental fluctuations and early survival rates, and it enhances adaptation by preserving selectable genetic variations (especially rare and low-frequency variations) [2,15,16]. After a bottleneck, allelic richness typically declines faster than expected heterozygosity, so in early restoration phases deliberate mating designs are needed to actively maintain and expand allele numbers and overall genetic diversity [17,18]. To meet this goal, scientists expand the broodstock pool and use factorial or otherwise-structured pairings to capture heterosis while actively equalizing parental contributions, thereby reducing family-size variance and preserving genetic diversity [19,20].
Excessive genetic divergence between restored offspring and the maternal source population should be avoided, because large divergence can disrupt local adaptation, increase the risk of outbreeding depression, and alter the genetic composition of the wild gene pool [13,21]. If the goal of restoration is to re-establish the characteristics of the natural population, the genetic composition of released offspring should remain closely aligned with that of the source population to avoid disrupting local adaptation and triggering outbreeding depression [2,21]. Empirical guidelines indicate that the risk of outbreeding depression increases when crosses involve populations that differ in karyotype, occupy markedly different environments, or have been isolated for long periods, whereas it is expected to be low when populations of the same species share karyotypes, inhabit similar environments, and have been separated for less than a few hundred years [21,22]. In practice, it is necessary to find a balance that simultaneously achieves both genetic diversity expansion and similarity to the original population by applying parent selection criteria that consider not only the genetic distance between individuals but also the similarity of parent candidates and their habitats [21,23,24].
Rather than pre-stratifying crosses by genetic distance to directly compare early survival, most previous studies have performed factorial or diallel crosses among lines or populations and measured hatching and early survival, and then related these outcomes a posteriori to neutral-marker differentiation (FST) and heterosis metrics [25,26,27]. In aquaculture marine species, crossbreeding has been reported to show heterospecific vigor at the hatching stage [26,27], but few studies have been reported on genetic-distance-based crossbreeding of endangered freshwater fishes [8,23,28,29,30,31,32,33,34].
This study tests whether crossbreeding between genetically distant pairs enhances genetic diversity and early survival in P. nigra without causing divergence from the broodstock population.

2. Materials and Methods

2.1. Fish Collection and Breeding Management for Mating

The study species, P. nigra, is listed as endangered. Collections were conducted under permits from the Geumgang River Basin Environmental Office (No. 2018-35, 2019-26) and the Jeonbuk Regional Environmental Office (No. 2018-16, 2019-15) authorizing capture, handling, and release. Thirty adults were sampled from Yudeungcheon Stream, a tributary of the Geumgang River, using a 4 × 4 mm mesh net (Figure 1).
Fish were transferred in oxygenated river water in double plastic bags and transported to the laboratory. Broodstock were held in 100 L glass aquaria on a recirculating filtration system. To provide shelter and encourage reproductive conditioning, PVC pipes were placed in the tanks. Water temperature was maintained at 18.0 ± 0.5 °C. Fish were fed commercial pellets and frozen animal feed to promote maturation.

2.2. VIE Tagging for Broodstock Genotype Verification

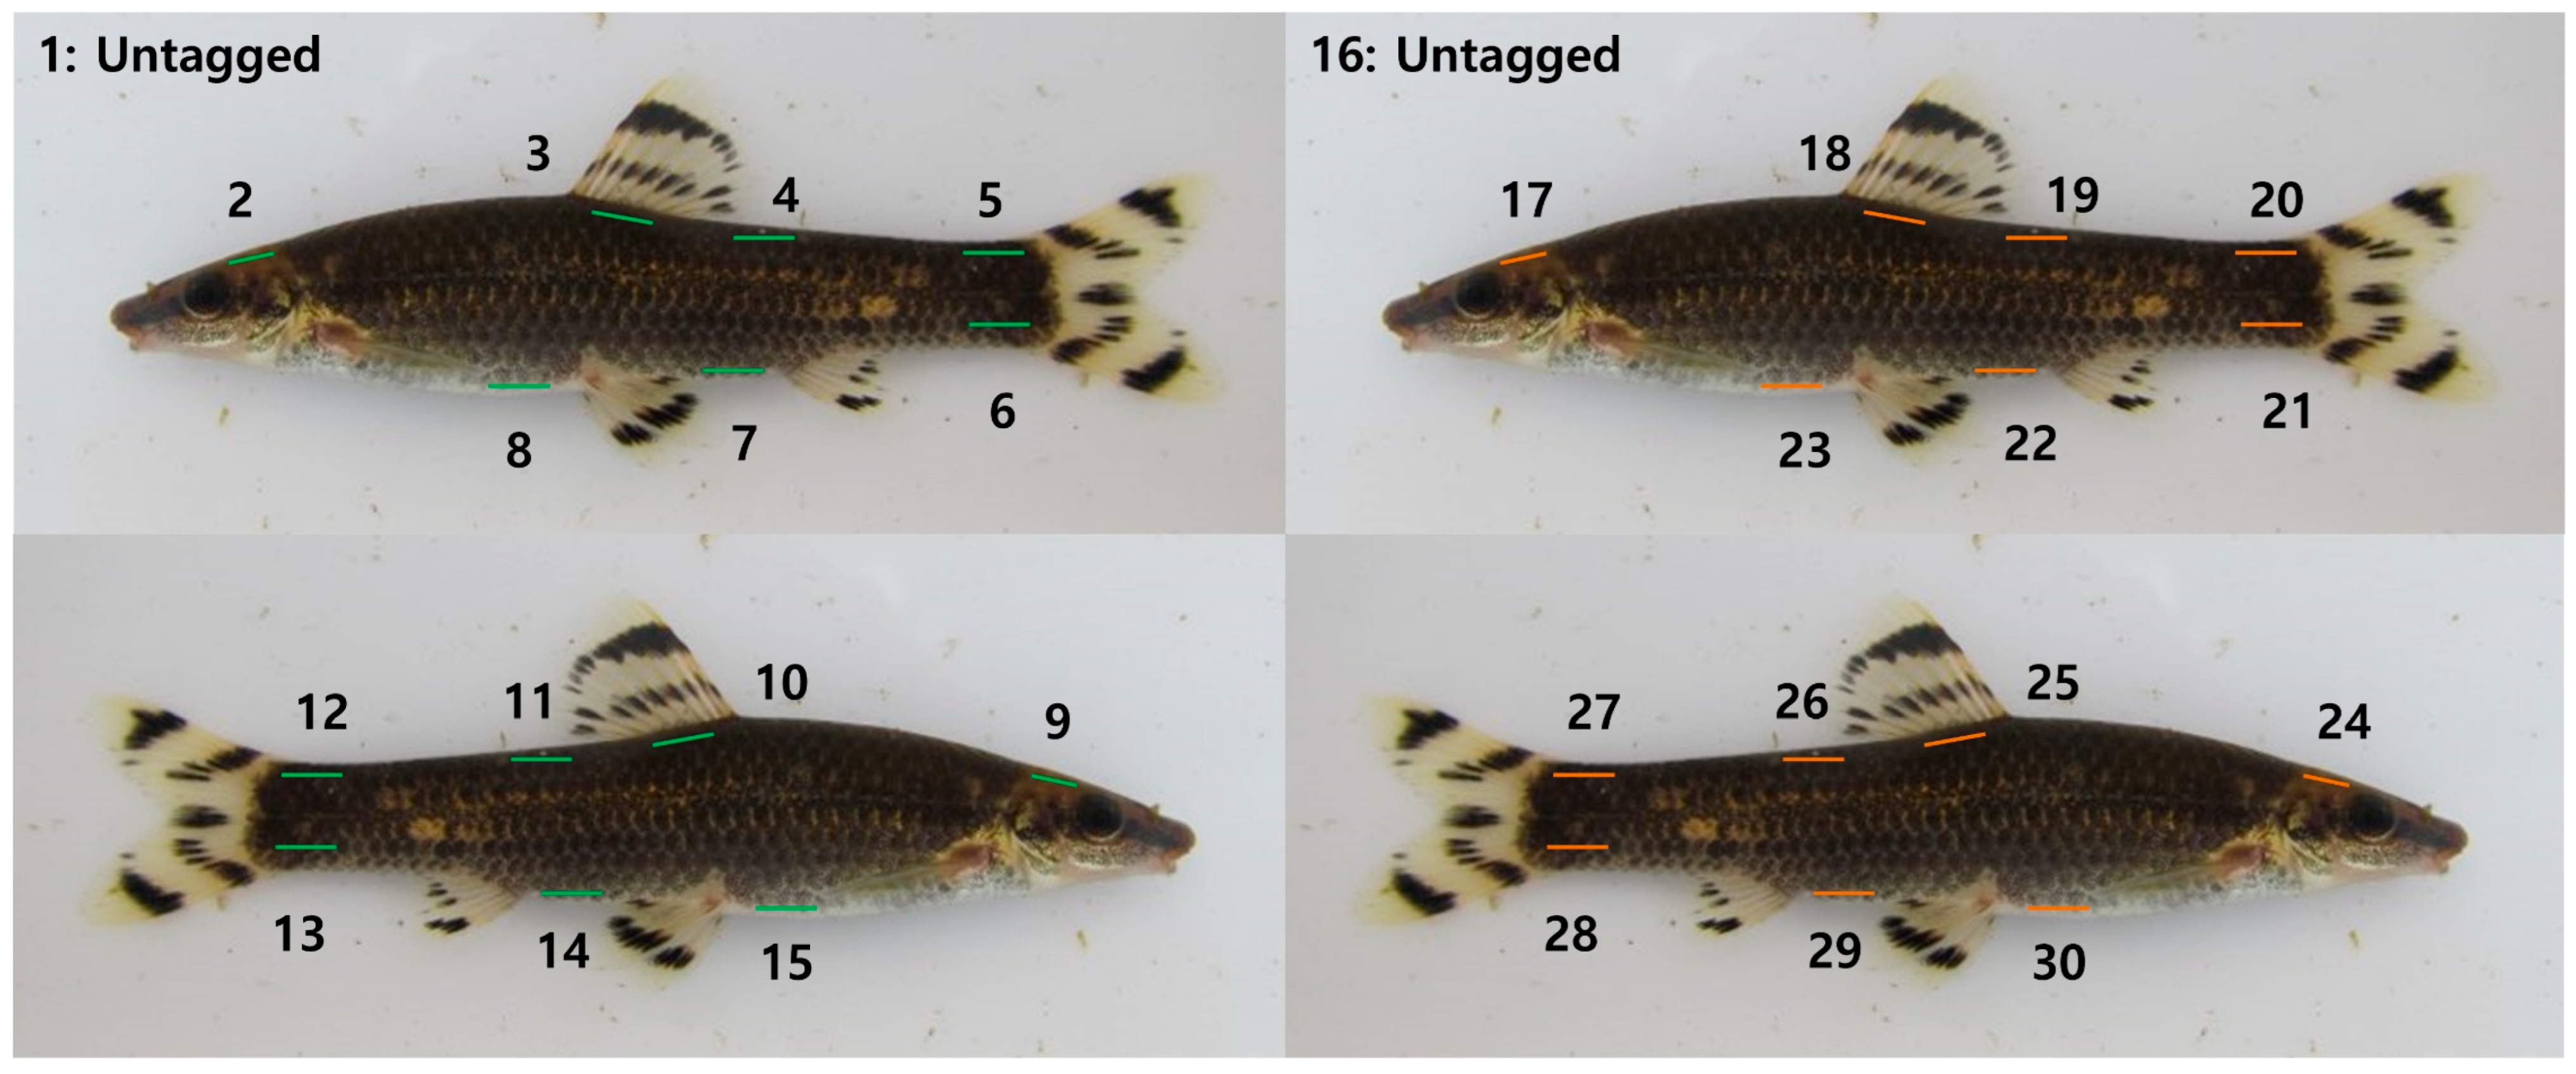
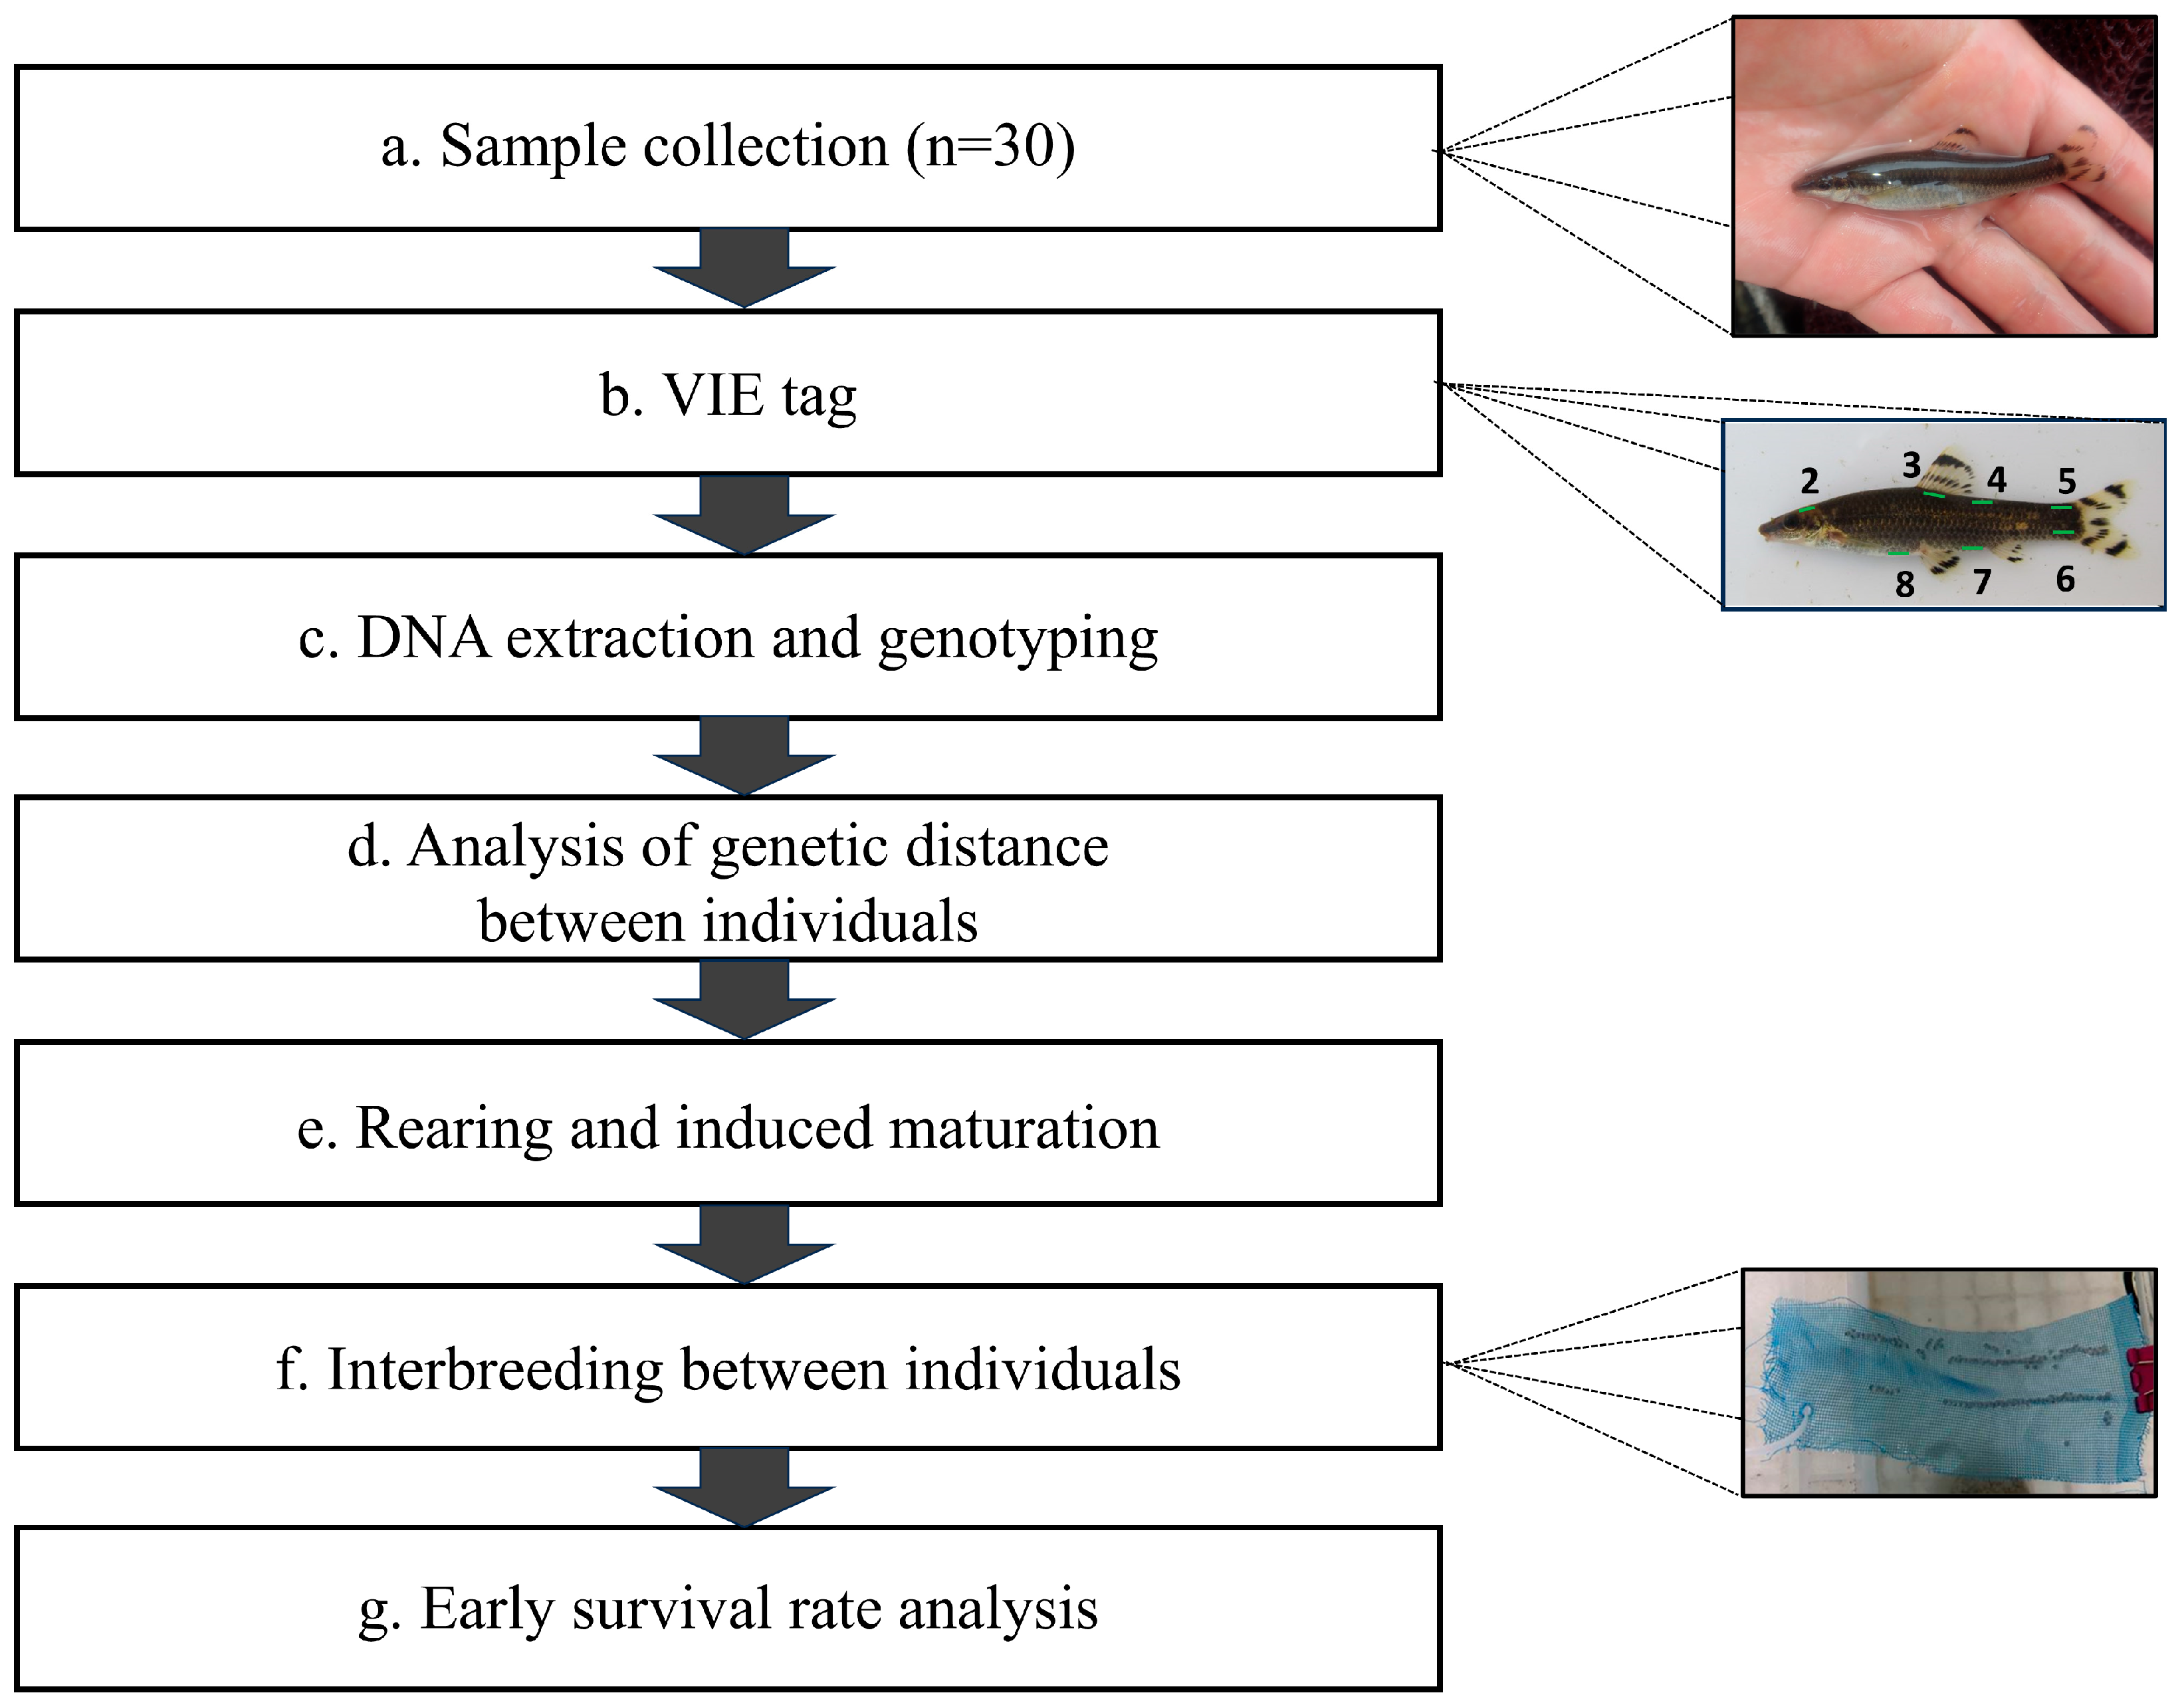
Previous studies on a variety of freshwater and marine fishes have reported high retention of visible implant elastomer (VIE) tags (typically >90–100%) over periods of several months to at least six months, with negligible effects on growth or survival [35]. In this study, fluorescent VIE tags were therefore used to pre-identify broodstock individuals for subsequent genotype verification. Tags were coded by color (green, orange), placement (head; below the dorsal fin; behind the dorsal fin; above the caudal peduncle; below the caudal peduncle; anterior to the anal fin; anterior to the pelvic fin), and laterality (left, right) to uniquely mark each fish (Figure 2). After tagging, broodstock were held in 100 L glass aquaria equipped with PVC shelters. Water temperature was maintained at 18.0 ± 0.5 °C, and commercial pellets and frozen animal feed were provided to induce maturation. The overall workflow from sampling through VIE tagging, genotyping, genetic-distance-based crossing, and early survival analysis is summarized in Figure 3.

2.3. Genomic DNA Extraction from Broodstock and Measuring Genetic Distance

For broodstock genotyping, 10 mg of tissue was excised from the least-damaged pelvic fin. Fish were anesthetized in 100 ppm tricaine methane sulfonate (MS-222) at 18 °C for 5 min, after which a portion of the pelvic fin was clipped and preserved in 99.9% ethanol. Genomic DNA was extracted from ethanol-preserved fins using a commercial kit (Genomic DNA Prep Kit, BioFact, Seoul, Republic of Korea) following the manufacturer’s instructions, quantified with a NanoDrop ND-1000 (Thermo Scientific, Waltham, MA, USA), diluted to working concentration (50 ng), and stored at 4 °C.
Of the twenty microsatellite markers developed previously [12,36], ten markers suitable for broodstock genotyping were selected (Table 1). We selected 10 markers because they showed moderate to high polymorphism (PIC value), which is suitable for estimating genetic diversity and genetic distance between individuals. PCRs were performed with Multiplex PCR Premix (Bioneer Inc., Daejeon, Republic of Korea) in 20 µL reactions containing 50 ng genomic DNA and 10 µM primers. Thermal cycling consisted of 94 °C for 5 min; 34 cycles of 94 °C for 30 s; 57.5 °C for 30 s; and 72 °C for 30 s, and a final extension at 72 °C for 7 min. Amplicons were verified on 1.5% agarose gels, sized on a Fragment Analyzer (Advanced Analytical Technologies, Ankeny, IA, USA), and allele calls were made in PROSize v3.0 (Ankeny, IA, USA, Advanced Analytical Technologies).
Thirty fish were collected, but two died during rearing, so only twenty eight were used for genetic distance analysis. Genetic distances among broodstock (28 genotypes in total) were computed as Nei’s genetic distance [37] using GenAlEx v6.50 [38].

2.4. Production of Crossbred Group Based on Genetic Distance

Thirty individuals were collected, but two died during rearing, so only twenty eight individuals were used. For the purposes of this study, we defined “high genetic distance (HGD)” as parental pairs located in the upper range of the Nei’s D distribution among broodstock, and “low genetic distance (LGD)” as parental pairs located in the lower range. Pairwise genetic distances among broodstock ranged from 7 to 24 (Table 2). Accordingly, the pairs with distances of 19 and 20 (M14–F12, M8–F9) were designated as high genetic distance (HGD), whereas the pairs with distances of 9 and 11 (M6–F6, M12–F10) were designated as low genetic distance (LGD) (Table 2). Because it was not feasible to perform artificial crosses for all possible female–male combinations, we restricted the experiment to a limited number of mating groups. Among broodstock pairs in which both sexes were simultaneously sexually mature and in good condition and could produce sufficient eggs and milt for artificial spawning, we selected the pairs with genetic distances of 19 and 20, as well as those with the minimum distances of 9 and 11.
To produce the HGD and LGD crossbred groups, spawning was induced artificially. Ovulation was induced by intramuscular injection of Ovaprim (Syndel, Nanaimo, BC, Canada) at 0.5 mL/kg into the epaxial muscles using an insulin syringe. Injected fish were held in 40 L plastic tanks at 21.0 ± 0.5 °C, and spawning readiness was checked 12 h post-injection by gentle abdominal pressure.
Artificial fertilization followed the dry method [39], pairing one female with one male according to the assigned genetic-distance group. Fertilized eggs were attached to 15 × 15 cm spawning frames and transferred to 20 L plastic tanks. A submersible pump provided gentle flow, and aeration was supplied. Water was exchanged twice daily (morning and afternoon), and dead eggs or those with fungal infections were removed.

2.5. Genetic Diversity and Early Survival in the Crossbred Group

We performed statistical and visualization analyses to determine the genetic diversity information and structure of the crossbred group and broodstock. Expected (HE) and observed heterozygosity (HO) were calculated in Cervus v3.0 using default options [40]. The inbreeding coefficient (FIS) of F1 progeny (first-generation progeny) and broodstock from the genetic-distance-defined crossbred group was estimated in Arlequin v3.5 [41] with significance tested using 10,000 permutations.
Tests for departure from PHWE (probability of Hardy–Weinberg equilibrium) in GENEPOP v4.2 were conducted using the default Markov-chain parameters. The analyses were performed using GENEPOP v4.2 [42]. Two methods were used to estimate bottlenecks. The method involved the BOTTLENECK software v1.2.02 [43], a program for estimating bottlenecks through heterozygous excess testing, and recent bottlenecks were tested under the infinite allele model (IAM). A two-phase model (TPM) and stepwise mutation model (SMM) were used to estimate, and TPM was performed with 10% variance and 90% SMM. In addition, each model had 10,000 iterations, and significance was verified using the Wilcoxon signed-rank test. The effective population size (Ne) was estimated in NeEstimator v2 [44] using the linkage-disequilibrium method under a random-mating model, with a critical allele frequency threshold of Pcrit = 0.02.
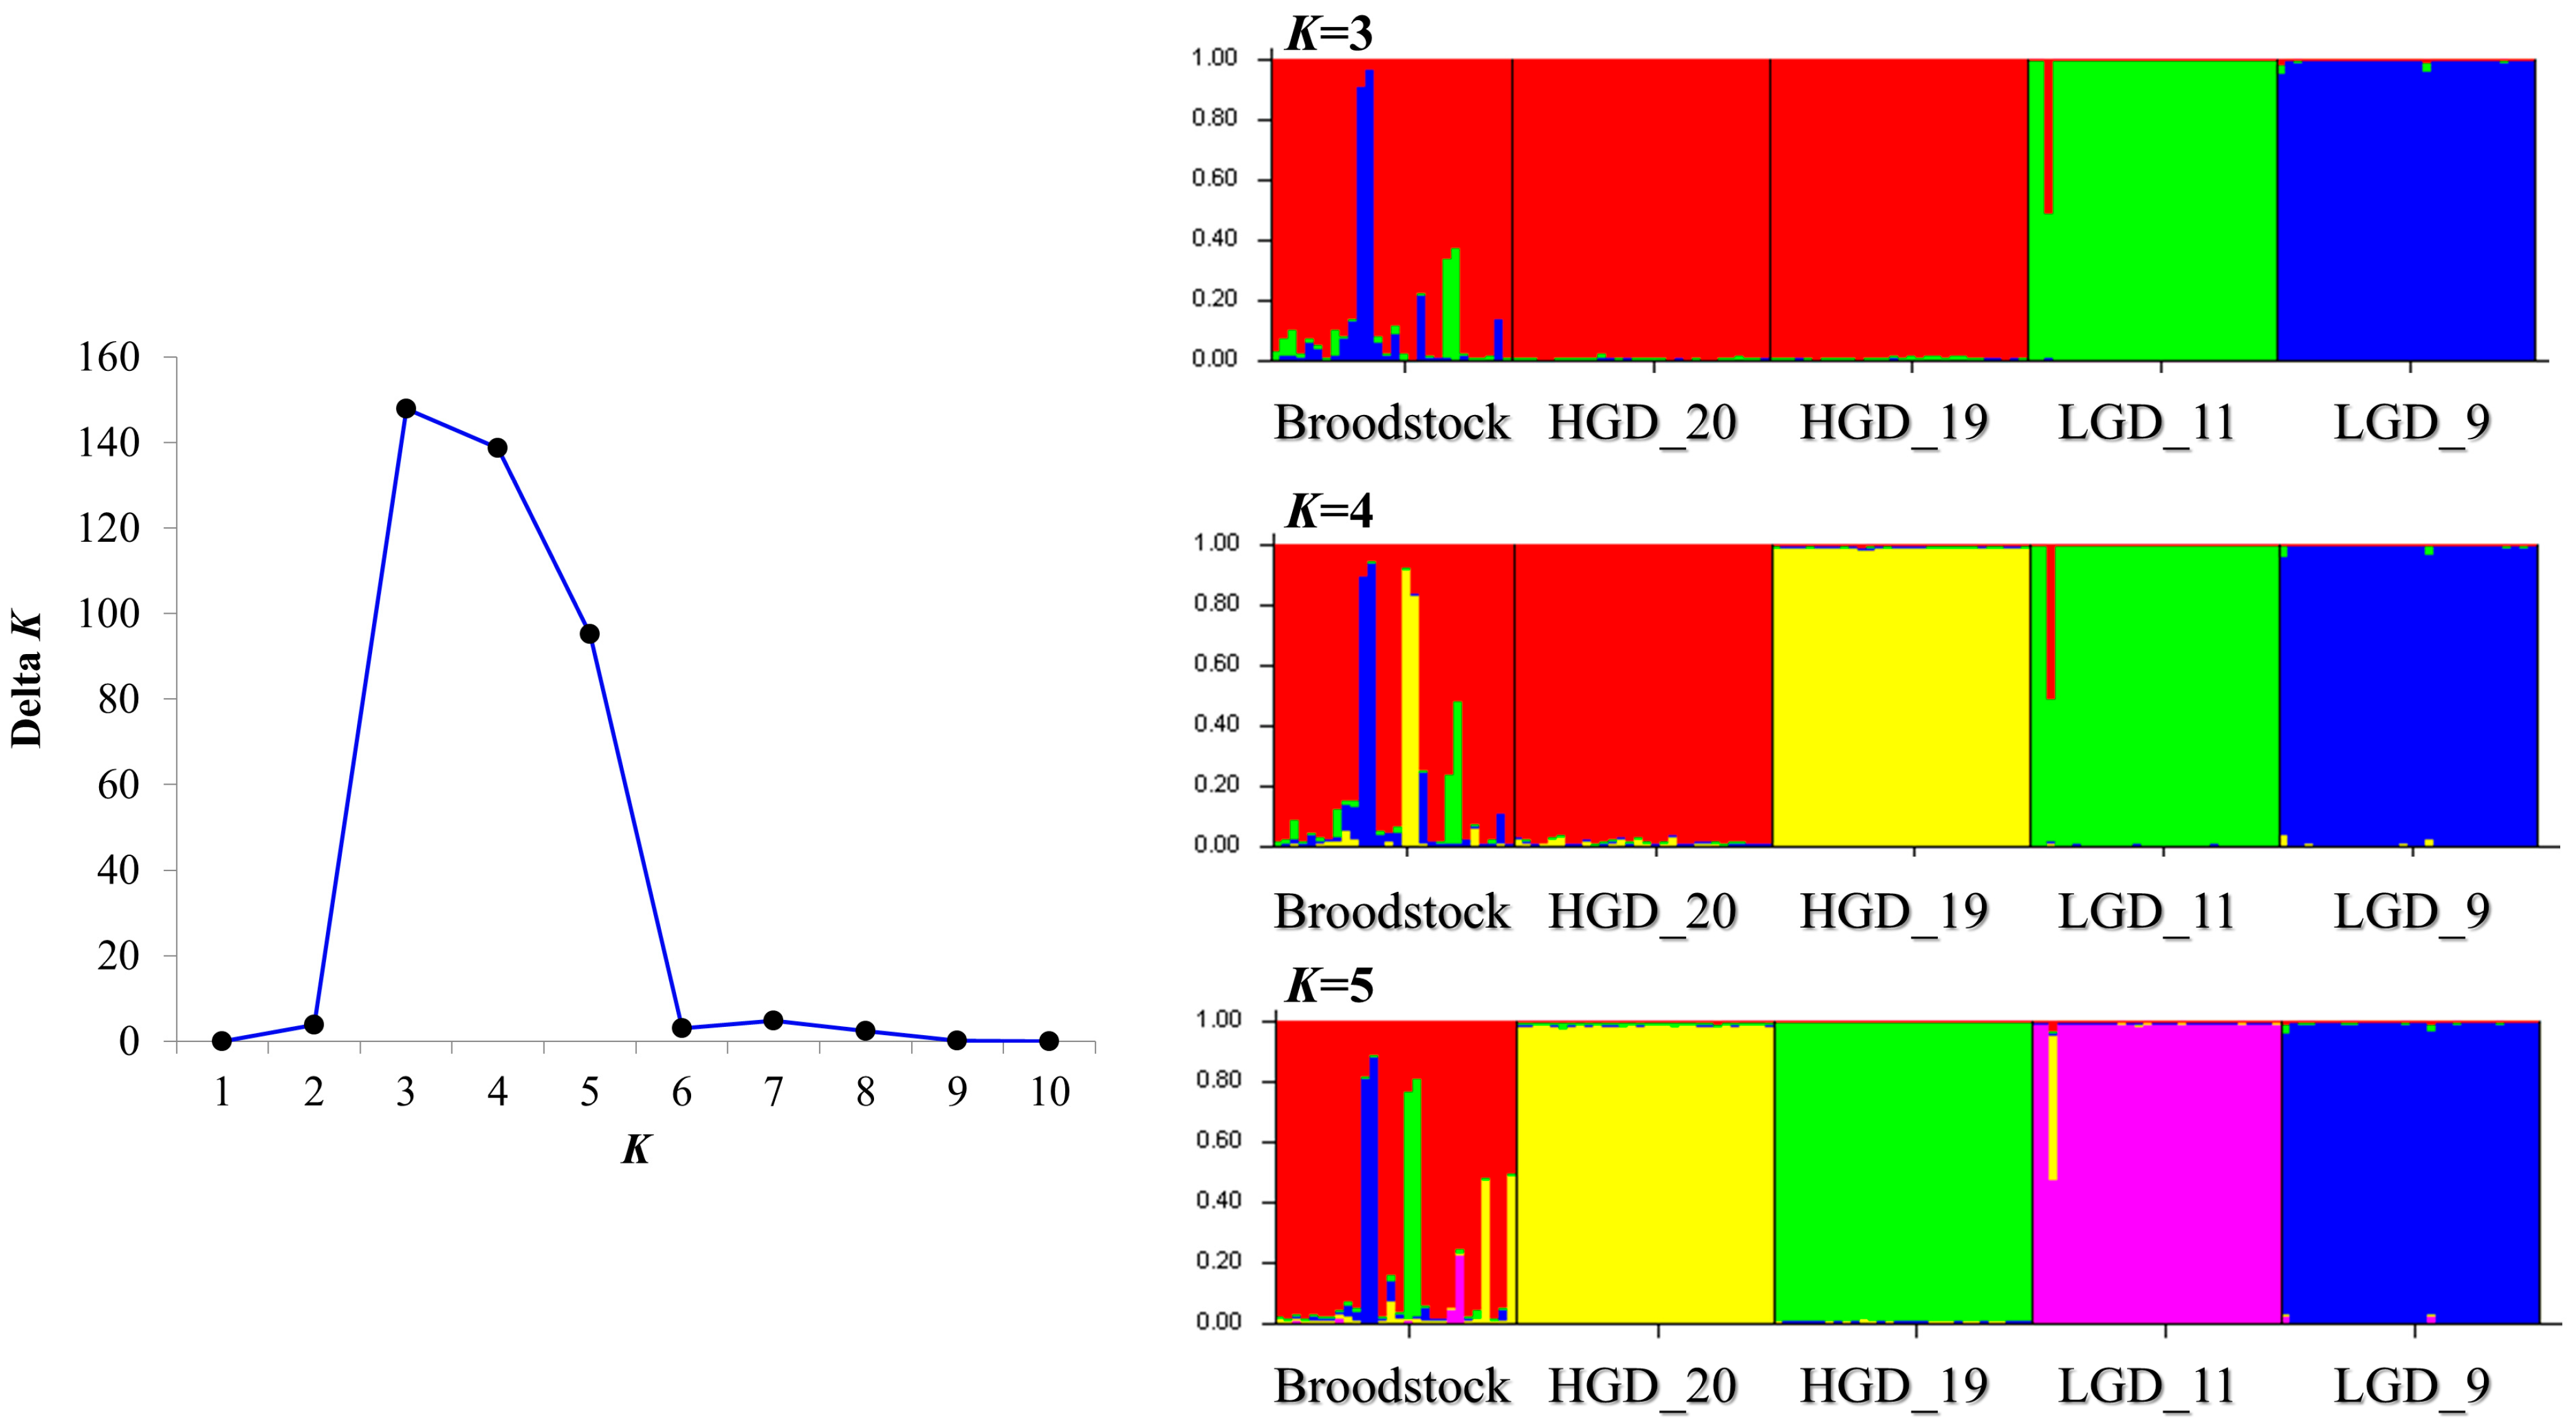
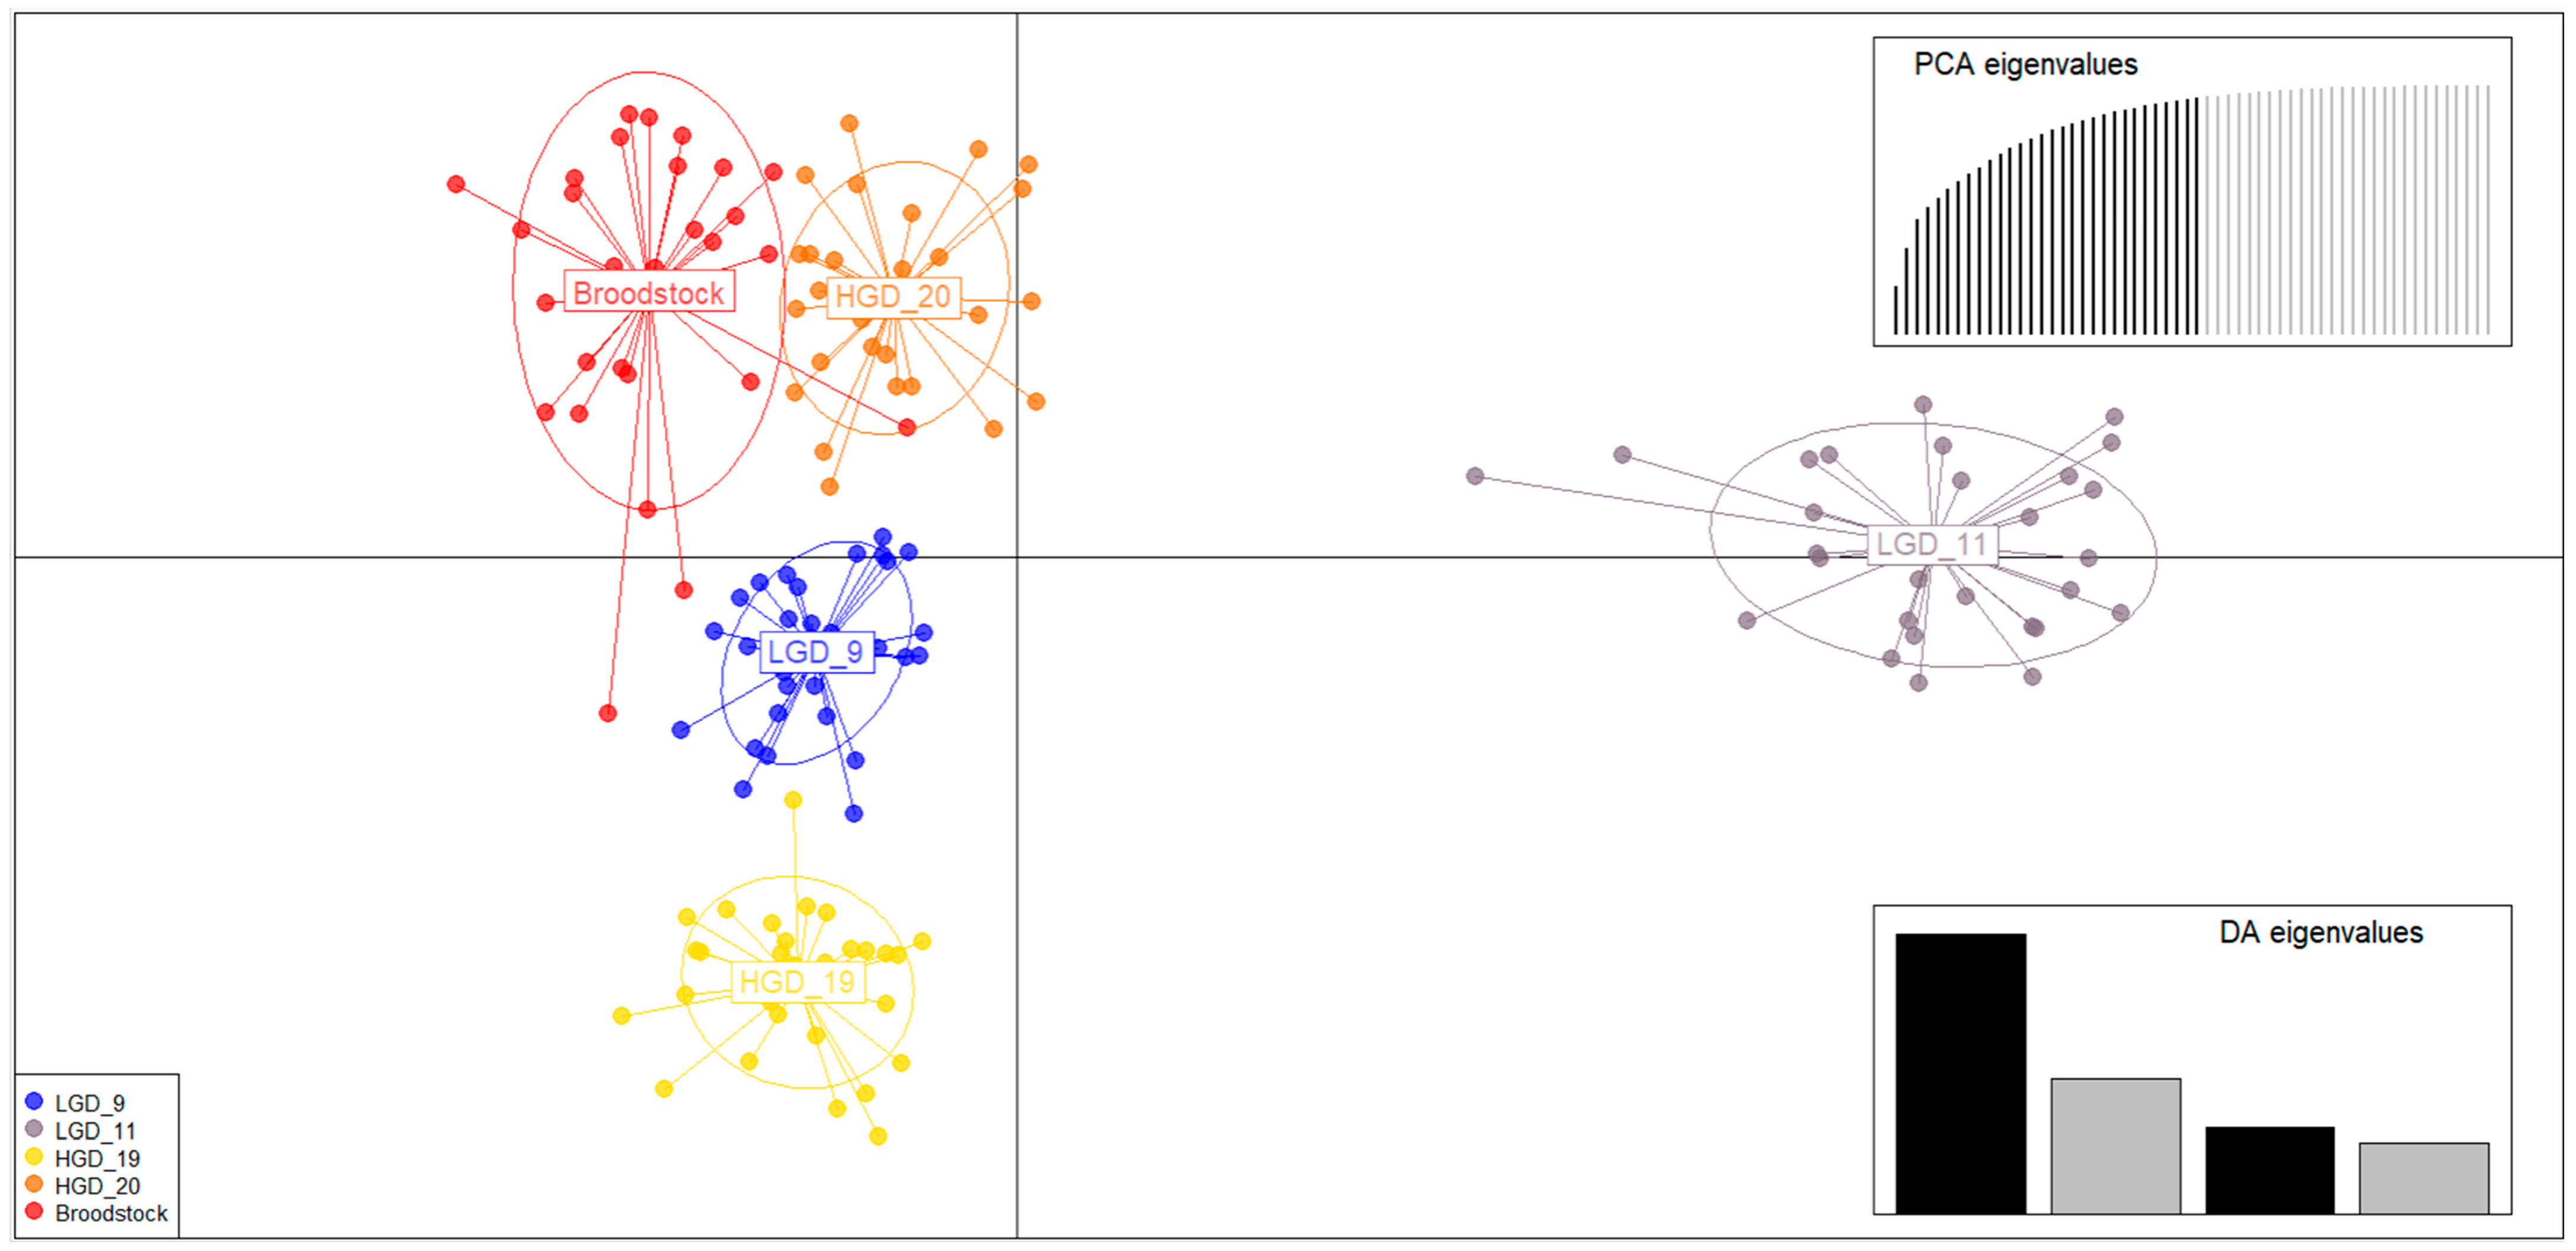
Bayesian clustering was performed in STRUCTURE v2.3 [45]. We evaluated K = 1–10 under an admixture model suitable for mixed drainages, running 10 replicate analyses per K with a burn-in of 10,000 and 100,000 MCMC iterations. The most supported K was identified with STRUCTURE SELECTOR [46] based on the clustering outputs. In parallel, we carried out discriminant analysis of principal components (DAPC) on the microsatellite dataset using the R package adegenet v2.1.3 [47], a non-model-based clustering approach. The number of principal components retained was 80.
We examined hatching and survival rates to determine initial survival rates according to crossbred groups. The hatching time was defined as the point at which all eggs (100%) had hatched at 20.0 ± 0.5 °C, and the hatching rate was calculated as the percentage of hatched larvae relative to the total number of eggs. Survival rate was assessed at the completion of yolk-sac absorption and calculated as the percentage of surviving larvae relative to the number hatched.
Each crossbred group (HGD_20, HGD_19, LGD_11, and LGD_9) was maintained in a single incubation tank to minimize environmental variation, and eggs were divided into three well-aerated plastic mesh hatching nets so that hatching and survival rates could be estimated separately for three replicates under identical tank conditions. Statistical analyses were performed in SPSS v12.0 (SPSS Inc., Chicago, Illinois) using one-way ANOVA. Because homogeneity of variance was not met for survival rate, post hoc comparisons used Dunnett T3; because homogeneity was met for hatching rate, Duncan’s multiple range test was applied (p < 0.05).
First-generation progeny (F1) larvae produced from each crossbred group were sampled at the time survival was assessed. For each crossbred group, 29 to 30 larvae were randomly selected, preserved whole in 99.9% ethanol, and stored at 4 °C. Genomic DNA was extracted from whole larvae in 1.5 mL microtubes using the PCRBIO Rapid Extract Lysis Kit (PCR Biosystems, London, UK) following the manufacturer’s protocol and used for genetic diversity analyses.
First-generation progeny (F1) genotypes were determined with the same ten microsatellite markers used for broodstock genotyping (Table 2). PCR conditions were identical to those in Section 2.3. Genotyping was analyzed on an ABI 3730xl DNA Analyzer (Applied Biosystems, Foster City, CA, USA). Allele sizes were scored with Peak Scanner software v1.0 (Applied Biosystems, Foster City, CA, USA).

2.6. Ethical Approval

All procedures involving live P. nigra followed the guidelines for the care and use of experimental animals of Soonchunhyang University (2018-35). Collection, handling, and release of P. nigra were authorized by the Geumgang River Basin Environmental Office and the Jeonbuk Regional Environmental Office of the Ministry of Environment (permit nos. 2018-35, 2019-26, 2018-16, and 2019-15).

3. Results

3.1. Genetic Diversity Analysis Broodstock and Crossbred Group Based on Genetic Distance

Genetic diversity analysis showed the broodstock had a mean number of alleles (NA) of 5.8; HGD crossbred group, 2.7 to 2.9; and LGD, 2.6 to 2.9 (Table 3). Expected heterozygosity (HE) was 0.739 in the broodstock, 0.549 to 0.557 in HGD, and 0.469 to 0.538 in LGD. Observed heterozygosity (HO) was 0.697 in the broodstock, 0.787 to 0.800 in HGD, and 0.573 to 0.638 in LGD. According to genetic distance, both HGD and LGD exceeded HO compared to HE, and broodstock had HO smaller than HE. The inbreeding coefficient (FIS) was 0.058 for the broodstock, −0.445 to 0.448 for HGD, and −0.190 to 0.227 for LGD. Hardy−Weinberg equilibrium tests indicated no departure in the broodstock, whereas both HGD and LGD deviated.
Broodstock exhibited significant bottleneck signals under IAM, TPM, and SMM, and both HGD and LGD crossbred groups also showed evidence of recent bottlenecks (Table 4). Effective population size (Ne) was infinite for the broodstock and for HGD, whereas LGD had an Ne of 65 or 114.

3.2. Analysis of Genetic Structure of Crossbred Groups and Broodstocks

The broodstock showed the lowest pairwise differentiation with HGD_20 (FST = 0.105). Pairwise FST with HGD_19, LGD_11, and LGD_9 ranged from 0.152 to 0.201. Across the crossbred groups, FST showed intermediate levels of genetic differentiation, ranging from 0.224 to 0.371 (Table 5).
Pairwise genetic differentiation significant level p-values (above), FST: pairwise genetic differentiation of microsatellite (below).
STRUCTURE analysis supported K = 3 as the best model, with secondary modes at K = 4 and K = 5. At K = 3, broodstock assignment profiles most closely resembled HGD_20 and HGD_19 (Figure 4). At K = 4, broodstock aligned chiefly with HGD_20. At K = 5, HGD and LGD resolved into distinct clusters, while broodstock appeared admixed. The DAPC scatterplot using a non-model estimate indicated that broodstock clustered closest to HGD_20, while LGD_9, LGD_11, and HGD_19 were well separated from one another (Figure 5).

3.3. Early Survival Analysis of the Crossbred Group

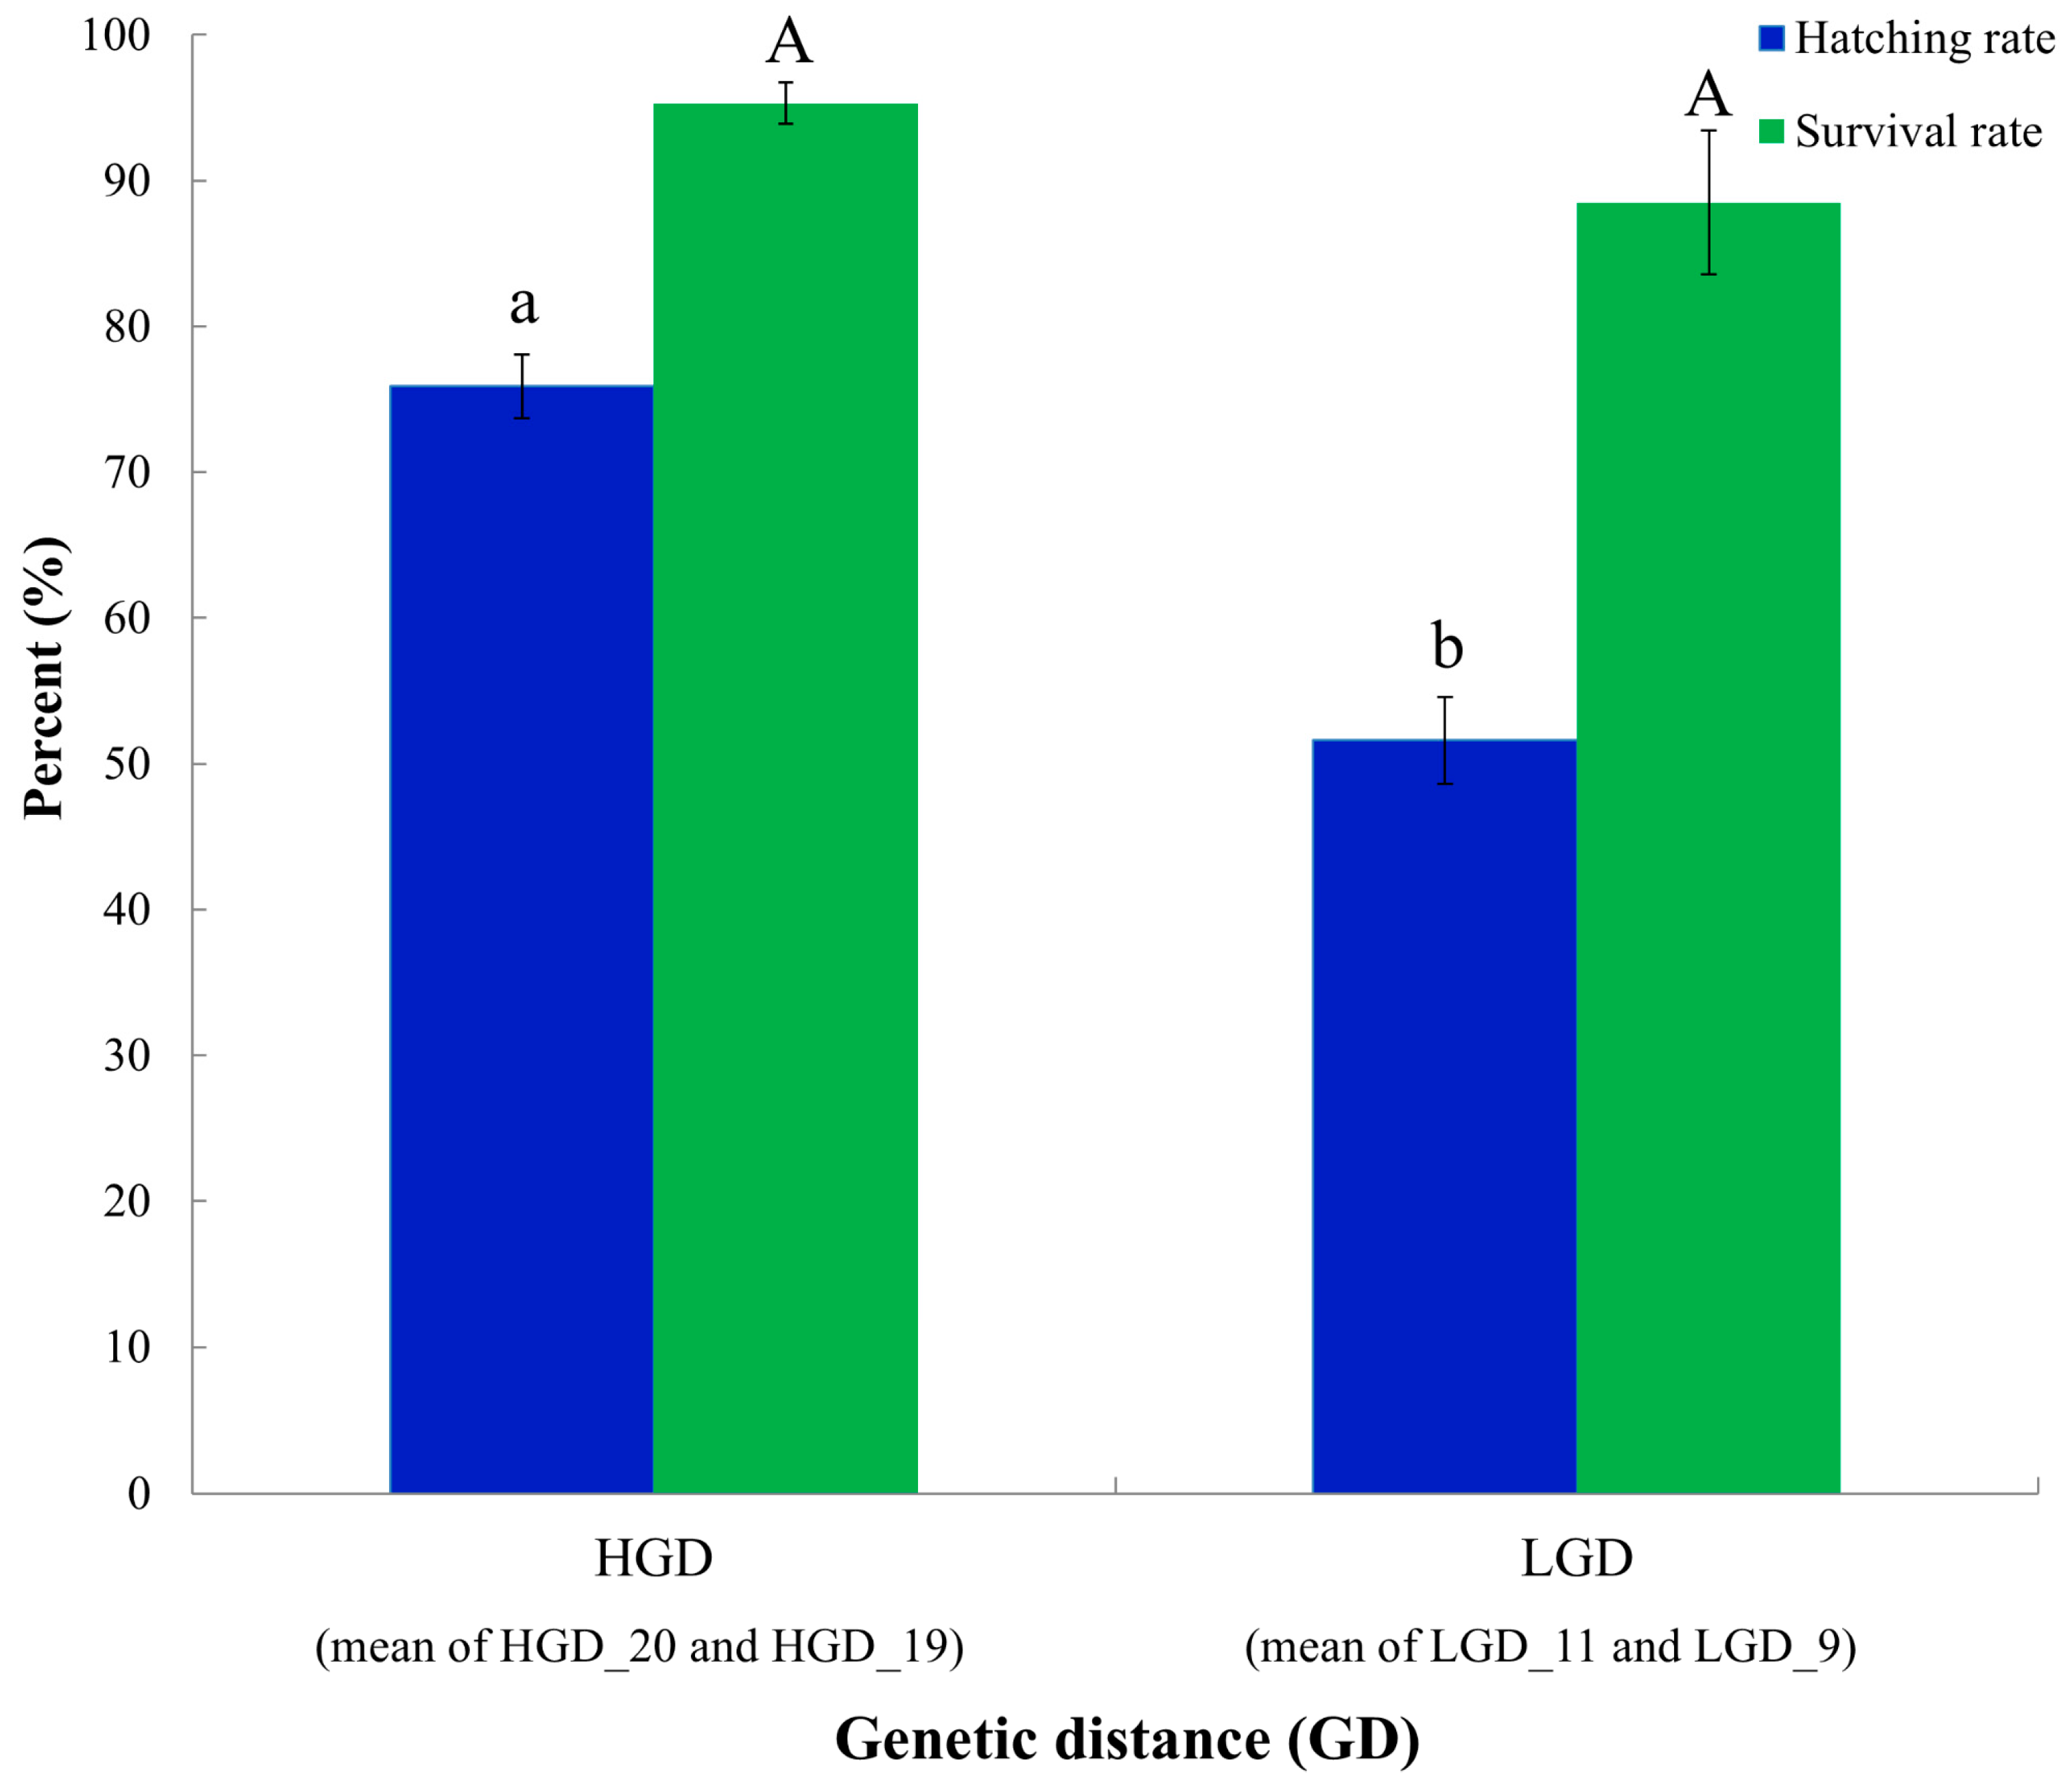
Mean hatching rate analysis by genetic distance showed 77.4 ± 8.7% for HGD_20 and 74.3 ± 9.6% for HGD_19, versus 49.1 ± 9.2% for LGD_9 and 54.0 ± 12.6% for LGD_11 (Figure 6). When averaged across crossbred groups, HGD crosses showed a higher hatching rate (75.9 ± 6.5%) than LGD crosses (51.6 ± 7.8%). Hatching rate was significantly higher in HGD than in LGD (p < 0.05; p-value: 0.001) and tended to increase with larger genetic-distance values, yielding an approximately 1.5-fold advantage for HGD over LGD.
Survival rate did not differ significantly among groups (p > 0.05; P-value: 0.166): 94.0 ± 4.4% (HGD_20), 96.0 ± 5.2% (HGD_19), 85.0 ± 4.6% (LGD_9), and 92.0 ± 5.3% (LGD_11). When averaged across crossbred groups, HGD crosses showed a slightly higher survival rate (95.0 ± 3.1%) than LGD crosses (88.5 ± 3.5%). Taken together with the higher observed heterozygosity of HGD crossbred groups compared with LGD (Table 3), these patterns indicate that crosses between more genetically distant parents can increase heterozygosity and improve hatching performance without compromising early survival, which is advantageous for restoration programs that aim to release genetically diverse but viable offspring.

4. Discussion

4.1. Genetic Diversity of Crossbred Groups According to Genetic Distance

Because crossbred groups are generated by 1:1 matings between selected broodstock pairs, they carried fewer alleles on average than the broodstock population, presumably because not all rare parental alleles can be transmitted under this design [19]. Consistent with this, both the mean number of alleles and HE are lower in HGD and LGD than in the broodstock, whereas NA and HE are similar between the two crossbred groups [48]. In both HGD and LGD, HO exceeds HE, a pattern typical of artificially selected or managed crosses [28]. HGD shows higher HO than LGD, indicating greater heterozygosity and indirectly suggesting that the HGD crossbred group retains relatively more genetic diversity than the LGD crossbred group [17,43].
While the broodstock population exhibits positive FIS, both the HGD and LGD groups exhibit negative values. In particular, HGD_20 and HGD_19 exhibit high FIS values, suggesting genetic outcrossing. This genetic outcrossing between distantly related individuals has been reported to be associated with improved hatching and survival rate [25]. It is primarily associated with environmental adaptability, with reports suggesting that outcrossing enhances adaptability [8,26,49,50]. Therefore, the HGD and LGD populations identified in this study are likely to exhibit differences in adaptability. However, caution is needed regarding the possibility of reduced adaptability due to outcrossing depression between populations that are genetically too distant [22].
In the broodstock population, HWE does not deviate, indicating that the current population is approximately in genetic equilibrium and that allele frequencies are expected to remain stable across generations under random mating [51,52]. However, BOTTLENECK analyses show significant heterozygosity excess under all three mutation models (IAM, TPM, SMM; all Wilcoxon p < 0.001) and a shifted allele frequency mode not only in the broodstock but also in all crossbred groups (Table 4), indicating a recent reduction in effective size in which rare alleles are lost more rapidly than HE declines [18,43]. The broodstock used in this study were derived from the YD (2019) population sampled in 2019, which has previously been shown to exhibit pronounced historical and recent bottlenecks and elevated inbreeding based on microsatellite loci analyses [12]. Thus, the reduced genetic diversity and strong bottleneck signals detected in our broodstock and crossbred groups are more likely to reflect the demographic history of this source population than a novel bottleneck created by sampling 30 individuals for artificial propagation [12]. Given that P. nigra is an endangered species with small and fragmented populations, long-term reductions in effective population size at YD may constrain the genetic variation available for broodstock formation and subsequent crosses [12]. This suggests that the bottleneck phenomenon in the broodstock population has also spread to the HGD and LGD groups [48,53,54].
The “infinite” LD-based Ne estimates for broodstock and HGD most likely reflect estimation limits rather than truly very large Ne; a weak LD signal driven by small sample size, MAF filtering, and related factors can push LD-Ne to infinity [44,55,56]. When genetically distant individuals are crossed, hidden substructure (admixture) can arise, inflating inter-locus LD and biasing recent LD-Ne downward [44,55,56]. Conversely, mating among closely related individuals can increase family-size variance through inbreeding effects, reducing recent Ne [3,57]. In supplementation programs or small-broodstock systems of inbred populations, an increase in the apparent number of adults can even lower Ne [53,57,58]. Such effects are not merely theoretical: in supplemented salmonid populations, supportive breeding has been shown to double the census number of spawners while reducing the overall effective population size of the wild-plus-hatchery system by about two-thirds, illustrating how variance in family size and LD inflation can severely depress Ne despite apparent demographic gains [53,58].

4.2. Genetic Structure of Crossbred Groups According to Genetic Distance

Crossbred groups produced on the basis of genetic distance showed the smallest genetic differences from the broodstock, indicating that HGD and LGD progenies are largely derived from the existing broodstock gene pool. Among them, HGD_20 exhibited the lowest FST and cluster assignments most similar to the broodstock, suggesting that this crossbred group is genetically closest to the parental population [59]. Taken together, the FST, STRUCTURE (K = 3), and DAPC results consistently indicate that the broodstock and HGD_20 form a genetically similar cluster, whereas HGD_19, LGD_11, and LGD_9 are more differentiated.
The primary objective of this study is to generate crossbred groups that differ in genetic distance while remaining genetically comparable to the broodstock population. Consistent with this objective, the broodstock shows the lowest pairwise differentiation with HGD_20 and slightly higher differentiation with HGD_19 (FST = 0.105–0.152), indicating that these high-distance crosses retain relatively greater similarity to the source population than the LGD groups, even though all pairwise FST values still fall within the range of moderate genetic differentiation among groups. Thus, our genetic-distance-based crossing scheme produces crossbred groups that differ in genetic distance while maintaining a moderate level of genetic similarity to the broodstock. Although this study achieves its primary objective, future genetic-distance-based crossing schemes could produce crossbred groups that differ more markedly in their genetic similarity to the source population [13,60,61]. This possibility is a critical consideration for restoration programs targeting endangered species. In such species, where artificial crossing is unavoidable because of limited population size, the practical goal is to generate crossbred populations that maximize genetic diversity while avoiding excessive genetic divergence among crossbred groups and between crossbred groups and the source population. Future work therefore needs to integrate both genetic distance and similarity to the maternal population when selecting broodstock, and to evaluate the performance of such schemes across multiple endangered populations [62,63].

4.3. Initial Survival Rate by Crossbred Group Produced According to Genetic Distance

To evaluate the effect of increased parental genetic distance on hybrid vigor, we compared hatchability and survival between crossbred groups generated from high (HGD; Nei’s distance = 19–20) and low (LGD; Nei’s distance = 9–11) genetic-distance pairs. We find that hatching rate was 1.5-fold higher in HGD than in LGD. This result has also been reported in several marine taxa [25,27]. However, we find no significant difference in survival rates. Similar cases have been reported in other taxa, which may also be due to environmental factors [64]. Hatching rate is sensitive to embryo quality during fertilization and embryonic development, as well as mating combination effects (heterologous vigor, maternal effects, and accumulation of defects during embryonic development) [65,66]. Survival, on the other hand, is governed by environmental and predator interactions immediately after hatching [67,68]. Because P. nigra fry exhibit swimming characteristics immediately after hatching [11,12], stable space between crossbred groups (HGD and LGD) may reduce differences in survival rates during the post-hatch stage.
Mate compatibility is thought to be the cause of the hatchability differences between HGD and LGD groups [69,70]. Mate compatibility is related to fertilization success, hatchability, and early larval survival, and these traits are influenced by the fitness of both males and females [69,70]. This suggests that the favorable combination of maternal egg and paternal genome compatibility in HGD pairs likely contributes to the high hatchability observed in this study.
From a management perspective, our results indicate that crosses between high genetically distant parents (HGD) can increase heterozygosity and hatching performance while maintaining close genetic similarity to the broodstock, making them suitable candidates for producing release in P. nigra restoration programs. In practical terms, broodstock management could prioritize pairing schemes that avoid very closely related individuals (LGD-type crosses) and instead target an high range of genetic distances, while routinely monitoring heterozygosity and allelic richness to prevent loss of diversity across generations. These strategies are consistent with conservation, breeding, and management practices for other endangered fish species. Carefully designed crossbreeding has been shown to improve the fitness of reintroduced or supplemented populations and reduce genetic risk, and can be directly integrated into ongoing P. nigra release and habitat restoration efforts. We suggest that future studies include more variables, such as fertilization rate, hatching rate, survival rate, and 7-day survival rate.

5. Conclusions

This study shows that crosses between genetically distant broodstock pairs (HGD) achieved markedly higher hatching rates than crosses between closely related pairs (LGD), while retaining genetic compositions broadly similar to the broodstock population. These results indicate that using an appropriate intermediate range of genetic distances among parents can serve as a practical guideline for designing artificial crosses in Pseudopungtungia nigra restoration programs, enhancing heterosis and hatching success without causing excessive genetic divergence from the source population. Future work should increase the number of maternal families and apply genome-wide markers (e.g., SNP panels) to refine the optimal genetic distance for crossing and to track how genetic diversity and fitness respond over time in restored populations.

Author Contributions

Conceptualization, K.-R.K. and I.-C.B.; methodology, K.-R.K. and I.-C.B.; software, K.-R.K.; validation, K.-R.K.; formal analysis, K.-R.K.; investigation, K.-R.K.; resources, K.-R.K.; data curation, K.-R.K.; writing—original draft preparation, K.-R.K.; writing—review and editing, K.-R.K.; visualization, K.-R.K.; supervision, K.-R.K. and I.-C.B.; project administration, I.-C.B.; funding acquisition, I.-C.B. All authors have read and agreed to the published version of the manuscript.

Funding

This research was a part of the project Soonchunhyang University, Republic of Korea (2025).

Institutional Review Board Statement

All procedures involving live P. nigra followed the guidelines for the care and use of experimental animals of Soonchunhyang University (2018-35). Additionally, Geumgang River Basin Environmental Office (permit nos.: 2018-35, date: 1 September 2018; permit nos.: 2019-26, date: 2 October 2019) and Jeonbuk Regional Environmental Office of the Ministry of Environment (permit nos.: 2018-16, date: 4 October 2018; permit nos.: 2019-15, date: 13 November 2019) authorized collection, handling, and release of P. nigra.

Data Availability Statement

The data presented in this study are available on request from the corresponding author.

Conflicts of Interest

The authors declare no conflicts of interest.

References

  1. Waples, R.S. The Ne/N ratio in applied conservation. Evol. Appl. 2024, 17, e13695. [Google Scholar] [CrossRef] [PubMed]
  2. Frankham, R.; Bradshaw, C.J.; Brook, B.W. Genetics in conservation management: Revised recommendations for the 50/500 rules, Red List criteria and population viability analyses. Biol. Conserv. 2014, 170, 56–63. [Google Scholar] [CrossRef]
  3. Waples, R.S.; Hindar, K.; Karlsson, S.; Hard, J.J. Evaluating the Ryman-Laikre effect for marine stock enhancement and aquaculture. Curr. Zool. 2016, 62, 617–627. [Google Scholar] [CrossRef]
  4. Mignien, L.; Stoll, S. Reproductive success of stream fish species in relation to high and low flow patterns: The role of life history strategies and species traits. Sci. Total Environ. 2024, 946, 174366. [Google Scholar] [CrossRef]
  5. Brauer, C.J.; Beheregaray, L.B. Recent and rapid anthropogenic habitat fragmentation increases extinction risk for freshwater biodiversity. Evol. Appl. 2020, 13, 2857–2869. [Google Scholar] [CrossRef]
  6. Tringali, M.D. Reproductive Success Dynamics Could Limit Precision in Close-Kin Mark–Recapture Abundance Estimation for Atlantic Goliath Grouper (Epinephelus itajara). Fishes 2023, 8, 254. [Google Scholar] [CrossRef]
  7. Clarke, J.G.; Smith, A.C.; Cullingham, C.I. Genetic rescue often leads to higher fitness as a result of increased heterozygosity across animal taxa. Mol. Ecol. 2024, 33, e17532. [Google Scholar] [CrossRef]
  8. Lutz, M.L.; Tonkin, Z.; Yen, J.D.L.; Johnson, G.; Ingram, B.A.; Sharley, J.; Lyon, J.; Chapple, D.G.; Sunnucks, P.; Pavlova, A. Using multiple sources during reintroduction of a locally extinct population benefits survival and reproduction of an endangered freshwater fish. Evol. Appl. 2021, 14, 950–964. [Google Scholar] [CrossRef]
  9. Mamoozadeh, N.R.; Wade, M.J.; Reid, B.N.; Bardwell, E.; Collins, E.E.; Hugentobler, S.A.; Jackson, S.A.; Kline, B.C.; Rothkopf, H.E.; Zhang, A. A practical introduction to effective population size for fisheries management. Trans. Am. Fish. Soc. 2025, 154, 352–371. [Google Scholar] [CrossRef]
  10. Akers, M.; Quinlan, H.; Johnson, A.; Baker, E.; Welsh, A. Parentage Analysis Reveals Unequal Family Sizes during Hatchery Production. Fishes 2023, 8, 140. [Google Scholar] [CrossRef]
  11. Lee, S.-H.; Han, G.-H.; Yun, S.-M.; Hwang, D.-S.; Yu, D.-J.; Lee, C.-R.; Kim, I.-S.; Son, Y.-M. Early life history and spawning behavior of Pseudopungtungia nigra. Korean J. Ichthyol. 2004, 16, 309–316. [Google Scholar]
  12. Kim, K.R.; Kwak, Y.H.; Sung, M.S.; Cho, S.J.; Bang, I.C. Population structure and genetic diversity of the endangered fish black shinner Pseudopungtungia nigra (Cyprinidae) in Korea: A wild and restoration population. Sci. Rep. 2023, 13, 9692. [Google Scholar] [CrossRef] [PubMed]
  13. Hoffmann, A.A.; Miller, A.D.; Weeks, A.R. Genetic mixing for population management: From genetic rescue to provenancing. Evol. Appl. 2021, 14, 634–652. [Google Scholar] [CrossRef] [PubMed]
  14. Sexton, J.P.; Clemens, M.; Bell, N.; Hall, J.; Fyfe, V.; Hoffmann, A.A. Patterns and effects of gene flow on adaptation across spatial scales: Implications for management. J. Evol. Biol. 2024, 37, 732–745. [Google Scholar] [CrossRef]
  15. Kardos, M.; Armstrong, E.E.; Fitzpatrick, S.W.; Hauser, S.; Hedrick, P.W.; Miller, J.M.; Tallmon, D.A.; Funk, W.C. The crucial role of genome-wide genetic variation in conservation. Proc. Natl. Acad. Sci. USA 2021, 118, e2104642118. [Google Scholar] [CrossRef]
  16. Floriani, T.; Lipka, A.E. Rare variants in crops: Theoretical insights and emerging detection strategies. Silico Plants 2025, 7, diaf012. [Google Scholar] [CrossRef]
  17. Maruyama, T.; Fuerst, P.A. Population bottlenecks and nonequilibrium models in population genetics. II. Number of alleles in a small population that was formed by a recent bottleneck. Genetics 1985, 111, 675–689. [Google Scholar] [CrossRef]
  18. Luikart, G.; Allendorf, F.W.; Cornuet, J.M.; Sherwin, W.B. Distortion of allele frequency distributions provides a test for recent population bottlenecks. J. Hered. 1998, 89, 238–247. [Google Scholar] [CrossRef]
  19. Busack, C.; Knudsen, C.M. Using factorial mating designs to increase the effective number of breeders in fish hatcheries. Aquaculture 2007, 273, 24–32. [Google Scholar] [CrossRef]
  20. Brown, K.T.; Southgate, P.C.; Loganimoce, E.M.; Kaure, T.; Stockwell, B.; Lal, M.M. Sandfish generations: Loss of genetic diversity due to hatchery practices in the sea cucumber Holothuria (Metriatyla) scabra. Aquaculture 2024, 578, 740048. [Google Scholar] [CrossRef]
  21. Frankham, R.; Ballou, J.D.; Eldridge, M.D.; Lacy, R.C.; Ralls, K.; Dudash, M.R.; Fenster, C.B. Predicting the probability of outbreeding depression. Conserv. Biol. 2011, 25, 465–475. [Google Scholar] [CrossRef]
  22. Edmands, S. Between a rock and a hard place: Evaluating the relative risks of inbreeding and outbreeding for conservation and management. Mol. Ecol. 2007, 16, 463–475. [Google Scholar] [CrossRef] [PubMed]
  23. Kobayashi, J.; Honda, R.; Hosoya, S.; Nochiri, Y.; Matsuzaki, K.; Sugimoto, K.; Nagano, A.J.; Kumagai, A.; Kikuchi, K.; Kurokawa, T. Genome-Assisted Gene-Flow Rescued Genetic Diversity Without Hindering Growth Performance in an Inbred Coho Salmon (Oncorhynchus kisutch) Population Selected for High Growth Phenotype. Mar. Biotechnol. 2025, 27, 38. [Google Scholar] [CrossRef]
  24. Reid, B.N.; Hofmeier, J.; Crockett, H.; Fitzpatrick, R.; Waters, R.; Fitzpatrick, S.W. Balancing Inbreeding and Outbreeding Risks to Inform Translocations Throughout the Range of an Imperiled Darter. Evol. Appl. 2025, 18, e70088. [Google Scholar] [CrossRef]
  25. Hedgecock, D.; Davis, J.P. Heterosis for yield and crossbreeding of the Pacific oyster Crassostrea gigas. Aquaculture 2007, 272, S17–S29. [Google Scholar] [CrossRef]
  26. Lutz, C.G.; Armas-Rosales, A.M.; Saxton, A.M. Genetic effects influencing salinity tolerance in six varieties of tilapia (Oreochromis) and their reciprocal crosses. Aquac. Res. 2010, 41, e770–e780. [Google Scholar] [CrossRef]
  27. Zheng, H.; Zhang, G.; Guo, X.; Liu, X. Heterosis between two stocks of the bay scallop, Argopecten irradians irradians Lamarck (1819). J. Shellfish Res. 2006, 25, 807–812. [Google Scholar] [CrossRef]
  28. Linløkken, A.N.; Johnsen, S.I.; Johansen, W. Genetic diversity of hatchery-bred brown trout (Salmo trutta) compared with the wild population: Potential effects of stocking on the indigenous gene pool of a Norwegian reservoir. Diversity 2021, 13, 414. [Google Scholar] [CrossRef]
  29. Pregler, K.C.; Obedzinski, M.; Gilbert-Horvath, E.A.; White, B.; Carlson, S.M.; Garza, J.C. Assisted gene flow from outcrossing shows the potential for genetic rescue in an endangered salmon population. Conserv. Lett. 2023, 16, e12934. [Google Scholar] [CrossRef]
  30. Feuerstein, C.A.; Kovach, R.P.; Kruse, C.G.; Jaeger, M.E.; Bell, D.A.; Robinson, Z.L.; Whiteley, A.R. Genetic variation and hybridization determine the outcomes of conservation reintroductions. Conserv. Lett. 2024, 17, e13049. [Google Scholar] [CrossRef]
  31. Wanzenböck, J.; Hopfinger, M.; Wanzenböck, S.; Fuxjäger, L.; Rund, H.; Lamatsch, D.K. First successful hybridization experiment between native European weatherfish (Misgurnus fossilis) and non-native Oriental weatherfish (M. anguillicaudatus) reveals no evidence for postzygotic barriers. NeoBiota 2021, 69, 29–50. [Google Scholar] [CrossRef]
  32. del Mar Ortega-Villaizan, M.; Noguchi, D.; Taniguchi, N. Minimization of genetic diversity loss of endangered fish species captive broodstocks by means of minimal kinship selective crossbreeding. Aquaculture 2011, 318, 239–243. [Google Scholar] [CrossRef]
  33. Sriphairoj, K.; Kamonrat, W.; Na-Nakorn, U. Genetic aspect in broodstock management of the critically endangered Mekong giant catfish, Pangasianodon gigas in Thailand. Aquaculture 2007, 264, 36–46. [Google Scholar] [CrossRef]
  34. Pavlova, A.; Beheregaray, L.B.; Coleman, R.; Gilligan, D.; Harrisson, K.A.; Ingram, B.A.; Kearns, J.; Lamb, A.M.; Lintermans, M.; Lyon, J. Severe consequences of habitat fragmentation on genetic diversity of an endangered Australian freshwater fish: A call for assisted gene flow. Evol. Appl. 2017, 10, 531–550. [Google Scholar] [CrossRef]
  35. Walsh, M.G.; Winkelman, D.L. Anchor and visible implant elastomer tag retention by hatchery rainbow trout stocked into an Ozark stream. N. Am. J. Fish. Manag. 2004, 24, 1435–1439. [Google Scholar] [CrossRef]
  36. Bang, I.-C.; Bruggemann, F.; Chen, C.; D’alexis, Q.; Gao, H.; Gélin, P.; Hong, X.; Inoue-Murayama, M.; Kim, K.-R.; Kwak, Y.-H. Microsatellite records for volume 12, issue 2. Conserv. Genet. Resour. 2020, 12, 337–351. [Google Scholar] [CrossRef]
  37. Nei, M. Estimation of average heterozygosity and genetic distance from a small number of individuals. Genetics 1978, 89, 583–590. [Google Scholar] [CrossRef]
  38. Peakall, R.; Smouse, P.E. GenAlEx 6.5: Genetic analysis in Excel. Population genetic software for teaching and research—An update. Bioinformatics 2012, 28, 2537–2539. [Google Scholar] [CrossRef]
  39. Tambasen-Cheong, M.V.P.; Tan-Fermin, J.D.; Garcia, L.M.B.; Baldevarona, R.B. Milt-egg ratio in artificial fertilization of the Asian freshwater catfish, Clarias macrocephalus, injected salmon gonadotropin-releasing hormone analogue and domperidone. Aquat. Living Resour. 1995, 8, 303–307. [Google Scholar] [CrossRef]
  40. Kalinowski, S.T.; Taper, M.L.; Marshall, T.C. Revising how the computer program CERVUS accommodates genotyping error increases success in paternity assignment. Mol. Ecol. 2007, 16, 1099–1106. [Google Scholar] [CrossRef]
  41. Excoffier, L.; Lischer, H.E. Arlequin suite ver 3.5: A new series of programs to perform population genetics analyses under Linux and Windows. Mol. Ecol. Resour. 2010, 10, 564–567. [Google Scholar] [CrossRef]
  42. Raymond, M.; Rousset, F. GENEPOP (version 1.2): Population genetics software for exact tests and ecumenicism. J. Hered. 1995, 86, 248–249. [Google Scholar] [CrossRef]
  43. Cornuet, J.M.; Luikart, G. Description and power analysis of two tests for detecting recent population bottlenecks from allele frequency data. Genetics 1996, 144, 2001–2014. [Google Scholar] [CrossRef]
  44. Do, C.; Waples, R.S.; Peel, D.; Macbeth, G.M.; Tillett, B.J.; Ovenden, J.R. NeEstimator v2: Re-implementation of software for the estimation of contemporary effective population size (Ne) from genetic data. Mol. Ecol. Resour. 2014, 14, 209–214. [Google Scholar] [CrossRef]
  45. Pritchard, J.K.; Stephens, M.; Donnelly, P. Inference of population structure using multilocus genotype data. Genetics 2000, 155, 945–959. [Google Scholar] [CrossRef]
  46. Li, Y.L.; Liu, J.X. StructureSelector: A web-based software to select and visualize the optimal number of clusters using multiple methods. Mol. Ecol. Resour. 2018, 18, 176–177. [Google Scholar] [CrossRef] [PubMed]
  47. Jombart, T. adegenet: A R package for the multivariate analysis of genetic markers. Bioinformatics 2008, 24, 1403–1405. [Google Scholar] [CrossRef]
  48. Kim, K.R.; Park, J.W.; Park, K.I.; Lee, H.J. Genetic Diversity and Population Structure in Farmed and Wild Pacific Oysters (Crassostrea gigas): A Comparative Study. Int. J. Mol. Sci. 2025, 26, 4172. [Google Scholar] [CrossRef]
  49. Storset, A.; Strand, C.; Wetten, M.; Kjøglum, S.; Ramstad, A. Response to selection for resistance against infectious pancreatic necrosis in Atlantic salmon (Salmo salar L.). Aquaculture 2007, 272, S62–S68. [Google Scholar] [CrossRef]
  50. Robinson, Z.L.; Coombs, J.A.; Hudy, M.; Nislow, K.H.; Letcher, B.H.; Whiteley, A.R. Experimental test of genetic rescue in isolated populations of brook trout. Mol. Ecol. 2017, 26, 4418–4433. [Google Scholar] [CrossRef]
  51. Waples, R.S. Testing for Hardy–Weinberg proportions: Have we lost the plot? J. Hered. 2015, 106, 1–19. [Google Scholar] [CrossRef] [PubMed]
  52. Bosco, F.; Castro, D.; Briones, M.R. Neutral and stable equilibria of genetic systems and the hardy-weinberg principle: Limitations of the chi-square test and advantages of auto-correlation functions of allele frequencies. Front. Genet. 2012, 3, 276. [Google Scholar] [CrossRef]
  53. Christie, M.R.; Marine, M.L.; French, R.A.; Waples, R.S.; Blouin, M.S. Effective size of a wild salmonid population is greatly reduced by hatchery supplementation. Heredity 2012, 109, 254–260. [Google Scholar] [CrossRef]
  54. Chacón, G.M.; Arias-Pérez, A.; Freire, R.; Martínez, L.; Ojea, J.; Insua, A. Genetic characterization of wild, broodstock and seed samples of Polititapes rhomboides (Bivalvia: Veneridae): Implications for hatchery seed production. Aquac. Rep. 2021, 20, 100658. [Google Scholar] [CrossRef]
  55. Waples, R.S.; Do, C. ldne: A program for estimating effective population size from data on linkage disequilibrium. Mol. Ecol. Resour. 2008, 8, 753–756. [Google Scholar] [CrossRef] [PubMed]
  56. Jones, A.T.; Ovenden, J.R.; Wang, Y.G. Improved confidence intervals for the linkage disequilibrium method for estimating effective population size. Heredity 2016, 117, 217–223. [Google Scholar] [CrossRef]
  57. D’Ambrosio, J.; Phocas, F.; Haffray, P.; Bestin, A.; Brard-Fudulea, S.; Poncet, C.; Quillet, E.; Dechamp, N.; Fraslin, C.; Charles, M.; et al. Genome-wide estimates of genetic diversity, inbreeding and effective size of experimental and commercial rainbow trout lines undergoing selective breeding. Genet. Sel. Evol. 2019, 51, 26. [Google Scholar] [CrossRef]
  58. Ryman, N.; Laikre, L. Effects of supportive breeding on the genetically effective population size. Conserv. Biol. 1991, 5, 325–329. [Google Scholar] [CrossRef]
  59. Xu, Z.; Dou, S.-Z.; Ding, S.-X.; Liu, J.-X. Temporal genetic stability despite decades of overexploitation for large yellow croaker in the East China sea. Front. Mar. Sci. 2022, 9, 861840. [Google Scholar] [CrossRef]
  60. Fitzpatrick, S.W.; Mittan-Moreau, C.; Miller, M.; Judson, J.M. Genetic rescue remains underused for aiding recovery of federally listed vertebrates in the United States. J. Hered. 2023, 114, 354–366. [Google Scholar] [CrossRef] [PubMed]
  61. Mathur, S.; Gibbs, H.L. Genomic Evaluation of Assisted Gene Flow Options in an Endangered Rattlesnake. Mol. Ecol. 2025, 34, e70014. [Google Scholar] [CrossRef]
  62. Fraser, D.J. How well can captive breeding programs conserve biodiversity? A review of salmonids. Evol. Appl. 2008, 1, 535–586. [Google Scholar] [CrossRef]
  63. Ralls, K.; Sunnucks, P.; Lacy, R.C.; Frankham, R. Genetic rescue: A critique of the evidence supports maximizing genetic diversity rather than minimizing the introduction of putatively harmful genetic variation. Biol. Conserv. 2020, 251, 108784. [Google Scholar] [CrossRef]
  64. Liang, Y.; Xu, C.; Li, Q. Heterosis and genetic diversity of intraspecific hybrids crosses between two selected lines of the Pacific oyster Crassostrea gigas. Aquaculture 2023, 569, 739369. [Google Scholar] [CrossRef]
  65. Fernandez Miguez, M.; Presa, P.; Puvanendran, V.; Tveiten, H.; Hansen, O.J.; Perez, M. Gene Expression and Phenotypic Assessment of Egg Quality across Developmental Stages of Atlantic Cod throughout the Spawning Season. Int. J. Mol. Sci. 2024, 25, 7488. [Google Scholar] [CrossRef] [PubMed]
  66. Ataguba, G.A.; Angela, A. Hybridization and Growth Performance of Progeny from Crosses between Clarias gariepinus and Heterobranchus sp. Aquac. Stud. 2023, 24, AQUAST1154. [Google Scholar] [CrossRef]
  67. Jiao, Y.; Colvert, B.; Man, Y.; McHenry, M.J.; Kanso, E. Evaluating evasion strategies in zebrafish larvae. Proc. Natl. Acad. Sci. USA 2023, 120, e2218909120. [Google Scholar] [CrossRef]
  68. Fuiman, L.A.; Cowan, J.H., Jr. Behavior and recruitment success in fish larvae: Repeatability and covariation of survival skills. Ecology 2003, 84, 53–67. [Google Scholar] [CrossRef]
  69. Siddique, M.A.M.; Linhart, O.; Krejszeff, S.; Żarski, D.; Pitcher, T.E.; Politis, S.N.; Butts, I.A.E. Paternal identity impacts embryonic development for two species of freshwater fish. Gen. Comp. Endocrinol. 2017, 245, 30–35. [Google Scholar] [CrossRef]
  70. Yeates, S.E.; Einum, S.; Fleming, I.A.; Megens, H.-J.; Stet, R.J.; Hindar, K.; Holt, W.V.; Van Look, K.J.; Gage, M.J. Atlantic salmon eggs favour sperm in competition that have similar major histocompatibility alleles. Proc. R. Soc. B Biol. Sci. 2009, 276, 559–566. [Google Scholar] [CrossRef] [PubMed]
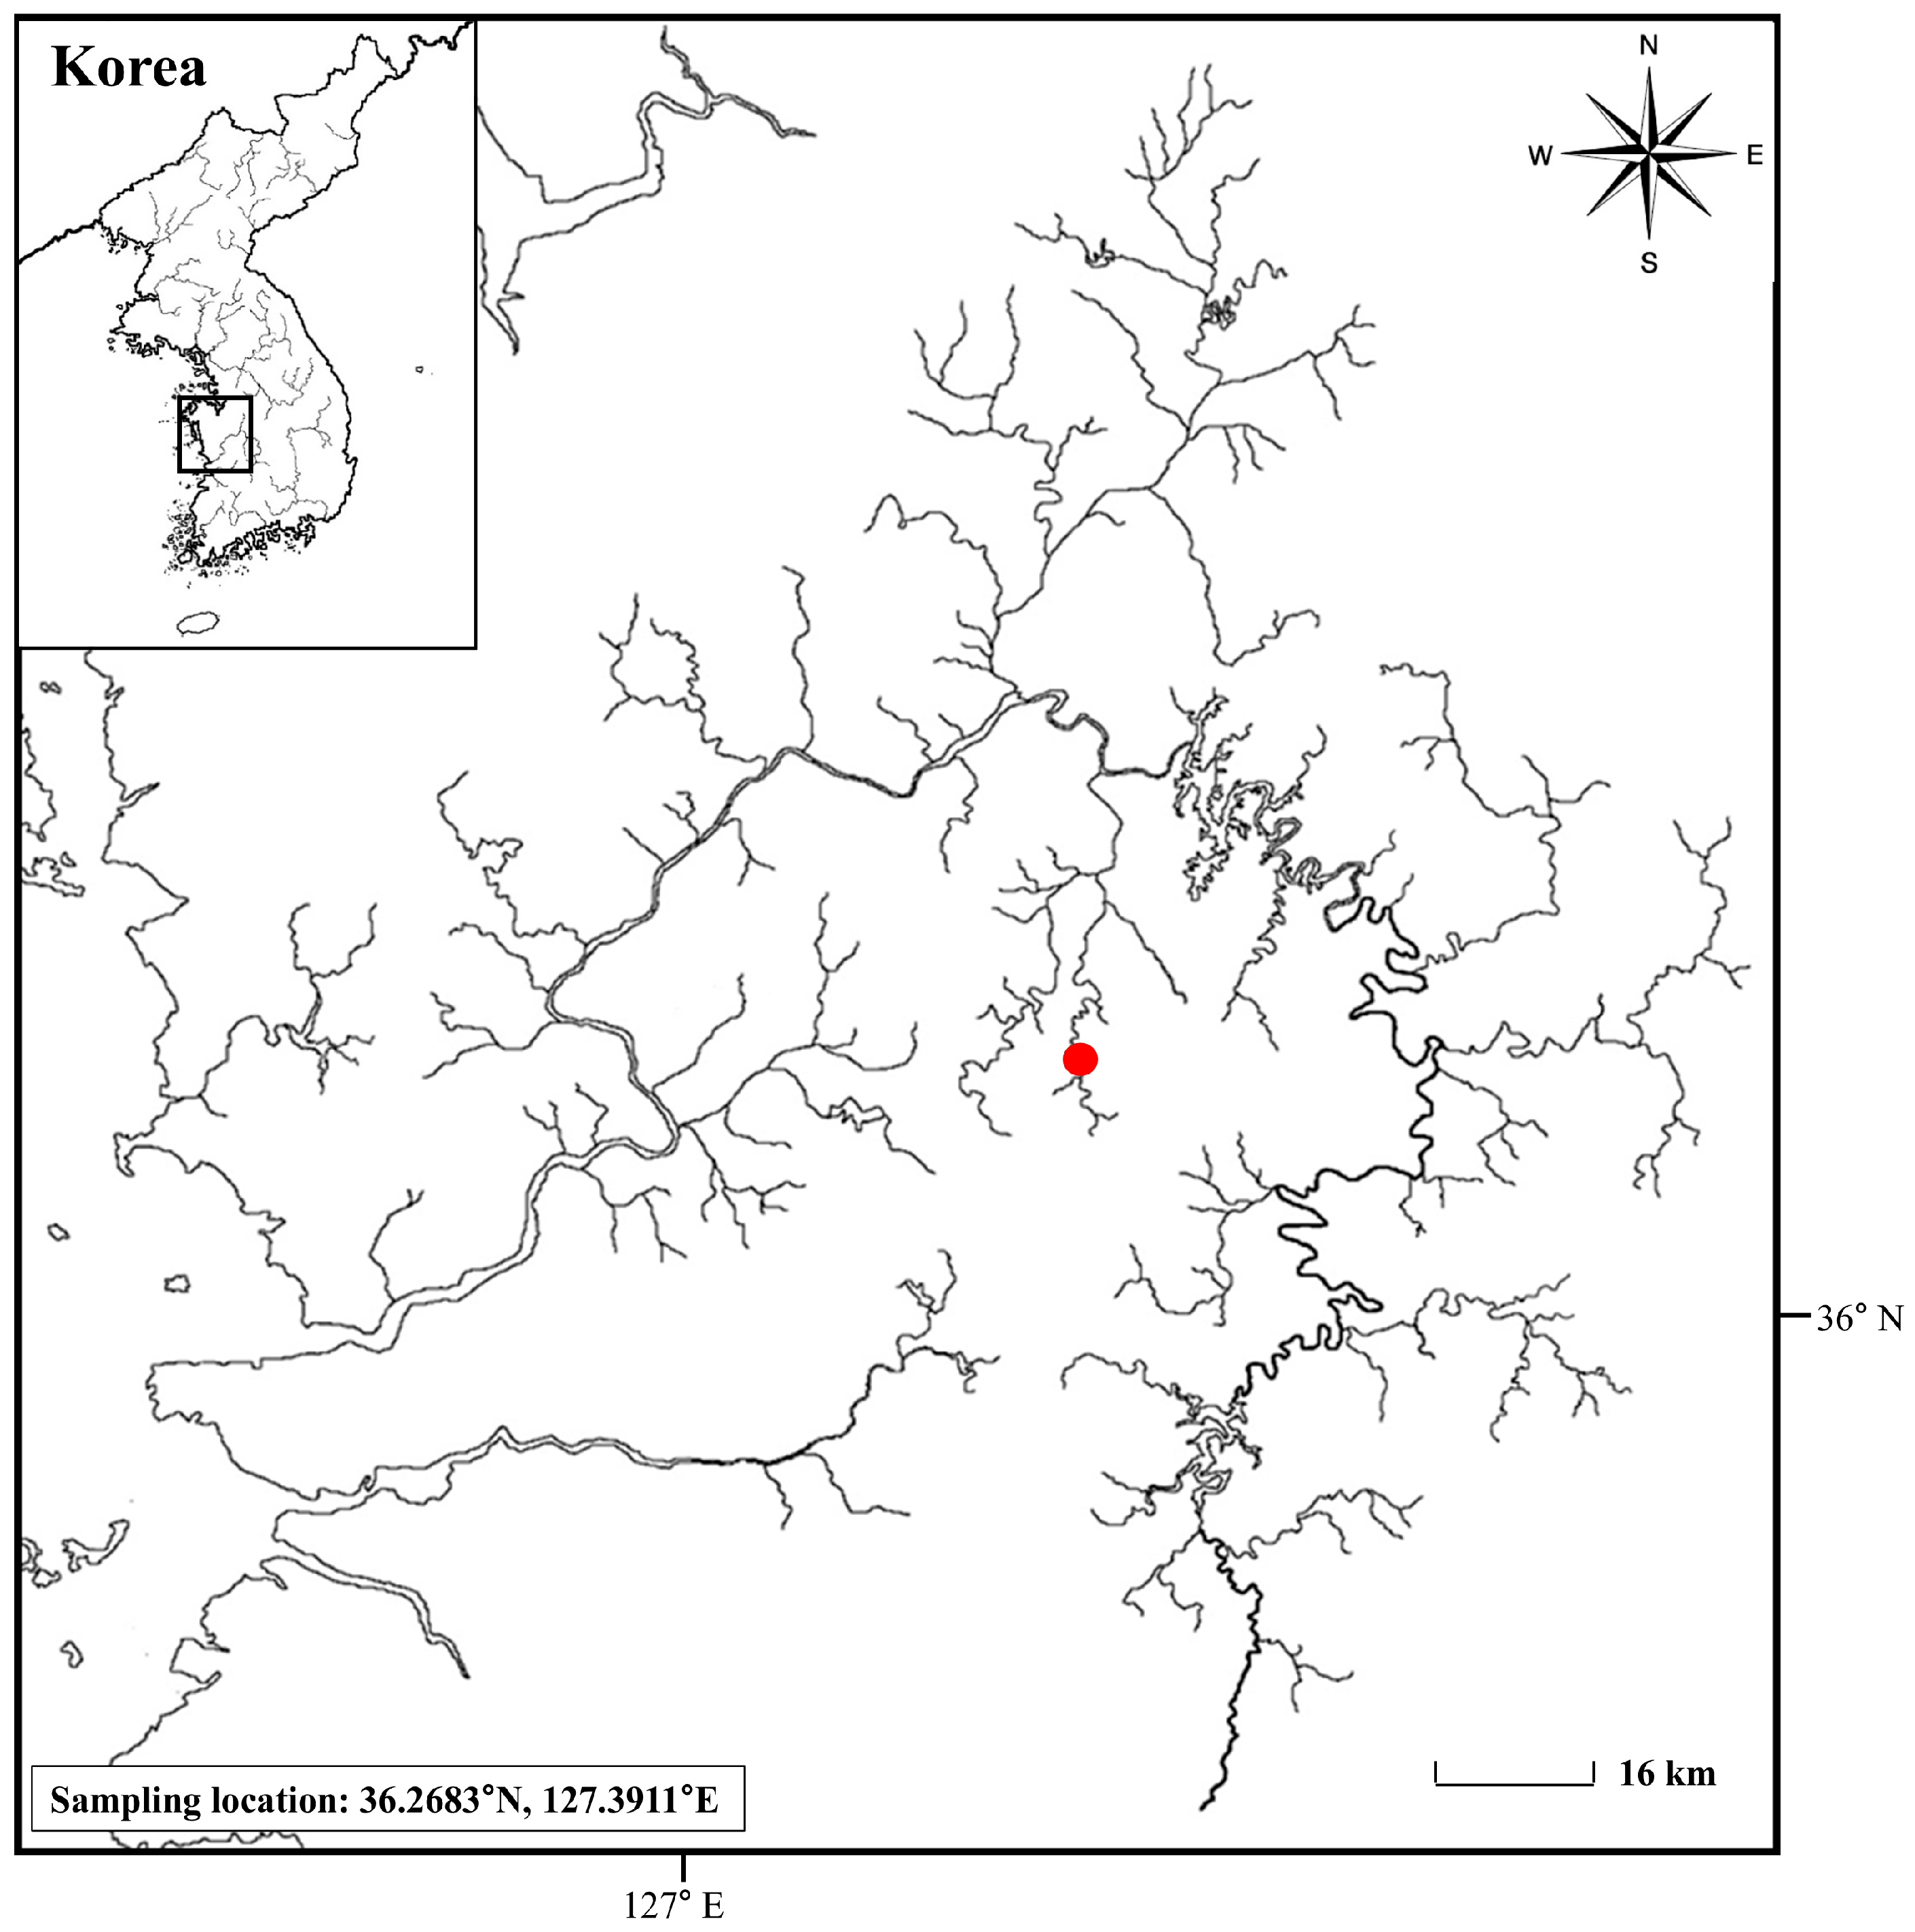
Figure 1. Collection locations of P. nigra for genetic-distance-based crossbred group production. The red circle indicate sites where P. nigra were collected in the Yudeungcheon Stream. The red circle is the exact point on the map where it was collected.
Fishes 10 00603 g001
Figure 2. VIE tag for distinguishing individual broodstock and for genotyping. From 1–15, only the males are green VIE tag, and from 16–30, only the females are orange VIE tag. Males and females were separated and maintained in 100 L tanks.
Fishes 10 00603 g002
Figure 3. Workflow summarizing sampling, VIE tagging, DNA extraction and genotyping, analysis of genetic distance between individuals, rearing and induced maturation, genetic-distance-based crosses (HGD and LGD groups), and early survival rate analysis in P. nigra. (a) Collection of 30 individuals from the Yudeungcheon Stream in the Geumgang River basin; (b) individual identification using VIE tags. In the sample photo on the right, the numbers are the locations of the brief VIE tags.; (c) DNA extraction from fin tissue and genotyping at ten microsatellite loci; (d) estimation of genetic distance between female and male broodstock based on Nei’s distance; (e) rearing and induced maturation of broodstock in 100 L tanks with artificial feeding; (f) artificial crosses between individuals assigned to HGD and LGD groups; adhesive eggs were attached to plastic mesh for incubation (photo); and (g) measurement of hatching rate and early larval survival.
Fishes 10 00603 g003
Figure 4. Analysis of the genetic structure of broodstock and crossbred groups of P. nigra using STRUCTURE. The curve shows ΔK as a function of the number of clusters (K), with a clear maximum at K = 3. The bar plots display individual cluster membership coefficients for K = 3–5; each vertical bar represents one individual, and individuals are grouped along the x-axis by sampling group (broodstock, HGD_20, HGD_19, LGD_11, LGD_9). Colors indicate proportional membership in each inferred genetic cluster (Cluster 1 = red, Cluster 2 = yellow, Cluster 3 = green, Cluster 4 = blue, Cluster 5 = magenta), as specified in the legend.
Fishes 10 00603 g004
Figure 5. DAPC scatterplots for P. nigra. Point colors denote populations, each corresponding to a distinct genetic cluster; population abbreviations label clusters. Top-right inset shows the eigenvalue contributions of retained PCs. Bottom-right inset shows the variance explained by the two discriminant functions used in the scatterplot. Colors indicate DAPC clusters, and symbols denote sampling groups (broodstock, HGD_20, HGD_19, LGD_11, LGD_9), as shown in the legend.
Fishes 10 00603 g005
Figure 6. Survival and hatching rates of fertilized P. nigra eggs following crossbreeding of genetic distance. Significant differences are indicated as different letters above the error bars within each variable (p < 0.05). Same capital and small letters mean no significant difference among survival rate (p > 0.05). The hatching and survival rates of HGD were combined as the average of HGD_20 and HGD_19, and the LGD values were also the same as the combined values of LGD_11 and LGD_9. Values are means ± SE based on HGD and LGD replicates per genetic-distance group.
Fishes 10 00603 g006
Table 1. Characteristics information of 10 microsatellite markers for P. nigra.
Locus NamePrimer Sequence (5′ → 3′)Motif
Repeats
Product
Size Range (bp)
Tm (°C)GenBank Accession No.Reference
PN4F: 6FAM-TCGGTGGATGCGAGGAATAC
R: TTCCGCCTGTCAGTCAAGAC
(AC)6190–20258MN385013Bang et al. [36],
Kim et al. [12]
PN23F: TAMRA-GGCACTCAAGGATAATCTGAAC
R: TGTATCCGGCCTCTGTGTAG
(GT)10198–21258MN385014
PN75F: HEX-CCTGCATCCATGCCGTATAG
R: GCTGTTATAGCGCTGATGATAG
(AC)9199–21758MN911279
PN88F: HEX-CAACAGGCTCCACGATTGC
R: CTGCCCTCGGAAATAAGATGG
(AC)7174–18658MN385015
PN92F: 6FAM-CCGTGCTCATATACAGTCCTC
R: CCGCATTGTTCCTCCGATTG
(CA)10242–26658MN385016
PN98F: HEX-CAGGATGAGTCCATCGTCTC
R: GCTCAGAAGTGACCGACAGA
(GT)10217–30158MN385018
PN123F: 6FAM-GGGACACACTTAGCAAGCCT
R: AGCCAGTGAGATTGAAAGACCA
(GT)10213–24158MN385020
PN124F: 6FAM-GAGACGCACGACTGATGAAG
R: GGCTAACAGGGCGATTGATTG
(AC)10246–25858MN385021
PN126F: HEX-CCACACTACTGAGACTAAACTG
R: TGACAGACCATCTTGCATTCTG
(GT)9176–18658MN385022
PN147F: 6FAM-GGCTTATGTGGCTTCGGATAC
R: AGGTGAGCCTGAGAGAGAAG
(AC)9122–12858MN911282
Tm: Primer annealing temperature.
Table 2. Pairwise Nei’s genetic distance between female and male broodstock.
M1M2M3M4M5M6M7M8M9M10M11M12M13M14M15M16
F11215111915211418161116817141913
F214121824222318182013201020141512
F3111311209141614171414815131513
F417201212171618121514131310141916
F51418172112151812111319121713169
F620161419161117171214181617152010
F720121518131214111817171718122112
F82116171716131614714171215131413
F917151920151521191716151813161916
F101717152317201719181918918181318
F1116111420101520151612161013131711
F1222211615141621191718181722201814
Max22211924222321192019201822202118
Min1111111291114117111381012139
M: male broodstock, F: female broodstock. Bold text indicates only the index values used to produce genetic-distance-based crossbreeds. Nei’s genetic distance D is an “index” calculated by combining multiple markers for a pair of individuals (or populations), so it is not usually reported as mean ± SD.
Table 3. Expected and observed heterozygosity of broodstock and F1 progenies from crossbred groups on the basis of genetic distance.
Group NameGenetic Distance
Index
No. of
Individuals
NAHEHOFISPHWE
Broodstock-285.8 ± 1.80.739 ± 0.1200.697 ± 0.1580.0580.221
HGD19302.7 ± 0.30.549 ± 0.0500.787 ± 0.082−0.4450.000 ***
20302.9 ± 0.30.547 ± 0.0710.800 ± 0.108−0.4480.000 ***
LGD11292.9 ± 0.30.538 ± 0.0350.638 ± 0.060−0.2270.000 ***
9302.6 ± 0.40.469 ± 0.0710.573 ± 0.094−0.1900.000 ***
NA: average number of alleles, HE: expected heterozygosity, HO: observed heterozygosity, FIS: inbreeding coefficient, PHWE: Hardy−Weinberg equilibrium, *** p < 0.001. We defined “high genetic distance (HGD)” as parental pairs located in the upper range of the Nei’s D distribution among broodstock, and “low genetic distance (LGD)” as parental pairs located in the lower range.
Table 4. Bottleneck information and Ne size estimates for P. nigra crossbred group and broodstock.
Group NameNWilcoxon Sign-Rank TestNe(95% CI)
PIAMPTPMPSMMMode-Shift
Broodstock280.000 ***0.000 ***0.001 **SHIFTED(96–∞)
HGD_20300.000 ***0.000 ***0.000 ***SHIFTED(∞–∞)
HGD_19300.000 ***0.000 ***0.000 ***SHIFTED(∞–∞)
LGD_11290.000 ***0.000 ***0.000 ***SHIFTED114(7–∞)
LGD_9300.000 ***0.000 ***0.000 ***SHIFTED65(15–∞)
N: numbers of sample, PIAM: p-value of bottleneck test using infinite allele mutation model, PTPM: p-value of bottleneck test using two-phase mutation model (10% variance and 90% proportions of SSM), PSMM: p-value of bottleneck test using stepwise mutation model, Ne: estimated effective population size by NeEstimator software, and CI: confidence interval, ** p < 0.010, *** p < 0.001. In the LD-based estimates, values reported as “infinite” for the broodstock and HGD crossbred groups should be interpreted as indicating that Ne could not be reliably bounded from above, rather than as evidence of an extremely large population size, reflecting estimation uncertainty associated with limited sample size and low levels of linkage disequilibrium. We therefore treat these estimates qualitatively (very large or undeterminable Ne) and focus on contrasts with the finite Ne obtained for the LGD crossbred group.
Table 5. FST among populations according to microsatellite of crossbred group and broodstock of P. nigra.
BroodstockHGD_20HGD_19LGD_11LGD_9
Broodstock-0.0000.0000.0000.000
HGD_200.105-0.0000.0000.000
HGD_190.1520.224-0.0000.000
LGD_110.2010.3160.321-0.000
LGD_90.1700.2880.2980.371-
Disclaimer/Publisher’s Note: The statements, opinions and data contained in all publications are solely those of the individual author(s) and contributor(s) and not of MDPI and/or the editor(s). MDPI and/or the editor(s) disclaim responsibility for any injury to people or property resulting from any ideas, methods, instructions or products referred to in the content.