Article

Transcriptomic Profiling Reveals Immune-Related Pathway Alterations in Paralichthys olivaceus Infected with Enteromyxum leei

1
Smart AquaFarm Convergence Research Institute, Mokpo National University, Muan 58554, Republic of Korea
2
Department of Biomedicine, Health & Life Convergence Sciences, BK21 Four, Mokpo National University, Muan 58554, Republic of Korea
3
Department of Fisheries & Biomedical Sciences, Mokpo National University, Muan 58554, Republic of Korea
*
Author to whom correspondence should be addressed.
Fishes 2025, 10(12), 601; https://doi.org/10.3390/fishes10120601
Submission received: 3 October 2025 / Revised: 18 November 2025 / Accepted: 19 November 2025 / Published: 24 November 2025
(This article belongs to the Special Issue Molecular Mechanism of Fish Immune Response to Pathogens)

Abstract

In olive flounder (Paralichthys olivaceus) suffering from emaciation disease, the intestinal myxozoan Enteromyxum leei is considered a major causative agent. This disease causes severe economic losses in East Asian aquaculture, and even though the pathological outcomes have been well described, the molecular mechanisms underlying host immune imbalance are unclear. We performed RNA sequencing of posterior intestinal tissue from infected and control fish, yielding high-quality datasets and 2666 differentially expressed genes (1589 downregulated, 1077 upregulated). Enrichment analyses revealed a significant modulation of immune processes, particularly cytokine activity, chemokine signaling, apoptosis regulation, and lymphocyte trafficking. Kyoto Encyclopedia of Genes and Genomes analysis identified six immune-related pathways that were the most affected: Toll-like receptor, NOD-like receptor, intestinal immune network for IgA production, C-type lectin receptor, RIG-I-like receptor, and cytosolic DNA sensing. Network mapping highlighted nine hub genes, including cxcl8a, pik3r1, mapk10, and itpr1b, which were shared across multiple pathways and validated by qRT-PCR. Our results demonstrate that E. leei disrupts intestinal immune homeostasis by suppressing chemokine-driven inflammation and adaptive responses while simultaneously enhancing nucleic acid-sensing and stress pathways. This dual modulation provides new insights into the intestinal immune dysregulation underlying enteromyxosis and establishes a molecular basis for future diagnostic and preventive strategies in olive flounder aquaculture.
Key Contribution: This study elucidates the transcriptomic basis of host–parasite interactions in E. leei-infected olive flounder, revealing simultaneous suppression of chemokine-driven inflammation and adaptive immunity and activation of nucleic acid-sensing pathways. We identified and validated nine hub genes across six immune pathways, which serve as central regulatory nodes and may function as molecular basis for understanding immune dysregulation and developing future preventive strategies.

1. Introduction

Olive flounder (Paralichthys olivaceus) is one of the most commercially valuable flatfish species and forms the backbone of marine aquaculture in East Asia, particularly in Korea, China, and Japan [1,2]. Commercial production of this species has been upscaled considerably in the past decades; however, the intensive rearing practices required for large-scale farming expose the fish to environmental pressures such as fluctuating water temperatures, deteriorating water quality, and overcrowding. These factors increase vulnerability to pathogens and frequently result in stunted growth, reduced feed utilization, and high mortality [3,4,5]. Among the wide range of pathogens, parasitic infections pose a particular threat because they typically progress silently, are difficult to diagnose in early stages, and tend to develop into chronic diseases that are difficult to control [6].
The intestinal myxozoan parasite Enteromyxum leei presents one of the most severe parasitic challenges in cultured marine fish [7]. This parasite colonizes the gut epithelium, typically initiating in the posterior intestine and spreading to the anterior sections [8]. Under farming conditions, infections are readily transmitted through cohabitation, contaminated effluents, or direct oral and anal exposure routes [9]. Further, experimental studies have confirmed horizontal, fish-to-fish transmission of E. leei in olive flounder via oral and anal inoculation routes [10,11]. Infected fish show pathological characteristics, including villus atrophy, epithelial necrosis, and inflammatory cell infiltration, together with altered responses of immune factors such as granulocytes, monocytes, and complement proteins [12,13,14]. When the infection becomes chronic, the fish frequently develop anorexia and progressive weight loss and ultimately suffer from high mortality, resulting in substantial production loss [9]. Evidence from histopathology also indicates that the consequences of infection are not limited to local intestinal damage, but extend to systemic processes, including alterations of endocrine and antioxidant pathways [15]. Chronic wasting, also known as emaciation, has thus emerged as a critical barrier to sustainable olive flounder culture across East Asia [16].
Epidemiological surveys from Jeju Island, Korea, have shown that E. leei infections in cultured olive flounder occur recurrently from late summer to early autumn, coinciding with elevated water temperatures and intensified farming activity [17,18]. The present study was conducted during this seasonal window, which corresponds to the typical peak of infection prevalence in the region and provides relevant environmental context for interpreting host responses and disease stage.
The pathological outcomes of E. leei infection are well documented; however, the underlying molecular mechanisms driving the immune imbalance in the host are currently unclear. Previous studies mainly focused on gross pathology or a few selected immune parameters [12,13,19]. In other fish species, transcriptomic investigations have shown that parasitic infections can elicit complex host–parasite interactions. For instance, in turbot (Scophthalmus maximus), RNA-seq profiling of early enteromyxosis revealed both rapid activation of innate immune pathways and evidence of parasite-driven immune evasion [20]. In gilthead seabream (Sparus aurata), multi-omics demonstrated that E. leei infection reshapes the intestinal transcriptome while simultaneously altering the gut microbiota and disturbing immune pathways associated with interleukin signaling, interferon-mediated responses, and antigen presentation via major histocompatibility complex molecules [21]. Taken together, transcriptomics can help reveal the molecular basis of parasite-induced immune modulation; however, comprehensive transcriptome studies focusing on E. leei infection in olive flounder are still lacking.
Transcriptome-based research on olive flounder exposed to bacterial and viral pathogens has highlighted the central role of immune signaling pathways in host defense [22,23,24]. Studies on infections with Edwardsiella tarda, Vibrio anguillarum, and viral hemorrhagic septicemia virus (VHSV) have documented strong activation of Toll-like receptors, NOD-like receptors, RIG-I-like receptors, and interferon pathways in multiple tissues, including the liver, spleen, and blood [25,26,27,28]. Moreover, long-read transcriptome sequencing across immune-relevant tissues of this species has revealed a high diversity of gene isoforms and splice variants, which helps interpret expression changes during acute disease [28,29,30,31]. Immune responses in flounder are thus highly tissue-dependent and dynamically regulated, underscoring the importance of investigating intestinal immunity during parasitic infections.
The present study was conducted to characterize transcriptomic alterations in the posterior intestine of olive flounder infected with E. leei. Particular attention was paid to the differentially expressed genes (DEGs) associated with immune-related Kyoto Encyclopedia of Genes and Genomes (KEGG) pathways. We integrated RNA-seq with functional enrichment analysis to identify the regulatory genes shared across multiple immune pathways and to elucidate immune dysregulation mechanisms during enteromyxosis. The findings of this study provide molecular insights into host–parasite interactions and immune modulation in the flounder intestine and establish a foundation for future research aimed at improving disease prevention and health management in aquaculture.

2. Materials and Methods

2.1. Ethical Approval

All animal experiments were conducted in accordance with institutional and international guidelines for the ethical use of laboratory animals, including the ARRIVE guidelines. The study protocol was approved by the Institutional Animal Care and Use Committee (IACUC) of the Mokpo National University, Republic of Korea (Approval Code: MNU-IACUC-2025-018).

2.2. Experimental Fish and Sampling

Olive flounder exhibiting emaciation consistent with Enteromyxum leei infection were sampled directly from a commercial aquaculture farm in Jeju, South Korea. According to farm records, all fish originated from the same hatchery cohort but were maintained in separate on-farm tanks designated for emaciated (suspected of infection) and clinically normal stocks, respectively. Fish were maintained in aerated seawater at 17.65 ± 0.15 °C with a salinity of 31.7 ± 0.5 ppt under a natural photoperiod and were fed a commercial diet at approximately 1.5% of their body weight per day until sampling.
Fifty individuals were selected from each tank (100 fish in total) for diagnostic and molecular analyses. All fish were dissected on site, and both diagnostic and RNA-seq sampling were conducted simultaneously on each individual. The relative condition factor (rCF) was first calculated as a phenotypic indicator of emaciation, and E. leei infection was confirmed by PCR targeting the 18S rRNA gene using genomic DNA extracted from intestinal tissue (see Section 2.3). Based on these results, 20 non-infected individuals were designated as the control group, and 20 E. leei-infected individuals were selected as the experimental group. The uninfected controls had an average body weight of 563.45 ± 45.42 g, total length of 36.73 ± 1.01 cm, and rCF of 94.01% ± 4.5%. The infected group had an average body weight of 598.35 ± 80.19 g, total length of 40.45 ± 1.03 cm, and rCF of 73.16% ± 7.56%.
Because this was a naturally acquired field infection, the exact duration post-exposure could not be determined. However, the presence of E. leei myxospores in wet mounts, markedly reduced rCF, and cachectic appearance indicated that the infection was at a chronic stage at the time of sampling. For tissue collection, fish were anesthetized using MS-222 (100 mg/L), and the entire intestinal tract was aseptically excised. Only the posterior intestine was used for transcriptome sequencing because this region represents the primary site of E. leei colonization and shows the most pronounced mucosal pathology. Histological observations were also performed to confirm intestinal lesions. All collected tissue samples were immediately frozen in liquid nitrogen and stored at −80 °C until analysis.

2.3. Infection Diagnosis of E. leei

Before transcriptome analysis, all fish were screened for infection with Enteromyxum leei and for potential co-infections with other pathogens commonly detected in olive flounder aquaculture. Potential co-infections were assessed by routine PCR or RT-PCR assays for viral hemorrhagic septicemia virus (VHSV), the bacteria Edwardsiella piscicida, Vibrio harveyi, Streptococcus parauberis, Tenacibaculum maritimum, and the parasite Miamiensis avidus. Only individuals that tested positive for E. leei and negative for the other pathogens were retained for this study.
The presence of myxospores was examined microscopically at 400-fold magnification and confirmed by PCR, using primers targeting the E. leei 18S rRNA gene. Additionally, the rCF was used as a phenotypic indicator of emaciation, as proposed by Shin et al. [32]. Fish exhibiting markedly reduced rCF values together with PCR-positive results were classified as the E. leei-infected group, whereas fish with normal rCF and negative PCR results were classified as the uninfected controls.
Genomic DNA was extracted from the posterior intestinal tissue using a DNeasy Blood and Tissue Kit (Qiagen, Venlo, The Netherlands) according to the manufacturer’s instructions. Two PCR approaches were applied. First, PCR amplification was performed as described by Shin et al. [32] using their 18S rRNA primers and thermocycling conditions, which served as the standard reference for E. leei detection. Second, a new primer pair targeting the E. leei 18S rRNA region (NCBI Accession No. MF161396.1) was designed in this study to improve diagnostic specificity. PCR amplification was performed using an All-In-One Cycler system (Bioneer, Daejeon, South Korea) under the following conditions: 95 °C for 3 min; 30 cycles of 95 °C for 30 s, 58 °C for 30 s, and 72 °C for 45 s; and 72 °C for 5 min. The primer sequences used for both approaches are listed in Table 1.

2.4. RNA Extraction and Quality Assessment

Total RNA was extracted from posterior intestine tissues using QIAzol Lysis Reagent (Cat. No. 79306; Qiagen, Hilden, Germany) and RNeasy Mini Kit (Cat. No. 74106; Qiagen) with tungsten carbide beads (Cat. No. 69997; Qiagen) for mechanical homogenization. The samples were stored in liquid nitrogen until processing and were thawed immediately before extraction. The RNA concentration and purity were initially evaluated using a NanoDrop 2000 spectrophotometer (Thermo Fisher Scientific, Waltham, MA, USA), and accurate quantification was performed using the Quant-IT RiboGreen Assay Kit (Cat. No. R11490; Invitrogen, Carlsbad, CA, USA). RNA integrity was assessed using a TapeStation RNA ScreenTape system (Cat. No. 5067-5576; Agilent, Santa Clara, CA, USA). Only RNA samples with an RNA integrity number ≥ 7.0 and an OD260/280 ratio between 1.9 and 2.1 were selected for library preparation.

2.5. Library Preparation and RNA Sequencing

RNA libraries were prepared using a TruSeq Stranded Total RNA Library Prep Gold Kit (Cat. No. 20020599; Illumina, San Diego, CA, USA) according to the manufacturer’s instructions. Ribosomal RNA was depleted, and the remaining RNA was fragmented and reverse-transcribed into first-strand cDNA using SuperScript II Reverse Transcriptase (Cat. No. 18064014; Invitrogen) using random hexamer primers. Second-strand synthesis was performed using DNA Polymerase I and RNase H, incorporating dUTP to preserve strand specificity. After end repair, adenylation, and adapter ligation, the fragments were PCR-enriched to generate the final libraries. Library quality and fragment size distribution were evaluated using a TapeStation D1000 ScreenTape system (Cat. No. 5067-5582; Agilent), and concentrations were determined using the KAPA Library Quantification Kit (Cat. No. KK4854; KAPA Biosystems, Wilmington, MA, USA). Sequencing was performed on an Illumina NovaSeq X platform, generating 150 bp paired-end reads. Each library produced an average of approximately 75 million raw reads per sample, with more than 95% of the bases achieving Q30 quality scores.

2.6. Differential Expression Analysis

Raw sequencing reads were subjected to quality control using FastQC (v0.11.9) and trimmed for adapters and low-quality bases using Trimmomatic (v0.38) using the default paired-end settings. Clean reads were aligned to the olive flounder reference genome (NCBI Assembly Accession: GCF_024713975.1) using HISAT2 (v2.1.0), and alignment quality was verified using SAMtools software (v1.17). Transcript assembly and quantification were performed using StringTie (v2.1.3b), and gene-level read counts were extracted using featureCounts (v2.0.1).
Normalized read counts and differential-expression analysis were conducted using the DESeq2 package (v1.30.1) implemented in R software (v4.5.1). DEGs were defined as those with |log2 fold change| ≥ 1 and an adjusted p-value < 0.05 after Benjamini–Hochberg false discovery rate (FDR) correction. Data reproducibility and clustering reliability were assessed using principal component analysis (PCA), Pearson correlation coefficients, and hierarchical clustering, ensuring robust separation between the control and infected groups.

2.7. Functional Enrichment Analysis

Significant DEGs were subjected to functional enrichment analysis using the Database for Annotation, Visualization and Integrated Discovery (DAVID, v6.8; Frederick, MD, USA) and cross-referenced with the Gene Ontology (GO) and KEGG databases.
GO enrichment analysis was performed across the molecular function (MF), biological process (BP), and cellular component (CC) categories. KEGG pathway enrichment was performed using the ClusterProfiler (v4.10.0) package in R (v4.5.1) to identify significantly overrepresented biological pathways. Statistical significance was assessed using Fisher’s exact test followed by FDR correction, with an adjusted p-value of < 0.05. Visualization of the enriched GO terms and KEGG pathways was performed using Cytoscape (v3.9.1; National Institute of General Medical Sciences, Bethesda, MD, USA), where log2 fold change values were mapped onto corresponding pathway diagrams.

2.8. Validation of Candidate Genes by Quantitative Real-Time PCR

Quantitative real-time PCR (qRT-PCR) was performed to validate the RNA-seq results for the selected DEGs identified across multiple immune-related pathways. Total RNA was reverse-transcribed using a PrimeScript RT Reagent Kit (Takara Bio, Shiga, Japan). qRT-PCR assays were performed with TB Green Premix Ex Taq™ II (Tli RNaseH Plus; Takara Bio) on a CronoSTAR™ 96 Real-Time PCR System (Takara Bio). Each reaction (20 μL total volume) contained 10 μL TB Green Premix Ex Taq™ II, 0.4 μM of each primer, and 2 μL cDNA template. The thermal cycling conditions were as follows: initial denaturation at 95 °C for 30 s, followed by 40 cycles of 95 °C for 5 s and 60 °C for 30 s. Melting curve analysis was performed after amplification to verify primer specificity. Primer efficiencies were determined from standard curves based on serial dilutions of pooled cDNA and ranged between 95% and 105%, confirming high amplification accuracy. Each reaction was conducted in technical triplicate, with three biological replicates per group. Gene expression levels were normalized to the reference gene gapdh, and relative expression was calculated using the 2−ΔΔCt method. The primer sequences used for validation are listed in Table 2.

2.9. Statistical Analysis

All statistical analyses were conducted using R software (v4.5.1; R Core Team, Vienna, Austria). Data from rCF and qRT-PCR assays are presented as means ± standard error of the mean. For RNA-seq, differential expression analysis was performed using DESeq2 (v1.30.1), which models count data with size-factor normalization and dispersion estimation. Statistical significance was defined as |log2 fold change| ≥ 1 and an adjusted p < 0.05 after Benjamini–Hochberg false discovery rate (FDR) correction. The rlog (regularized log) was applied only for exploratory visualization such as PCA and heatmap analyses. For qRT-PCR, relative expression values were analyzed on a log2 scale (ΔCt-based transformation) to stabilize variance and approximate normality. Before further statistical testing, data distributions were examined for normality using the Shapiro–Wilk test and for homogeneity of variances using Levene’s test. The transformed data satisfied the assumptions for parametric testing; therefore, two-tailed Student’s t-tests were used to compare the uninfected control and E. leei-infected groups.
Correlations between RNA-seq and qRT-PCR expression values were examined using Pearson’s correlation coefficient, and unless otherwise specified, statistical significance was considered at p < 0.05.

3. Results

3.1. Phenotypic and Molecular Diagnosis

The rCF was significantly lower in the E. leei-infected group compared to that in the uninfected control group (p < 0.001). Control fish exhibited a mean rCF of 94.01% ± 4.5%, whereas the infected group showed a markedly lower mean of 73.16% ± 7.56%, consistent with the emaciation phenotype associated with chronic infection (Figure 1).
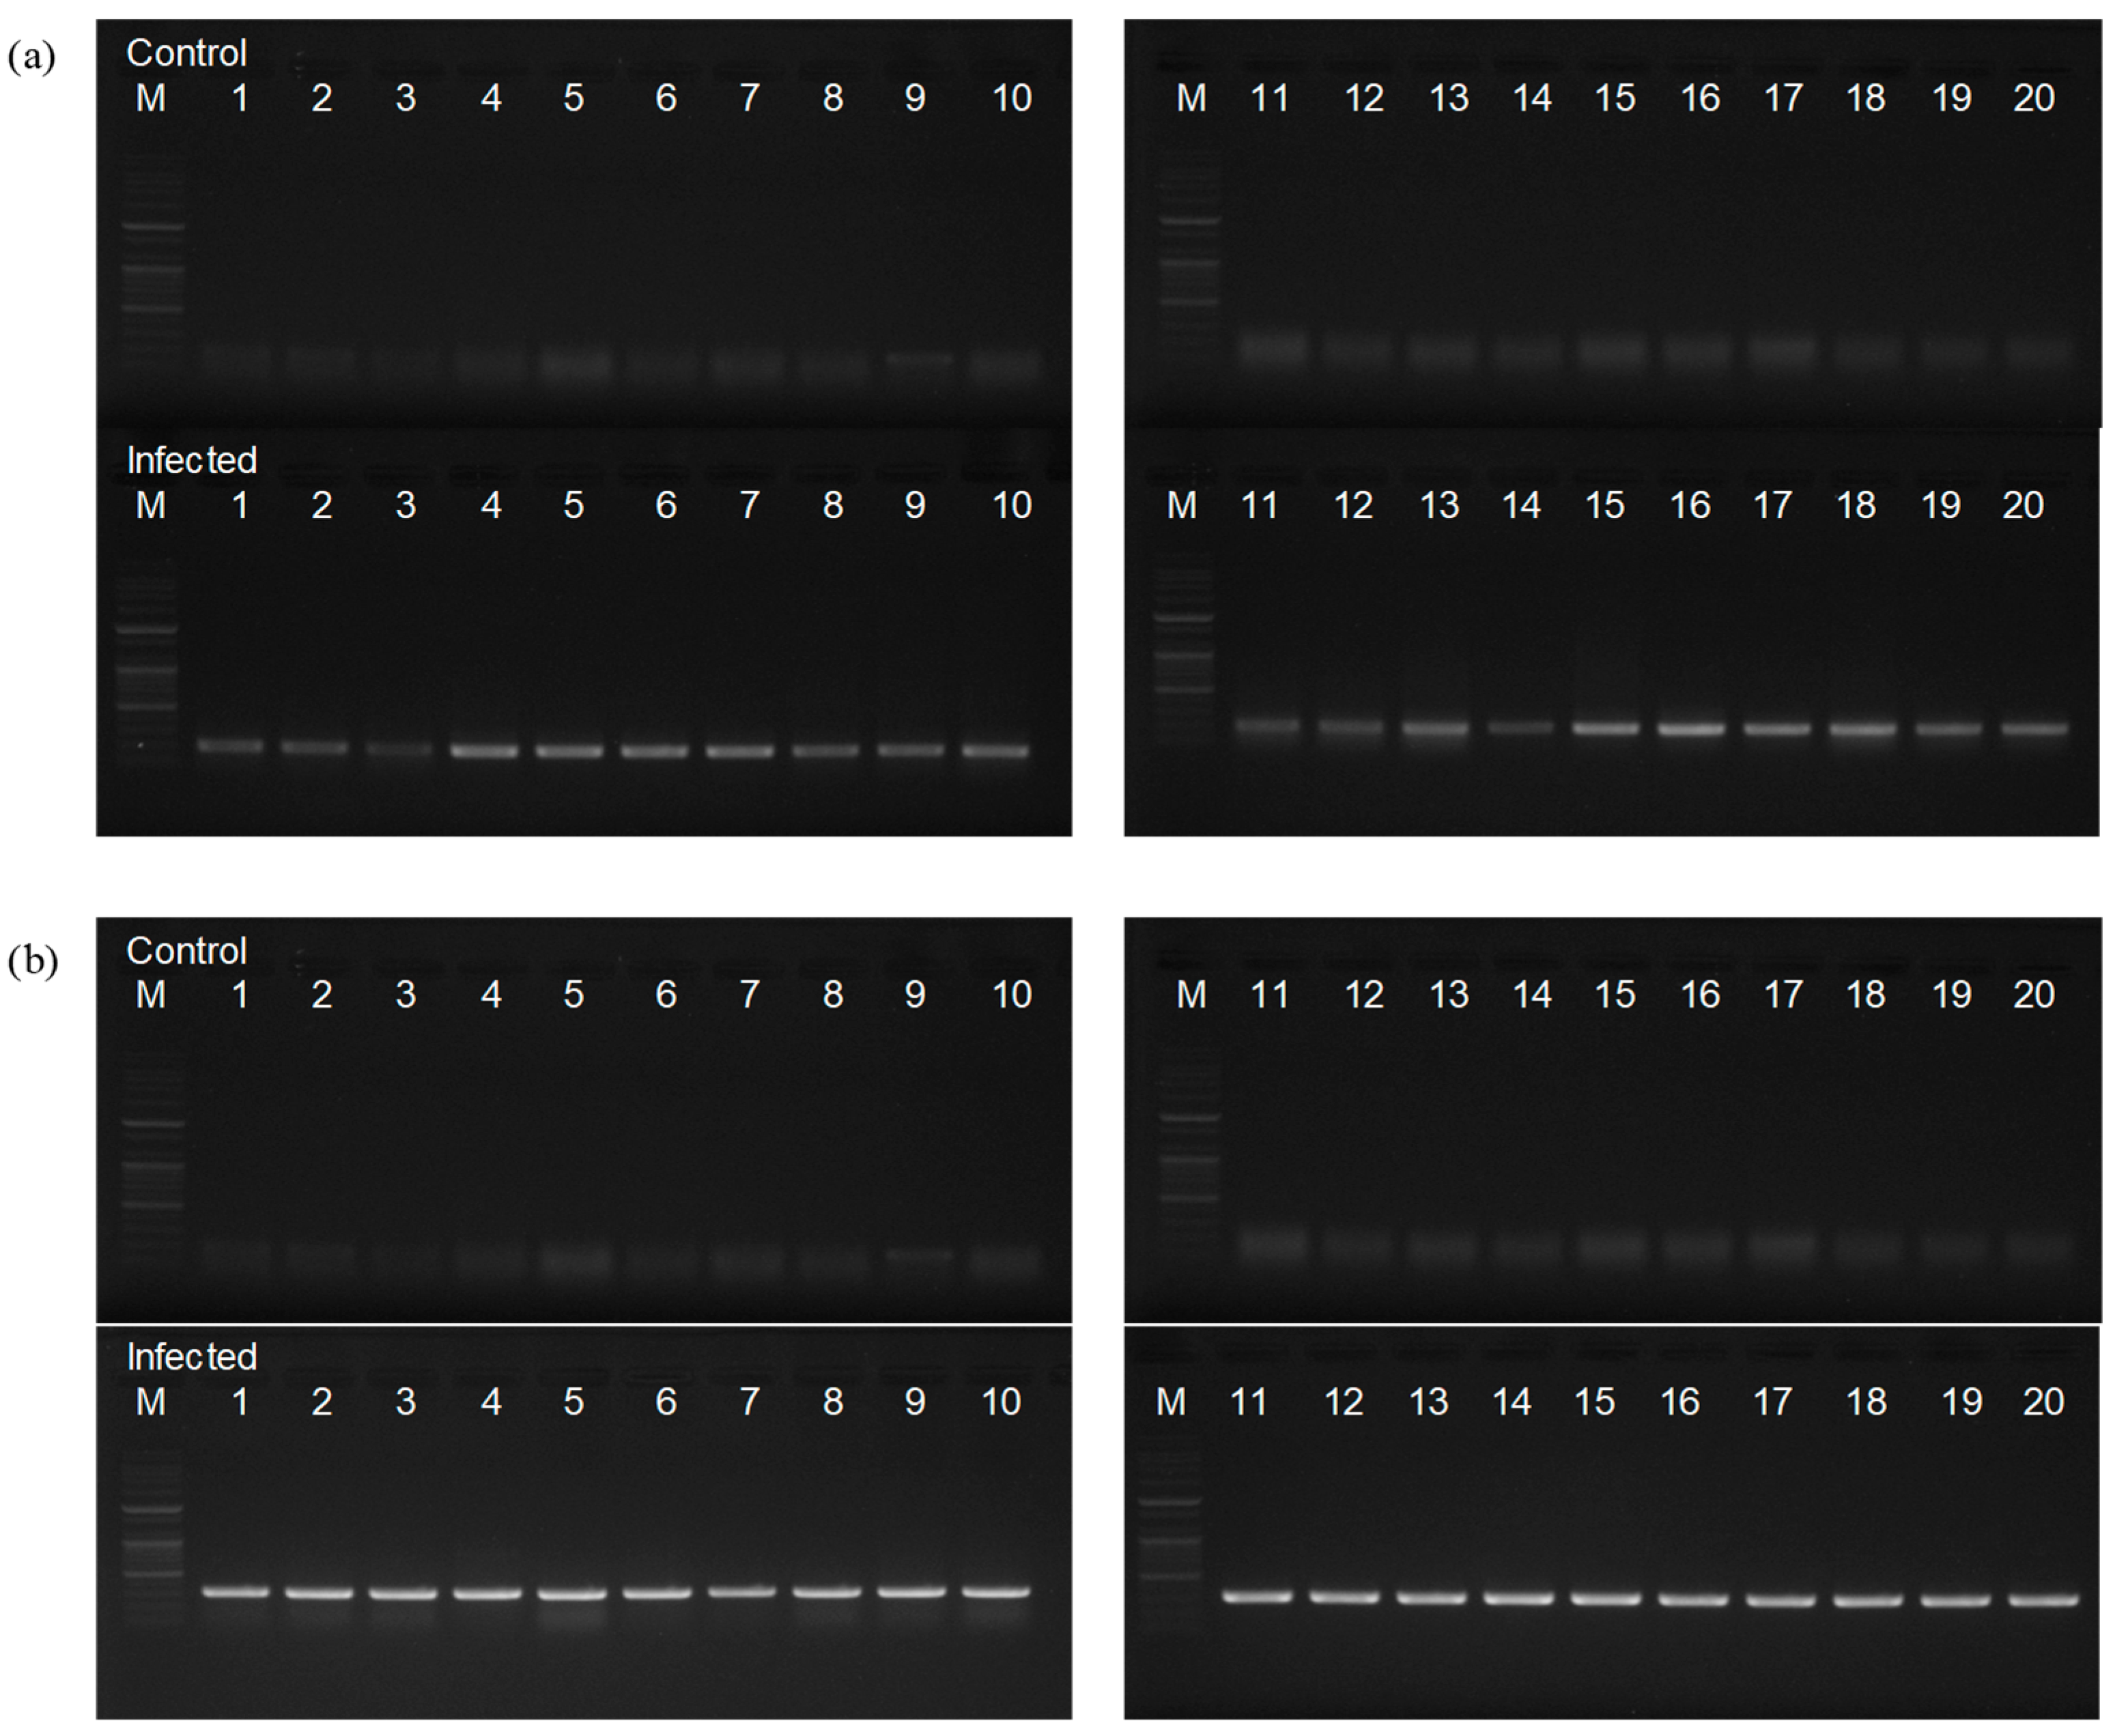
Microscopic examination of posterior intestinal tissues confirmed the presence of E. leei myxospores in the infected group, whereas no spores were detected in the controls. Molecular confirmation of the infection was achieved using PCR assays targeting the 18S rRNA region. Using the primers reported by Shin et al. [32], amplification bands of the expected size were observed exclusively in the samples of infected individuals. The newly designed primer set yielded consistent and sharper bands in the infected fish, confirming its higher specificity and diagnostic sensitivity (Figure 2).

3.2. Transcriptomic Profiling

RNA-seq of the posterior intestinal tissues yielded high-quality sequencing data across all individual samples (n = 20 per group). On average, 78–79 million raw paired-end reads were generated per library, more than 95% of which were retained after adapter trimming and quality filtering. The base quality scores were robust, with Q20 values consistently exceeding 99.5%, confirming excellent sequencing fidelity.
After preprocessing, the clean reads were aligned to the olive flounder reference genome (GCF_024713975.1). The average mapping efficiency was 94.73% in the uninfected control group and decreased markedly to 77.73% in the E. leei-infected group (Table 3). Table 3 presents the group-level summary statistics, and detailed sequencing metrics for all 40 libraries are provided in Supplementary Table S1. The reduced mapping ratio in the infected fish suggests that transcriptomic perturbations and altered gene expression profiles are associated with chronic infection and likely inclusion of parasite-derived transcripts in the tissue.
Transcriptome assembly produced 20,559 transcripts with a mean length of 17,428 bp in control fish and 20,152 transcripts with a mean length of 17,269 bp in infected fish (Table 3). In the present study, mean length of transcripts is defined as the average nucleotide length of assembled, non-redundant transcript models reconstructed from mapped reads using StringTie, reflecting the mean size of distinct transcript isoforms. The similar transcript counts indicate overall sequencing completeness, whereas subtle length differences may reflect structural remodeling of expressed genes in response to infection.
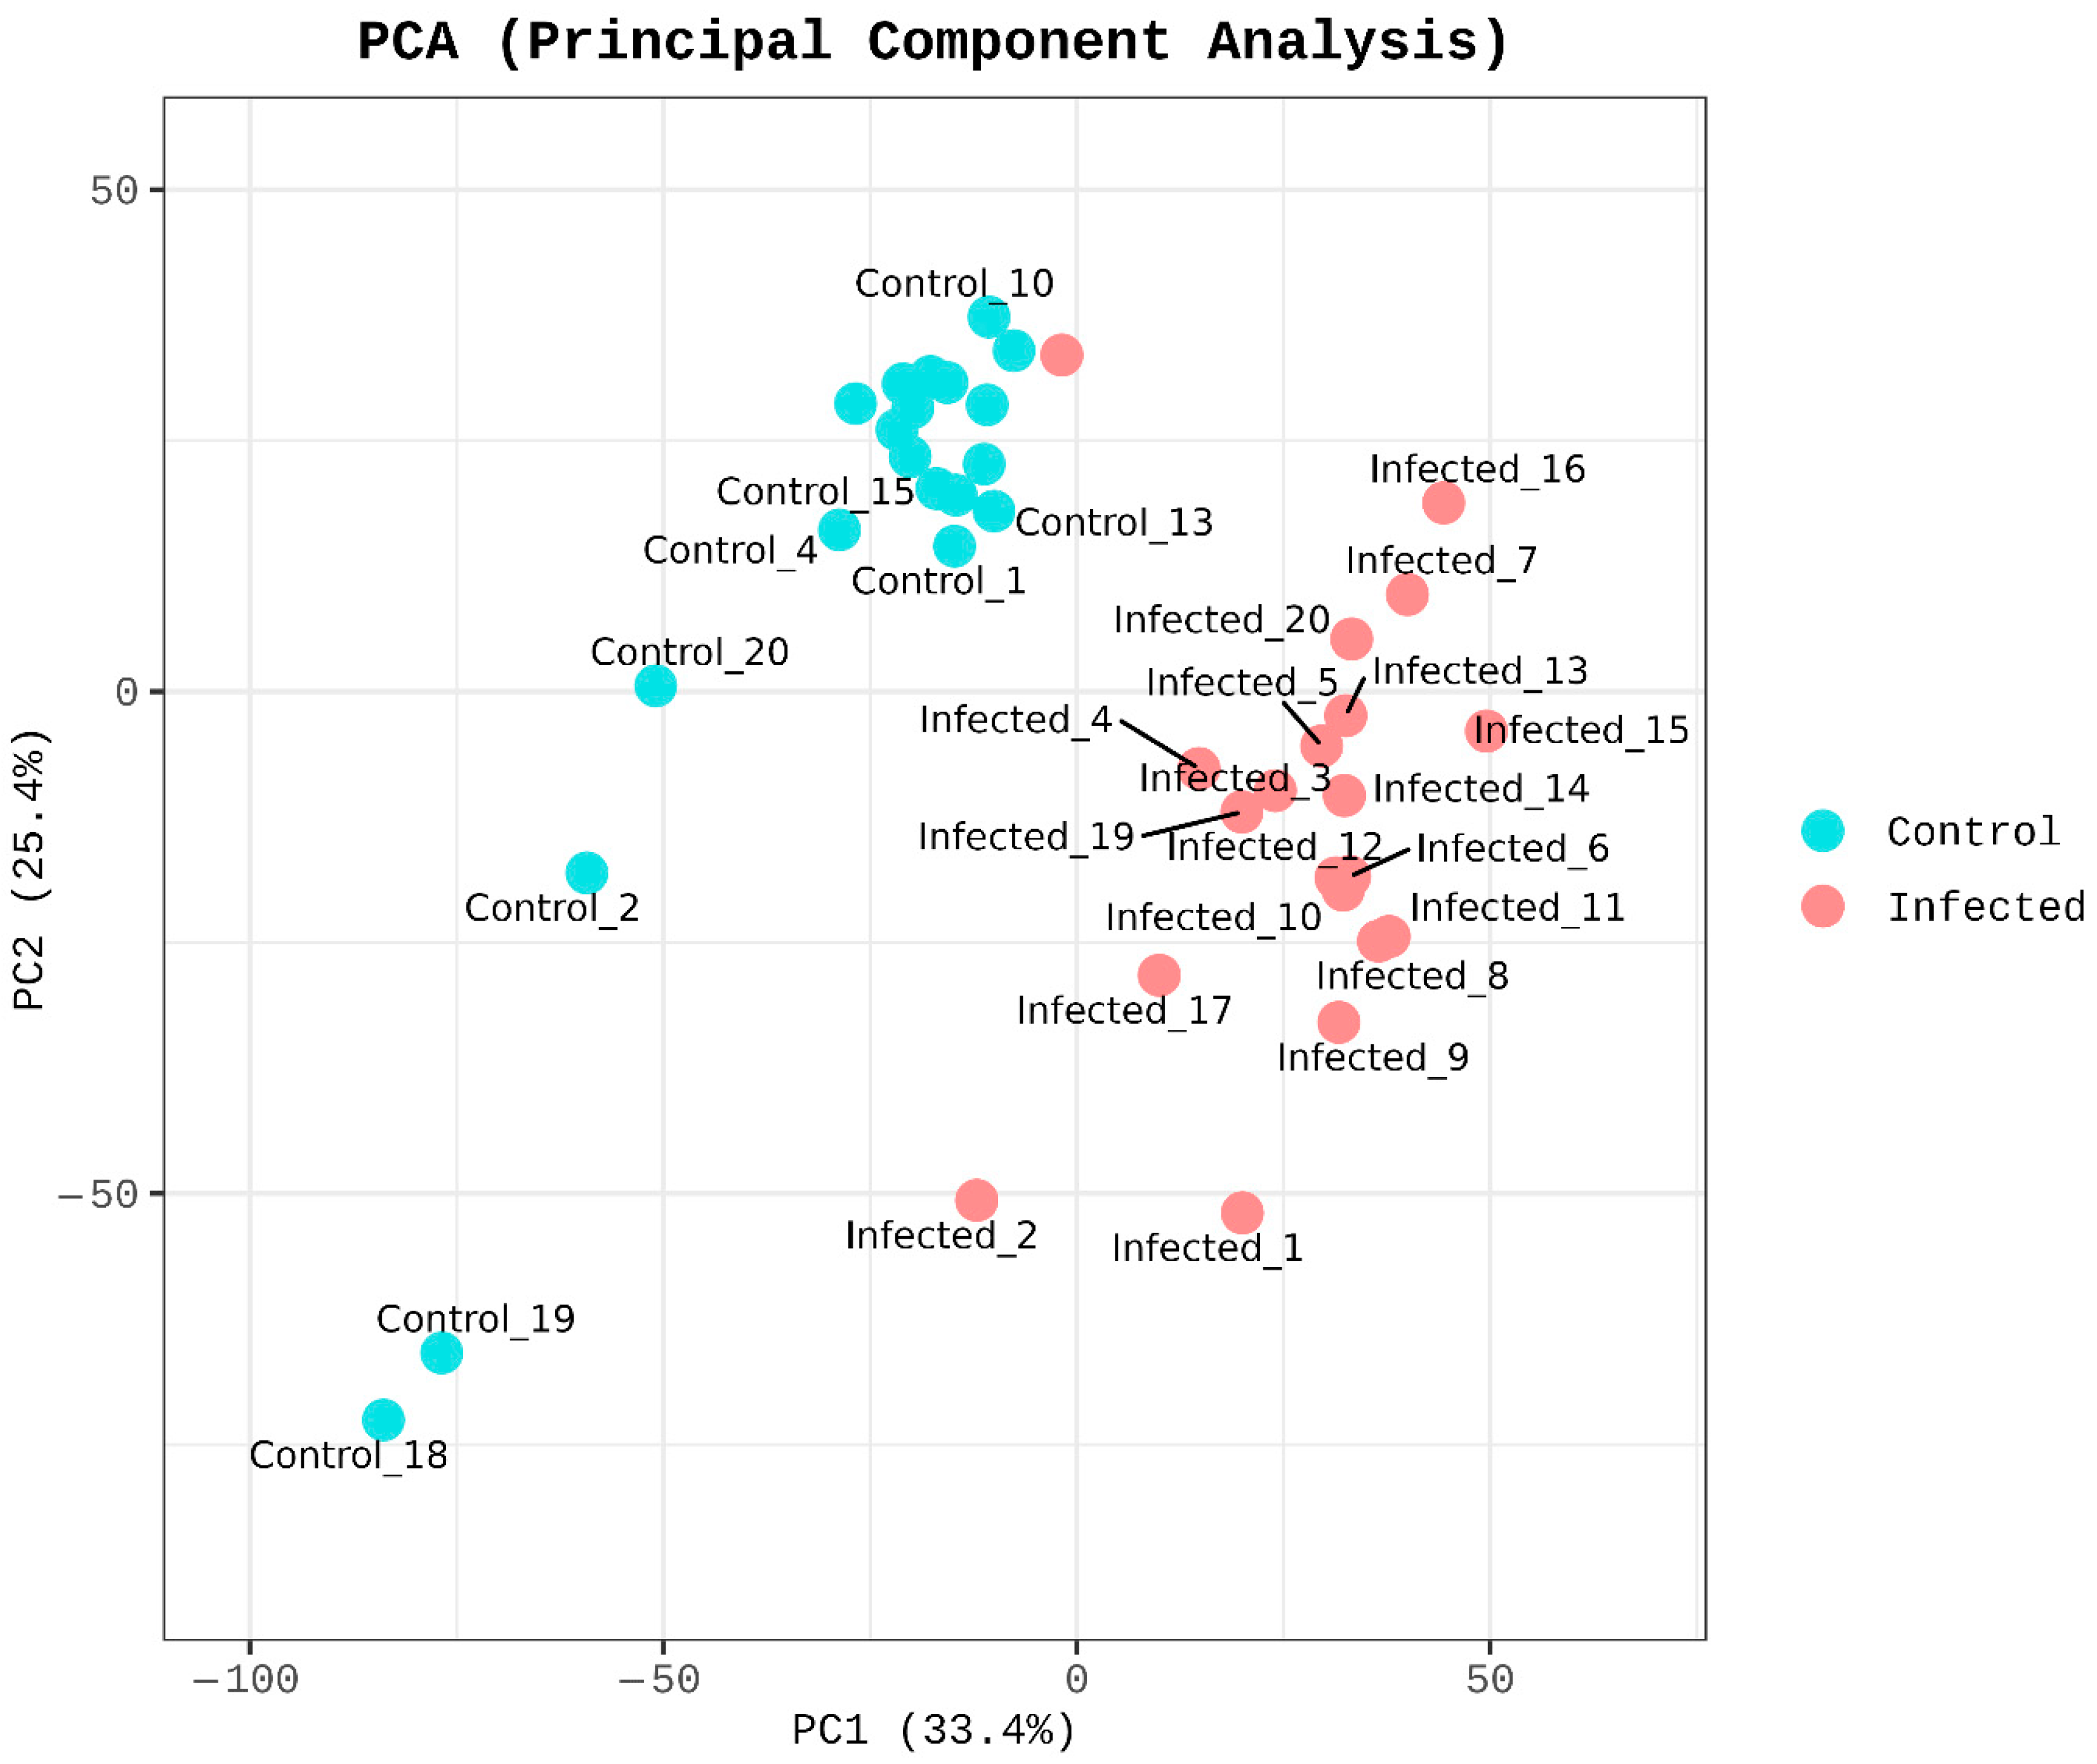
Multivariate analysis further confirmed the reliability of the dataset. PCA revealed a clear separation between the two groups, with PC1 (33.4%) and PC2 (25.4%) together explaining 58.8% of the total variance (Figure 3). Although some inter-individual variation was observed—particularly among control samples—the overall grouping pattern still reflected infection-driven transcriptomic divergence, indicating consistent biological responses among infected fish despite inherent field variability.
Differential expression analysis identified a total of 2666 DEGs (|log2FC| ≥ 2, adjusted p < 0.05), including 1589 downregulated (59.6%) and 1077 upregulated (40.4%) genes. A complete gene-by-gene list with log2FC and adjusted p-values is provided in Supplementary Table S2. Hierarchical clustering of these DEGs clearly distinguished the control and infected groups (Figure 4). The samples of infected fish showed a larger proportion of downregulated transcripts, whereas a smaller subset of genes was strongly upregulated.
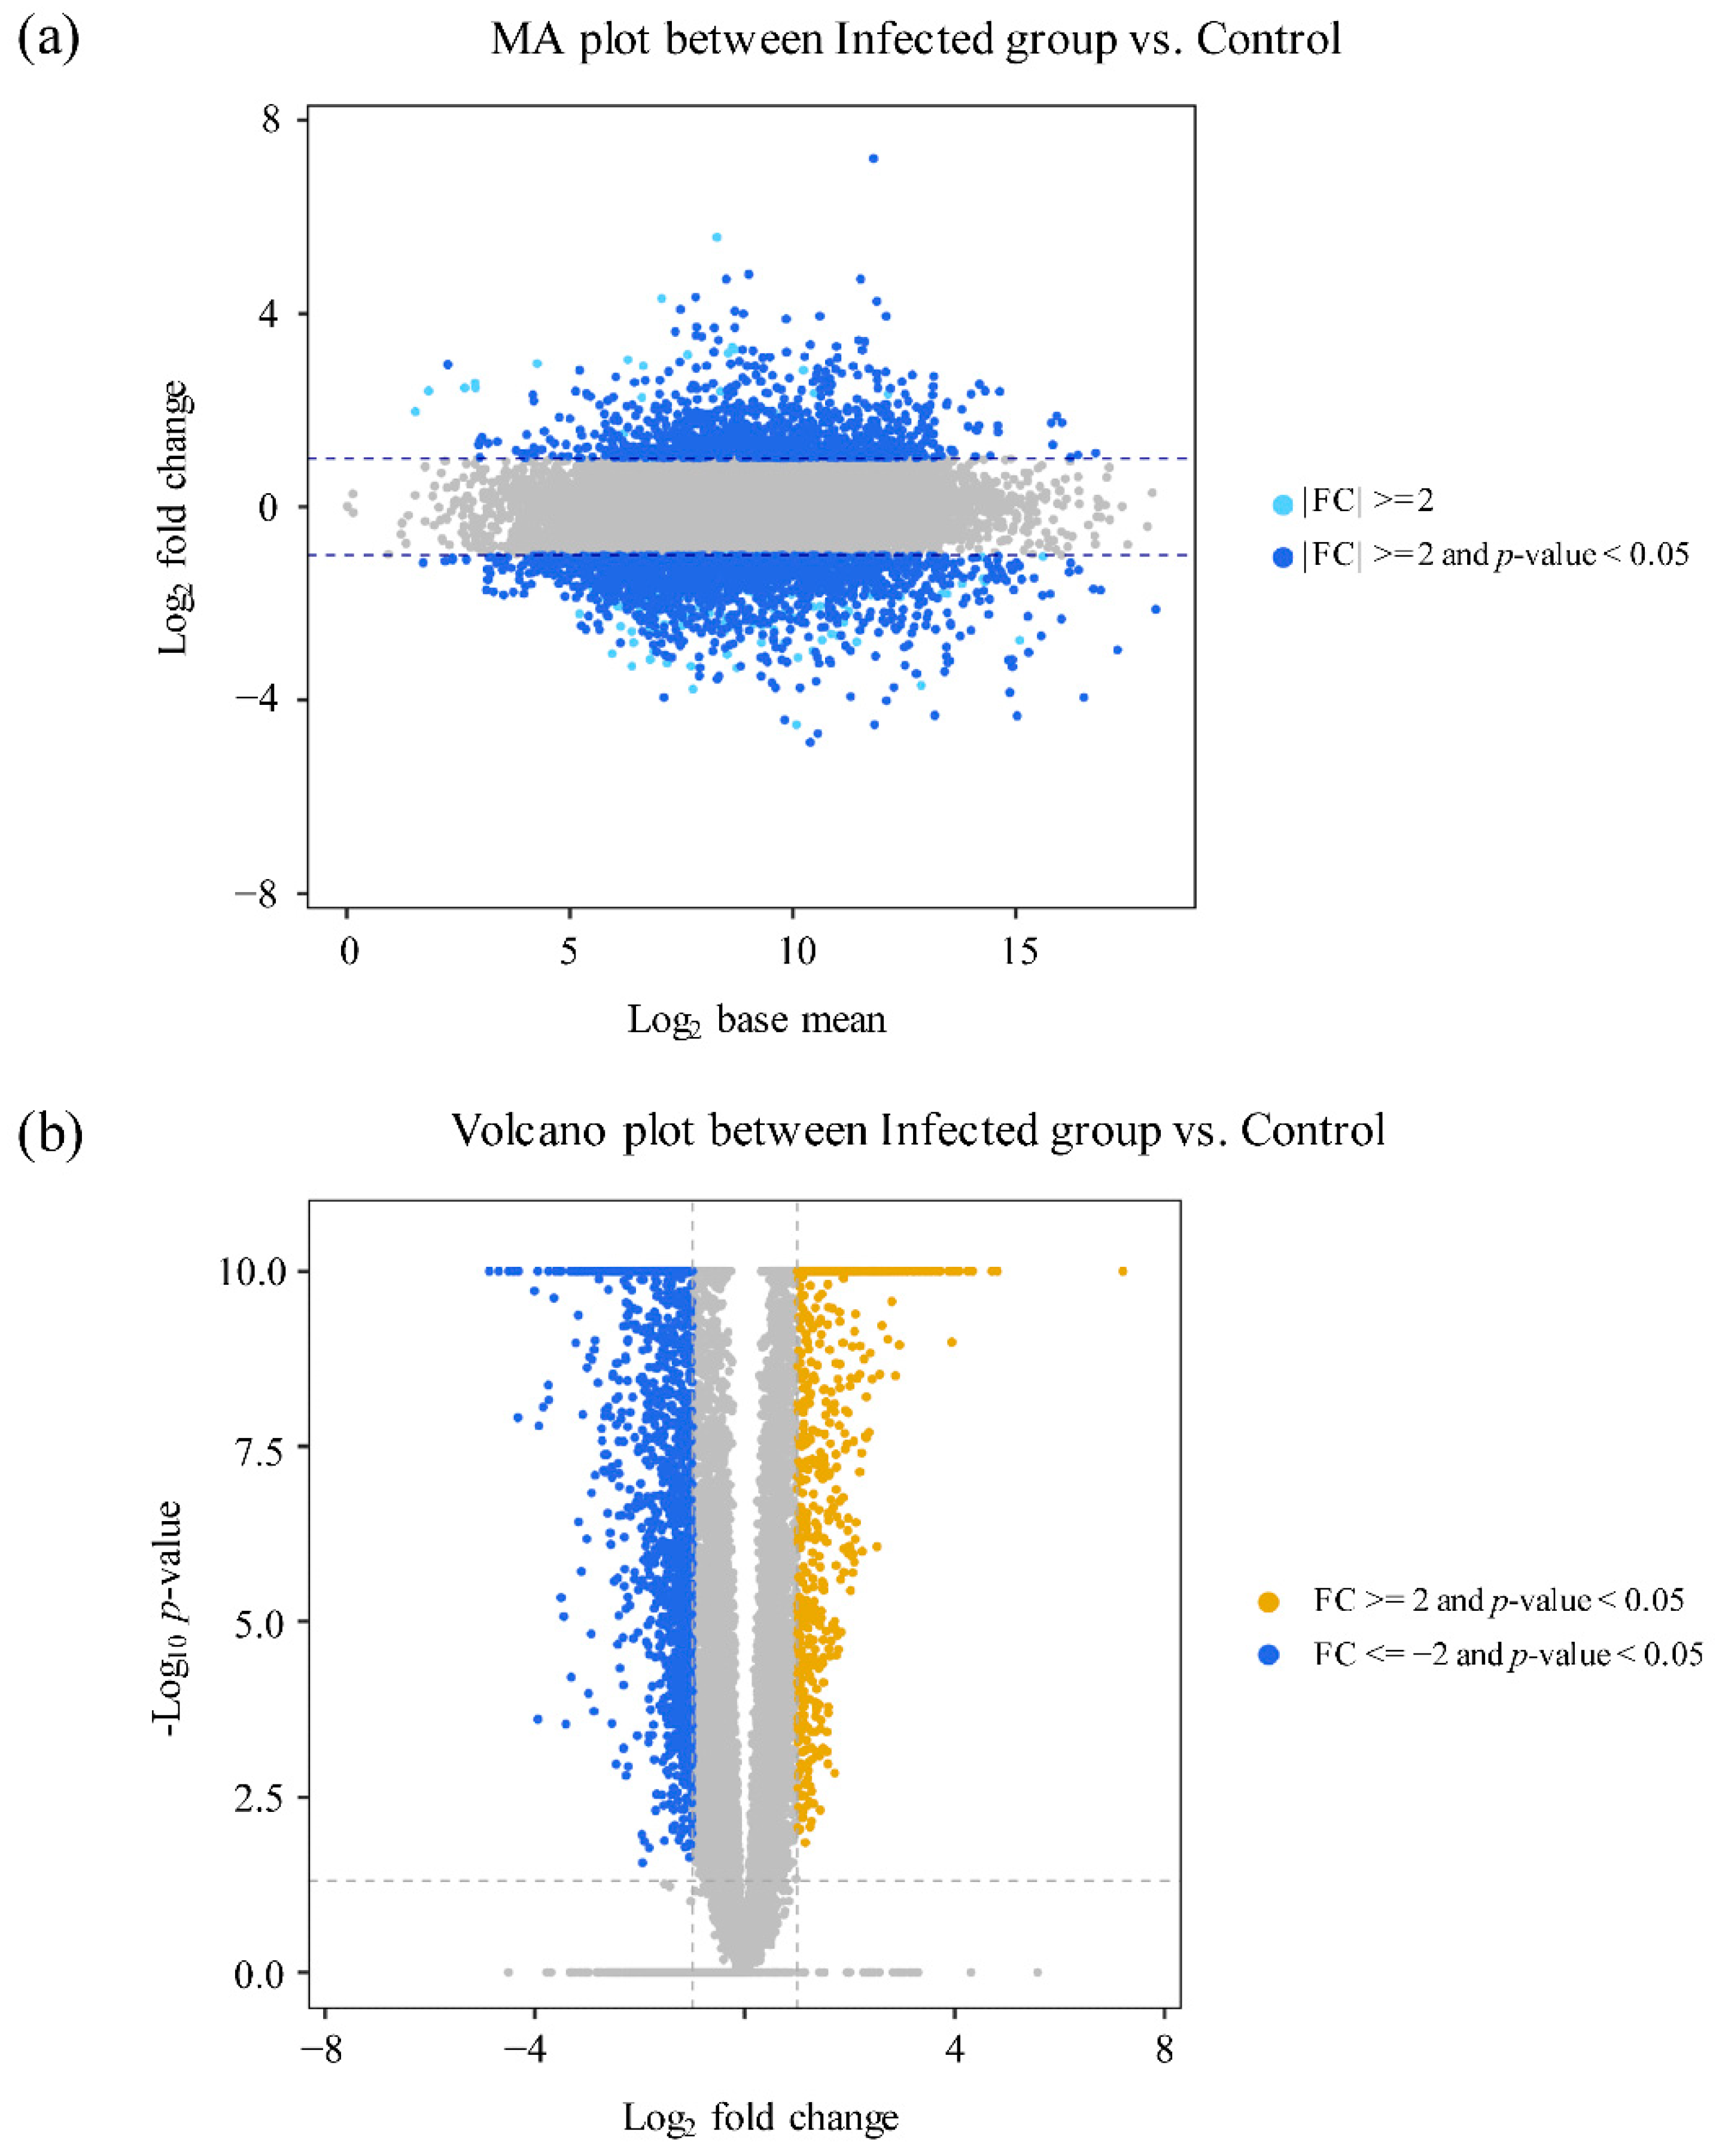
Global expression patterns were illustrated using MA and volcano plots (Figure 5a,b). Both analyses revealed an asymmetric distribution of DEGs, with downregulated genes being more abundant than upregulated genes.

3.3. Functional Enrichment Analyses

3.3.1. GO Enrichment Analysis

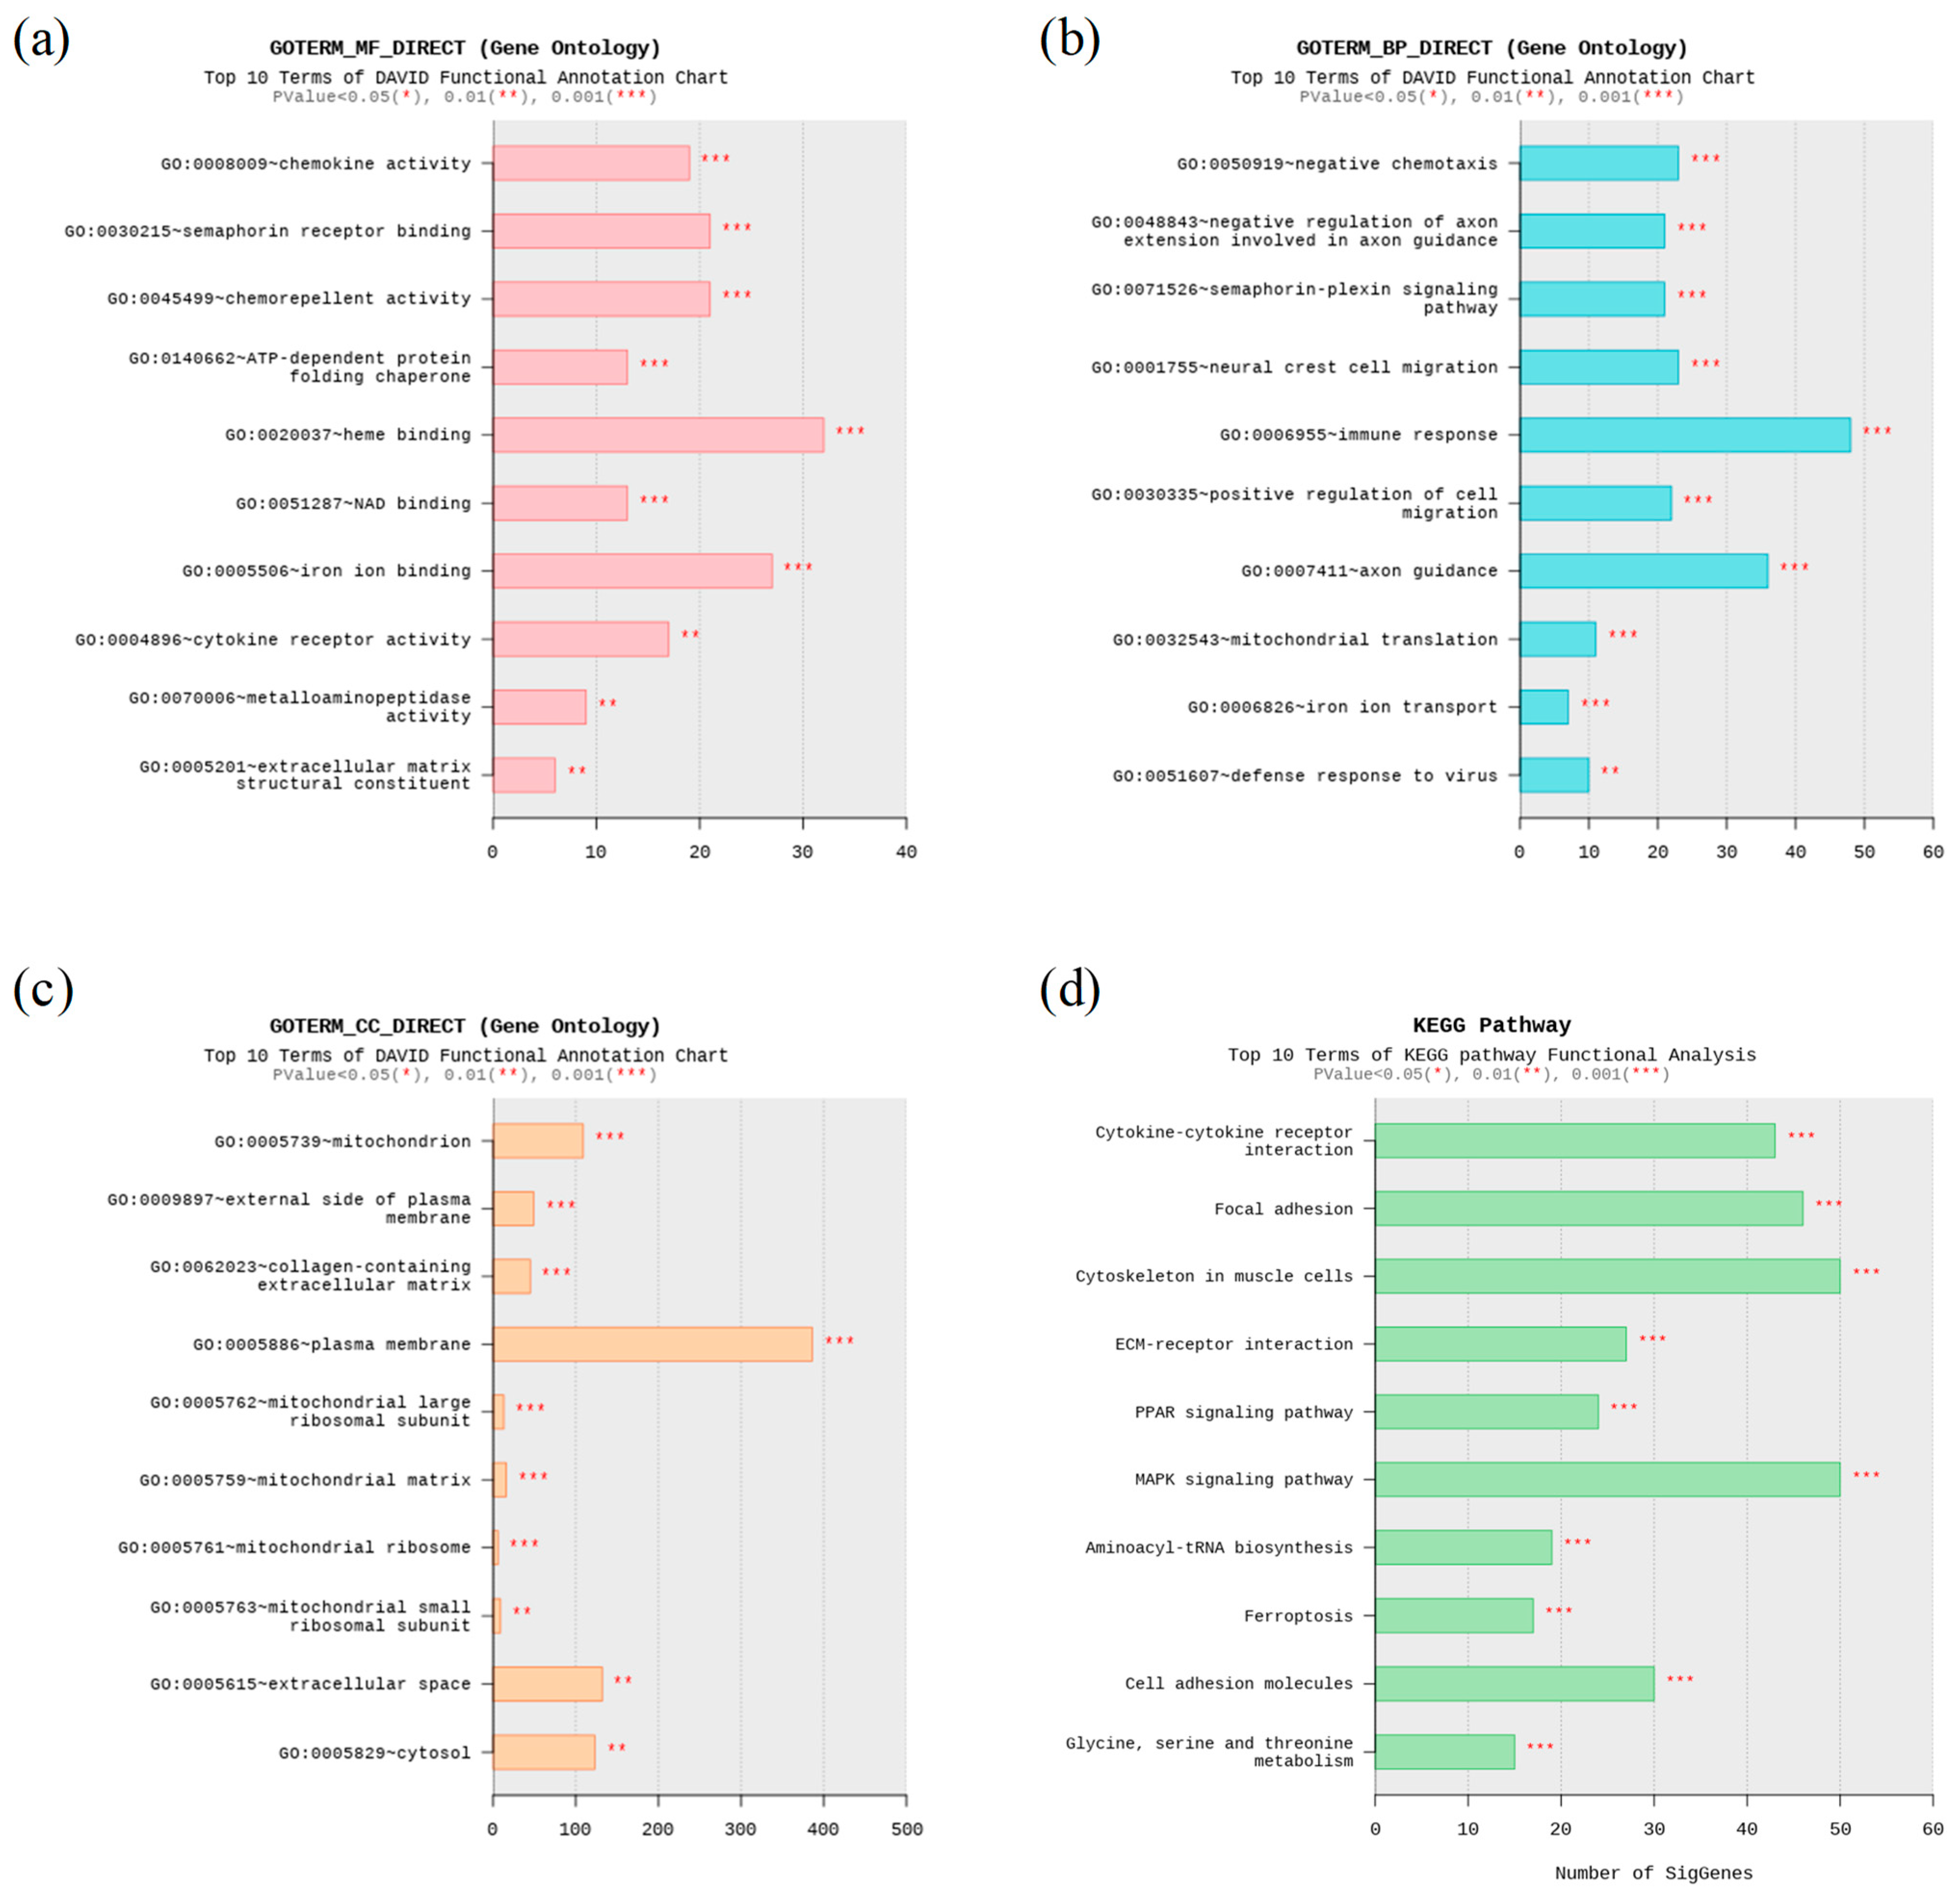
GO enrichment analysis of the DEGs revealed significant modulation across the three major GO categories MF, BP, and CC. In the MF category (Figure 6a), the most enriched terms were heme binding (n = 32), iron ion binding (n = 27), semaphorin receptor binding (n = 21), chemorepellent activity (n = 21), and chemokine activity (n = 19). Other notable terms included cytokine receptor activity (n = 17) and ATP-dependent protein-folding chaperones (n = 13), reflecting alterations in signaling and ligand–receptor interactions. In the BP category (Figure 6b), the most enriched terms were immune response (n = 48), axon guidance (n = 36), negative chemotaxis (n = 23), neural crest cell migration (n = 23), and positive regulation of cell migration (n = 22). Additional immune-related processes included semaphorin–plexin signaling pathway (n = 21) and defense response to virus (n = 10), highlighting the regulation of migration and host defense. In the CC category (Figure 6c), the enriched terms were predominantly membrane- and mitochondria-associated, including the plasma membrane (n = 386), extracellular space (n = 132), cytosol (n = 123), mitochondrion (n = 109), and external side of the plasma membrane (n = 49). These results indicate that many DEGs encode proteins localized to the cell surface or intracellular compartments that are central to immune signaling.

3.3.2. KEGG Enrichment Analysis

KEGG pathway analysis identified the top ten enriched pathways (Figure 6d). Comprehensive enrichment statistics (KEGG IDs, gene sets, and FDR-adjusted p-values) are provided in Supplementary Table S3. The most significant pathways included the cytoskeleton in muscle cells (n = 50) and the MAPK signaling pathway (n = 50), followed by focal adhesion (n = 46), cytokine–cytokine receptor interaction (n = 43), cell adhesion molecules (n = 30), and ECM–receptor interaction (n = 27). Additional enriched pathways included the PPAR signaling pathway (n = 24); aminoacyl-tRNA biosynthesis (n = 19); ferroptosis (n = 17); and glycine, serine, and threonine metabolism (n = 15). Collectively, these KEGG results demonstrate that E. leei infection induces transcriptomic reprogramming across diverse biological processes, including immune signaling, structural remodeling, metabolic regulation, and cell death.

3.4. Immune-Related Pathway Alterations

Because immune-associated terms and pathways were prominently enriched in both GO and KEGG analyses, we focused specifically on the DEGs assigned to immune-related KEGG pathways. Six pathways were identified: NOD-like receptor signaling (n = 20), Toll-like receptor signaling (n = 12), C-type lectin receptor signaling (n = 12), intestinal immune network for IgA production (n = 8), RIG-I-like receptor signaling (n = 8), and cytosolic DNA sensing (n = 8) (Figure 7a–f; Table 4). Pathway maps for these six KEGG pathways are shown in Supplementary Figure S1, where nodes are color-coded by the direction and magnitude of differential expression.
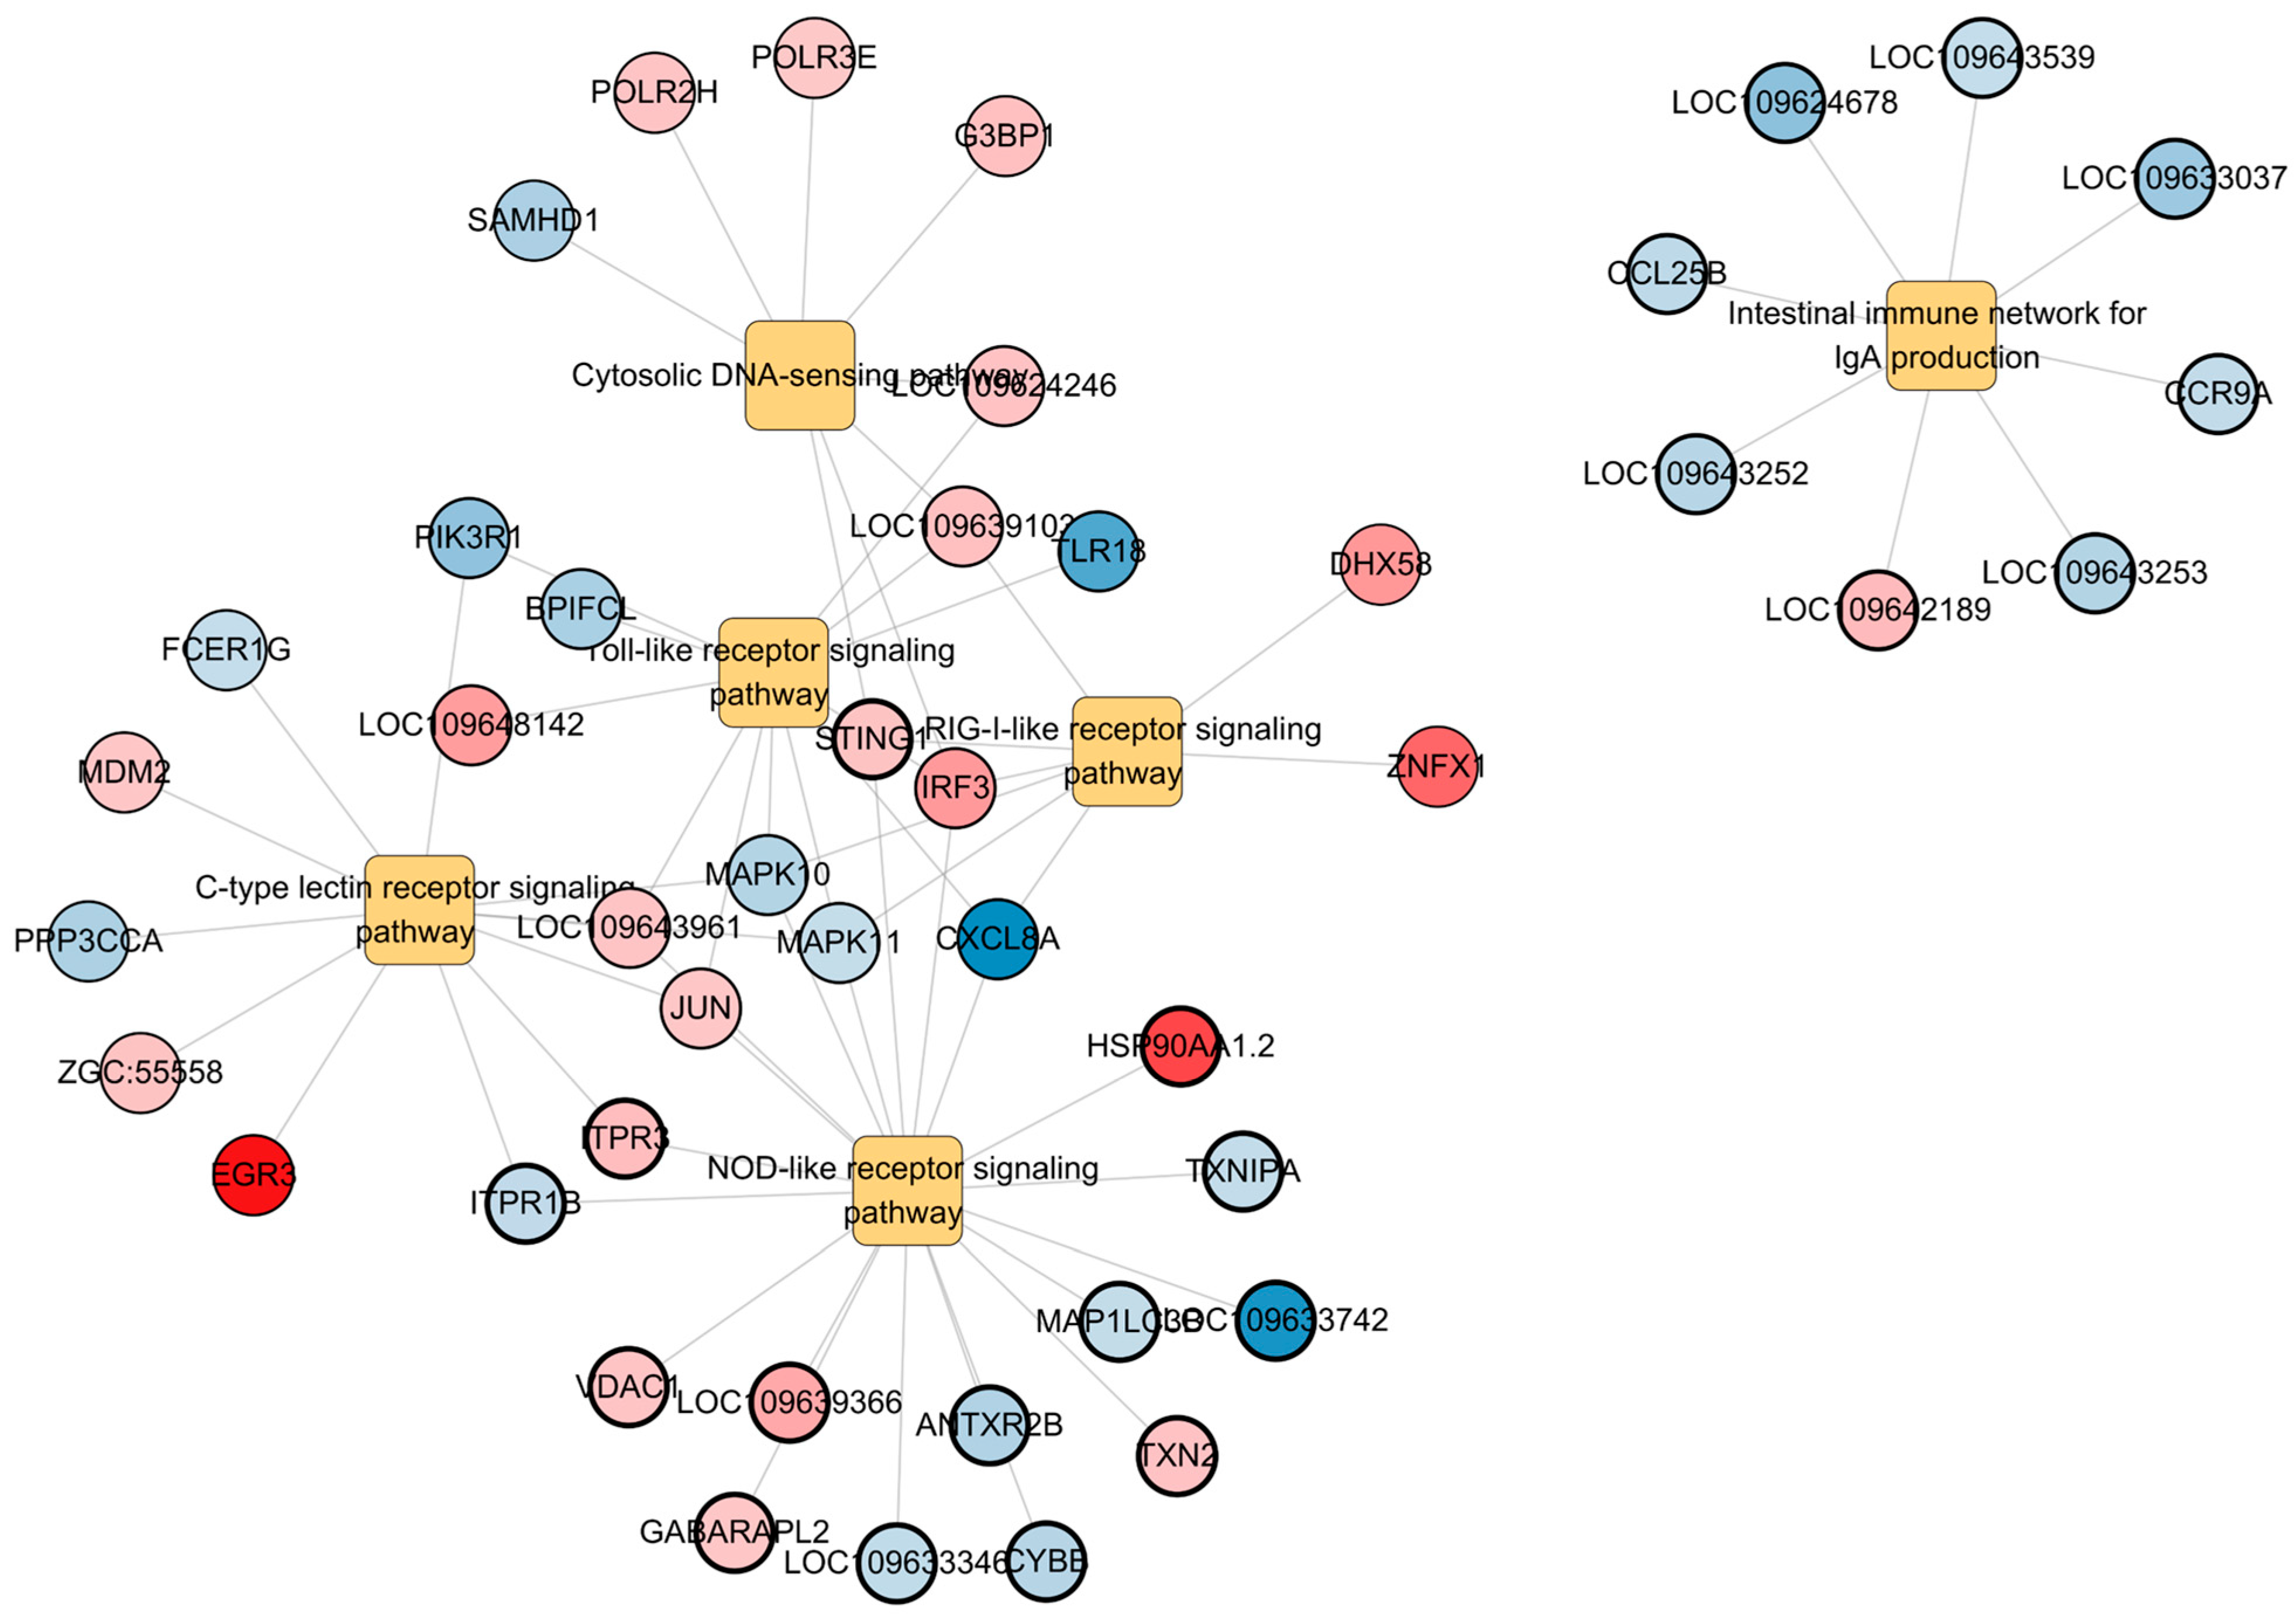
In the Toll-like receptor pathway, several genes were markedly downregulated, including cxcl8a (log2FC = −7.89), tlr18 (−6.12), pik3r1 (−4.00), and MAPK family members (mapk10, mapk11), whereas jun and irf3 were significantly upregulated. The NOD-like receptor pathway showed extensive modulation, with downregulation of itpr1b, map1lc3b, and cybb, and strong upregulation of sting1, irf3, and the calcium-release channel itpr3. The intestinal IgA network was primarily downregulated, including ccl25b and ccr9a, suggesting the suppression of mucosal lymphocyte trafficking. Both positive and negative changes were detected in the C-type lectin receptor pathway, including strong upregulation of egr3 (9.22) and downregulation of ppp3cca and fcer1g. In the RIG-I-like receptor pathway, dhx58 (4.03) and znfx1 (6.01) were upregulated, whereas the cytosolic DNA-sensing pathway featured the upregulation of g3bp1 and polr3e, with concomitant downregulation of samhd1.
Gene-pathway network analysis revealed that several DEGs were shared across multiple pathways (Figure 8). In particular, cxcl8a, pik3r1, mapk10, itpr1b, mapk11, jun, irf3, sting1, and itpr3 were the central nodes that linked multiple immune pathways. Genes marked with an asterisk in Table 4 denote the shared DEGs, underscoring their importance in coordinating the crosstalk between receptor signaling, nucleic acid sensing, and mucosal immunity.

3.5. Validation of DEGs by qRT-PCR

To evaluate the reliability of the RNA-seq data, qRT-PCR was conducted for nine DEGs shared across multiple immune-related pathways: cxcl8a, irf3, itpr1b, itpr3, jun, mapk10, mapk11, pik3r1, and sting1. These genes were selected as representative hub genes, based on their repeated occurrence across multiple immune pathways (Table 4). The expression patterns obtained by qRT-PCR were highly consistent with those obtained by RNA-seq (Figure 9a). Genes that were strongly downregulated according to RNA-seq, such as cxcl8a (log2FC = −7.89) and pik3r1 (−4.00), also showed significant suppression in the qRT-PCR results. Conversely, genes upregulated in the RNA-seq data, including irf3 (3.93), jun (2.09), and sting1 (2.21), exhibited similar induction trends in the qRT-PCR analysis.
Correlation analysis further confirmed the robustness of the RNA-seq dataset. A strong positive correlation was observed between RNA-seq and qRT-PCR log2 fold changes (r = 0.922, R2 = 0.851, p < 0.001), demonstrating high concordance between the two methods (Figure 9b). These results validated the transcriptomic findings and underscored the involvement of the selected DEGs in immune-related pathways affected by E. leei infection.

4. Discussion

This study characterized the intestinal immune responses to E. leei infection in olive flounder; this pathological process manifested as emaciation disease and remains a major concern in aquaculture. Although the clinical consequences of this infection have been described, the underlying mechanisms driving immune imbalance in the host intestine are still not fully understood. The posterior intestine was selected for transcriptomic profiling because it is frequently the initial colonization site of E. leei (posterior-to-anterior progression) [19], where epithelial disruption and mucosal immune suppression are frequently the most severe. This region also plays a pivotal role in nutrient absorption [33,34], particularly under conditions where the upstream segments are compromised, such that pathological alterations may directly contribute to the wasting phenotype characteristics of emaciation diseases [35]. By integrating RNA-seq data, KEGG pathway enrichment, and qRT-PCR validation, we identified six immune-related pathways, i.e., Toll-like receptor, NOD-like receptor, C-type lectin receptor, RIG-I-like receptor, cytosolic DNA-sensing, and intestinal immunoglobulin network. We thus observed a coordinated modulation of host defense mechanisms. The following sections discuss these pathway-specific alterations in conjunction with the functions of key differentially expressed and hub genes identified in our network analyses and their implications for host–parasite interactions during chronic infection.

4.1. Suppression of Chemokine and Cytokine Signaling

A salient feature of the infected transcriptome was the broad suppression of chemokine-driven leukocyte trafficking. Pronounced downregulation of cxcl8a and downstream MAPK nodes (mapk10, mapk11, pik3r1) suggests impaired neutrophil recruitment and attenuated cytokine relay at the mucosal surface [36,37]. Such dampening may alleviate host-derived inflammation, but, under chronic E. leei colonization, may compromise effective parasite clearance and epithelial restitution. Consistent with this, cxcl8a, pik3r1, mapk10, and mapk11 were identified as central hub genes within the chemokine/MAPK module, highlighting their importance as key regulators of epithelial inflammation in the E. leei–infected intestine.
CXCL8 (IL-8) is a potent neutrophil chemoattractant, and its reduced expression is associated with impaired leukocyte recruitment in teleost intestines [36]. In turbot, E. leei infection similarly suppressed cxcl8 and il1b expression, supporting the parasite-driven attenuation of proinflammatory signaling [38,39]. MAPK signaling, which governs cytokine responses and cellular stress adaptation, has also been broadly repressed in gilthead seabream during chronic enteromyxosis [40,41]. Collectively, these observations suggest that suppression of chemokine/MAPK signaling represents a parasite-driven strategy to minimize acute inflammation while favoring persistent colonization [42].

4.2. Activation of Nucleic Acid-Sensing Pathways

In contrast to the suppression of chemokine signaling, several nucleic acid-sensing pathways were transcriptionally activated. Among them, RIG-I-like receptor and the cytosolic DNA-sensing cGAS–STING axis showed strong upregulation of sting1 and irf3, reflecting a compensatory antiviral-like response to parasite-derived nucleic acids or secondary microbial shifts following epithelial disruption [43,44,45]. This activation, and its crosstalk with MAPK/NF-κB signaling, likely reinforces a persistent low-grade inflammatory tone insufficient to eliminate the parasite yet capable of sustaining tissue stress and metabolic exhaustion [46].
The STING–IRF3 axis plays a central role in cytosolic DNA recognition that mediates type I interferon and downstream antiviral responses [47,48]. The elevated expression of sting1 and irf3 in the infected posterior intestine suggests that olive flounder mount a compensatory immune program resembling antiviral defense, even though the primary trigger is a parasite rather than a virus. Comparable activation of nucleic acid-sensing pathways has been reported in teleosts upon viral infection, e.g., nodavirus infection in golden pompano (Trachinotus blochii) [49] and VHSV in rainbow trout (Oncorhynchus mykiss) [50], where irf3 induction is considered a hallmark of innate antiviral response. In addition, jun, a component of the AP-1 complex [51], was upregulated and may act downstream of MAPK and stress-related signaling. This gene has been associated with epithelial immunity in mandarin fish (Siniperca chuatsi) [52] and intestinal inflammation in yellow croaker (Larimichthys crocea) [53], indicating that activation of the AP-1 pathway may modulate both cytokine expression and tissue remodeling under chronic infection. These data collectively point to selective activation of nucleic acid-sensing and stress-responsive pathways. Although such activation may compensate for suppressed chemokine signaling, its chronic persistence likely imposes oxidative and metabolic costs on the host [54,55,56], contributing to the progressive wasting phenotype characteristic of enteromyxosis.

4.3. Impairment of Mucosal and Adaptive Immunity

Transcriptomic alterations in the infected posterior intestine indicate a broad suppression of mucosal and adaptative immune mechanisms. Genes associated with the intestinal IgA network (ccl25b and ccr9a) and the C-type lectin receptor pathway (fcer1g and ppp3cca) were strongly suppressed in the infected fish, indicating that mucosal and adaptive immune functions were impaired. CCR9–CCL25 signaling is crucial for the trafficking of T and B lymphocytes to the gut [57], and its downregulation suggests reduced lymphocyte infiltration and weakened adaptive responses at the infection site [58]. In gilthead sea bream, E. leei infection triggers elevated intestinal IgM+ and IgT+ cell responses, although the magnitude and timing of activation vary across the course of infection [59,60]. These observations suggest that myxozoan parasites modulate rather than suppress mucosal B-cell activity, resulting in functional reprogramming of the mucosal adaptive immune system during chronic infection. Repression of fcer1g further implies weakened antigen presentation and impaired dendritic cell activity [61]. Such weakening of mucosal defenses may allow the parasite to persist chronically within the intestinal epithelium [62], ultimately contributing to the development of emaciation disease.
In parallel, alterations in the C-type lectin receptor and NOD-like receptor pathways indicate remodeling of pattern-recognition processes at the epithelial–microbial interface [63,64]. Differential expression of ppp3cca and itpr1b suggests reprogramming of mucin–microbe interactions and epithelial stress signaling, consistent with a transition from acute to chronic mucosal surveillance in which epithelial danger cues are detected but robust effector responses are curtailed.
KEGG enrichment also retrieved the intestinal immune network for IgA production, which we interpret as a teleost counterpart of the mucosal immunoglobulin system, principally involving IgT/IgZ and IgM [65]. Downregulation of ccl25b and ccr9a within this pathway suggests a rebalanced B-cell program at the gut surface during chronic E. leei infection [66]. Although transcriptomic data alone cannot specify IgT/IgZ effector states, the overall expression pattern implies a shift toward regulatory rather than protective mucosal immunity [67]. This immunological reprogramming likely facilitates the long-term coexistence of the parasite within the intestinal epithelium [68].

4.4. Functional Roles of Hub Genes and Biomarker Potential

Nine hub genes (cxcl8a, pik3r1, mapk10, itpr1b, mapk11, jun, irf3, sting1, and itpr3) were validated by qRT-PCR, which exhibited expression patterns that closely mirrored those obtained by RNA-seq (r = 0.922, R2 = 0.851). This concordance supports both data reliability and the potential diagnostic utility of these genes. The functional diversity of these hubs delineates the mechanistic balance between suppressed chemokine signaling and activated nucleic acid-sensing responses.
Cxcl8a encodes interleukin-8, a potent neutrophil chemoattractant, and its repression reflects the weakened innate recruitment of leukocytes [69]. Downregulation of pik3r1, a regulator of PI3K signaling and cell survival, suggests compromised intracellular communication and cytokine transduction [70]. Mapk10 and mapk11 act as stress-responsive kinases whose suppression implies reduced MAPK cascade activity [71,72]. Itpr1b and itpr3 regulate Ca2+ release required for lymphocyte activation, suggesting perturbation of calcium-dependent signaling [73]. Conversely, jun integrates cytokine and stress pathways [51], irf3 directs interferon-mediated defense [74], and sting1 serves as a cytosolic DNA sensor, forming a defense axis that is enhanced during infection [47]. Collectively, these results point to a dual regulatory system in which proinflammatory chemokine pathways are attenuated while nucleic acid-sensing pathways remain active. Comparable hub-gene approaches have identified tlr5, il8, and ifn as infection markers in teleosts [75,76,77,78]. Thus, extending this biomarker framework to parasitic diseases underscore the potential of these nine genes as promising molecular biomarkers of E. leei infection in olive flounder.

4.5. Network-Level Interactions and Integrative Insights

Cytoscape-based network mapping (Figure 8) showed that DEGs were interconnected across multiple immune pathways, suggesting that E. leei infection induces coordinated transcriptomic remodeling rather than isolated pathway changes. In teleosts, canonical innate modules including Toll-like, NOD-like, C-type lectin, and RIG-I-like receptor pathways converge on transcription factors such as NF-κB, AP-1, and IRF3 to balance inflammatory and regulatory responses. The observed repression of chemokine/MAPK and lectin signaling, coupled with activation of nucleic acid-sensing and interferon-related pathways, suggests that E. leei infection induces a network-level transition from acute inflammation to a chronic, low-grade immune state. Similar immune remodeling has been described in parasitic infections of teleosts, where persistent antigenic stimulation dampens proinflammatory cascades and promotes compensatory interferon signaling [79,80].
Hub genes such as cxcl8a, pik3r1, and sting1 occupied central nodes, implying that transcriptional variation in these regulators could influence multiple immune modules simultaneously. Similar network-level phenomena have been described in turbot suffering from Enteromyxum scophthalmi infection, where the disruption of central immune genes leads to widespread transcriptional imbalance [81]. Likewise, in gilthead sea bream chronically infected with E. leei, where suppression of proinflammatory signaling coincided with activation of interferon pathways [41]. These parallels across myxozoan infections are consistent with integrated remodeling of host immune networks during chronic exposure.
Collectively, the enrichment and DEG patterns delineate a coherent reprogramming of mucosal immunity in the posterior intestine during E. leei infection. First, chemokine and MAPK signaling appear attenuated—exemplified by reduced cxcl8a activity and downstream nodes such as mapk10 and mapk11 (Table 4 and Figure 7, Figure 8 and Figure 9)—consistent with impaired neutrophil recruitment and delayed epithelial restitution [36,38,57,69]. Second, nucleic acid–sensing modules (RIG-I-like receptors and the cGAS–STING axis) show selective activation, including increased irf3 and sting1 (Table 4 and Figure 7, Figure 8 and Figure 9), suggesting an antiviral-like tone potentially triggered by parasite- or microbiota-derived nucleic acids [62,77]. Third, alterations in C-type lectin and NOD-like receptor pathways (Figure 7 and Figure 8) indicate remodeling at the epithelial recognition interface, compatible with changes in mucin–microbe/parasite interactions under chronic disease [35,60,62,82]. Finally, the retrieval of the KEGG intestinal immune network for IgA production pathway (Figure 7)—used here as a functional proxy for the teleost mucosal immunoglobulin system (principally, IgT/IgZ with contributions from IgM)—supports a rebalanced B-cell program at the gut surface [8,59,60,76].
Taken together, we propose that E. leei persistence reflects a dual regulatory network: (1) attenuation of chemokine/MAPK signaling that limits effector recruitment, and (2) sustained activation of nucleic acid-sensing pathways that maintain antiviral-like immune tone. This configuration likely stabilizes a chronic infection state by mitigating host inflammation while promoting parasite tolerance. Although this interpretation remains hypothetical, it provides a testable mechanistic basis for future validation through longitudinal and multi-omics analyses.

4.6. Implications and Future Perspectives

Taken together, our results indicate that E. leei infection disrupts intestinal immune homeostasis through a dual process: suppression of chemokine-driven inflammation and adaptive responses, combined with the activation of nucleic acid sensing and stress pathways. This immune disequilibrium may underlie both the chronic persistence of the parasite and the progressive manifestation of emaciation disease.
With regard to practical application, the consistent alteration of the hub genes identified in the present study provides a valuable molecular framework for understanding the mechanisms of immune dysregulation and chronic inflammation caused by E. leei infection in olive flounder. In addition to immune dysregulation, transcriptomic enrichment analysis also revealed the involvement of several metabolically important pathways, including oxidative phosphorylation, glycolysis/gluconeogenesis, and protein processing in the endoplasmic reticulum, suggesting that E. leei infection induces both immune and metabolic reprogramming in the host intestine. These findings may also serve as a foundation for future research aimed at improving disease prevention and health management strategies in aquaculture.
Nevertheless, several limitations should be acknowledged. As the present analysis was based on a natural outbreak, the exact timing of infection remains unknown, and our interpretations are therefore framed within a presumptive chronic phase. In addition, this study focused solely on the posterior intestine, leaving systemic responses in major immune organs such as the head kidney and spleen unresolved. Transcriptomic profiles alone also cannot fully capture protein activity or metabolic remodeling.
Moreover, the lower read mapping rate observed in infected samples may reflect the coexistence of parasite-derived transcripts within the intestinal tissue. Because a complete E. leei reference genome is not yet available, reads were mapped exclusively to the host (P. olivaceus) genome. This biological feature likely accounts for the reduced mapping efficiency and underscores the need for future dual host–parasite transcriptomic analyses to better delineate their respective transcriptional landscapes.
Future research should incorporate longitudinal sampling across defined infection stages, quantification of parasite burden using histological and qPCR-based approaches, and cell-resolved immunophenotyping to validate the proposed dual regulatory framework. Complementary multi-omics approaches, including proteomics and metabolomics analyses, will further elucidate the metabolic and cellular consequences of chronic infection. Ultimately, integrating these datasets will be essential for establishing comprehensive molecular indicators of host–parasite interactions and for guiding effective health monitoring and disease management strategies in olive flounder aquaculture.

5. Conclusions

Transcriptomic profiling of the posterior intestine during natural Enteromyxum leei infection in olive flounder revealed pathway-level reprogramming characterized by suppression of chemokine/MAPK signaling and activation of nucleic acid–sensing modules, accompanied by remodeling of lectin-, NOD-, and mucosal immunoglobulin networks. Integration of these pathways and the validated hub genes supports a dual regulatory mechanism in which attenuated proinflammatory signaling coexists with sustained nucleic acid sensing, potentially contributing to parasite persistence and host emaciation. These findings advance our understanding of parasite-driven immune dysregulation in olive flounder and provide a molecular framework for future research aimed at elucidating host–parasite interactions and improving disease prevention and health management in aquaculture.

Supplementary Materials

The following supporting information can be downloaded at: https://www.mdpi.com/article/10.3390/fishes10120601/s1, Figure S1: KEGG pathway maps of six immune-related pathways; Table S1: Sequencing and mapping statistics of all RNA-seq libraries; Table S2: List of differentially expressed genes (DEGs) with log2FC and adjusted p-values; Table S3: Functional enrichment results for DEGs.

Author Contributions

Conceptualization, H.L. and J.-H.C.; methodology, H.L. and H.-K.L.; software, H.L.; validation, H.-M.O.; formal analysis, T.-M.K.; investigation, H.-M.O. and T.-M.K.; data curation: H.-M.O. and T.-M.K.; writing—original draft preparation, H.L.; writing—review and editing, H.-K.L. and J.-H.C.; visualization, H.L. and T.-M.K.; supervision, J.-H.C.; project administration, J.-H.C.; funding acquisition, J.-H.C. All authors have read and agreed to the published version of the manuscript.

Funding

This research was supported by the Regional Innovation System & Education (RISE) program through the Jeollanamdo RISE Center, funded by the Ministry of Education (MOE) and Jeollanamdo, Republic of Korea (2025-RISE-14-001).

Institutional Review Board Statement

All procedures were approved by the Institutional Animal Care and Use Committee (IACUC) of Mokpo National University, Republic of Korea (Approval Code: MNU-IACUC-2025-018, Approval date: 1 June 2025) and conducted in accordance with ARRIVE guidelines.

Informed Consent Statement

Not applicable.

Data Availability Statement

The data presented in this study are available upon request from the corresponding author.

Conflicts of Interest

The authors declare no conflicts of interest.

References

  1. Oh, S.; Lee, S. Fish Welfare-Related Issues and Their Relevance in Land-Based Olive Flounder (Paralichthys olivaceus) Farms in Korea. Animals 2024, 14, 1693. [Google Scholar] [CrossRef]
  2. Hamidoghli, A.; Won, S.; Lee, S.; Lee, S.; Farris, N.W.; Bai, S.C. Nutrition and feeding of olive flounder Paralichthys olivaceus: A Review. Rev. Fish. Sci. Aquac. 2020, 28, 340–357. [Google Scholar] [CrossRef]
  3. Raman, R.P.; Prakash, C.; Makesh, M.; Pawar, N. Environmental stress mediated diseases of fish: An overview. Adv. Fish Res. 2013, 5, 141–158. [Google Scholar]
  4. Rathod, S.V.; Saras, P.; Gondaliya, S.M. Environmental pollution: Threats and challenges for management. In Eco-Restoration of Polluted Environment; CRC Press: Boca Raton, FL, USA, 2024; pp. 1–34. [Google Scholar]
  5. Yadav, N.K.; Patel, A.B.; Singh, S.K.; Mehta, N.K.; Anand, V.; Lal, J.; Dekari, D.; Devi, N.C. Climate change effects on aquaculture production and its sustainable management through climate-resilient adaptation strategies: A review. Environ. Sci. Pollut. Res. 2024, 31, 31731–31751. [Google Scholar] [CrossRef]
  6. Christaki, E. Classification of parasitic diseases. In The Surgical Management of Parasitic Diseases; Springer: Berlin/Heidelberg, Germany, 2020; pp. 23–45. [Google Scholar]
  7. Sitjà-Bobadilla, A.; Estensoro, I.; Palenzuela, O.  Enteromyxum leei. In Fish Parasites: A Handbook of Protocols for Their Isolation, Culture and Transmission; CABI GB: Wallingford, UK, 2021; pp. 127–142. [Google Scholar]
  8. Picard-Sánchez, A. Control of Enteric Parasitic Diseases of Farmed Gilthead Sea Bream: New Insights into Enteromyxum leei (Myxozoa) and Enterospora Nucleophila (Microsporidia) Infections. Ph.D. Thesis, Universidad Politécnica de Valencia, Valencia, Spain, 2021. [Google Scholar]
  9. Picard-Sánchez, A.; Estensoro, I.; Del Pozo, R.; Palenzuela, O.R.; Piazzon, M.C.; Sitjà-Bobadilla, A. Water temperature, time of exposure and population density are key parameters in Enteromyxum leei fish-to-fish experimental transmission. J. Fish Dis. 2020, 43, 491–502. [Google Scholar] [CrossRef] [PubMed]
  10. Shin, S.P.; Sohn, H.C.; Jin, C.N.; Kang, B.J.; Lee, J. Quantitative investigation of Enteromyxum leei (Myxozoa: Myxosporea) infection and relative condition factor in cultured olive flounder Paralichthys olivaceus (Temminck and Schlegel). J. Fish Dis. 2019, 42, 159–165. [Google Scholar] [CrossRef]
  11. Shin, S.P.; Jin, C.N.; Sohn, H.; Lee, J. Comparison of oral and anal inoculation of Enteromyxum leei into olive flounder Paralichthys olivaceus. Aquaculture 2022, 561, 738641. [Google Scholar] [CrossRef]
  12. Fleurance, R.; Sauvegrain, C.; Marques, A.; Le Breton, A.; Guéreaud, C.; Cherel, Y.; Wyers, M. Histopathological changes caused by Enteromyxum leei infection in farmed sea bream Sparus aurata. Dis. Aquat. Org. 2008, 79, 219–228. [Google Scholar] [CrossRef]
  13. Alvarez-Pellitero, P.; Palenzuela, O.; Sitjà-Bobadilla, A. Histopathology and cellular response in Enteromyxum leei (Myxozoa) infections of Diplodus puntazzo (Teleostei). Parasitol. Int. 2008, 57, 110–120. [Google Scholar] [CrossRef]
  14. Muñoz, P.; Cuesta, A.; Athanassopoulou, F.; Golomazou, H.; Crespo, S.; Padrós, F.; Sitjà-Bobadilla, A.; Albiñana, G.; Esteban, M.; Alvarez-Pellitero, P. Sharpsnout sea bream (Diplodus puntazzo) humoral immune response against the parasite Enteromyxum leei (Myxozoa). Fish Shellfish Immunol. 2007, 23, 636–645. [Google Scholar] [CrossRef] [PubMed]
  15. Sitjà-Bobadilla, A.; Schmidt-Posthaus, H.; Wahli, T.; Holland, J.W.; Secombes, C.J. Fish immune responses to Myxozoa. In Myxozoan Evolution, Ecology and Development; Springer: Berlin/Heidelberg, Germany, 2015; pp. 253–280. [Google Scholar]
  16. Sohn, H.; Jin, C.N.; Kang, B.J.; Shin, S.P.; Lee, J. Infection dynamics of Enteromyxum leei (Myxozoa, Myxosporea) in culture water and its effects on cultured olive flounder, Paralichthys olivaceus (Temminck & Schlegel). J. Fish Dis. 2021, 44, 1475–1479. [Google Scholar] [CrossRef]
  17. Kim, S.M.; Jun, L.J.; Lee, D.W.; Park, H.K.; Do Jeong, H.; Kim, J.S.; Jeong, J.B. Monitoring of emaciation disease in cultured Paralichthys olivaceus of Jeju island during 2014–2015. Fish. Aquat. Sci. 2018, 21, 17. [Google Scholar] [CrossRef]
  18. Sohn, H.; Jin, C.N.; Kim, J.; Park, C.U.; Jo, Y.; Jeong, T.; Lee, J. Investigation of Disease Outbreak Trends through Monitoring of Olive Flounder Paralichthys olivaceus in Jeju Island. Smart Media J. 2024, 13, 49–58. [Google Scholar]
  19. Piazzon, M.C.; Estensoro, I.; Calduch-Giner, J.A.; Del Pozo, R.; Picard-Sánchez, A.; Pérez-Sánchez, J.; Sitjà-Bobadilla, A. Hints on T cell responses in a fish-parasite model: Enteromyxum leei induces differential expression of T cell signature molecules depending on the organ and the infection status. Parasites Vectors 2018, 11, 443. [Google Scholar] [CrossRef] [PubMed]
  20. Ronza, P.; Robledo, D.; Bermúdez, R.; Losada, A.P.; Pardo, B.G.; Sitjà-Bobadilla, A.; Quiroga, M.I.; Martínez, P. RNA-seq analysis of early enteromyxosis in turbot (Scophthalmus maximus): New insights into parasite invasion and immune evasion strategies. Int. J. Parasitol. 2016, 46, 507–517. [Google Scholar] [CrossRef]
  21. Toxqui-Rodríguez, S.; Estensoro, I.; Domingo-Bretón, R.; Del Pozo, R.; Pérez-Sánchez, J.; Sipkema, D.; Sitjà-Bobadilla, A.; Piazzon, M.C. Interactions between gilthead seabream intestinal transcriptome and microbiota upon Enteromyxum leei infection: A multi–omic approach. Anim. Microbiome 2025, 7, 22. [Google Scholar] [CrossRef]
  22. Hwang, J.Y.; Markkandan, K.; Kwon, M.G.; Seo, J.S.; Yoo, S.-i.; Hwang, S.D.; Son, M.-H.; Park, J. Transcriptome analysis of olive flounder (Paralichthys olivaceus) head kidney infected with moderate and high virulent strains of infectious viral hemorrhagic septicaemia virus (VHSV). Fish Shellfish Immunol. 2018, 76, 293–304. [Google Scholar] [CrossRef]
  23. Wu, Q.; Ning, X.; Jiang, S.; Sun, L. Transcriptome analysis reveals seven key immune pathways of Japanese flounder (Paralichthys olivaceus) involved in megalocytivirus infection. Fish Shellfish Immunol. 2020, 103, 150–158. [Google Scholar] [CrossRef] [PubMed]
  24. Kim, K.I.; Lee, U.H.; Cho, M.; Jung, S.-H.; Min, E.Y.; Park, J.W. Transcriptome analysis based on RNA-seq of common innate immune responses of flounder cells to IHNV, VHSV, and HIRRV. PLoS ONE 2020, 15, e0239925. [Google Scholar] [CrossRef] [PubMed]
  25. Chinchilla, B.; Encinas, P.; Coll, J.M.; Gomez-Casado, E. Differential immune transcriptome and modulated signalling pathways in rainbow trout infected with viral haemorrhagic septicaemia virus (VHSV) and its derivative non-virion (NV) gene deleted. Vaccines 2020, 8, 58. [Google Scholar] [CrossRef]
  26. Sun, B.; Li, X.; Ning, X.; Sun, L. Transcriptome analysis of Paralichthys olivaceus erythrocytes reveals profound immune responses induced by edwardsiella tarda infection. Int. J. Mol. Sci. 2020, 21, 3094. [Google Scholar] [CrossRef]
  27. Ghani, M.U.; Chen, J.; Khosravi, Z.; Wu, Q.; Liu, Y.; Zhou, J.; Zhong, L.; Cui, H. Unveiling the multifaceted role of toll-like receptors in immunity of aquatic animals: Pioneering strategies for disease management. Front. Immunol. 2024, 15, 1378111. [Google Scholar] [CrossRef]
  28. Sudhagar, A.; Kumar, G.; El-Matbouli, M. Transcriptome analysis based on RNA-Seq in understanding pathogenic mechanisms of diseases and the immune system of fish: A comprehensive review. Int. J. Mol. Sci. 2018, 19, 245. [Google Scholar] [CrossRef]
  29. Huang, L.; Li, G.; Mo, Z.; Xiao, P.; Li, J.; Huang, J. De novo assembly of the Japanese flounder (Paralichthys olivaceus) spleen transcriptome to identify putative genes involved in immunity. PLoS ONE 2015, 10, e0117642. [Google Scholar]
  30. Wang, W.; Wang, J.; You, F.; Ma, L.; Yang, X.; Gao, J.; He, Y.; Qi, J.; Yu, H.; Wang, Z. Detection of alternative splice and gene duplication by RNA sequencing in Japanese flounder, Paralichthys olivaceus. G3 Genes Genomes Genet. 2014, 4, 2419–2424. [Google Scholar] [CrossRef]
  31. Xiu, Y.; Li, Y.; Liu, X.; Li, C. Full-length transcriptome sequencing from multiple immune-related tissues of Paralichthys olivaceus. Fish Shellfish Immunol. 2020, 106, 930–937. [Google Scholar] [CrossRef] [PubMed]
  32. Shin, S.P.; Sohn, H.C.; Jin, C.N.; Kang, B.J.; Lee, J. Molecular diagnostics for verifying an etiological agent of emaciation disease in cultured olive flounder Paralichthys olivaceus in Korea. Aquaculture 2018, 493, 18–25. [Google Scholar] [CrossRef]
  33. Estensoro, I.; Redondo, M.J.; Salesa, B.; Kaushik, S.; Pérez-Sánchez, J.; Sitjà-Bobadilla, A. Effect of nutrition and Enteromyxum leei infection on gilthead sea bream Sparus aurata intestinal carbohydrate distribution. Dis. Aquat. Org. 2012, 100, 29–42. [Google Scholar] [CrossRef] [PubMed]
  34. Estensoro, I.; Jung-Schroers, V.; Álvarez-Pellitero, P.; Steinhagen, D.; Sitjà-Bobadilla, A. Effects of Enteromyxum leei (Myxozoa) infection on gilthead sea bream (Sparus aurata) (Teleostei) intestinal mucus: Glycoprotein profile and bacterial adhesion. Parasitol. Res. 2013, 112, 567–576. [Google Scholar] [CrossRef]
  35. Bjørgen, H.; Li, Y.; Kortner, T.M.; Krogdahl, Å.; Koppang, E.O. Anatomy, immunology, digestive physiology and microbiota of the salmonid intestine: Knowns and unknowns under the impact of an expanding industrialized production. Fish Shellfish Immunol. 2020, 107, 172–186. [Google Scholar] [CrossRef]
  36. Van der Aa, L.M.; Chadzinska, M.; Tijhaar, E.; Boudinot, P.; Verburg-van Kemenade, B.L. CXCL8 chemokines in teleost fish: Two lineages with distinct expression profiles during early phases of inflammation. PLoS ONE 2010, 5, e12384. [Google Scholar] [CrossRef] [PubMed]
  37. Sayyaf Dezfuli, B.; Lorenzoni, M.; Carosi, A.; Giari, L.; Bosi, G. Teleost innate immunity, an intricate game between immune cells and parasites of fish organs: Who wins, who loses. Front. Immunol. 2023, 14, 1250835. [Google Scholar] [CrossRef]
  38. Hu, Y.-H.; Chen, L.; Sun, L. CXCL8 of Scophthalmus maximus: Expression, biological activity and immunoregulatory effect. Dev. Comp. Immunol. 2011, 35, 1032–1039. [Google Scholar] [CrossRef]
  39. Losada, A.; Bermúdez, R.; Faílde, L.; Di Giancamillo, A.; Domeneghini, C.; Quiroga, M. Effects of Enteromyxum scophthalmi experimental infection on the neuroendocrine system of turbot, Scophthalmus maximus (L.). Fish Shellfish Immunol. 2014, 40, 577–583. [Google Scholar] [CrossRef]
  40. Davey, G.C.; Calduch-Giner, J.A.; Houeix, B.; Talbot, A.; Sitjà-Bobadilla, A.; Prunet, P.; Pérez-Sánchez, J.; Cairns, M.T. Molecular profiling of the gilthead sea bream (Sparus aurata L.) response to chronic exposure to the myxosporean parasite Enteromyxum leei. Mol. Immunol. 2011, 48, 2102–2112. [Google Scholar] [CrossRef] [PubMed]
  41. Sitjà-Bobadilla, A.; Calduch-Giner, J.; Saera-Vila, A.; Palenzuela, O.; Álvarez-Pellitero, P.; Pérez-Sánchez, J. Chronic exposure to the parasite Enteromyxum leei (Myxozoa: Myxosporea) modulates the immune response and the expression of growth, redox and immune relevant genes in gilthead sea bream, Sparus aurata L. Fish Shellfish Immunol. 2008, 24, 610–619. [Google Scholar] [CrossRef]
  42. Holzer, A.S.; Piazzon, M.C.; Barrett, D.; Bartholomew, J.L.; Sitjà-Bobadilla, A. To react or not to react: The dilemma of fish immune systems facing myxozoan infections. Front. Immunol. 2021, 12, 734238. [Google Scholar] [CrossRef]
  43. Sun, L.; Wu, J.; Du, F.; Chen, X.; Chen, Z.J. Cyclic GMP-AMP synthase is a cytosolic DNA sensor that activates the type I interferon pathway. Science 2013, 339, 786–791. [Google Scholar] [CrossRef]
  44. Mojzesz, M.; Rakus, K.; Chadzinska, M.; Nakagami, K.; Biswas, G.; Sakai, M.; Hikima, J.-i. Cytosolic sensors for pathogenic viral and bacterial nucleic acids in fish. Int. J. Mol. Sci. 2020, 21, 7289. [Google Scholar] [CrossRef]
  45. Guo, S.; Zeng, M.; Wang, Z.; Zhao, L.; Fan, Y.; Shi, Q.; Song, Z. Characterization and expression profiles of cGAS (cyclic GMP-AMP synthase) and STING (stimulator of interferon) genes in various immune tissues of hybrid yellow catfish under bacterial infections. Aquac. Rep. 2024, 37, 102238. [Google Scholar] [CrossRef]
  46. Liu, J.; Zhou, J.; Luan, Y.; Li, X.; Meng, X.; Liao, W.; Tang, J.; Wang, Z. cGAS-STING, inflammasomes and pyroptosis: An overview of crosstalk mechanism of activation and regulation. Cell Commun. Signal. 2024, 22, 22. [Google Scholar] [CrossRef] [PubMed]
  47. Tanaka, Y.; Chen, Z.J. STING specifies IRF3 phosphorylation by TBK1 in the cytosolic DNA signaling pathway. Sci. Signal. 2012, 5, ra20. [Google Scholar] [CrossRef] [PubMed]
  48. Bowie, A. The STING in the tail for cytosolic DNA–dependent activation of IRF3. Sci. Signal. 2012, 5, pe9. [Google Scholar] [CrossRef]
  49. Sun, Y.; Cao, Z.; Zhang, P.; Wei, C.; Li, J.; Wu, Y.; Zhou, Y. IFN regulatory factor 3 of golden pompano and its NLS domain are involved in antibacterial innate immunity and regulate the expression of type I interferon (IFNa3). Front. Immunol. 2023, 14, 1128196. [Google Scholar] [CrossRef]
  50. Holland, J.; Bird, S.; Williamson, B.; Woudstra, C.; Mustafa, A.; Wang, T.; Zou, J.; Blaney, S.; Collet, B.; Secombes, C. Molecular characterization of IRF3 and IRF7 in rainbow trout, Oncorhynchus mykiss: Functional analysis and transcriptional modulation. Mol. Immunol. 2008, 46, 269–285. [Google Scholar] [CrossRef]
  51. Schonthaler, H.B.; Guinea-Viniegra, J.; Wagner, E.F. Targeting inflammation by modulating the Jun/AP-1 pathway. Ann. Rheum. Dis. 2011, 70, i109–i112. [Google Scholar] [CrossRef]
  52. Shen, Y.; Gao, J.; Zhang, M.; Li, Y.; Aly, R.S.S.; Wang, L.; Yu, M.; Jiang, H.; Qiao, Z.; Chen, X. Transcriptome to reveal the immunological defenses in mandarin fish (Siniperca chuatsi) skin with LPS and poly (I: C) infection. Fish Shellfish Immunol. 2025, 166, 110652. [Google Scholar] [CrossRef] [PubMed]
  53. Fang, W.; Chen, Q.; Li, J.; Liu, Y.; Zhao, Z.; Shen, Y.; Mai, K.; Ai, Q. Endoplasmic reticulum stress disturbs lipid homeostasis and augments inflammation in the intestine and isolated intestinal cells of Large yellow croaker (Larimichthys crocea). Front. Immunol. 2021, 12, 738143. [Google Scholar] [CrossRef]
  54. Cohen-Sánchez, A.; Sánchez-Mairata, A.G.; Valencia, J.M.; Box, A.; Pinya, S.; Tejada, S.; Sureda, A. Immune and oxidative stress response of the fish Xyrichthys novacula infected with the trematode ectoparasite Scaphanocephalus sp. in the Balearic Islands. Fishes 2023, 8, 600. [Google Scholar] [CrossRef]
  55. Mahdy, O.A.; Abdel-Maogood, S.Z.; Abdelsalam, M.; Salem, M.A. A multidisciplinary study on Clinostomum infections in Nile tilapia: Micro-morphology, oxidative stress, immunology, and histopathology. BMC Vet. Res. 2024, 20, 60. [Google Scholar] [CrossRef]
  56. Pawłowska, M.; Mila-Kierzenkowska, C.; Szczegielniak, J.; Woźniak, A. Oxidative stress in parasitic diseases—Reactive oxygen species as mediators of interactions between the host and the parasites. Antioxidants 2023, 13, 38. [Google Scholar] [CrossRef]
  57. Kunkel, E.J.; Campbell, D.J.; Butcher, E.C. Chemokines in lymphocyte trafficking and intestinal immunity. Microcirculation 2003, 10, 313–323. [Google Scholar] [CrossRef]
  58. Wu, X.; Sun, M.; Yang, Z.; Lu, C.; Wang, Q.; Wang, H.; Deng, C.; Liu, Y.; Yang, Y. The roles of CCR9/CCL25 in inflammation and inflammation-associated diseases. Front. Cell Dev. Biol. 2021, 9, 686548. [Google Scholar] [CrossRef] [PubMed]
  59. Picard-Sánchez, A.; Estensoro, I.; Perdiguero, P.; Del Pozo, R.; Tafalla, C.; Piazzon, M.C.; Sitjà-Bobadilla, A. Passive immunization delays disease outcome in gilthead sea bream infected with Enteromyxum leei (Myxozoa), despite the moderate changes in IgM and IgT repertoire. Front. Immunol. 2020, 11, 581361. [Google Scholar] [CrossRef]
  60. Estensoro, I.; Calduch-Giner, J.A.; Kaushik, S.; Pérez-Sánchez, J.; Sitjà-Bobadilla, A. Modulation of the IgM gene expression and IgM immunoreactive cell distribution by the nutritional background in gilthead sea bream (Sparus aurata) challenged with Enteromyxum leei (Myxozoa). Fish Shellfish Immunol. 2012, 33, 401–410. [Google Scholar] [CrossRef] [PubMed]
  61. Liang, Y.; Yu, B.; Chen, J.; Wu, H.; Xu, Y.; Yang, B.; Lu, Q. Thymic stromal lymphopoietin epigenetically upregulates Fc receptor γ subunit–related receptors on antigen-presenting cells and induces TH2/TH17 polarization through dectin-2. J. Allergy Clin. Immunol. 2019, 144, 1025–1035.e7. [Google Scholar] [CrossRef]
  62. Di Genova, B.M.; Tonelli, R.R. Infection strategies of intestinal parasite pathogens and host cell responses. Front. Microbiol. 2016, 7, 256. [Google Scholar] [CrossRef] [PubMed]
  63. Brinchmann, M.F.; Patel, D.M.; Pinto, N.; Iversen, M.H. Functional aspects of fish mucosal lectins—Interaction with non-self. Molecules 2018, 23, 1119. [Google Scholar] [CrossRef]
  64. Pérez, T.; Balcázar, J.; Ruiz-Zarzuela, I.; Halaihel, N.; Vendrell, D.; de Blas, I.; Múzquiz, J. Host–microbiota interactions within the fish intestinal ecosystem. Mucosal Immunol. 2010, 3, 355–360. [Google Scholar] [CrossRef]
  65. Yu, Y.; Wang, Q.; Huang, Z.; Ding, L.; Xu, Z. Immunoglobulins, mucosal immunity and vaccination in teleost fish. Front. Immunol. 2020, 11, 567941. [Google Scholar] [CrossRef]
  66. Aghaallaei, N.; Agarwal, R.; Benjaminsen, J.; Lust, K.; Bajoghli, B.; Wittbrodt, J.; Feijoo, C.G. Antigen-presenting cells and T cells interact in a specific area of the intestinal mucosa defined by the ccl25-ccr9 axis in medaka. Front. Immunol. 2022, 13, 812899. [Google Scholar] [CrossRef]
  67. Salinas, I.; Fernández-Montero, Á.; Ding, Y.; Sunyer, J.O. Mucosal immunoglobulins of teleost fish: A decade of advances. Dev. Comp. Immunol. 2021, 121, 104079. [Google Scholar] [CrossRef]
  68. Salinas, I. The mucosal immune system of teleost fish. Biology 2015, 4, 525–539. [Google Scholar] [CrossRef]
  69. Russo, R.C.; Garcia, C.C.; Teixeira, M.M.; Amaral, F.A. The CXCL8/IL-8 chemokine family and its receptors in inflammatory diseases. Expert Rev. Clin. Immunol. 2014, 10, 593–619. [Google Scholar] [CrossRef]
  70. He, X.; Zhu, Z.; Johnson, C.; Stoops, J.; Eaker, A.E.; Bowen, W.; DeFrances, M.C. PIK3IP1, a negative regulator of PI3K, suppresses the development of hepatocellular carcinoma. Cancer Res. 2008, 68, 5591–5598. [Google Scholar] [CrossRef]
  71. Zheng, W.; Xu, X.-w.; E, Z.; Liu, Y.; Chen, S. Genome-wide identification of the MAPK gene family in turbot and its involvement in abiotic and biotic stress responses. Front. Mar. Sci. 2022, 9, 1005401. [Google Scholar] [CrossRef]
  72. Kojima, K.; Ichijo, H.; Naguro, I. Molecular functions of ASK family in diseases caused by stress-induced inflammation and apoptosis. J. Biochem. 2021, 169, 395–407. [Google Scholar] [CrossRef] [PubMed]
  73. Blanco, E.; Camps, C.; Bahal, S.; Kerai, M.D.; Ferla, M.P.; Rochussen, A.M.; Handel, A.E.; Golwala, Z.M.; Spiridou Goncalves, H.; Kricke, S. Dominant negative variants in ITPR3 impair T cell Ca2+ dynamics causing combined immunodeficiency. J. Exp. Med. 2024, 222, e20220979. [Google Scholar] [CrossRef]
  74. Thackray, L.B.; Duan, E.; Lazear, H.M.; Kambal, A.; Schreiber, R.D.; Diamond, M.S.; Virgin, H.W. Critical role for interferon regulatory factor 3 (IRF-3) and IRF-7 in type I interferon-mediated control of murine norovirus replication. J. Virol. 2012, 86, 13515–13523. [Google Scholar] [CrossRef]
  75. Wang, Y.-D.; Wang, Y.-H.; Hui, C.-F.; Chen, J.-Y. Transcriptome analysis of the effect of Vibrio alginolyticus infection on the innate immunity-related TLR5-mediated induction of cytokines in Epinephelus lanceolatus. Fish Shellfish Immunol. 2016, 52, 31–43. [Google Scholar] [CrossRef] [PubMed]
  76. Trung, N.B.; Nan, F.-H.; Lee, M.-C.; Loh, J.-Y.; Gong, H.-Y.; Lu, M.-W.; Hang, H.T.; Lin, Y.-L.; Lee, P.-T. Fish-specific TLR18 in Nile tilapia (Oreochromis niloticus) recruits MyD88 and TRIF to induce expression of effectors in NF-κB and IFN pathways in melanomacrophages. Fish Shellfish Immunol. 2021, 119, 587–601. [Google Scholar] [CrossRef]
  77. Zhu, L.-y.; Nie, L.; Zhu, G.; Xiang, L.-x.; Shao, J.-z. Advances in research of fish immune-relevant genes: A comparative overview of innate and adaptive immunity in teleosts. Dev. Comp. Immunol. 2013, 39, 39–62. [Google Scholar] [CrossRef] [PubMed]
  78. Muangrerk, C.; Uchuwittayakul, A.; Srisapoome, P. Identification, expression and antimicrobial functional analysis of interleukin-8 (IL-8) in response to Streptococcus iniae and Flavobacterium covae in Asian seabass (Lates calcarifer Bloch, 1790). Animals 2024, 14, 475. [Google Scholar] [CrossRef]
  79. Ashour, D.S. Toll-like receptor signaling in parasitic infections. Expert Rev. Clin. Immunol. 2015, 11, 771–780. [Google Scholar] [CrossRef] [PubMed]
  80. Chauhan, R.; Tiwari, M.; Chaudhary, A.; Sharan Thakur, R.; Pande, V.; Das, J. Chemokines: A key driver for inflammation in protozoan infection. Int. Rev. Immunol. 2024, 43, 211–228. [Google Scholar] [CrossRef] [PubMed]
  81. Ronza, P.; Robledo, D.; Bermúdez, R.; Losada, A.P.; Pardo, B.G.; Martínez, P.; Quiroga, M.I. Integrating genomic and morphological approaches in fish pathology research: The case of turbot (Scophthalmus maximus) enteromyxosis. Front. Genet. 2019, 10, 26. [Google Scholar]
  82. Estensoro, I.; Benedito-Palos, L.; Palenzuela, O.; Kaushik, S.; Sitjà-Bobadilla, A.; Pérez-Sánchez, J. The nutritional background of the host alters the disease course in a fish–myxosporean system. Vet. Parasitol. 2011, 175, 141–150. [Google Scholar] [CrossRef]
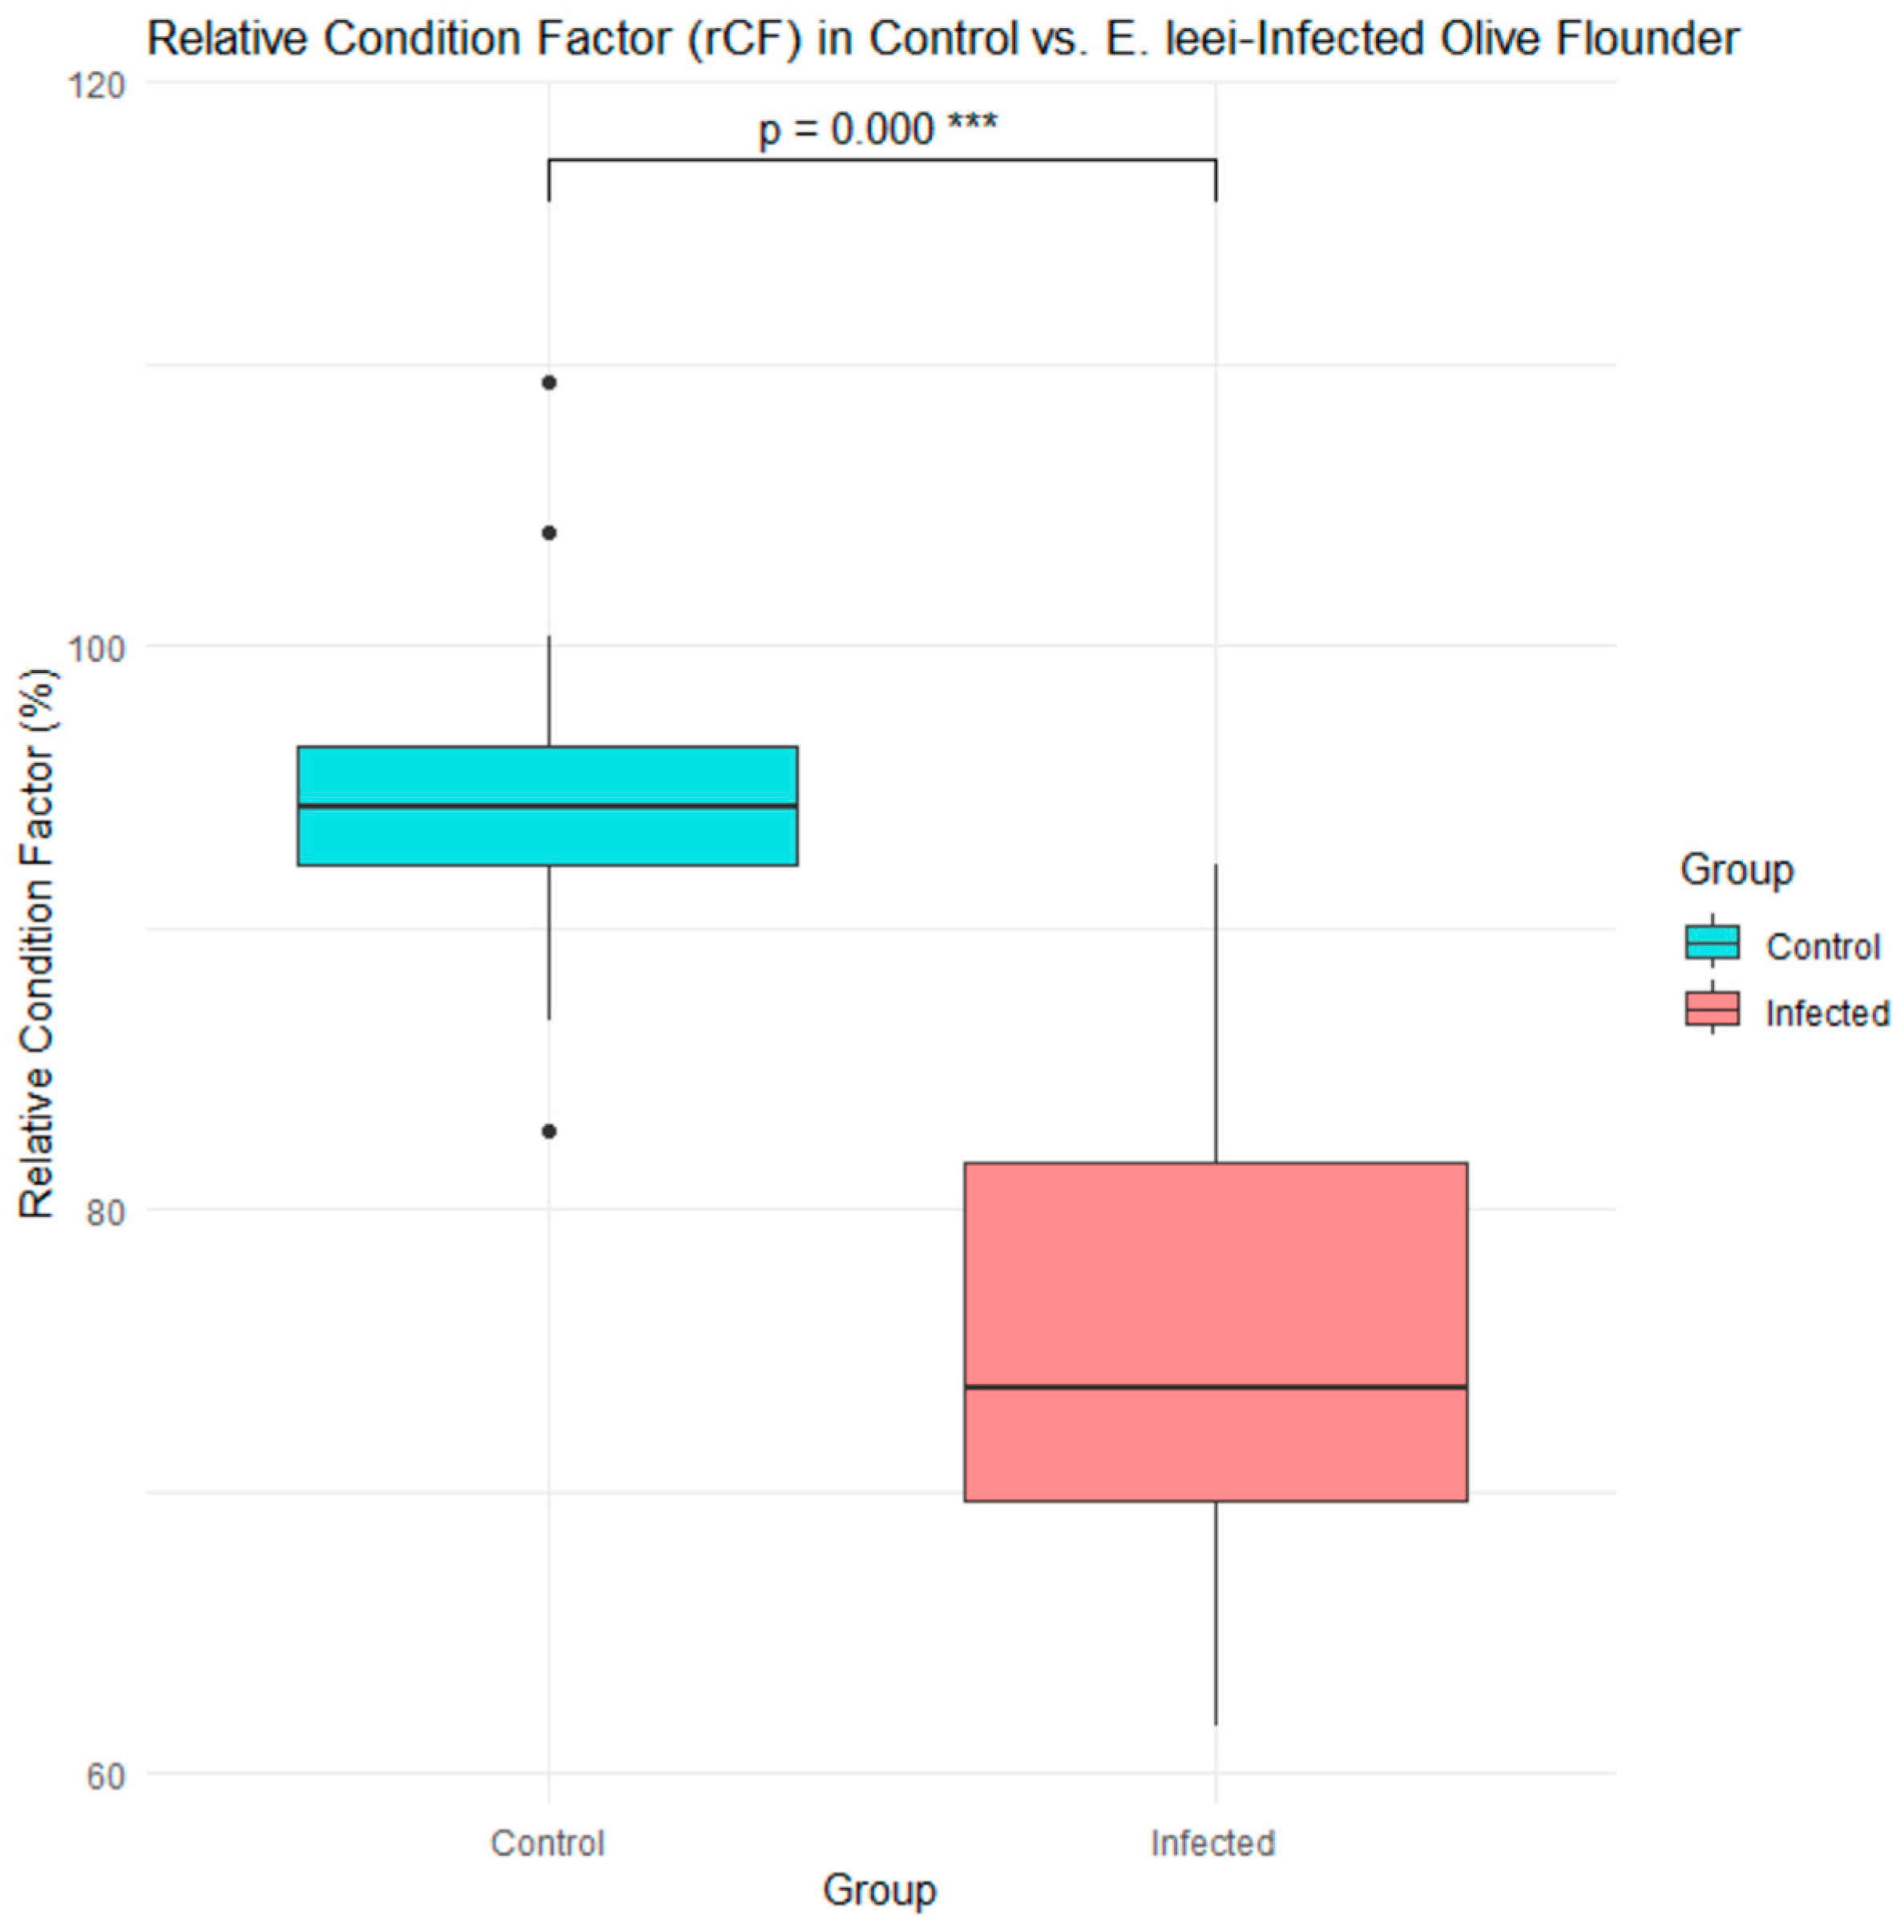
Figure 1. Relative condition factor (rCF) of olive flounder (Paralichthys olivaceus) in uninfected controls (n = 20) and E. leei-infected fish (n = 20). Data are shown as box plots. The infected group exhibited a significantly lower rCF than controls (*** p < 0.001, two-tailed Student’s t-test).
Fishes 10 00601 g001
Figure 2. PCR-based molecular diagnosis of Enteromyxum leei infection in olive flounder (Paralichthys olivaceus). (a) PCR amplification using the primer set reported by Shin et al. [32] targeting the 18S rRNA gene. (b) PCR amplification using the newly designed primer set developed in the present study. M: DNA size marker (100 bp DNA ladder, band range: 100–2000 bp, with major bands at 500, 1000, and 2000 bp); lanes 1–20: individual posterior intestine samples from the uninfected control group (top panels) and the E. leei-infected group (bottom panels).
Fishes 10 00601 g002
Figure 3. PCA of transcriptomic profiles in the posterior intestine of olive flounder (Paralichthys olivaceus). Each point represents an individual sample from the uninfected control group (blue; n = 20) or the E. leei-infected group (red; n = 20). PC1 (33.4%) and PC2 (25.4%) together explain 58.8% of the total variance.
Fishes 10 00601 g003
Figure 4. Heatmap and hierarchical clustering of DEGs. A total of 2666 DEGs (|log2FC| ≥ 2, adjusted p < 0.05) were clustered across samples. Rows represent genes, and columns represent individual samples (control and infected groups). Expression values are shown as log2 Z-scores (red = high expression, blue = low expression).
Fishes 10 00601 g004
Figure 5. Global transcriptomic overview of DEGs. (a) MA plot displaying the relationship between mean expression and log2 fold change. Horizontal dashed lines indicate the log2 fold-change cutoffs (|log2 FC| = 1, corresponding to |FC| = 2). (b) Volcano plot illustrating upregulated DEGs (yellow), downregulated DEGs (blue), and non-significant transcripts (gray).
Fishes 10 00601 g005
Figure 6. Functional enrichment of DEGs. GO and KEGG analyses were performed using DAVID v6.8 (criteria: |log2FC| ≥ 2, adjusted p < 0.05). (a) Top 10 GO MF terms. (b) Top 10 BP terms. (c) Top 10 CC terms. (d) Top 10 KEGG pathways.
Fishes 10 00601 g006
Figure 7. Heatmap of immune-related pathway–associated DEGs. DEGs (|log2FC| ≥ 2, adjusted p < 0.05) identified in six KEGG immune pathways were visualized after rlog transformation and row Z-score scaling. Columns represent samples (control, infected), and rows (genes) are hierarchically clustered. The pathways included: (a) Toll-like receptor signaling, (b) NOD-like receptor signaling, (c) Intestinal immune network for IgA production, (d) C-type lectin receptor signaling, (e) RIG-I-like receptor signaling, and (f) cytosolic DNA sensing.
Fishes 10 00601 g007
Figure 8. Gene–pathway network analysis. A Cytoscape bipartite network links immune-related KEGG pathways (rectangles) with their associated DEGs (circles). Node color represents log2 fold change (blue = downregulated, red = upregulated), and border width reflects −log10(p-value) of pathway enrichment. Shared genes (e.g., cxcl8a, pik3r1, mapk10, itpr1b, mapk11, jun, irf3, sting1, itpr3) occupy central positions, indicating crosstalk among Toll-like receptor, NOD-like receptor, C-type lectin receptor, RIG-I-like receptor, cytosolic DNA-sensing, and intestinal IgA network pathways.
Fishes 10 00601 g008
Figure 9. Validation and correlation of DEGs shared across immune-related pathways. (a) qRT-PCR validation of selected DEGs detected in more than one immune-related pathway in the control and infected groups (n = 20 each), normalized to gapdh. (b) Correlation between RNA-seq and qRT-PCR expression levels for the same genes. The solid blue line indicates the linear regression fit with the shaded area representing the 95% confidence interval, the dashed line denotes the 1:1 line (y = x), and the circled points indicate genes that deviate most from this relationship.
Fishes 10 00601 g009
Table 1. Primer sequences for PCR detection of Enteromyxum leei 18S rRNA.
Primer Sequence (5′–3′)SourceTarget Size (bp)
EL-Shin-FWCGGTGACGCCAATCCGTGShin, et al. (2018) [32]192
EL-Shin-RVGACGGTATCTGATCGTCTTCGA
EL-New-FWCGCCAATCCGTGTTGGTTTTThis study318
EL-New-RVCAAATTAAGCCGCAGGCTCC
Table 2. qRT-PCR primers used for validation of DEGs identified in six immune-related pathways: Toll-like receptor, NOD-like receptor, intestinal immune network for IgA production, C-type lectin receptor, RIG-I-like receptor, and cytosolic DNA sensing.
Gene SymbolAccession No.Primer Sequence (5′–3′)Product Size (bp)
cxcl8aXM_020100336.2 *FW: TGGCCATTCCTGATGGAACC105
RV: TCCACGCTTCCTATGTGACG
pik3r1XM_020082243.2FW: AGACGCCGAATGGTACTGG116
RV: GTCTCCGTGCATTTTCGTCG
mapk10XM_069513303.1FW: ATCTGCACTCAGCTGGCATT249
RV: GGATTTTGTGGCGCACCATT
itpr1bXM_069512494.1FW: CGCCGCTGAGATAGACACAT200
RV: CGATCTCGAACCTCGACAGG
mapk11XM_069519302.1FW: CTCATACCGGGAACTCAGGC210
RV: CCGCGGAGGAGCTGATAAAT
junXM_069522324.1FW: CTGTCTCGGCTCCGAACTAC179
RV: CATGTCGATCGGGGAGAGTG
sting1XM_069531174.1FW: CTACTTGCGATTGGTGCTGC210
RV: CCTGCCCTGTCAATCTCGTT
itpr3XM_069527461.1FW: CTCAAAGGAGGCGATGTGGT263
RV: CTACCGTCCATCTCAGCAGC
irf3OR047553.1FW: CAGTGGACGAATCCGGAACA247
RV: CCGGCCAGTGAAACACTTTG
gapdh (housekeeping)AB029337.1FW: CATCAAATGGGGCGATGCTG216
RV: CAGTTGGTTGTGCAGGAAGC
* Accession numbers correspond to mRNA sequences of Paralichthys olivaceus obtained from NCBI.
Table 3. Summary of RNA-seq data quality and mapping statistics for posterior intestine samples of olive flounder (Paralichthys olivaceus).
SampleRaw ReadsClean ReadsClean BasesQ20 (%)Mapping Ratio (%)Number of TranscriptsMean Length of Transcripts (bp)
Control_Pi78,139,89774,898,45210,813,483,19299.5194.7320,55917,428
Infected_Pi79,405,82975,623,07810,890,747,78799.5077.7320,15217,269
Table 4. Immune-related KEGG pathways with associated DEGs.
Pathway Gene SymbolLog2FCp-Value
Toll-like receptor signaling pathwaycxcl8a *−7.890.0036
tlr18−6.120.0036
pik3r1 *−4.000.0036
bpifcl−3.030.0036
mapk10 *−2.660.0036
mapk11 *−2.020.0036
Jun *2.090.0036
LOC1096439612.210.0036
LOC1096242462.250.0036
LOC1096391032.320.0036
LOC1096481423.780.0036
irf3 *3.930.0036
NOD-like receptor signaling pathwaysting1 *2.210.0000
antxr2b−2.790.0000
itpr1b *−2.190.0000
hsp90aa1.27.280.0000
LOC109633346−2.160.0000
LOC109633742−7.330.0000
vdac12.210.0000
LOC1096393663.370.0000
map1lc3b−2.060.0000
txnipa−2.090.0000
gabarapl22.090.0000
txn22.240.0000
itpr3 *2.460.0000
cybb−2.570.0000
Intestinal immune network for IgA productionLOC109624678−4.090.0002
ccl25b−2.310.0002
LOC109633037−3.550.0002
LOC1096421892.580.0002
LOC109643252−2.520.0002
LOC109643253−2.670.0002
LOC109643539−2.040.0002
ccr9a−2.150.0002
C-type lectin receptor signaling pathwayegr39.220.0094
ppp3cca−2.930.0094
fcer1g−2.050.0094
zgc:555582.210.0094
mdm22.070.0094
RIG-I-like receptor signaling pathwaydhx584.030.0213
znfx16.010.0213
Cytosolic DNA-sensing pathwayg3bp12.330.0117
samhd1−3.020.0117
polr2h2.170.0117
polr3e2.000.0117
* Genes marked with an asterisk (*) are shared across multiple pathways.
Disclaimer/Publisher’s Note: The statements, opinions and data contained in all publications are solely those of the individual author(s) and contributor(s) and not of MDPI and/or the editor(s). MDPI and/or the editor(s) disclaim responsibility for any injury to people or property resulting from any ideas, methods, instructions or products referred to in the content.