Article

Transcriptomic and Metabolomic Analyses Provide Insights into Cryptocaryon irritans Resistance in Golden Pompano (Trachinotus ovatus)

1
College of Fisheries and Life Science, Shanghai Ocean University, Shanghai 201306, China
2
Key Laboratory of South China Sea Fishery Resources Exploitation and Utilization, Ministry of Agriculture and Rural Affairs, South China Sea Fisheries Research Institute, Chinese Academy of Fishery Sciences, Guangzhou 510300, China
3
Shenzhen Base of South China Sea Fisheries Research Institute, Chinese Academy of Fishery Sciences, Shenzhen 518121, China
4
Sanya Tropical Fisheries Research Institute, Sanya 572018, China
*
Author to whom correspondence should be addressed.
These authors contributed equally to this work.
Fishes 2025, 10(9), 426; https://doi.org/10.3390/fishes10090426
Submission received: 21 July 2025 / Revised: 23 August 2025 / Accepted: 26 August 2025 / Published: 1 September 2025
(This article belongs to the Special Issue Molecular Mechanism of Fish Immune Response to Pathogens)

Abstract

Golden pompano (Trachinotus ovatus) is an economically important fish species along China’s southern coast. However, infections by Cryptocaryon irritans severely constrain the healthy and sustainable development of the aquaculture industry. To investigate the genetic basis of resistance to this parasite in golden pompano, this study employed transcriptomic and metabolomic analyses to compare differences between susceptible (ES) and resistant (RS) groups following C. irritans challenge. Transcriptome analysis identified 2031 differentially expressed genes (DEGs) between EST and RST groups, comprising 1004 up-regulated and 1027 down-regulated genes. Gene Ontology (GO) functional annotation and Kyoto Encyclopedia of Genes and Genomes (KEGG) pathway enrichment revealed that these DEGs were primarily enriched in lipid metabolism and amino acid metabolism pathways. Untargeted metabolomics detected 461 significantly differentially abundant metabolites (295 up-regulated, 166 down-regulated), confirming pronounced metabolic differences between ES and RS groups, particularly in lipid and amino acid metabolism. Further, KEGG enrichment highlighted steroid hormone biosynthesis, α-linolenic acid metabolism, and arachidonic acid metabolism as the most significantly altered pathways upon infection. This integrated transcriptomic and metabolomic study reveals substantial differences in gene expression and metabolite profiles between susceptible and resistant golden pompano in response to C. irritans. These changes predominantly involve lipid metabolism and amino acid metabolism, suggesting that these processes are critical in determining host resistance/susceptibility.
Key Contribution: Transcriptome and metabolome analyses revealed 2031 DEGs and 469 DMs, respectively. This study demonstrates substantial differences in lipid metabolism and amino acid metabolism pathways between susceptible and resistant golden pompano following C. irritans infection.

1. Introduction

Golden pompano (Trachinotus ovatus) is an economically important species in the aquaculture industry [1]. However, its growth and survival are often threatened by infections from Cryptocaryon irritans [2]. C. irritans is a harmful parasite that can cause significant economic losses in the golden pompano industry [3]. C. irritans disrupts the host’s gill and skin integrity, increasing susceptibility to secondary pathogens and necessitating costly chemical treatments. While transcriptomic studies in infected fish reveal immune gene dysregulation, and metabolomics identifies infection biomarkers, the mechanisms conferring innate resistance in golden pompano remain uncharacterized. To address this, we apply integrated transcriptomic and metabolomic analyses. This transcriptomic and metabolomic approach provides a systems-level framework for developing genetic strategies to mitigate C. irritans impacts.
Transcriptomic analysis focuses on the study of gene expression patterns. The application of transcriptome technology in the exploration of C. irritans stimulation within fish infections has delineated a significant array of immune-related cytokine target genes and receptors, which are intricately associated with the induction of C. irritans [4,5]. By conducting transcriptome analysis on Larimichthys crocea infected with C. irritans, significant enrichment analysis of differentially expressed genes and homologous genes disclosed signaling pathways such as toll-like receptors, complement and coagulation cascades, and chemokines [6]. Moreover, upon stimulation by C. irritans infection, the innate immune molecules such as transferrin and transferrin receptor protein in the skin of Epinephelus coioides were significantly upregulated [7]. Studies have revealed that, after being stimulated by C. irritans, differentially expressed immune genes in Siganus oramin encompass natural immune molecules like amino acid oxidase, antimicrobial peptides, and lysozyme, along with complement, chemokines, chemokine receptors, and T/B cell activating factors [8]. This information can illustrate the regulatory mechanisms and signaling pathways activated during the host’s interaction with C. irritans.
Metabolomics emerges as a pivotal analytical framework for the identification of biomarkers pertinent to metabolic characteristics and for elucidating the metabolic underpinnings of infection [9,10,11]. Such biomarkers possess the capacity to modulate the flux of metabolites, thereby enabling them to mitigate alterations in the host milieu and to counteract invasions by pathogens [12,13]. Fish are capable of synthesizing certain metabolites that function as signaling molecules that can precipitate inflammatory responses within the fish’s own body. These inflammatory reactions, that are integral to the innate immune defense, serve to contain, mitigate, and ultimately terminate infections by pathogens [14]. An investigation employing metabolomic analysis uncovered 17 compounds as candidate biomarkers for inciting C. irritans infection in Nibea albiflora [15]. Among these, glutamate, adenine, betaine, and 15-hydroxydodecanecarboxylic acid (15-HETE) were found to be engaged in a diverse array of metabolic processes, innate immune reactions, and physiological roles, thus warranting their classification as potential biomarkers for the stimulation of C. irritans infection in yellow croaker [15]. Through the analysis of the gill of N. albiflora, research findings indicated that the metabolites involved in energy metabolism were predominantly down-regulated, and increased levels of arachidonic acid derivatives were responsible for anti-inflammatory, osmotic, and hypoxic regulation [16]. This information can provide insights into the metabolic pathways and biochemical processes that are involved in the host’s defense mechanism.
In this study, we aim to unravel the regulatory mechanisms underlying golden pompano’s immune response against C. irritans by employing transcriptomic and metabolomic approaches. We performed transcriptomic and metabolomic analyses to investigate the molecular processes involved in the host’s defense against the parasite. By integrating the data from these different omics layers, we constructed a comprehensive model of the host’s immune response. By unraveling the molecular mechanisms involved in the host’s defense, this study aims to provide valuable insights for the development of effective management strategies in the aquaculture industry.

2. Materials and Methods

2.1. Cryptocaryon irritans and Experimental Fish

C. irritans was collected from naturally infected T. ovatus. To establish the passage system, 1000 T. ovatus (total weight: 245.02 g) were used as hosts. Theront propagation and tomont collection followed established methods [2,17]. Fish were infected with a sublethal concentration of theronts (15,000 theronts per fish). Theronts were microscopically counted and >95% viability confirmed before infection. During infection, T. ovatus were maintained at a density of 5 L of seawater per fish and kept in darkness for 2 h. Subsequently, infected fish were transferred to a new, theront-free container for rearing. This rearing system utilized micro-flowing seawater with supplemental aeration. After 4 d, numerous tomonts were observed, attached to the container bottom. At this stage, T. ovatus were transferred to a fresh container to initiate the next infection cycle. The water containing the tomonts was drained, and the tomonts were siphoned into a beaker. Following cleaning, the tomonts were aerated and incubated to allow theront hatching.
T. ovatus were obtained from the South China Sea Fisheries Research Institute Shenzhen Base (Shenzhen City, China). Prior to the experiment, fish were acclimated in tanks maintained at a dissolved oxygen concentration of 8.2 ± 0.2 mg/L and a pH of 8.0–8.3. During acclimation, they were fed a compound diet twice daily at 5% of their body weight. Feed was withheld for 24 h before the start of the experiment.

2.2. Sample Collection

Based on preliminary experiments, the established challenge dose was 15,000 theronts per fish. The 120-h infection trial recorded time-to-death for fish exhibiting loss of equilibrium (failure to right within 10 s). Survivors were defined as fish showing no dermal lesions and normal feeding behavior at trial termination. Liver tissues from both dead and surviving individuals were flash-frozen in liquid nitrogen. Individual disease resistance was quantified as the time interval between initial parasite exposure and severe morbidity/death. Using this phenotypic metric, ten low-resistance fish (earliest mortality, sensitivity group) and ten high-resistance fish (survivors, resistance group) were selected for transcriptomic (EST and RET) and metabolomic (ES and RS) profiling.

2.3. Transcriptome Analysis

Total RNA was extracted from liver tissue using Trizol reagent (Invitrogen, Thermo Fisher Scientific, Waltham, MA, USA) according to the manufacturer’s protocol. RNA purity was assessed using a NanoPhotometer® spectrophotometer (IMPLEN, Chicago, CA, USA), and integrity was evaluated with the RNA Nano 6000 Assay Kit on a Bioanalyzer 2100 system (Agilent Technologies, Santa Clara, CA, USA). Sequencing libraries were prepared using the NEBNext® Ultra™ RNA Library Prep Kit for Illumina® (NEB, Ipswich, MA, USA), following the manufacturer’s instructions. Unique index codes were incorporated to assign sequences to individual samples. Libraries were sequenced on an Illumina NovaSeq platform. Quality metrics (Q20, Q30, and GC content) were calculated for the clean data. Differential expression analysis was performed using DESeq2 (v1.16.1) in R. Gene Ontology (GO) enrichment analysis of differentially expressed genes (DEGs) was conducted using the clusterProfiler R package (R version 4.3.2). KEGG pathway enrichment analysis for DEGs was also performed using clusterProfiler. The reference genome of T. ovatus (available under the ENA accession PRJEB22654 and as BioProject PRJNA40684 in the NCBI Sequence Read Archive) was utilized for transcriptome data analysis.

2.4. Metabolome Analysis

Liver samples from the 10 susceptible (ES) and 10 resistant (RS) fish (biological replicates) were analyzed individually. Each sample was processed with three technical replicates for LC-MS/MS to ensure analytical robustness. Metabolites were extracted from the livers according to the protocols described by Xie et al. [16] with minor modifications and analyzed by liquid chromatography-tandem mass spectrometry (LC-MS/MS). After quality control, metabolomics data were annotated against reference databases. Autoscaled data underwent multivariate analysis via orthogonal partial least squares-discriminant analysis (OPLS-DA), with differential metabolites identified using thresholds of VIP > 1.0 and p < 0.05. OPLS-DA was performed using SIMCA-P (v16.0). Univariate analysis employed non-parametric Mann–Whitney U tests for two-group comparisons (ES vs. RS). Pathway analysis of differential metabolites was performed, and potential metabolite biomarkers were subsequently identified.

2.5. Verification Results via qRT-PCR

cDNA was synthesized from total RNA using the PrimeScript™ RT reagent kit (TaKaRa, Dalian, China) and stored at −80 °C. Then, prior to qPCR, a working dilution was prepared at 100 ng/µL and stored at −20 °C. qRT-PCR was performed using a Roche LightCyclerR 480II (Roche, Diagnostics, Shanghai, China) with liver cDNA samples as templates. The qRT-PCR kit was a SYBR Green Premix Pro Taq HS qPCR Kit (Regen, Guangzhou, China). Gene-specific primers were designed using Primer Premier 6.0 software (Table 1). qPCR was performed according to the manufacturer’s protocol (TaKaRa) in a 12.5 µL reaction volume containing: 6.25 µL 2× TB Green Premix Ex Taq II (Tli RNaseH Plus) (TaKaRa), 1 µL cDNA template, 0.5 µL each of forward and reverse primers, and 4.25 µL Milli-Q water. Relative gene expression was calculated using the CT method (2−ΔΔCT) [18].

2.6. Statistical Analysis

The 24 differentially expressed metabolites (DMs) and eight differentially expressed genes (DEGs) were selected from the metabolomic and transcriptomic datasets, respectively. Pearson correlation analysis was performed between DEG expression levels and DM abundance data. Shared DEGs and DMs across both datasets were mapped to KEGG pathways to identify common metabolic pathways. Within these pathways, Pearson correlation analysis was repeated between DEGs and DMs. Mantel tests were performed via the vegan R package. Pearson correlations between DEGs/DMs were calculated in R (significance levels: * p < 0.05, ** p < 0.01, *** p < 0.001. Color scale indicates the strength and direction of correlation). Significantly correlated pairs (p < 0.05) were used to construct a co-expression network in Cytoscape v3.9.1.
Data were analyzed using SPSS 22.0 (BM Corporation, New York, NY, USA). Results are presented as mean ± standard error (SE). Differences among groups were assessed by one-way ANOVA followed by Tukey’s post hoc test, with p < 0.05 considered statistically significant.

3. Results

3.1. Transcriptome Analysis

3.1.1. Sequencing, De Novo Assembly, and Gene Annotation

A total of 20 libraries were constructed in this experiment, and the sequence statistical results are shown (Table 2). A total of 9.64 × 10⁸ raw reads were obtained from 20 cDNA libraries. The number of reads aligned to the unique position of the reference genome was 9.04 × 10⁸ raw reads (Table 2).

3.1.2. Functional Analysis of Liver Unigenes

The annotated genes of the EST and RST group were further analyzed for differential expression. Transcriptome data analysis of the EST and RST group obtained 2031 differentially expressed genes, including 1027 up-regulated genes and 1004 down-regulated genes (Figure 1).
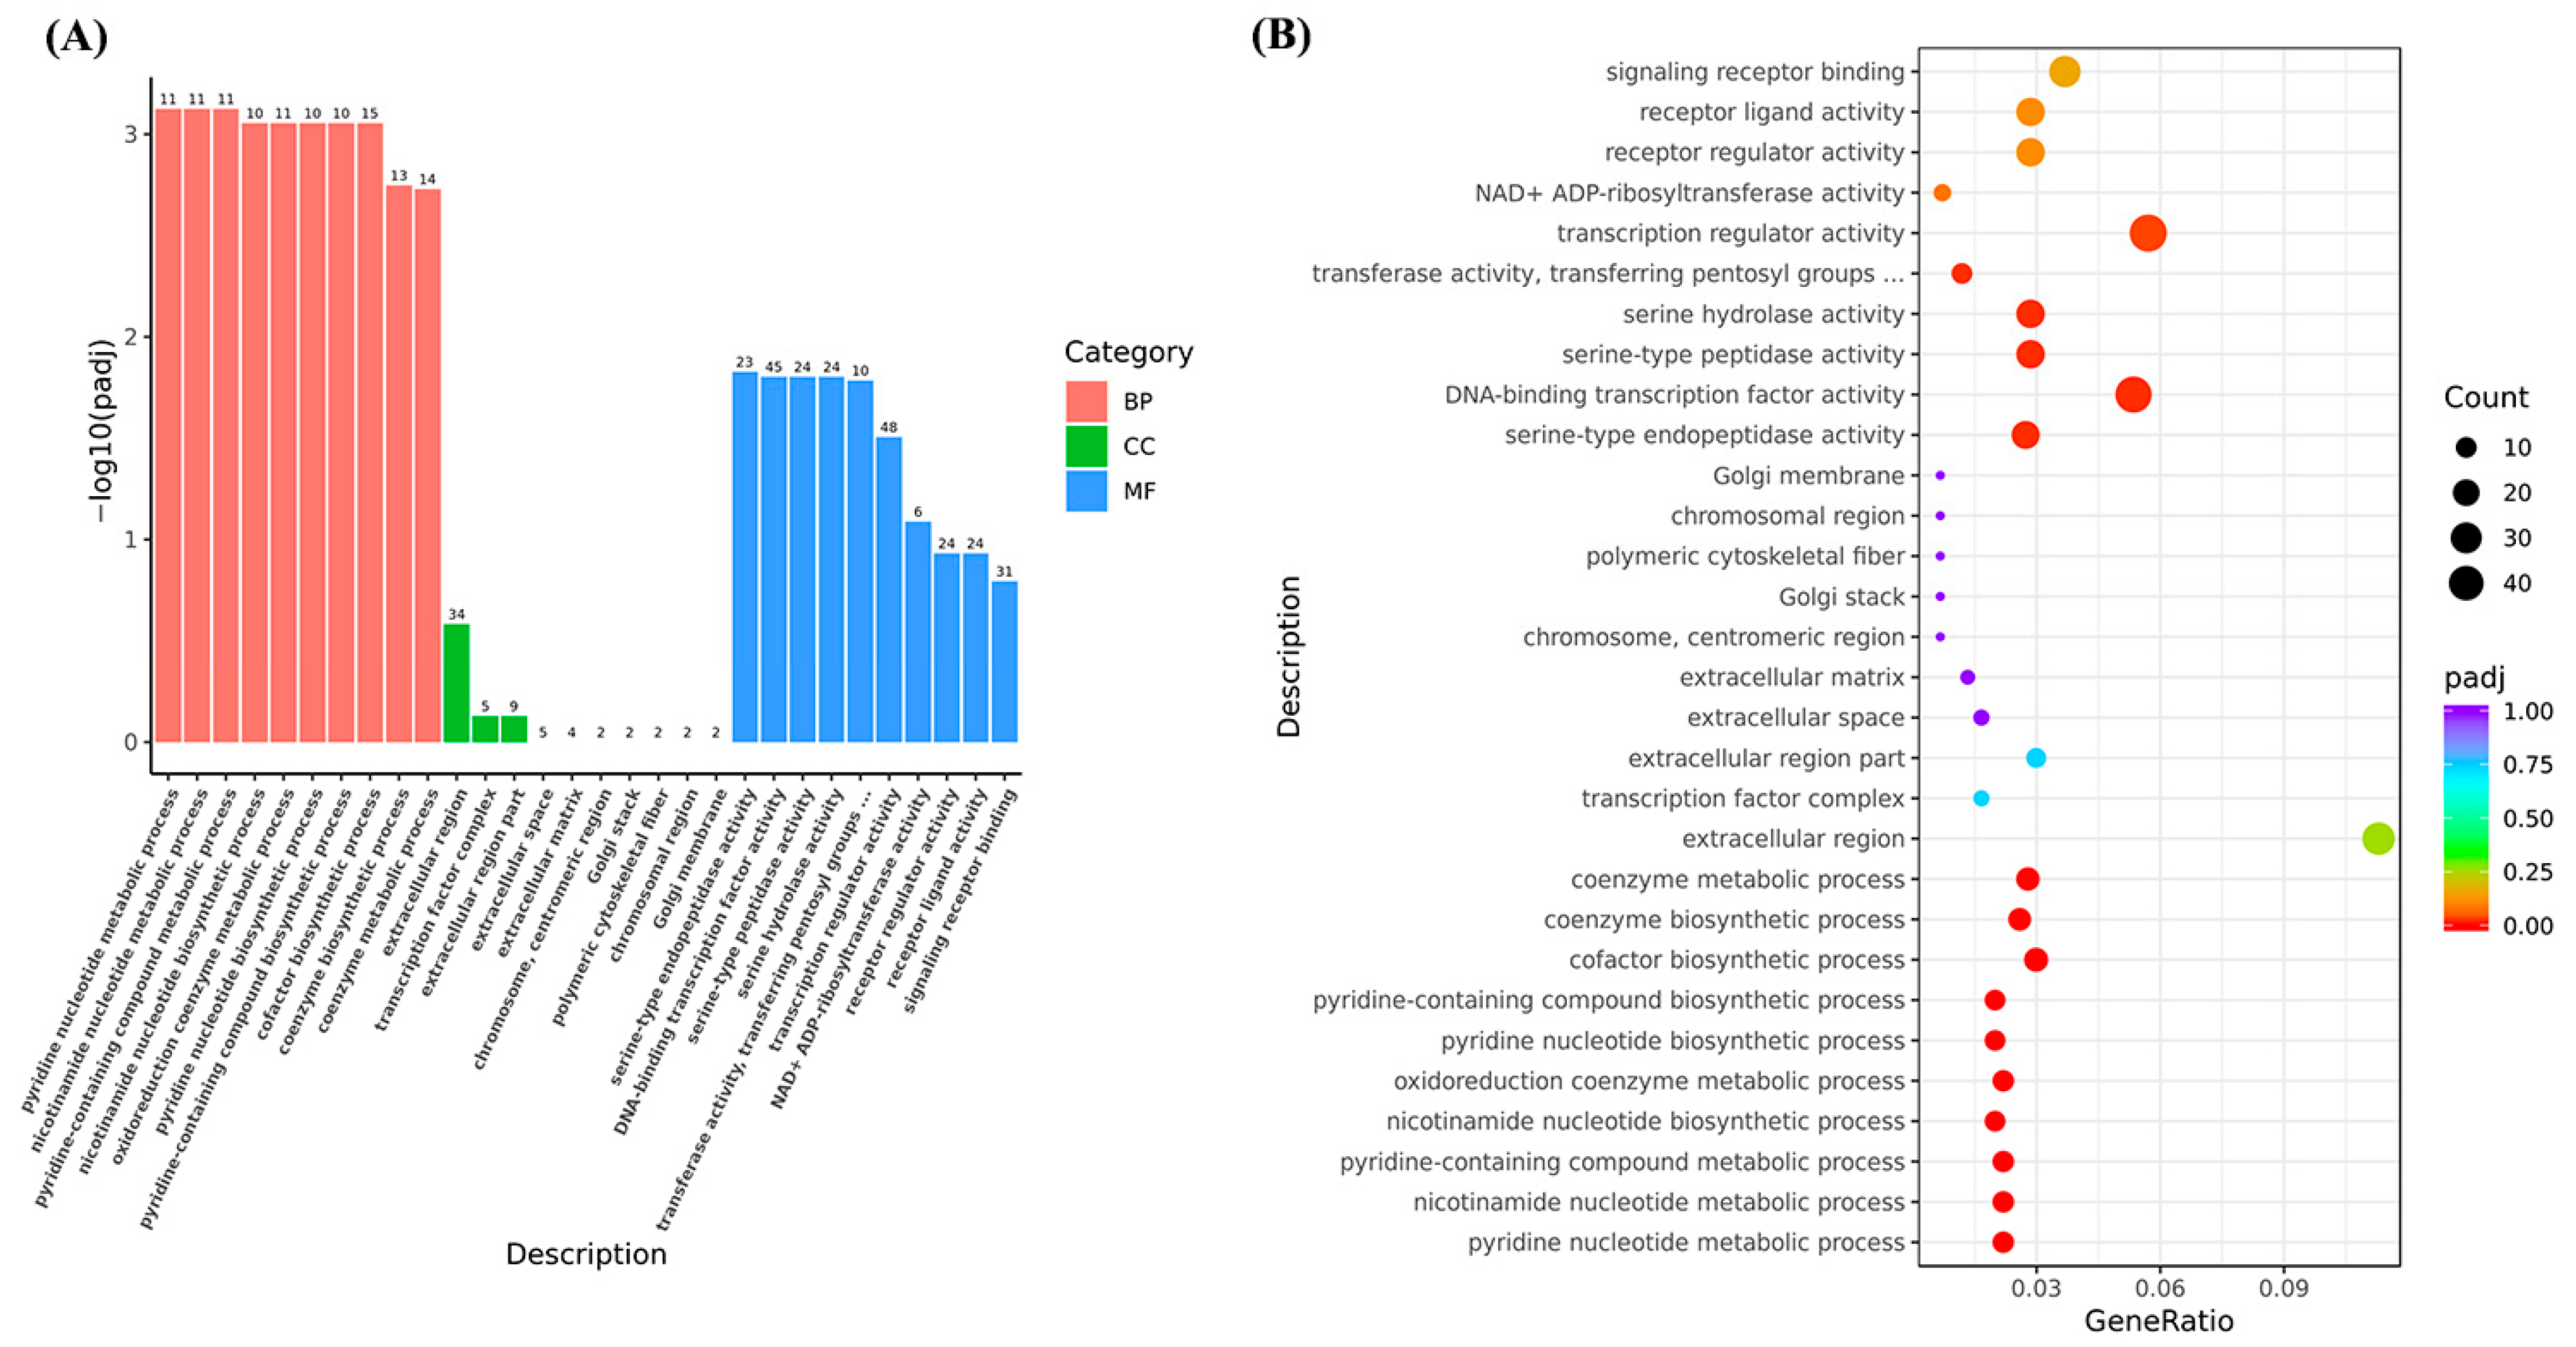
There are three functional groups with significant differences in the TOP10 GO entries: biological processes (BP), cellular components (CC) and molecular functions (MF) (Figure 2A). The most significantly enriched GO terms related to the pyridine nucleotide metabolic process, the nicotinamide nucleotide metabolic process and the pyridine-containing compound metabolic process in the biological process. The items with the highest concentration of differential expression related to DNA-binding transcription factor activity, serine-type endopeptidase activity and serine-type peptidase activity in the molecular function (Figure 2B).
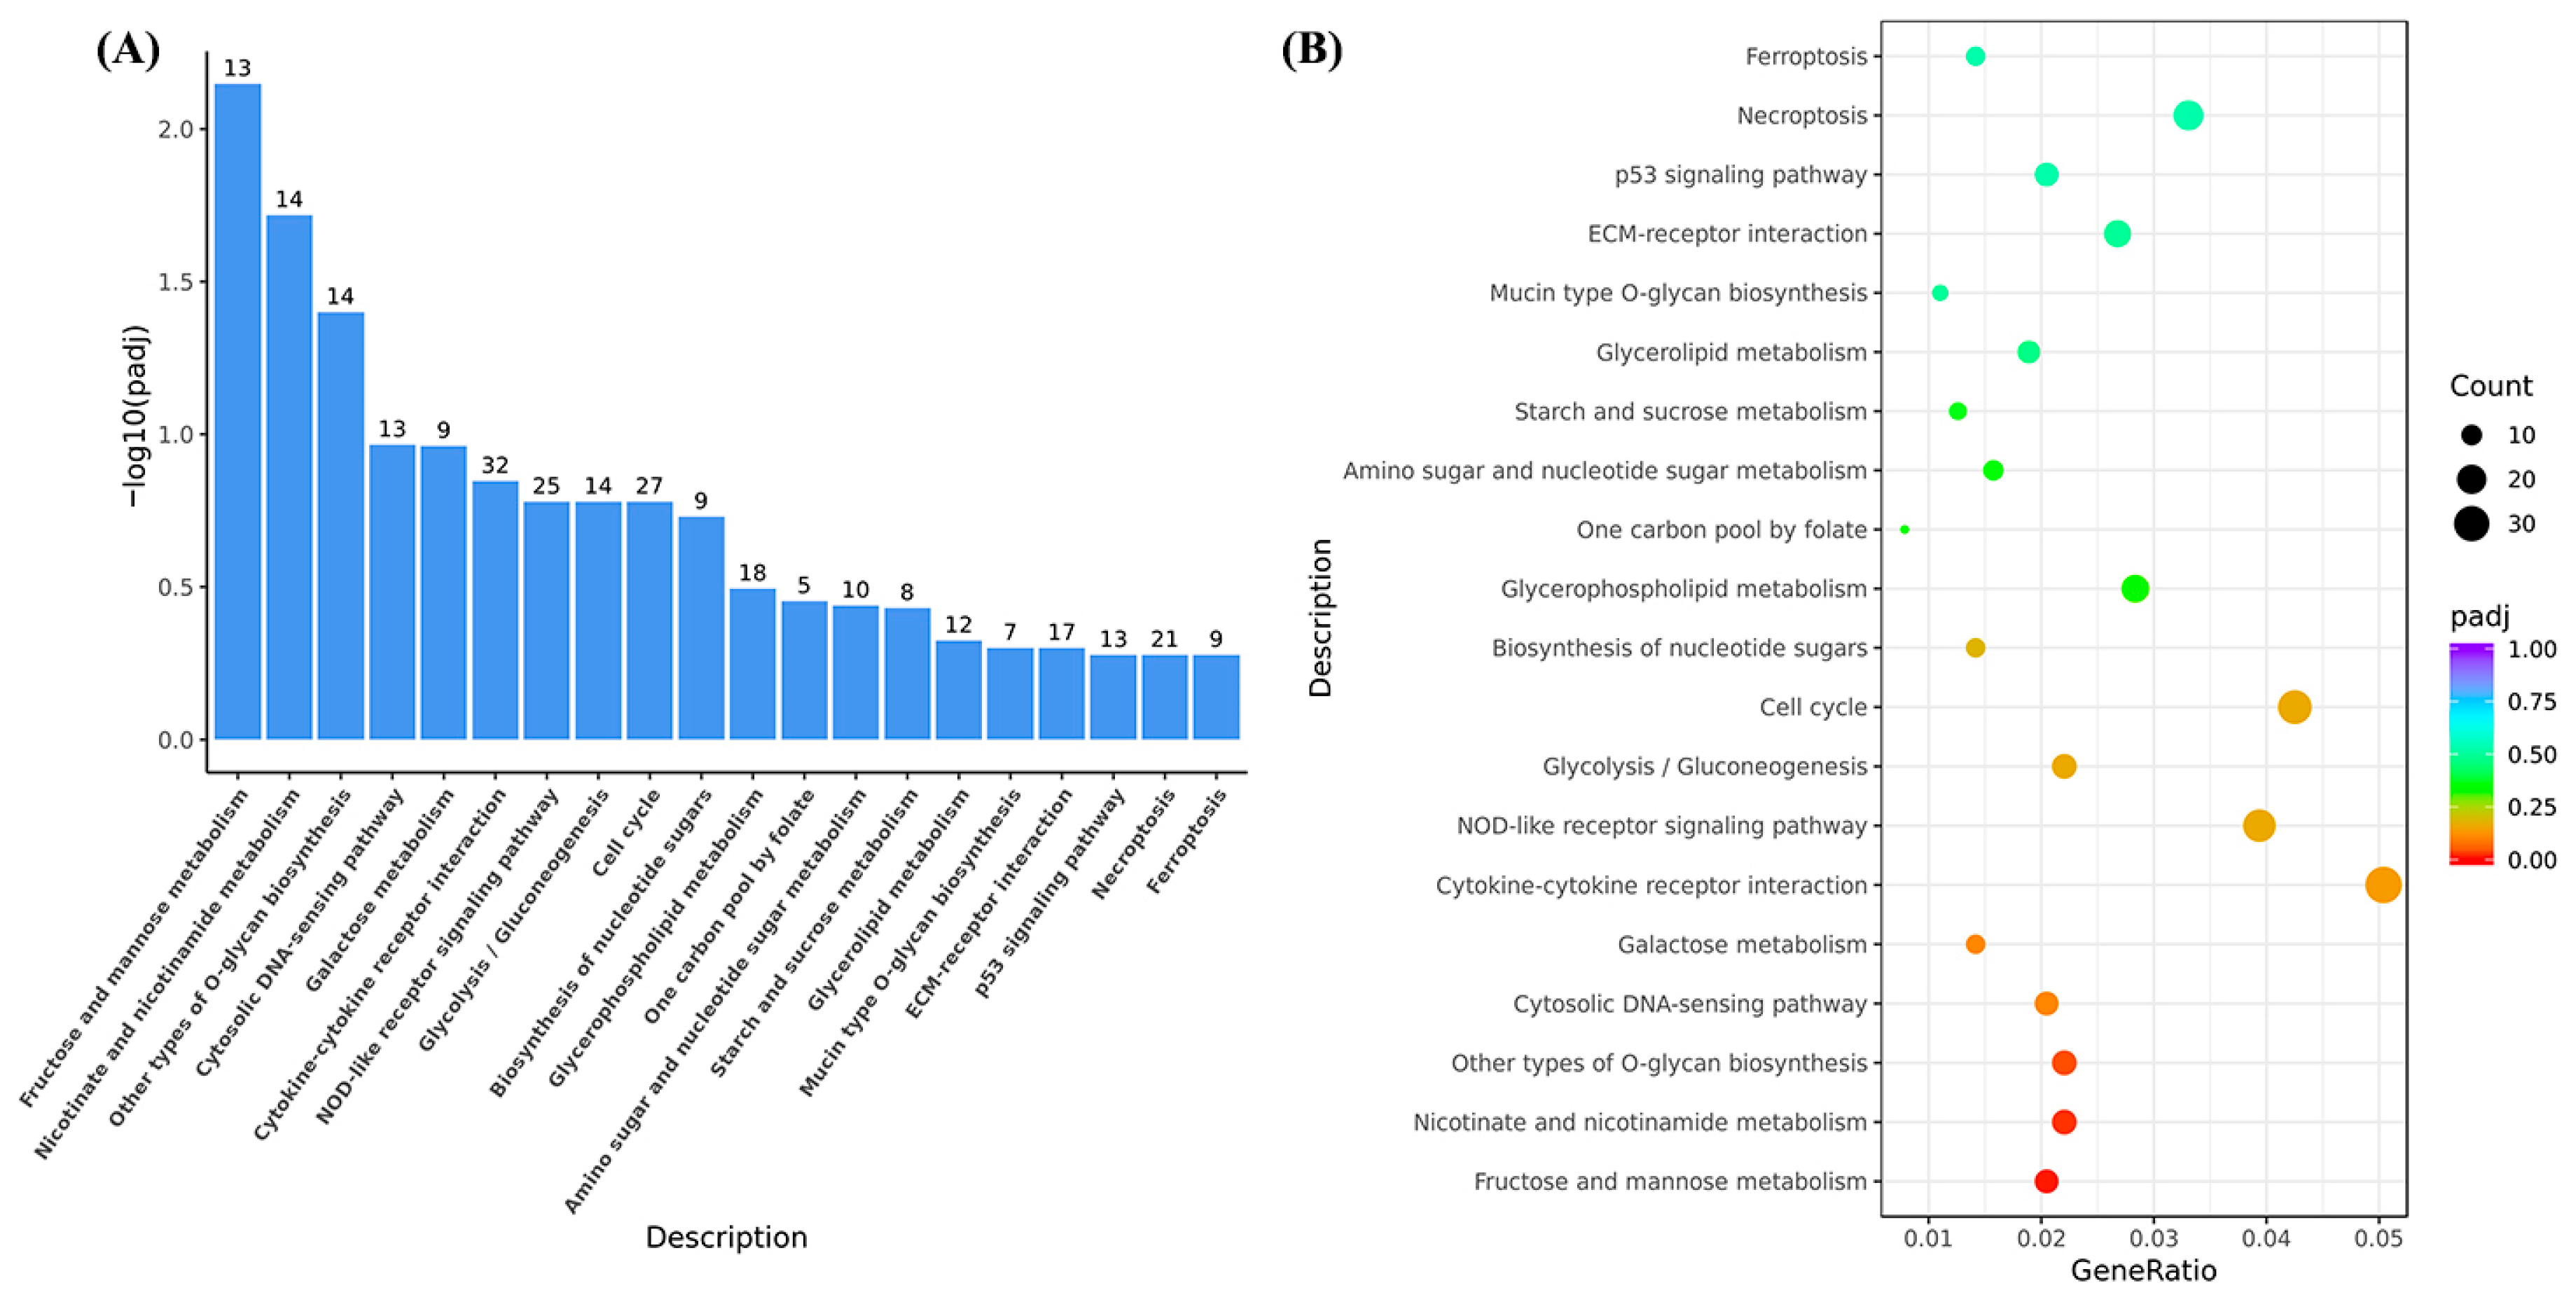
The KEGG analysis of all DEGs was enriched in 635 pathways. Screening with FDR < 0.05 obtained a KEGG pathway with significantly enriched differential genes. The pathways are generally related to fructose and mannose metabolism, niacin and nicotinamide metabolism, cytoplic DNA-sensing pathways, and galactose metabolism (Figure 3A,B).

3.1.3. RNA-seq Data Validation

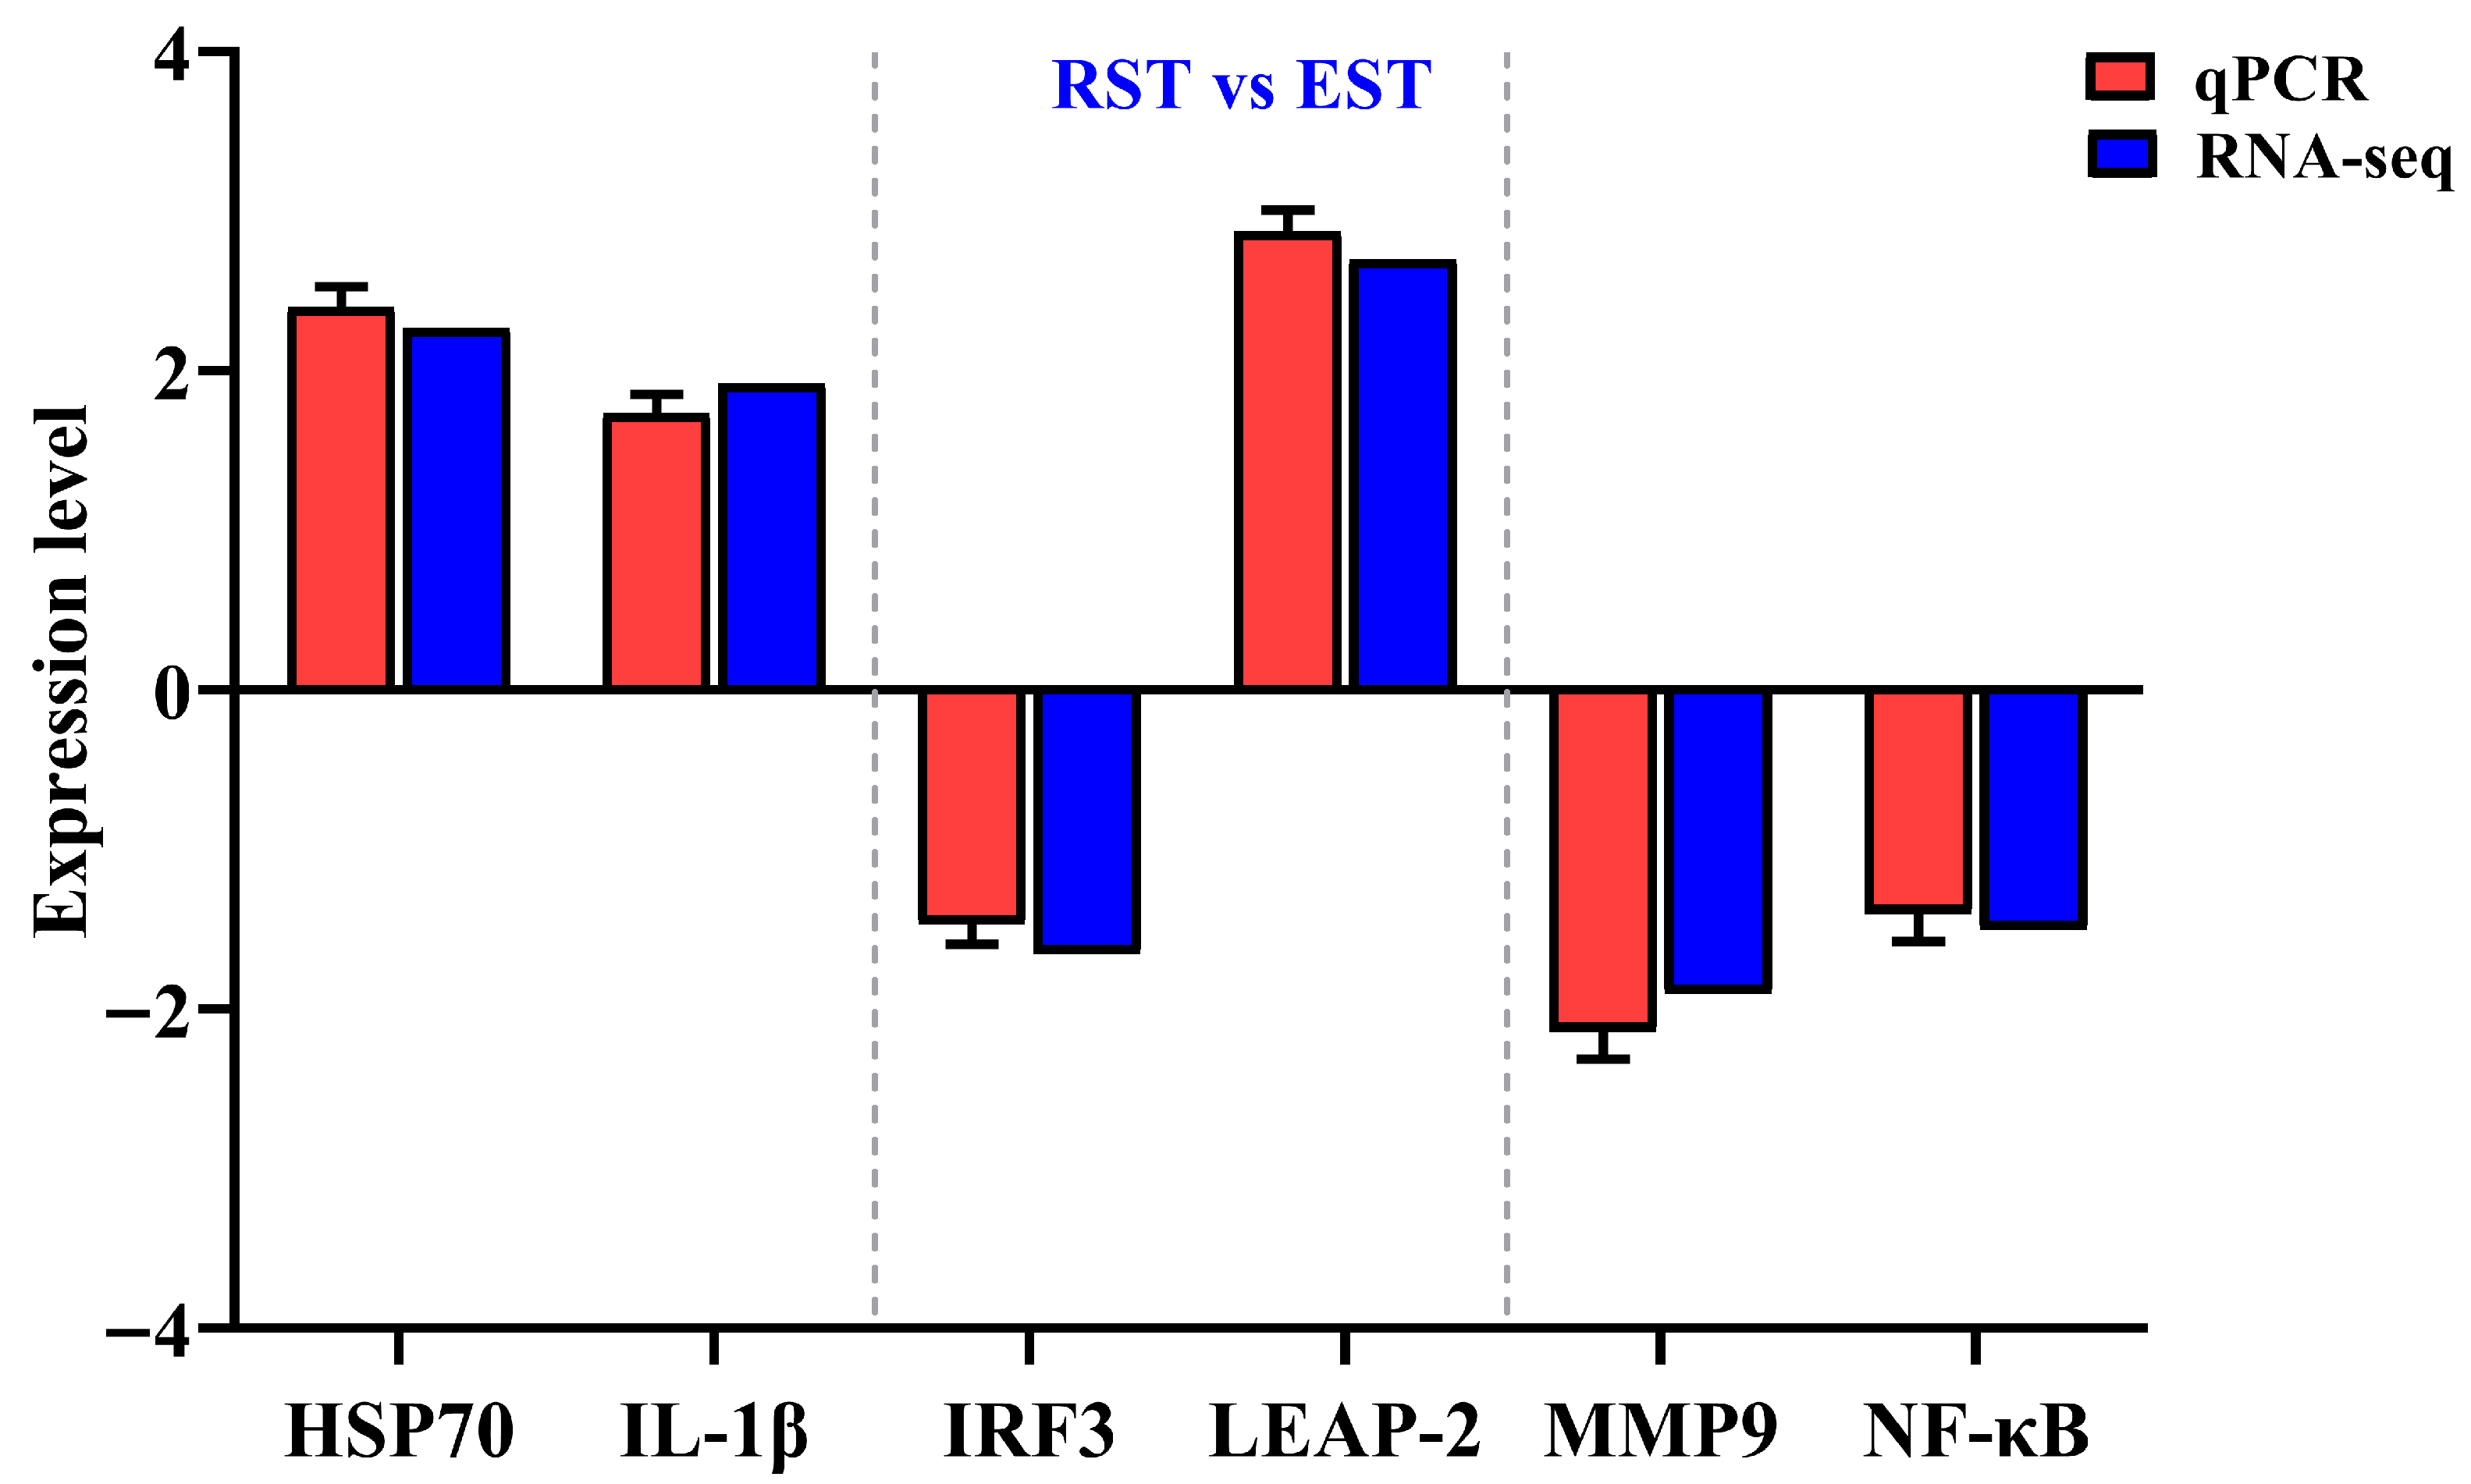
The expression profiles of six randomly selected genes (HSP70, LEAP-2, IL-1β, IRF3, MMP9 and NF-κB) were determined using qRT-PCR to validate the RNA-seq transcriptome data. The expression patterns of the six genes based on qRT-PCR were consistent with the RNA-seq data (Figure 4), indicating the specificity and accuracy of the transcriptome data.

3.2. Metabolomics Analysis

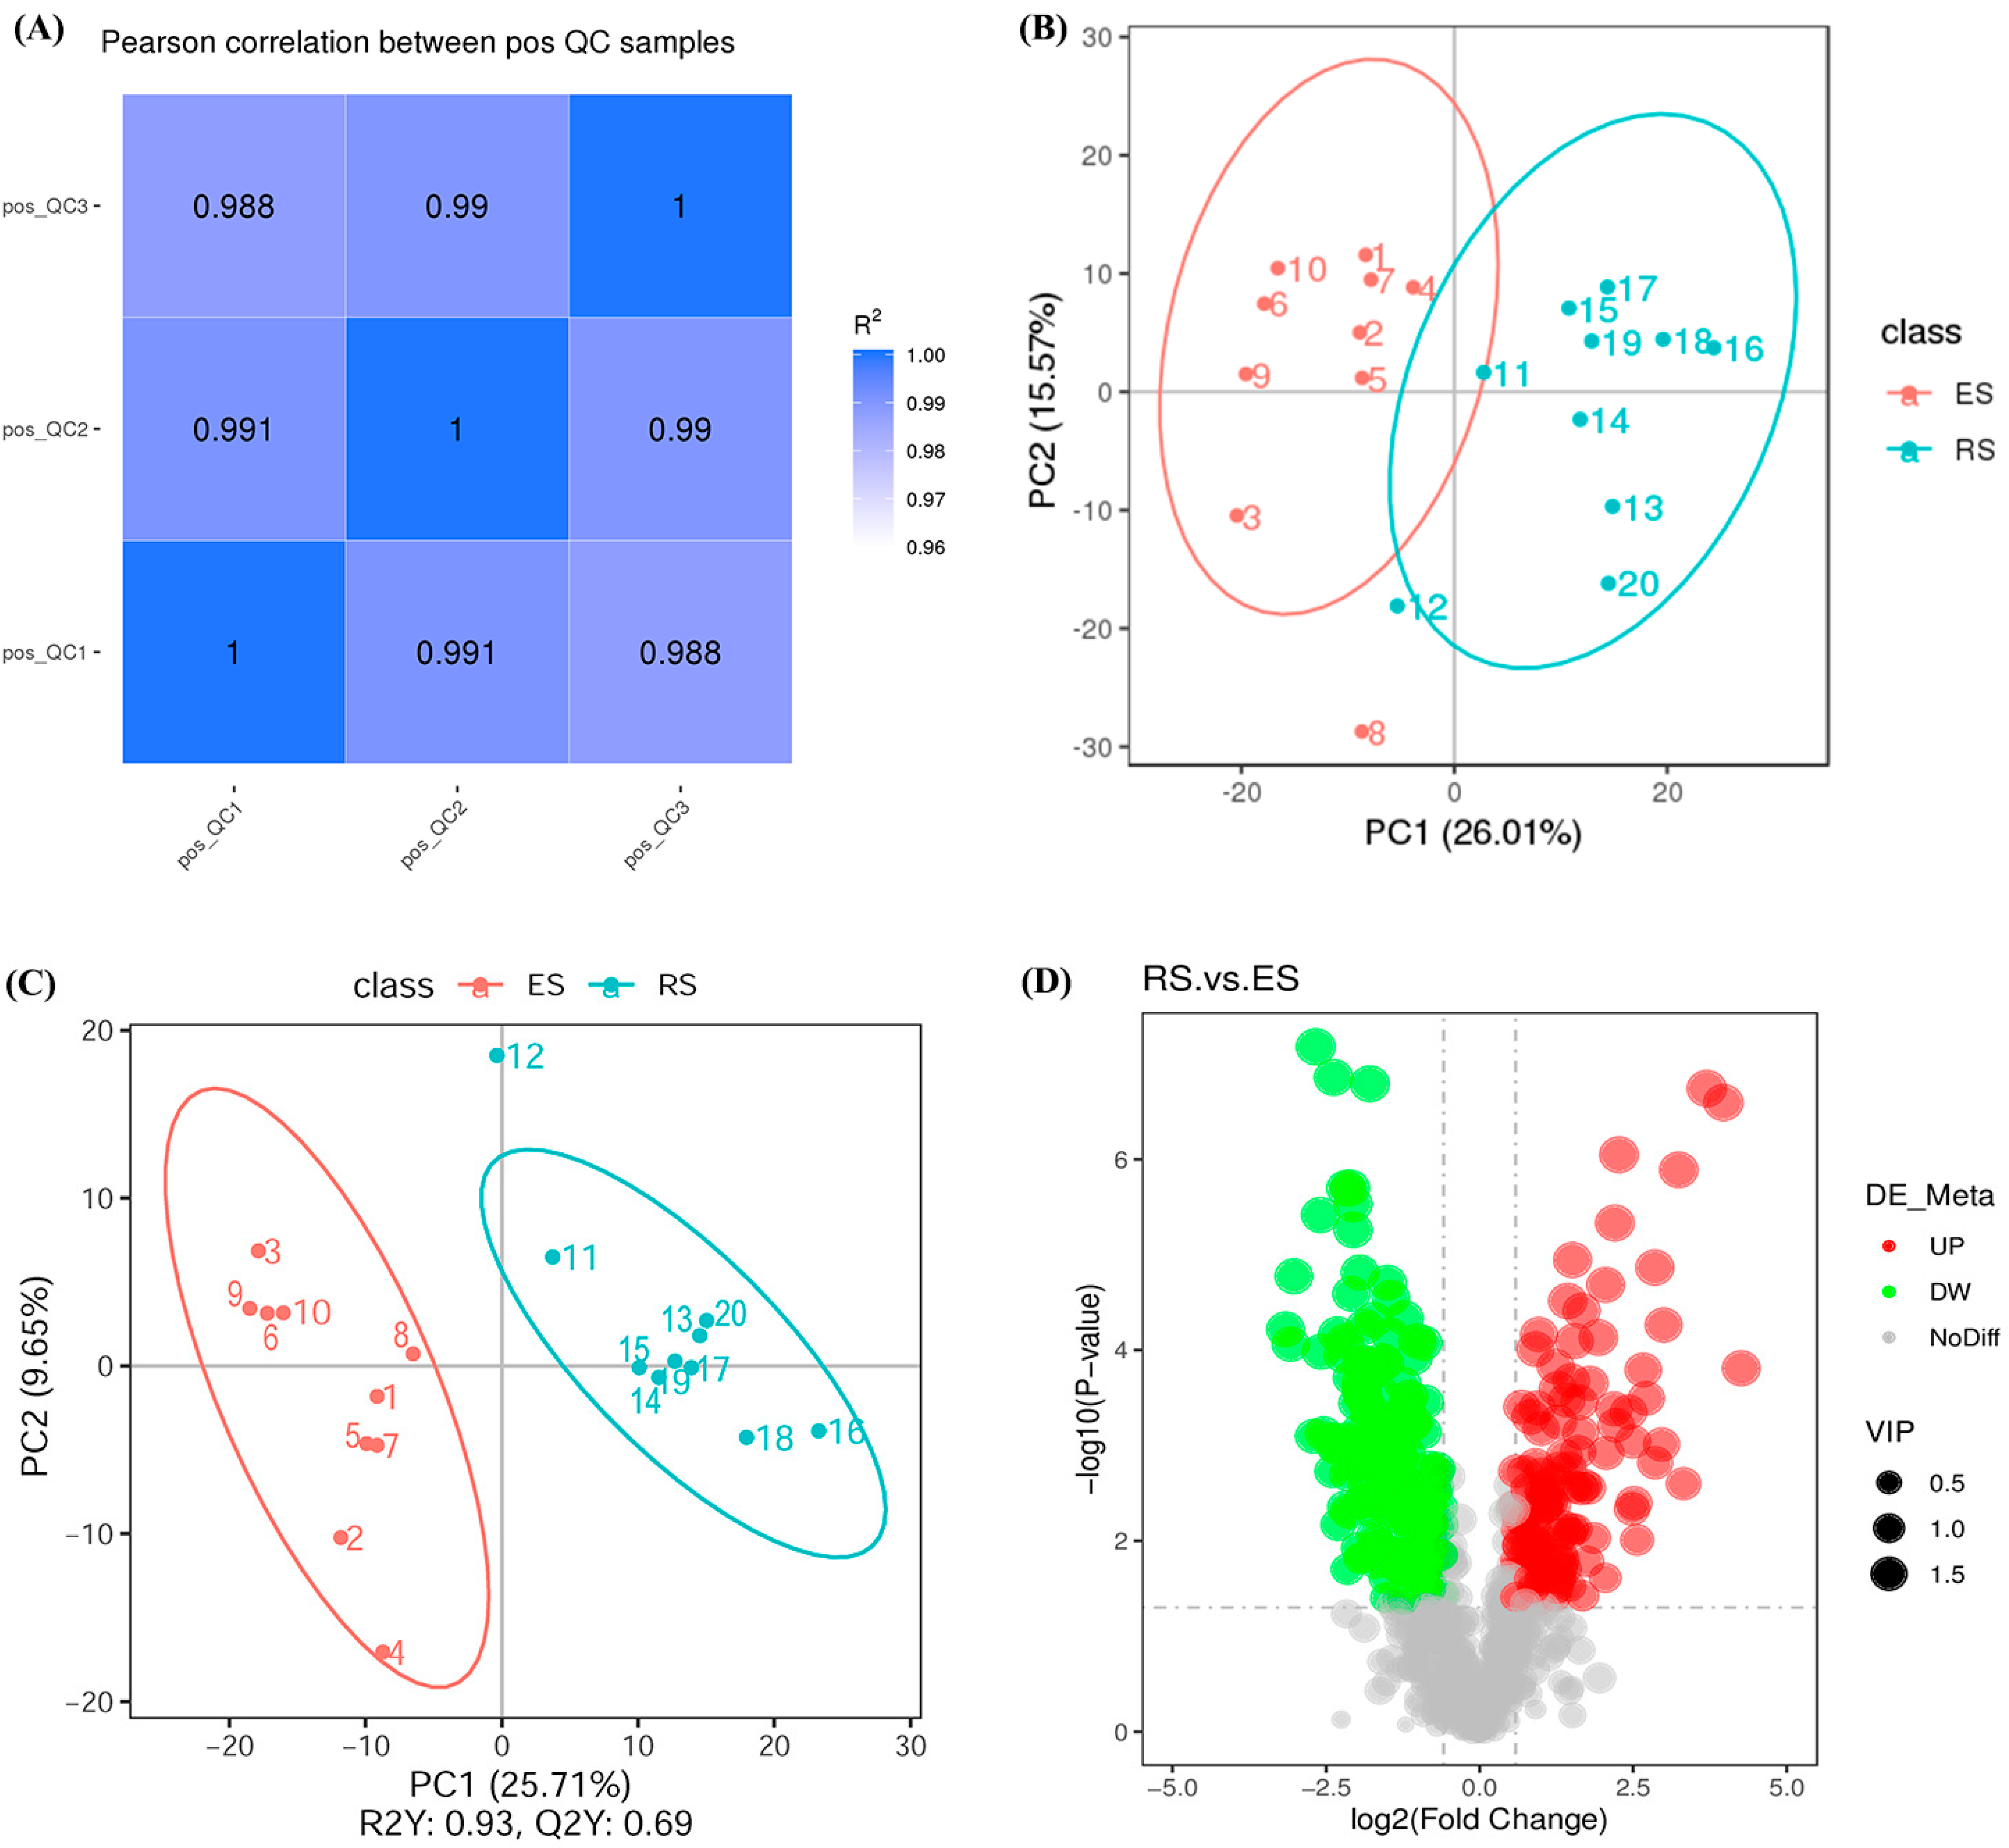
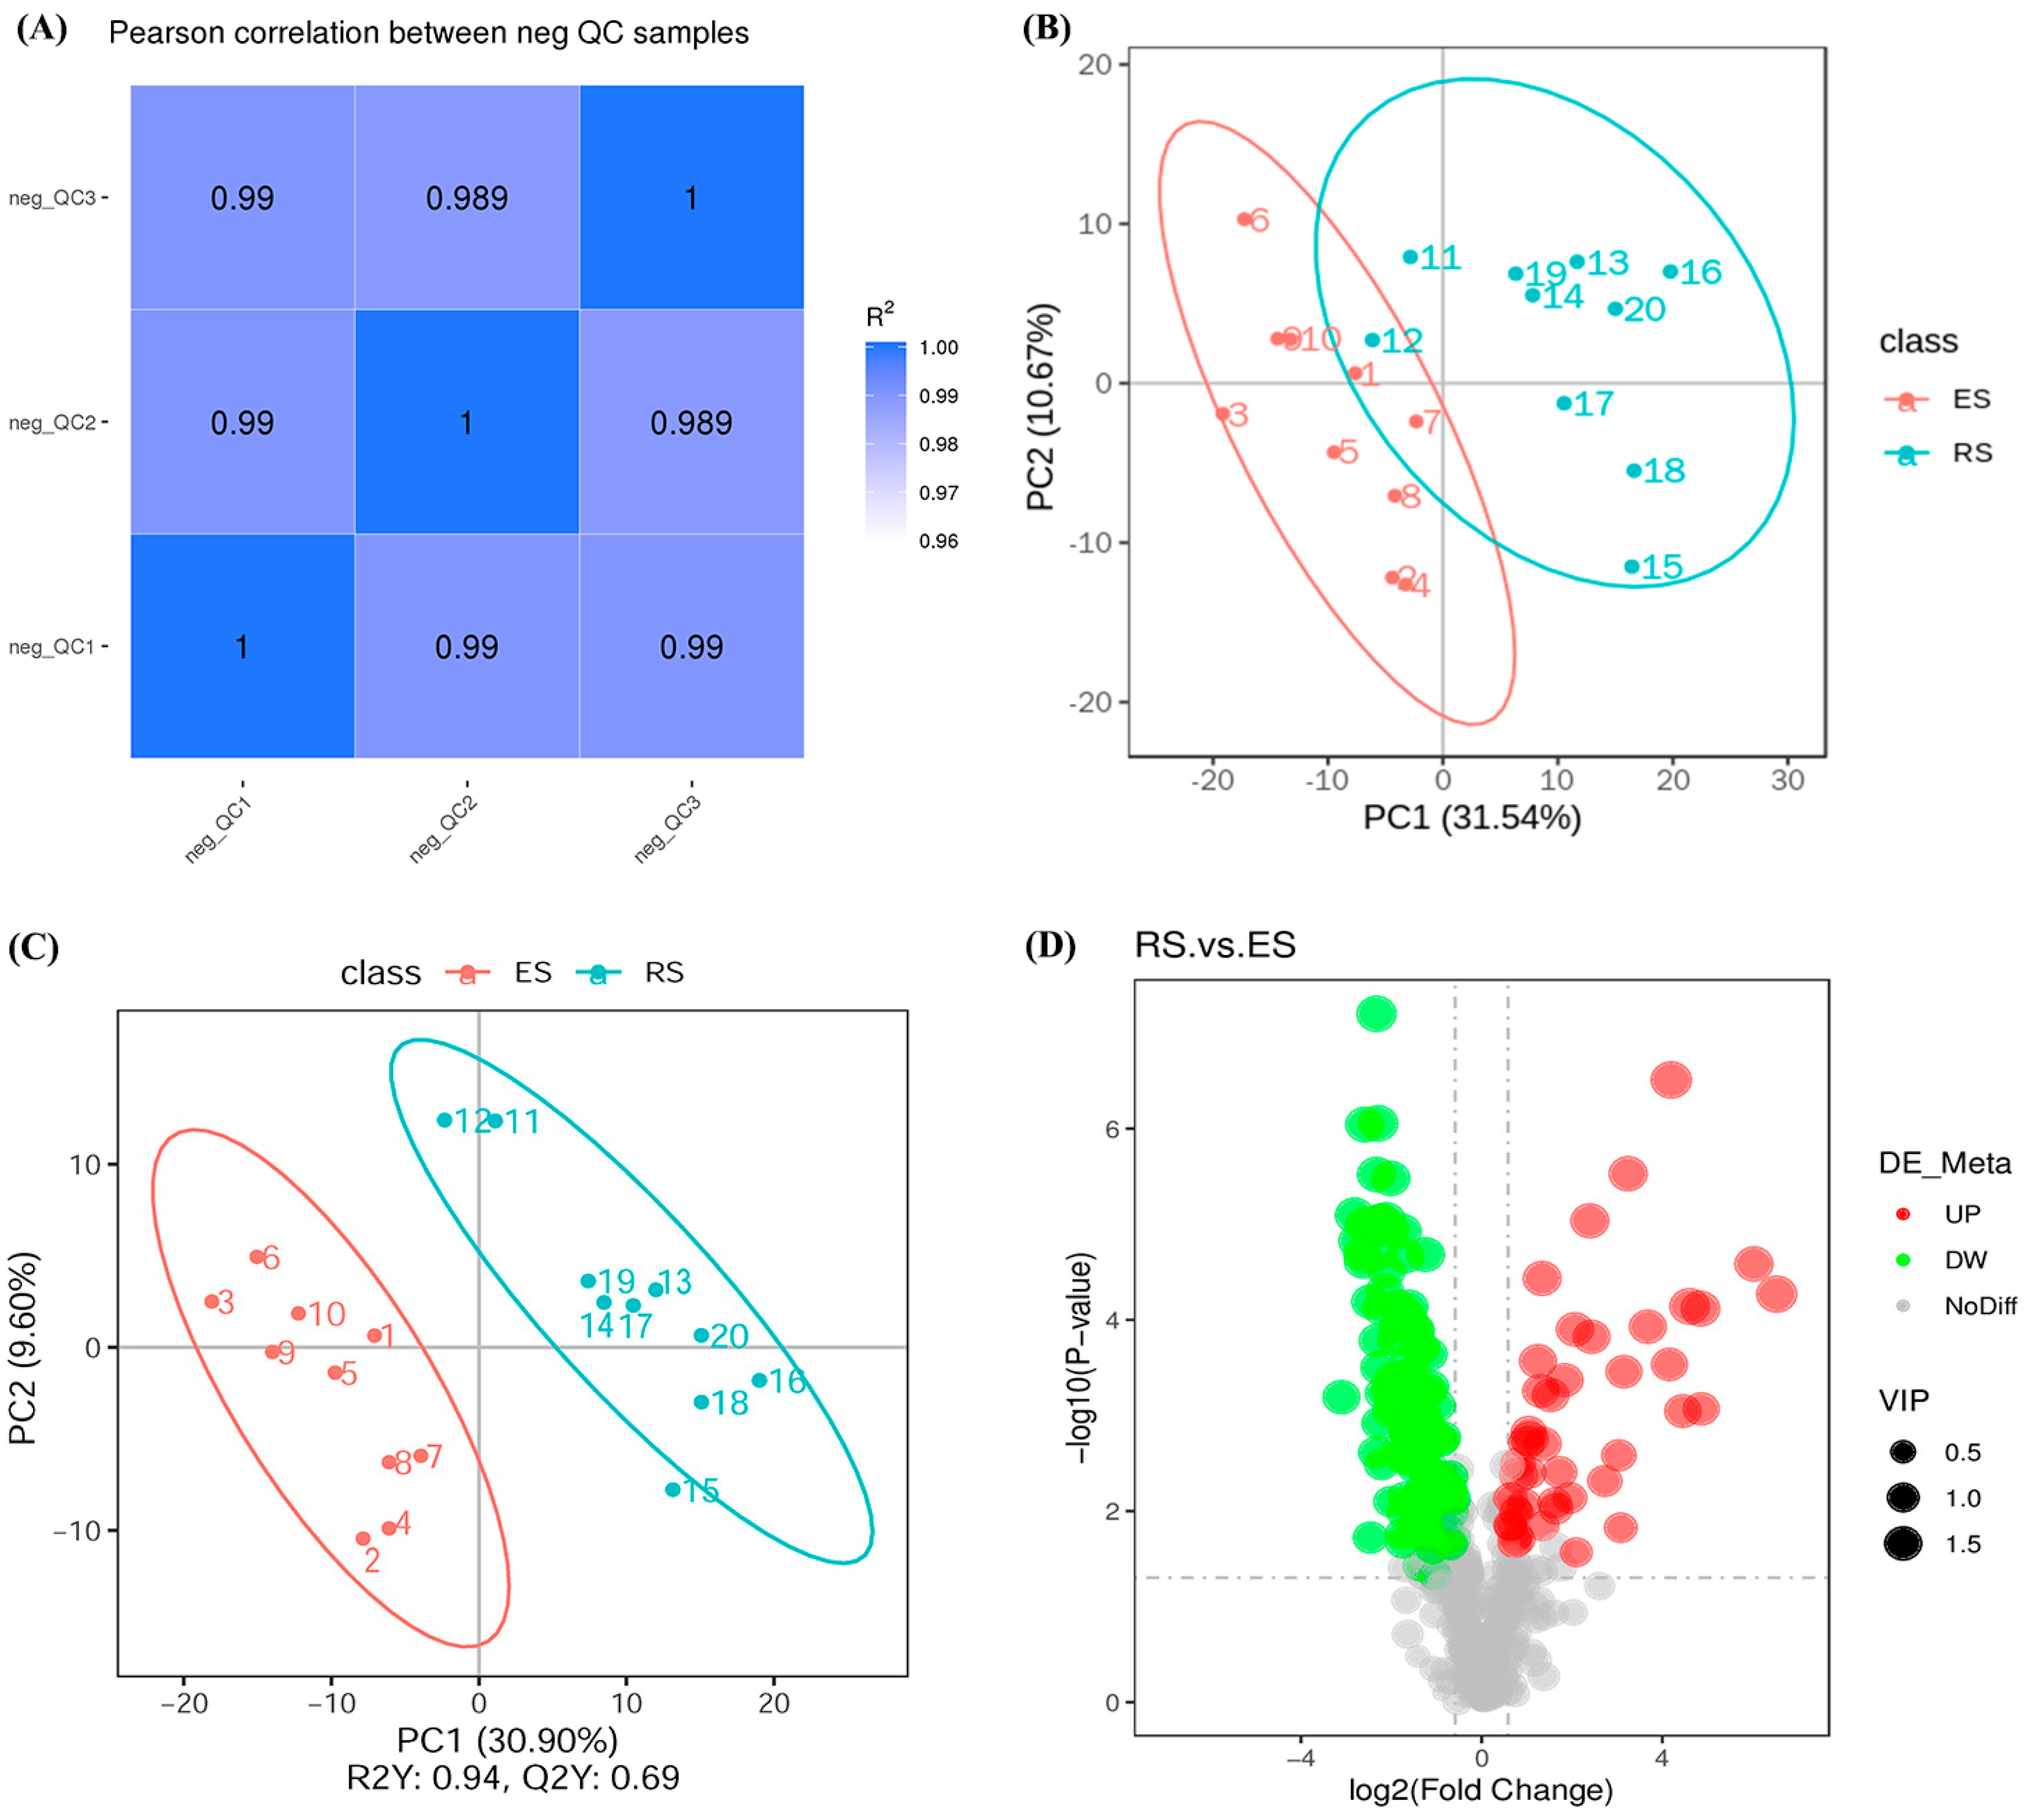
Sensitivity groups (ES) and resistance groups (RS) were established by selecting dead and surviving individuals from golden pompano subjected to C. irritans infection. The Pearson correlation coefficients calculated from the relative quantification of metabolites demonstrated high correlation between QC samples (Figure 5A and Figure 6A). The R2 values of the positive and negative QC samples were between 0.988–0.991 and 0.989–0.99, respectively. The PCA method was used to observe the overall distribution trend between the two groups of samples. PC1 and PC2 explained 26.01% and 15.57% of variance in positive (Figure 5B), PC1 and PC2 explained 31.54% and 10.67% of variance in negative (Figure 6B). The partial least squares discrimination analysis (PLS-DA) score plots of groups in positive and negative and a sorting-verification diagram are shown in Figure 5C and Figure 6C.
A total of 778 metabolites in the positive ion mode and 468 metabolites in the negative ion mode were identified. A total of 289 significantly different ion mode metabolites were found, including 167 up-regulated metabolites and 122 down-regulated metabolites (Figure 5D). In the negative ion mode, 172 significantly different anion mode metabolites were identified, including 128 up-regulated metabolites and 44 down-regulated metabolites (Figure 6D).
Functional and taxonomic annotation of the identified metabolites in positive and negative ion mode was performed via KEGG, encompassing seven biological metabolic pathways: metabolism, genetic information processing, environmental information processing, cellular processes, and organismal systems (Figure 7A and Figure 8A); LIPID MAPS encompasses seven major categories: fatty acids (FA), glycerolipids (GL), glycerophosphatids (GP), sphingolipids (SP), sterol lipids (ST), prenol lipids (PR), and polyketides (PK) (Figure 7B and Figure 8B).
In positive ion mode, the top 10 important entries include ascorbic acid and aldehyde metabolism, biotin metabolism, lysine biosynthesis, lysine degradation, pyrimidine metabolism, ovarian steroidogenesis, cortisol synthesis and secretion, Cushing syndrome, steroid hormone biosynthesis, ABC transporters, and metabolic pathways (Figure 7C). In negative ion mode, the top 10 important entries include alpha-linolenic acid metabolism, serotoninergic synapse, arachidonic acid metabolism, steroid hormone biosynthesis, pentose phosphate pathway, ovarian steroidogenesis, bile secretion, carbon metabolism, arginine biosynthesis, and metabolic pathways (Figure 8C). Most identified differential metabolites were associated with amino acid and lipid metabolism (Figure 7D and Figure 8D). The purpose of differential metabolite correlation analysis is to assess the consistency of metabolite variation patterns and reveal their interrelationships. This is achieved by calculating the pairwise Pearson correlation coefficients for metabolites across ES and RS.

3.3. Combined Analysis of Transcriptomic and Metabolomic Data

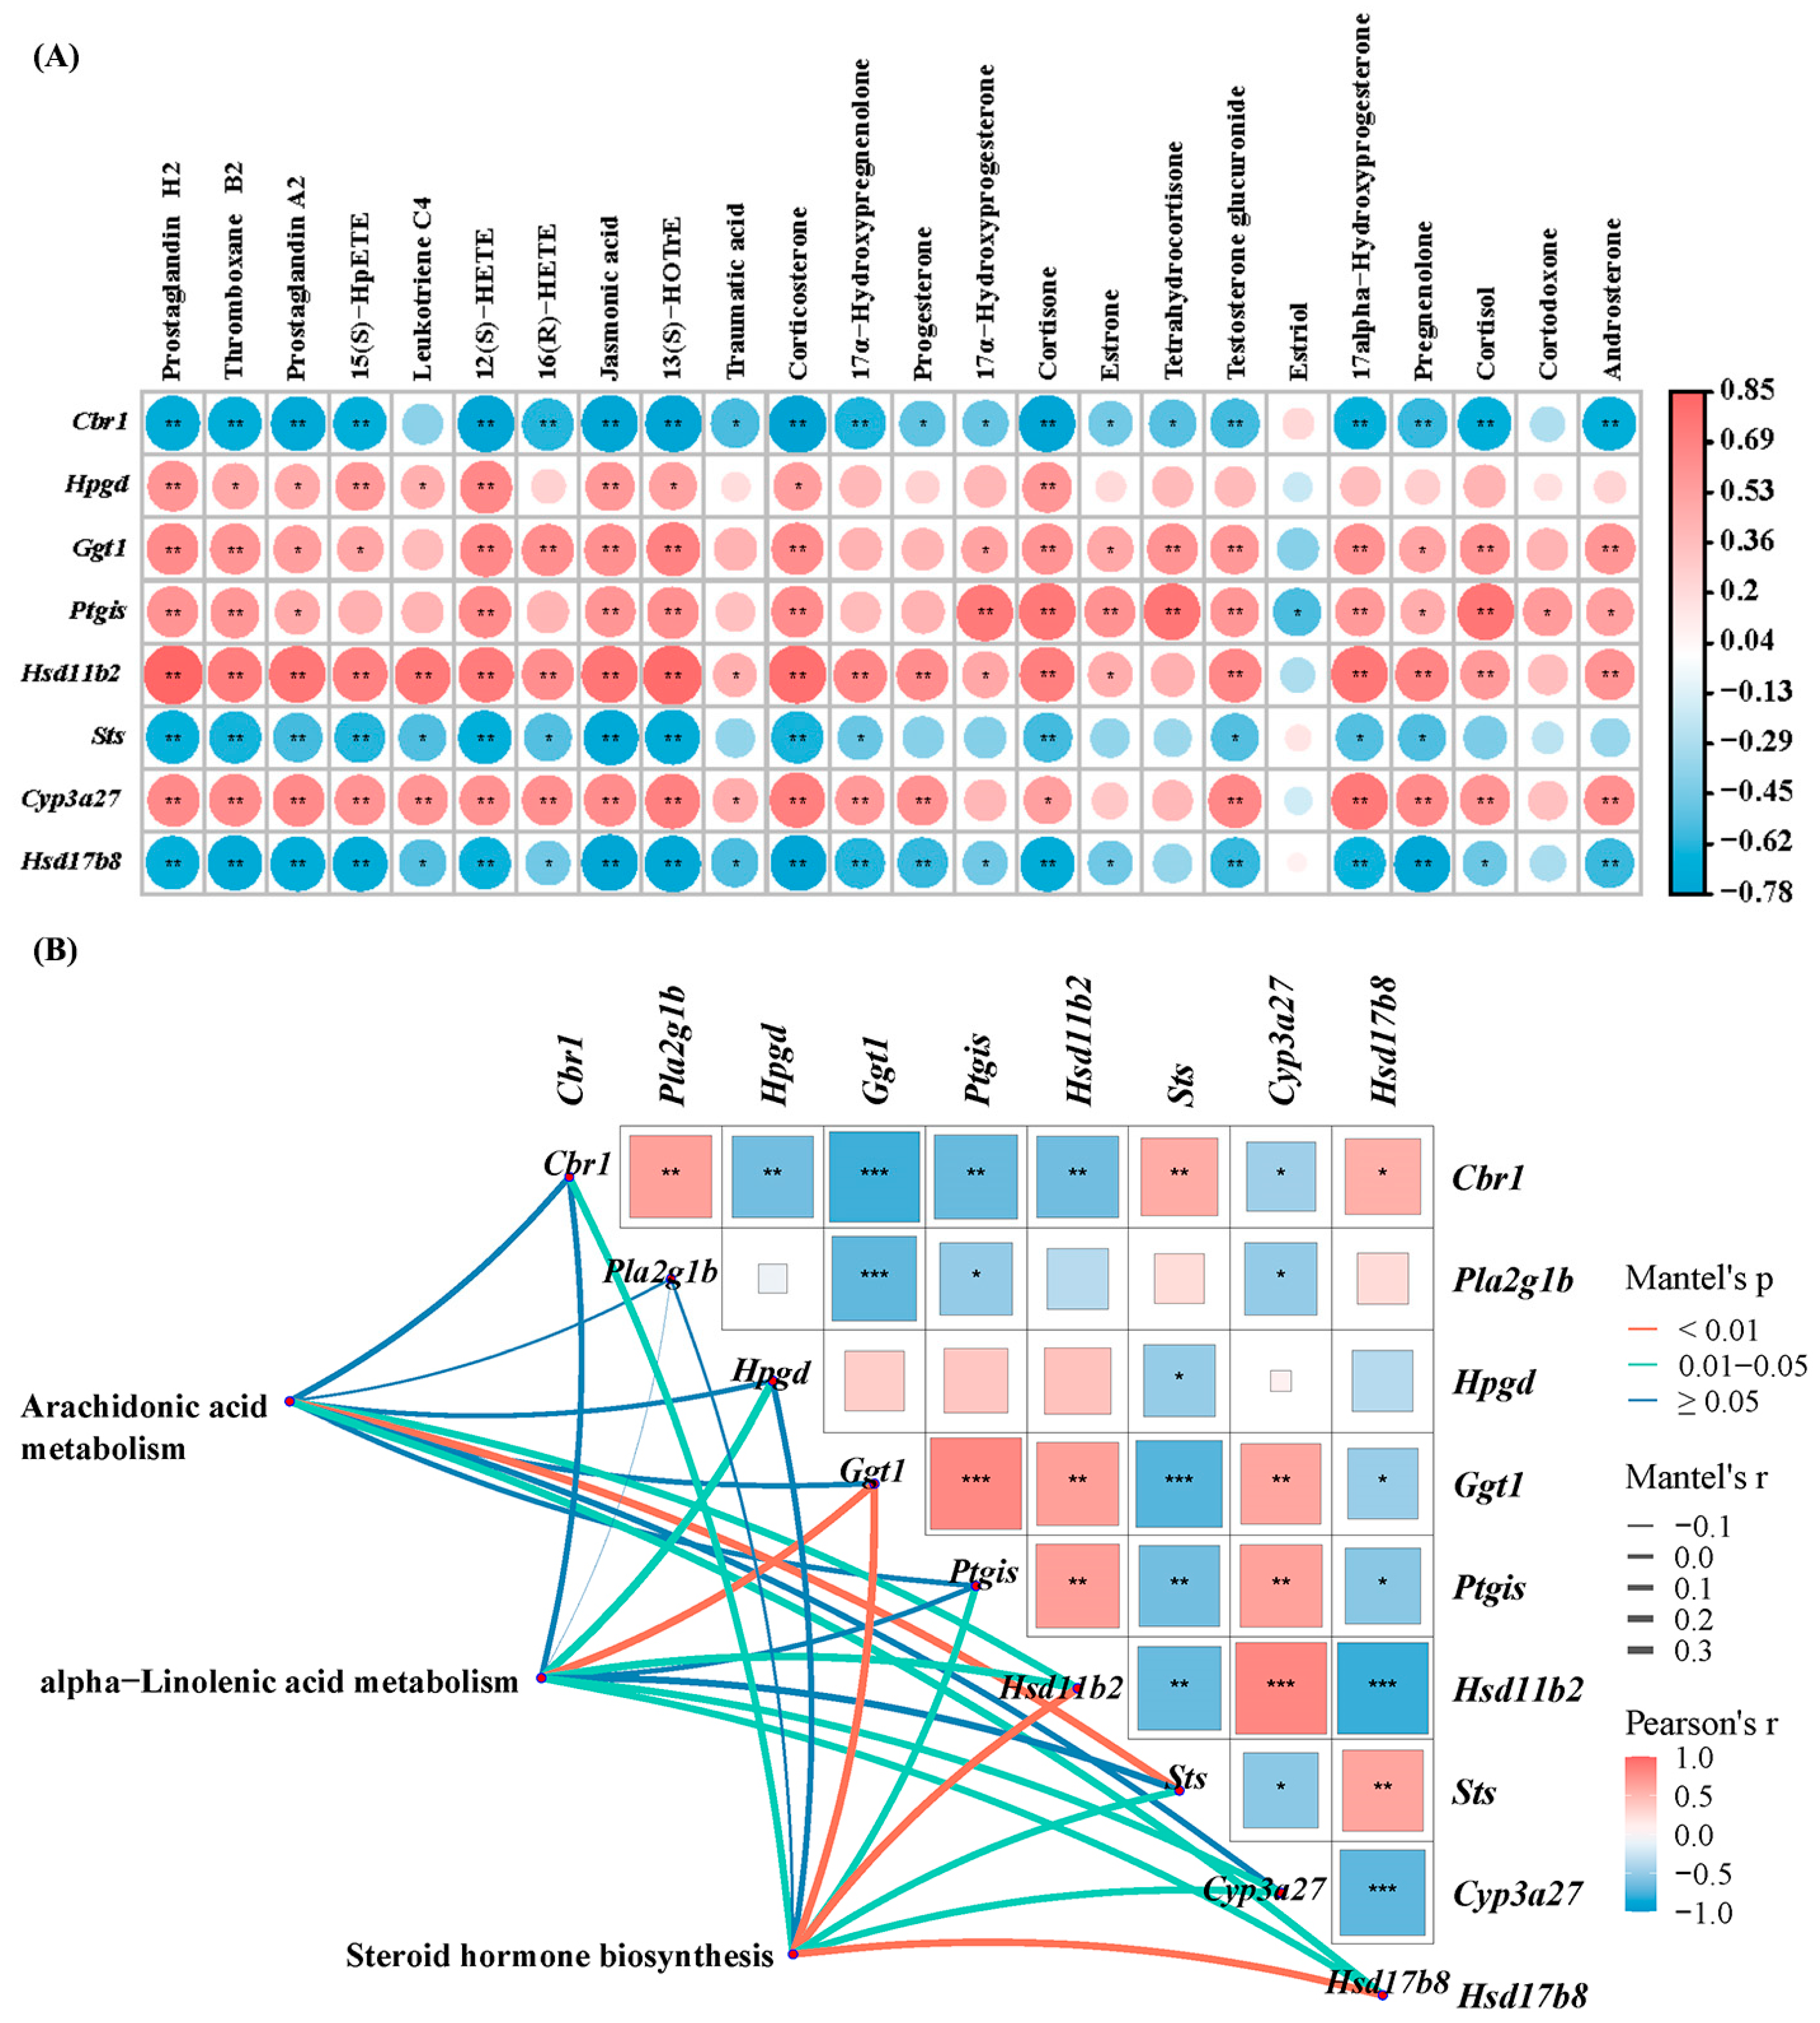
In the correlation analysis (Figure 9A), there was a strong correlation between DMs and DEGs. Metabolites such as prostaglandin H2, thromboxane B2, prostaglandin A2, 15(S)-HpETE, leukotriene C4, 12(S)-HETE, 16(R)-HETE, jasmonic acid, 13(S)-HOTrE, rraumatic acid, corticosterone, 17α-hydroxypregnenolone, progesterone, 17α-hydroxyprogesterone, cortisone, Eestrone, testosterone, glucuronide, estriol, 17alpha-hydroxyprogesterone, pregnenolone, cortisol, cortodoxone, androsterone, and tetrahydrocortisone were positively correlated with Hpgd, Ggt1, Ptgis, Hsd11b2, and Cyp3a27, but negatively correlated with the genes of Cbr1, Sts, and Hsd17b8.
Correlations and functional differences among genes (Hpgd, Ggt1, Ptgis, Hsd11b2, and Cyp3a27, Cbr1, Sts, Pla2g1b, and Hsd17b8) involved in arachidonic acid metabolism, α-linolenic acid metabolism, and steroid hormone biosynthesis pathways were demonstrated (Figure 9B).

4. Discussion

In this study, a comprehensive exploration was carried out regarding the changes in gene expression of golden pompano when it was resisting the stimulation caused by C. irritans infection. This was achieved through transcriptome analysis, and a series of valuable findings were obtained. These results offer significant clues for a more in-depth understanding of the parasite resistance mechanism of golden pompano. This substantial disparity in gene expression implies that, when confronted with the stimulation of C. irritans infection, the expression levels of numerous genes within the bodies of golden pompano are modified in response to parasitic invasion. These differentially expressed genes are presumably engaged in a variety of physiological processes associated with the parasite resistance of golden pompano. They function cooperatively in multiple aspects, such as immune defense and metabolic regulation, thus dictating an individual’s susceptibility or resistance to the stimulation of C. irritans infection.
GO enrichment analysis demonstrated that categories like redox coenzyme metabolism, DNA binding transcription factor activity, and transcription factor complexes encompassed the largest number of differentially expressed genes. The process of redox coenzyme metabolism holds a crucial position in energy metabolism and antioxidant defense within living organisms [24,25]. During the course of parasite resistance, it is likely to impact the living environment of the parasite inside the host’s body by modulating its redox state. For instance, it can generate certain metabolites with oxidative killing effects that are capable of inhibiting or eliminating the stimulation caused by C. irritans [26,27,28]. Simultaneously, the significant differential expression of genes related to DNA binding transcription factor activity and transcription factor complexes indicates that transcriptional regulation plays a vital role in resistance against the stimulation of C. irritans infection in golden pompano. These transcription factors may perform various functions including governing the expression of a series of downstream genes and activating or reinforcing physiological processes associated with immune defense and tissue repair, allowing golden pompano to more effectively handle the challenges posed by C. irritans infections.
The KEGG signaling pathway analysis offers us an additional dimension of understanding. The count of differentially expressed genes that are enriched in various signaling pathways, including fructose and mannose metabolism, niacin and nicotinamide metabolism, cytoplic DNA-sensing pathways, and galactose metabolism, is at its peak. The modifications in sugar metabolism pathways such as fructose and mannose metabolism, along with galactose metabolism, could potentially be linked to the supply of energy and the synthesis of cell surface glycoproteins and glycolipids [29,30]. During the process of parasite resistance, the altered carbohydrate metabolism might furnish ample energy and a material foundation for the activation, migration, and synthesis of molecules related to immune defense within immune cells [31,32]. Nicotinic acid and nicotinamide metabolism, being significant metabolic pathways within cells, are involved in the synthesis of coenzymes like NAD(P)H [3,33]. Their metabolic alterations may further influence the redox state of cells and other physiological processes that depend on these coenzymes, and may also have potential synergistic effects with the previously mentioned redox coenzyme metabolism procedures.
What is particularly worthy of attention is the enrichment of differentially expressed genes in the cytoplic DNA-sensing pathway. Ordinarily, there should not be a substantial amount of exogenous DNA in the cytoplasm. However, the stimulation brought about by C. irritans infection might lead to its DNA components entering the cytoplasm of golden pompano cells, thus activating the cytoplic DNA-sensing pathway. The activation of this pathway could then trigger a series of immune responses, with the aim of eliminating the invading parasites [34,35]. This also manifests a specific immune defense mechanism of the golden pompano’s body against parasitic infections.
qRT-PCR validation confirmed dysregulation of key immune genes in resistant fish. Up-regulation of HSP70 and LEAP-2 suggests enhanced stress management and defense [19,20], while elevated IL-1β and NF-κB aligns with robust inflammatory signaling [21]. IRF3 induction implies adaptive immune activation, and MMP9 alterations may reflect tissue remodeling post-infection [22,23]. These genes corroborate the transcriptome findings and underscore their roles in coordinating lipid/amino acid metabolic shifts to potentiate resistance.
This study endeavors to explore the metabolic alterations and underlying mechanisms of golden pompano during its resistance to the stimulation induced by C. irritans through metabolomics analysis. The differential expression of metabolites constitutes a significant manifestation of the metabolic adaptation changes in golden pompano throughout the process of withstanding the stimulation from C. irritans infection. The up-regulated metabolites might play a favorable role in fending off parasitic infections. For instance, they could participate in metabolic pathways related to immune defense, furnishing the requisite material foundation or energy support for the activation of immune cells, the initiation of inflammatory responses, and the direct elimination of parasites [4,31,32]. The down-regulated metabolites may mirror the suppression of the activity of certain non-essential metabolic pathways under infectious circumstances, with the aim of concentrating the limited resources on crucial metabolic processes associated with parasite resistance [36,37].
Alterations in alpha-linolenic acid metabolism may influence the stability of cell membranes and immune regulation in golden pompano. During the response to infection by C. irritans, the cell membrane serves as the primary barrier between the cell and its external environment, making its stability crucial for preventing parasite invasion and maintaining intracellular homeostasis [16]. Alpha-linolenic acid and its metabolites may enhance the resilience of the cell membrane by modifying its lipid composition, thereby mitigating the adverse effects of C. irritans stimulation on cellular function [36,37]. Additionally, certain byproducts generated during its metabolic pathway may exhibit immune regulatory properties, capable of activating immune cells or modulating inflammatory responses, further aiding golden pompano in combating parasitic infections.
The metabolism of arachidonic acid also plays an important role in the anti-stimulation of C. irritans in golden pompano. Arachidonic acid and its metabolites are important inflammatory mediators and cell signaling molecules, playing a crucial role in immune response and tissue repair [4]. Activation of the arachidonic acid metabolic pathway may lead to the initiation of an inflammatory response after infection with C. irritans, which attracts immune cells to the site of infection by releasing inflammatory mediators, killing and clearing the parasite, while also contributing to tissue repair and recovery [15,37].
The association analysis of transcriptomic and metabolomic data reveals that differentially expressed genes in the transcriptome related to the redox coenzyme metabolic process may have potential regulatory relationships with metabolites involved in antioxidant defense in the metabolome. Given the association of steroid hormone biosynthesis, linoleic acid, and alpha-linolenic acid metabolism with lipid metabolism, we inferred that golden pompano undergoes alterations in immune enhancement and antioxidant stress responses following infection and stimulation by C. irritans. To better elucidate the roles of golden pompano and lipid-related metabolism in resisting stimulatory C. irritans, the DEGs and DMs mapped to these relevant pathways were also illustrated in the pathway diagrams. Changes in these metabolite levels may, in turn, feedback regulate the activity of transcription factors, forming a complex regulatory network.

5. Conclusions

This study, through transcriptomic and metabolomic technologies, has revealed significant differences in gene expression and metabolic pathways between the susceptible and resistant groups. These differences may reflect the biological mechanisms of the resistant group in adapting to C. irritans. Future research can further elucidate the molecular mechanisms underlying the formation of differences between the susceptible and resistant groups by constructing gene–metabolite interaction network models, combining experimental methods such as gene knockout, overexpression, and metabolite intervention, and thus provide new molecular targets for the treatment of C. irritans.

6. Limitations

Firstly, the experimental design centered on a comparison between susceptible and resistant groups following infection and did not incorporate an uninfected control group. The inclusion of such a control in subsequent research would be essential to differentiate pathogen-specific molecular responses from nonspecific physiological alterations resulting from stress or handling procedures. Additionally, although the sample size (n = 10 per group) was rationalized by the rigorous selection of extreme phenotypes and reinforced by multi-tiered omics validation, it may nevertheless constrain the broader applicability of certain results. Future investigations employing independent, larger cohorts are warranted to corroborate these findings.

Author Contributions

Conceptualization, B.L., H.-Y.G. and D.-C.Z.; Formal analysis, B.L., B.-S.L. and D.-C.Z.; Methodology, B.L., H.-Y.G. and T.-F.Z.; Resources, B.-S.L., J.-W.Y., H.-Y.G., N.Z., L.X. and K.-C.Z.; Writing—original draft, B.L.; Writing—review and editing, D.-C.Z. All authors have read and agreed to the published version of the manuscript.

Funding

This study was supported by the earmarked fund for the National Key Research and Development Program of China (2022YFD2400505), Seed Industry Revitalization Project of Special Fund for Rural Revitalization Strategy in Guangdong Province (2024SPY02002), Innovational Fund for Scientific and Technological Personnel of Hainan Province (KJRC2023B15), the CARS-47, and Central Public Interest Scientific Institution Basal Research Fund, CAFS (NO. 2023TD33).

Institutional Review Board Statement

All experiments in this study were approved by the Animal Care and Use Committee of South China Sea Fisheries Research Institute, Chinese Academy of Fishery Sciences, and performed according to the regulations and guidelines established by this committee (approval code: no. SCSFRI96-253 and approval date: 14 August 2023).

Data Availability Statement

The transcriptome data in this study can be found in NCBI (the National Center for Biotechnology Information), BioProject ID PRJNA1292353. The metabolomic data in this study can be found in NGDC (the National Genomics Data Center), BioProject ID PRJCA043265.

Conflicts of Interest

There are no conflicts of interest.

References

  1. Liu, B.; Guo, H.Y.; Liu, B.S.; Liu, B.S.; Zhang, N.; Yang, J.W.; Guo, L.; Jiang, S.G.; Zhang, D.C. Starvation and refeeding influence the growth, biochemical index, intestinal microbiota, and transcriptomic profiles of golden pompano Trachinotus ovatus (Linnaeus 1758). Front. Mar. Sci. 2022, 9, 998190. [Google Scholar] [CrossRef]
  2. Liu, B.S.; San, L.Z.; Guo, H.Y.; Zhu, K.C.; Zhang, N.; Yang, J.W.; Liu, B.; Hou, J.L.; Zhang, D.C. Transcriptomic Analysis Reveals Functional Interaction of mRNA-lncRNA-miRNA in Trachinotus ovatus Infected by Cryptocaryon irritans. Int. J. Mol. Sci. 2023, 24, 15886. [Google Scholar] [CrossRef] [PubMed]
  3. Li, Z.; Jiang, B.; Zhong, Z.; Cao, J.; Li, H.; Wang, C.; Li, A. Skin transcriptomic analysis and immune-related gene expression of golden pompano (Trachinotus ovatus) after Amyloodinium ocellatum infection. Fish Shellfish. Immunol. 2022, 128, 188–195. [Google Scholar] [CrossRef] [PubMed]
  4. Bushra; Maha, I.F.; Xie, X.; Yin, F. Integration of transcriptomic and metabolomic profiling of encystation in Cryptocaryon irritans regulated by rapamycin. Vet. Parasitol. 2023, 314, 109868. [Google Scholar] [CrossRef]
  5. Chi, Y.; Mukiibi, R.; Zhang, H.; Zhang, H.; Li, W.; Robledo, D.; Chen, S.; Li, Y. Transcriptome Analysis Reveals the Immunosuppression in Tiger Pufferfish (Takifugu rubripes) under Cryptocaryon irritans Infection. Animals 2024, 14, 2058. [Google Scholar] [CrossRef]
  6. Wang, P.; Wang, J.; Su, Y.Q.; Mao, Y.; Zhang, J.S.; Wu, C.W.; Ke, Q.Z.; Han, K.H.; Zheng, W.Q.; Xu, N.D. Transcriptome analysis of the Larimichthys crocea liver in response to Cryptocaryon irritans. Fish Shellfish. Immunol. 2016, 48, 1–11. [Google Scholar] [CrossRef]
  7. Hu, Y.; Li, A.; Xu, Y.; Jiang, B.; Lu, G.; Luo, X. Transcriptomic variation of locally-infected skin of Epinephelus coioides reveals the mucosal immune mechanism against Cryptocaryon irritans. Fish Shellfish. Immunol. 2017, 66, 398–410. [Google Scholar] [CrossRef]
  8. Jiang, B.; Du, J.J.; Li, Y.W.; Ma, P.; Hu, Y.Z.; Li, A.X. Transcriptome analysis provides insights into molecular immune mechanisms of rabbitfish, Siganus oramin against Cryptocaryon irritans infection. Fish Shellfish. Immunol. 2019, 88, 111–116. [Google Scholar] [CrossRef]
  9. Chen, X.H.; Liu, S.R.; Peng, B.; Li, D.; Cheng, Z.X.; Zhu, J.X.; Zhang, S.; Peng, Y.M.; Li, H.; Zhang, T.T.; et al. Exogenous l-Valine Promotes Phagocytosis to Kill Multidrug-Resistant Bacterial Pathogens. Front. Immunol. 2017, 8, 207. [Google Scholar] [CrossRef]
  10. Cheng, J.; Lan, W.; Zheng, G.; Gao, X. Metabolomics: A High-Throughput Platform for Metabolite Profile Exploration. Methods Mol. Biol. 2018, 1754, 265–292. [Google Scholar] [CrossRef]
  11. Reverter, M.; Sasal, P.; Banaigs, B.; Lecchini, D.; Lecellier, G.; Tapissier-Bontemps, N. Fish mucus metabolome reveals fish life-history traits. Coral Reefs 2017, 36, 463–475. [Google Scholar] [CrossRef]
  12. Peng, B.; Li, H.; Peng, X.X. Functional metabolomics: From biomarker discovery to metabolome reprogramming. Protein Cell 2015, 6, 628–637. [Google Scholar] [CrossRef]
  13. Zhang, J.; Shen, H.; Xu, W.; Xia, Y.; Barr, D.B.; Mu, X.; Wang, X.; Liu, L.; Huang, Q.; Tian, M. Urinary metabolomics revealed arsenic internal dose related metabolic alterations: A proof-of-concept study in a Chinese male cohort. Environ. Sci. Technol. 2014, 48, 12265–12274. [Google Scholar] [CrossRef]
  14. Buchmann, K.; Lindenstrom, T. Interactions between monogenean parasites and their fish hosts. Int. J. Parasitol. 2002, 32, 309–319. [Google Scholar] [CrossRef] [PubMed]
  15. Maha, I.F.; Xie, X.; Zhou, S.; Yu, Y.; Liu, X.; Zahid, A.; Lei, Y.; Ma, R.; Yin, F.; Qian, D. Skin metabolome reveals immune responses in yellow drum Nibea albiflora to Cryptocaryon irritans infection. Fish Shellfish. Immunol. 2019, 94, 661–674. [Google Scholar] [CrossRef] [PubMed]
  16. Xie, X.; Kong, J.D.; Huang, J.S.; Zhou, Y.; Jiang, Y.; Miao, R.; Yin, F. Integration of metabolomic and transcriptomic analyses to characterize the influence of the gill metabolism of Nibea albiflora on the response to Cryptocaryon irritans infection. Vet. Parasitol. 2021, 298, 109533. [Google Scholar] [CrossRef]
  17. Dan, X.; Li, A.; Lin, X.; Teng, N.; Zhu, X.Q. A standardized method to propagate Cryptocaryon irritans on a susceptible host pompano Trachinotus ovatus. Aquaculture 2006, 258, 127–133. [Google Scholar] [CrossRef]
  18. Livak, K.J.; Schmittgen, T.D. Analysis of relative gene expression data using real-time quantitative PCR and the 2 (-Delta Delta C(T)) Method. Methods 2001, 25, 402–408. [Google Scholar] [CrossRef]
  19. Yang, Q.; Guo, L.; Liu, B.S.; Guo, H.Y.; Zhu, K.C.; Zhang, N.; Jiang, S.G.; Zhang, D.C. Effects of stocking density on the growth performance, serum biochemistry, muscle composition and HSP70 gene expression of juvenile golden pompano Trachinotus ovatus (Linnaeus, 1758). Aquaculture 2020, 518, 734841. [Google Scholar] [CrossRef]
  20. Liu, B.; Liu, G.D.; Guo, H.Y.; Zhu, K.C.; Guo, L.; Zhang, N.; Liu, B.S.; Jiang, S.G.; Zhang, D.C. Characterization and functional analysis of liver-expressed antimicrobial peptide-2 (LEAP-2) from golden pompano Trachinotus ovatus (Linnaeus 1758). Fish Shellfish. Immunol. 2021, 104, 419–430. [Google Scholar] [CrossRef] [PubMed]
  21. Liu, M.J.; Guo, H.Y.; Liu, B.; Zhu, K.C.; Guo, L.; Liu, B.S.; Zhang, N.; Yang, J.W.; Jiang, S.G.; Zhang, D.C. Gill oxidative damage caused by acute ammonia stress was reduced through the HIF-1α/NF-κb signaling pathway in golden pompano (Trachinotus ovatus). Ecotoxicol. Environ. Saf. 2022, 222, 112504. [Google Scholar] [CrossRef] [PubMed]
  22. Sun, Y.; Cao, Z.; Zhang, P.; Wei, C.; Li, J.; Wu, Y.; Zhou, Y. IFN regulatory factor 3 of golden pompano and its NLS domain are involved in antibacterial innate immunity and regulate the expression of type I interferon (IFNa3). Front. Immunol. 2023, 14, 1128196. [Google Scholar] [CrossRef]
  23. Liu, J.; Zhu, K.C.; Pan, J.M.; Guo, H.Y.; Liu, B.S.; Zhang, N.; Yang, J.W.; Zhang, D.C. Characterization of the MMP9 Gene and Its Association with Cryptocaryon irritans Resistance Traits in Trachinotus ovatus (Linnaeus, 1758). Genes 2023, 14, 475. [Google Scholar] [CrossRef]
  24. Bai, Y.; Wang, M.; Zhao, J.; Bai, H.; Zhang, X.; Wang, J.; Ke, Q.; Qu, A.; Pu, F.; Zheng, W.; et al. Comparative transcriptome analysis reveals immunoregulation mechanism of lncRNA-mRNA in gill and skin of large yellow croaker (Larimichthys crocea) in response to Cryptocaryon irritans infection. BMC Genom. 2022, 23, 206. [Google Scholar] [CrossRef]
  25. Kong, S.; Ke, Q.; Chen, L.; Zhou, Z.; Pu, F.; Zhao, J.; Bai, H.; Peng, W.; Xu, P. Constructing a High-Density Genetic Linkage Map for Large Yellow Croaker (Larimichthys crocea) and Mapping Resistance Trait Against Ciliate Parasite Cryptocaryon irritans. Mar. Biotechnol. 2019, 21, 262–275. [Google Scholar] [CrossRef] [PubMed]
  26. Li, Y.Z.; Fraslin, C.; Chi, Y.; Mukiibi, R.; Hu, Y.; Wang, J.; Li, W.; Li, W.; Houston, R.S.; Robledo, D.; et al. A newly developed 20 K SNP array reveals QTLs for disease resistance to Cryptocaryon irritans in tiger pufferfish (Takifugu rubripes). Aquaculture 2025, 595, 741652. [Google Scholar] [CrossRef]
  27. Wang, J.; Zhao, J.; Tong, B.; Ke, Q.; Bai, Y.; Gong, J.; Zeng, J.; Deng, Y.; Lan, B.; Zhou, T.; et al. Effects of artificial mating on genomic selection of resistance against Cryptocaryon irritans in large yellow croaker. Aquaculture 2022, 561, 738617. [Google Scholar] [CrossRef]
  28. Zhao, J.; Bai, H.; Ke, Q.; Li, B.; Zhou, Z.; Wang, H.; Chen, B.; Pu, F.; Zhou, T.; Xu, P. Genomic selection for parasitic ciliate Cryptocaryon irritans resistance in large yellow croaker. Aquaculture 2021, 531, 735786. [Google Scholar] [CrossRef]
  29. Wu, H.; Lai, X.; Guo, W.; Li, X.; Hu, Y.; Dan, X.; Li, Y.; Mo, Z. Manganese improved Trachinotus ovatus immune against Cryptocaryon irritans infection. Aquaculture 2023, 576, 739835. [Google Scholar] [CrossRef]
  30. Jiang, Z.; Zhao, J.; Li, R.; Ke, Q.; Wang, J.; Li, Y.; Hu, S.; Zeng, J.; Pu, F.; Li, N.; et al. Immune regulation differences in Large yellow croaker with varied resistance to Cryptocaryon irritans infection. Fish Shellfish. Immunol. 2025, 158, 110159. [Google Scholar] [CrossRef]
  31. Han, Q.; Mo, Z.; Lai, X.; Guo, W.; Hu, Y.; Chen, H.; He, Z.; Dan, X.; Li, Y. Mucosal immunoglobulin response in Epinephelus coioides after Cryptocaryon irritans infection. Fish Shellfish. Immunol. 2022, 128, 436–446. [Google Scholar] [CrossRef]
  32. Jiang, S.; Huang, X.; Li, T.; Zhang, Y.; Zhang, J. Immune response of large yellow croaker Larimichthys crocea towards a recombinant vaccine candidate targeting the parasitic ciliate Cryptocaryon irritans. Aquac. Int. 2023, 31, 3383–3402. [Google Scholar] [CrossRef]
  33. Huang, K.; Jiang, L.; Huang, W.; Li, X.; Yuan, L.; Jiang, J.; Zhou, S.; Wang, Y.; Xie, J. Investigating the interplay between Cryptocaryon irritans ectoparasite infection and the immune responses of the head kidney in silver pomfret (Pampus argenteus). Aquaculture 2023, 575, 739780. [Google Scholar] [CrossRef]
  34. Mo, Z.Q.; Wu, H.C.; Hu, Y.T.; Lu, Z.J.; Lai, X.L.; Chen, H.P.; He, Z.C.; Luo, X.C.; Li, Y.W.; Dan, X.M. Transcriptomic analysis reveals innate immune mechanisms of an underlying parasite-resistant grouper hybrid (Epinephelus fuscogutatus × Epinephelus lanceolatus). Fish Shellfish. Immunol. 2021, 119, 67–75. [Google Scholar] [CrossRef] [PubMed]
  35. Zhou, X.; Li, J.J.; Li, S.; Liu, H.H.; Xu, D.D.; Chi, C.F.; Zheng, L.B. Transcriptomic analysis of large yellow croaker (Larimichthys crocea) reveals the suppression of the inflammatory response from Cryptocaryon irritans infection. Fish Shellfish. Immunol. 2024, 144, 109258. [Google Scholar] [CrossRef]
  36. Guo, X.; Huang, W.; Xu, Y.; Zhan, Q.; Sun, P.; Hu, H. Metabolomic changes in Cryptocaryon irritans from Larimichthys crocea after exposure to copper plate. Front. Cell. Infect. Microbiol. 2024, 14, 1424669. [Google Scholar] [CrossRef]
  37. Sun, J.L.; Jiang, T.; Gu, Y.; Song, F.B.; Wen, X.; Luo, J. Differential immune and metabolic responses underlie differences in the resistance of Siganus oramin and Trachinotus blochii to Cryptocaryon irritans infection. Fish Shellfish. Immunol. 2022, 120, 166–179. [Google Scholar] [CrossRef]
Figure 1. Volcano map of differential genes between the susceptible group (EST) and resistance group (RST).
Fishes 10 00426 g001
Figure 2. GO function enrichment analysis. (A) The 30 most enriched GO terms in the liver of golden pompano in the susceptible group (EST) and resistance group (RST), BP (biological process), MF (molecular function), and CC (cellular component); (B) GO enrichment analysis in the susceptible group (EST) and resistance group (RST).
Fishes 10 00426 g002
Figure 3. KEGG pathway enrichment analysis. (A) Pathway enrichment of DEGs in the susceptible group (EST) and resistance group (RST); (B) Bubble chart of KEGG pathway enrichment of DEGs in the susceptible group (EST) and resistance group (RST).
Fishes 10 00426 g003
Figure 4. Comparison of gene expression between RNA-seq and quantitative real-time PCR (qRT-PCR) data.
Fishes 10 00426 g004
Figure 5. Data quality control and differential metabolite screening in positive ion mode. (A) QC-sample correlation analysis, principal component analysis (PCA); (B) Principal component analysis (PCA); (C) PLS-DA (score scatter plot with validation plot); (D) Differential metabolite volcano plot.
Fishes 10 00426 g005
Figure 6. Data quality control and differential metabolite screening in negative ion mode. (A) QC-sample correlation analysis, principal component analysis (PCA); (B) Principal component analysis (PCA); (C) PLS-DA (score scatter plot with validation plot); (D) Differential metabolite volcano plot.
Fishes 10 00426 g006
Figure 7. Metabolite pathway and classification annotations, and differential metabolite analysis in positive ion mode. (A) KEGG pathway annotation; (B) LIPID MAPS classification annotation; (C) KEGG enrichment bubble plot; (D) Correlation analysis of differential metabolites.
Fishes 10 00426 g007
Figure 8. Metabolite pathway and classification annotations, and differential metabolite analysis in negative ion mode. (A) KEGG pathway annotation; (B) LIPID MAPS classification annotation; (C) KEGG enrichment bubble plot; (D) Correlation analysis of differential metabolites.
Fishes 10 00426 g008
Figure 9. Combined analysis of transcriptome and metabolome. (A) Correlation heatmap between DMs and DEGs; (B) Mantel test correlation heatmap. Cells represent the Mantel correlation coefficient (*r*) between DMs and DEGs. Significance levels: * p < 0.05, ** p < 0.01, *** p < 0.001. Color scale indicates the strength and direction of correlation (blue: negative, red: positive; scale: −1.0 to 1.0). Diagonal is blank as self-correlations are not meaningful.
Fishes 10 00426 g009
Table 1. Primers used in this study.
Primer NamePrimer Sequences (5′–3′)Reference
HSP70-FTTGAGGAGGCTGCGCACAGCTTGTGYang et al. [19]
HSP70-RACGTCCAGCAGCAGCAGGTCCT
LEAP-2-FAGTGGCGCTGTGCATTGTLiu et al. [20]
LEAP-2-RGTGTGTGGACGCTGTGTTC
IL-1β-FCGGACTCGAACGTGGTCACATTCLiu et al. [21]
IL-1β-RAATATGGAAGGCAACCGTGCTCAG
IRF3-FACAAGAACGAAACCGCTAACCCSun et al. [22]
IRF3-RTCATCAAAGCACGAGACCACC
MMP9-FCACCAGTGAGGGACGAGLiu et al. [23]
MMP9-RGGCTGCCACCAGAAACA
NF-κB-FCGTGAGGTCAGCGAGCCAATGLiu et al. [21]
NF-κB-RATGTGCCGTCTATCTTGTGGAATGG
EF-1α-FCCCCTTGGTCGTTTTGCCLiu et al. [1]
EF-1α-RGCCTTGGTTGTCTTTCCGCTA
Table 2. Statistics of transcriptome data.
GroupLibraryRaw ReadsClean ReadsClean BasesQ20 (%)Q30 (%)G + C (%)
EST_1FRAS230314133-1r50,202,7627.53G45,489,7666.82G98.0796.36
EST_2FRAS230314134-1r48,618,6567.29G44,361,8926.65G98.196.5
EST_3FRAS230314135-1r48,861,6987.33G48,730,2907.31G98.1196.54
EST_4FRAS230314136-1r46,984,6227.05G44,201,4206.63G98.0496.42
EST_5FRAS230314137-1r47,799,1787.17G44,371,4906.66G98.196.5
EST_6FRAS230314138-1r46,545,8826.98G43,242,5266.49G97.9396.12
EST_7FRAS230314139-1r49,982,3847.5G45,714,8086.86G97.9796.22
EST_8FRAS230314140-1r53,002,7667.95G48,986,0107.35G97.9696.23
EST_9FRAS230314141-1r46,084,4206.91G43,220,5766.48G97.9896.26
EST_10FRAS230314142-1r49,690,0147.45G46,634,7507.0G98.0296.32
RST_1FRAS230314143-1r48,088,7567.21G45,985,8586.9G97.9896.23
RST_2FRAS230314144-1r49,700,1127.46G46,766,7547.02G98.1296.53
RST_3FRAS230314145-1r47,244,2407.09G44,333,4166.65G98.1496.54
RST_4FRAS230314146-1r47,768,8587.17G43,853,0006.58G98.1396.54
RST_5FRAS230314147-1r46,331,6466.95G46,199,8346.93G98.0596.39
RST_6FRAS230314148-1r47,009,3627.05G43,610,8106.54G98.0196.34
RST_7FRAS230314149-1r46,743,6607.01G43,711,2946.56G97.9696.19
RST_8FRAS230314150-1r47,852,9087.18G44,328,6946.65G98.0196.33
RST_9FRAS230314151-1r47,766,4147.16G44,969,7286.75G98.0596.4
RST_10FRAS230314152-1r48,105,0807.22G45,513,2446.83G97.9996.22
Disclaimer/Publisher’s Note: The statements, opinions and data contained in all publications are solely those of the individual author(s) and contributor(s) and not of MDPI and/or the editor(s). MDPI and/or the editor(s) disclaim responsibility for any injury to people or property resulting from any ideas, methods, instructions or products referred to in the content.