Article

Comparative Physiological Profiling of Abalone (Haliotis iris): Insights from Wild and Aquaculture Broodstock

1
School of Science, Auckland University of Technology, Private Bag 92006, Auckland 1142, New Zealand
2
Biomedical and Molecular Metabolism Research, Faculty of Natural and Agricultural Science, North-West University, Private Bag 1290, Potchefstroom 2520, South Africa
3
Temasek Life Sciences Laboratory, 1 Research Link, National University of Singapore, Singapore 117604, Singapore
4
Cawthron Institute, Nelson 7042, New Zealand
5
Department of Animal Science, Coastal and Marine Sciences Institute, University of California Davis, Davis, CA 95616, USA
*
Authors to whom correspondence should be addressed.
Fishes 2025, 10(11), 566; https://doi.org/10.3390/fishes10110566
Submission received: 29 September 2025 / Revised: 22 October 2025 / Accepted: 28 October 2025 / Published: 5 November 2025
(This article belongs to the Section Physiology and Biochemistry)

Abstract

New Zealand abalone (Haliotis iris) holds ecological, economic, and cultural value, with wild stocks supporting fisheries and an emerging aquaculture industry. Wild-caught adult abalone are often used as broodstock, but captivity can affect spawning and offspring quality. This study is the first to profile wild and farmed H. iris broodstock using histology, proximate composition, microbiome, and metabolomics analyses. Histology showed higher gonadal abnormalities in farmed abalone, while wild abalone exhibited increased ciliates in their gills, indicating richer marine–microorganism interactions. Microbiome analyses revealed a higher microbial richness and diversity in the buccal cavity of wild abalone. The core microbiota phyla across both groups included Proteobacteria, Bacteroidota, Campylobacterota, Fusobacteria, and Firmicutes. Proximate analyses showed higher muscle protein in farmed abalone, while gonadal tissue partitioned by sex showed higher fat in females and higher protein in males. Metabolomics revealed altered amino acid metabolism in the adductor muscle, carboxylic acid metabolism in the gonad, and fatty acid metabolism in the foot. This investigation expands our understanding of the physiological and microbial differences between wild and farmed abalone, showing altered gonad and muscle conditions from prolonged captivity and highlighting the need for greater microbial diversity in cultured stocks.
Key Contribution: This study provides the first integrated assessment of wild and farmed Haliotis iris broodstock, revealing how captivity alters gonad, muscle, and microbial profiles, offering guidance to enhance aquaculture broodstock conditions.

1. Introduction

Abalone are some of the most highly valued commodities in global fisheries and one of the most commercially prized farmed molluscs worldwide [1]. New Zealand recognises four native abalone species, including Haliotis iris, H. australis, H. virginea, and the newly described H. pirimoana [2,3]. In New Zealand, abalone play a pivotal role in both commercial and recreational fishing industries and hold significant cultural importance [4]. Key abalone fishing regions, supporting wild harvest production in New Zealand, include the Wairarapa coast, the Kaikoura coast, the Chatham Islands, Fiordland, Marlborough, and Stewart Island [5]. These regions are outlined on the Fisheries New Zealand website https://fs.fish.govt.nz/Page.aspx?pk=7&tk=100&sc=PAU (accessed on 20 October 2025). The commercial abalone fishery in New Zealand (based predominantly on H. iris but also including H. australis) is managed under the quota management system, implemented through the 1996 Fisheries Act, with Total Allowable Commercial Catch (TACC) limits established for each Quota Management Area [6]. Small scale aquaculture operations in New Zealand are distributed from Ruakākā, in Northland (35.8754° S, 174.4550° E), to Bluff, in Southland (46.5973° S, 168.3302° E). Abalone are largely exported as live animals, or as frozen, chilled, vacuum-packed, or canned products [7]. Furthermore, the colourful abalone shell is often used to make jewellery or as decorative material [8].
Global abalone production from wild fisheries has declined, while aquaculture-based production has increased markedly. Between the 1970s and 2020, the reported legal abalone harvests from regulated fisheries have declined from approximately 20,000 to 4500 metric tonnes. Several reasons have been attributed to this decline, including over-exploitation, illegal harvesting, climate change, and habitat deterioration [9]. Currently, abalone from aquaculture production account for over 95% of the total abalone supply worldwide [10], yielding approximately 243,506 metric tonnes per year, valued at around USD 780 million in 2017 [9,11]. New Zealand is placed in a unique position where it still maintains a viable wild harvest abalone fishery [12], with prospects of growing abalone aquaculture into an industry that contributes to the New Zealand seafood sector [13].
Interests in wild abalone for aquaculture purposes are well established, mainly as broodstock to ensure sufficient genetic diversity. For example, microsatellite markers compared the genetic variation in farmed and wild abalone (H. rubra and H. midae) and found that cultured stocks showed a decline in genetic diversity [14]. Also, in H. discus hannai, hatchery strains showed less genetic variation compared to wild abalone populations [15]. In scallops, cultured stocks showed higher polyunsaturated fatty acids compared to the wild counterparts, suggesting greater potential health benefits when consumed by humans [16]. In oysters, although growth capacity was similar between wild and farmed individuals, aquaculture oysters exhibited a reduced oxygen demand compared to their wild counterparts, suggesting an enhanced resilience to environmental stressors [17]. Considering the status of New Zealand abalone, with both wild and aquaculture (small scale) industries, insight into the physiological condition of farmed and wild broodstock remains limited. Such research can help pinpoint similarities or differences that can be used to support abalone aquaculture developments.
The application of biomarkers as indicators of broodstock dynamics, condition, and overall health has been widely established [18,19,20]. Biomarkers are measurable biochemical or tissue changes that reflect disruptions in normal physiological processes [21], and can be used to understand the relationships between organisms and their environment [22]. Moreover, biomarkers are molecules that reveal key aspects of life history traits [23]. Advanced omics technologies, including genomics, transcriptomics, proteomics, and metabolomics, offer comprehensive insights into the physiological status of living organisms, providing responses that support the collection and subsequent validation of biomarkers [24]. Biomarker applications to abalone research have expanded considerably in recent years [25]. For example, the investigation of metabolite profiles (metabolomics) enables a physiological snapshot of a living cell, making it possible to identify the differences between cells, tissues, organs, or organisms [26]. Moreover, by assessing the physiological responses of animals, it becomes possible to obtain insight into the eco-physiological effects on organisms in response to stressful conditions [27]. Techniques such as histopathology enable disease investigations and the characterisation of changes in tissue structure and condition [28]. When studying digestive-tract-associated microbiota, examining nutrient uptake, mucosal development, and overall host well-being can yield valuable insights into underlying physiological processes [29]. Proximate composition analysis can be used to estimate the quantities of certain compounds, such as moisture, protein, fat, fibre, and ash in tissues and organisms [30]. Analyses of proximate composition have been widely utilised to determine the availability of the essential biochemical compounds critical for gametogenesis and the regulation of reproductive processes [31]. Ultimately, baseline data (in the form of biomarkers) targeting animal physiology are essential for assessing animal conditions considering various physiological, reproductive, and life history characteristics [32,33].
The aim of the present study is to profile the physiological condition of H. iris broodstock sampled from the wild and an aquaculture facility. Four objectives are applied, including (1) histological assessments, (2) proximate analyses, (3) microbiome analyses, and (4) gas chromatography–mass spectrometry (GC-MS) metabolomic analyses, as methods to research the aim. By investigating the physiological status of farmed and wild abalone broodstock, we hope to advance our understanding of the characteristics that underpin abalone conditions in a natural environment and determine whether farmed broodstock require enhancement to support long-term commercial practices.

2. Materials and Methods

2.1. Experimental Design and Sampling

Abalone (n = 10) were collected via commercial divers from Steward Island, New Zealand (September 2023), and housed in a flow-through system for two days until processing. A further 10 abalone broodstock, sourced from the same natural population, but subsequently housed at The New Zealand Abalone Company Ltd. (Bluff, New Zealand) for the last five years, were selected for comparative purposes for this study. Prior to dissections, abalone were weighed to the nearest 0.01 g, and the shell lengths were measured to the nearest 0.10 mm along the longest axis. Abalone were shucked, dissected, and sexed macroscopically based on gonad colouration to enable sex comparisons (females = green; males = white). Firstly, the buccal cavity (containing an odontophore, radula, connecting tissue, and food/sediment debris) was isolated and placed into a 2 mL cryo-vial containing 200 µL of RNAprotect (Qiagen, Auckland, New Zealand) tissue reagent, followed by snap-freezing in dry ice for microbiome analysis. Secondly, two 5 mm tissue steaks were collected containing (1) the oesophagus, mantle, left gill, right gill, gastrointestinal tract, kidneys, and rectum and (2) the gonad and digestive gland [34]. They were placed into separate histological cassettes and transferred to a container with 4% buffered formalin solution for 48 h, before being transferred into 70% ethanol until further standard histology processing (Section 2.2) [35]. Thirdly, subsections of adductor muscle, foot muscle, and gonad tissue were dissected into 2 mL cryo-vials and snap-frozen in dry ice and stored at −80 °C until later metabolomics analyses. Finally, the remaining mantle and associated organs were removed to ensure a clean adductor muscle, foot muscle, and gonad tissue, which were placed into separate zip-lock bags and snap-frozen using dry ice for later proximate analyses (Figure 1).

2.2. Histopathology

Histological samples were processed through commercial services (Awanui Veterinary, Christchurch, New Zealand). A range of tissues, including the midgut, digestive gland, gills, gonad, kidneys, hypobranchial gland, nervous tissue, and muscle, were examined under a compound light microscope (Olympus BX402, Tokyo, Japan) at magnifications from ×40 to ×1000, following the criteria of Copedo et al. [36]. No signs of pathogens, parasites, or disease were detected in the studied populations. Semi-quantitative scales were devised and used to grade deviations from normality for the oocytes, digestive glands, and gills (as only these showed differences between experimental groups), as explained below.
Normal and atretic oocytes from wild and farmed groups were randomly counted (in triplicates) across histological slides. Healthy and degenerating oocytes were classified based on morphological characteristics following criteria as previously published [34]; normal oocytes appeared viable and in various stages of development, while atretic oocytes showed signs of degeneration, including cytoplasmic discoloration, necrotic-like darker staining, irregular shape, or separation from the surrounding membrane [37]. The digestive gland of each individual was scored semi-quantitatively based on alterations in the digestive gland tubules. A scoring system was used to differentiate digestive gland quality as follows: Good (score of 1)—tissue appeared normal or with minimal alterations; Fair (score of 2)—tissue showed moderate alterations affecting up to 50% or half of the tissue; and Poor (score of 3)—tissue alterations were severe or widespread alterations involving most of the tissue [36]. The total number of ciliates on gill filaments were counted quantitatively (five replicates per individual) for each individual in both farmed and wild broodstock groups and averaged.

2.3. Microbiome Processing

Samples for microbiome analysis were processed through the default 16S ribosomal RNA (rRNA) amplicon library preparation workflow at Auckland University of Technology. Briefly, genomic DNA (gDNA) of all samples was extracted with the DNeasy PowerSoil Pro Kit (Qiagen, Hilden, Germany, Category No. 12888-100) and quantified with a QubitTM dsDNA HS Assay Kit. The gDNA was normalised to 4 ng/μL with molecular grade nuclease-free water and amplified through polymerase chain reactions (PCRs) with a 16S rRNA (V3–V4 regions of the gene) marker (forward: 5′-CCTACGGGNGGCWGCAGG-3′; reverse: 5′-GACTACHVGGGTATCTAATCC-3′) in triplicate. The total volume of each PCR reaction was 25 µL, containing 12.5 µL of KAPA2G Robust HotStart ReadyMix polymerase mixture with dye (KAPA Biosystems Inc., Woburn, MA, USA), 1 µL of each of the forward and reverse primers [10 µM], 8.5 µL of PCR-grade nuclease-free water, and 2 µL of each normalised gDNA template. Thermal conditions for the first-round PCR amplification were 94 °C for 3 min followed by 35 cycles of 94 °C for 45 s, 60 °C for 60 s, 72 °C for 90 s, and a final extension period of 10 min at 72 °C. Next, the PCR products in triplicate were pooled by sample, purified with a customised bead solution, and normalised to 4 ng/μL for a barcoding PCR amplification with Illumina indexed primers. The reagent master mix for each indexing PCR was 25 µL, containing 12.5 µL of the same KAPA enzyme reagent, 1.5 µL of each of the forward and reverse Illumina-adapted indexing primers (10 µM), 7.5 µL of PCR-grade nuclease-free water, and 2 µL of the purified 16S rRNA first-round PCR product. Thermal conditions for the indexing PCR amplification were 94 °C for 3 min followed by eight cycles of 94 °C for 60 s, 55 °C for 60 s, 72 °C for 90 s, and a final extension period of 10 min at 72 °C. The indexed PCR product was pooled, purified with the same customised bead solution, and normalised to 10 nM. Next, 5 µL of each indexed, normalised PCR sample, along with the gDNA extraction and PCR negative controls, were mixed into one microcentrifuge tube for library quantification via the Qubit assays and the Bioanalyzer High Sensitivity DNA Kit (Agilent Technologies, Inc., Santa Clara, CA, USA, Catalogue No. 5067-4626). Finally, the quality-controlled sample libraries were sequenced on an Illumina MiSeq platform using the V3 (600-cycle) sequencing kits (Illumina Inc., San Diego, CA, USA, Catalogue No. MS-102-3003) [38].

2.4. Proximate Analyses

Proximate composition analyses, including crude protein, fat, crude fibre, moisture, and ash, were conducted on abalone adductor muscle, foot muscle, and gonad tissues. Abalone tissues were weighed and freeze-dried (Christ Alpha series freeze dryer, John Morris Scientific Ltd., Auckland, New Zealand) for 48 h, and moisture was calculated as the weight difference. After moisture determination, dried abalone samples were ground to a fine powder and weighed into subsections, which were then used for protein (0.3 g), fat (1 g), fibre (1 g), and ash (0.3 g) determinations. Crude protein content was determined by the Dumas combustion method, determining nitrogen via combustion, oxidation, and further reduction in an oxygen atmosphere (AOAC International methods 992.23 and 990.03). Fat was determined by using the Mojonnier method (AOAC 954.02). Crude fibre was determined using the gravimetric method (AOAC 962.09 and 978.10). Ash was determined through incineration in a muffle furnace at 550 °C for 12 h [39].

2.5. Metabolomics

Samples were processed for metabolomics analyses separately for each tissue type. Adductor muscle, foot muscle, and gonad tissues were ground into a homogeneous powder while working on dry ice using a mortar and pestle, whereafter the tissues were freeze-dried overnight. A dry weight of 10 mg per tissue per individual sample was used for metabolomic analyses. All tissue samples were co-extracted with 20 µL of internal standard (10 mM L-alanine-2,3,3,3-d4 prepared in water). A two-step methanol: water metabolite extraction method was performed, followed by methyl chloroformate (MCF) alkylation, as previously described [40]. The MCF derivatives were transferred to GC vials and analysed using an Agilent GC7890B gas chromatograph and autosampler coupled to an MSD5977A (Agilent Technologies, Santa Clara, CA, USA) with a quadrupole mass selective detector (EI) operated at 70 eV [41]. Samples (1 µL) were injected under pulsed splitless mode. The mass spectrometer was operated in scan mode, and the mass range was 38–650 a.m.u. at 1.47 scans/s [42]. Quality control samples were included within the batch, which were injected at regular intervals throughout the analytical run of each batch to condition the analytical platform and evaluate daily instrument variability. Deconvolution of chromatographic data was performed using Agilent MassHunter Unknown Analysis (version 9.00) with the NIST14 library. The compound library was curated using Libracef [43] and exported to a format compatible with MassHunter Quantitative Analysis, which was subsequently used for peak integration. Metabolites were identified with the highest level of confidence [44]. Metabolite peak intensity data were normalised against the internal standard and sample weight to compensate for potential technical variation and represent relative peak abundances [42].

2.6. Statistical Analyses

2.6.1. Morphometrics

Morphometric data were analysed using one-way analysis of variance (ANOVA) when a normal distribution was confirmed with a Shapiro–Wilk test (p > 0.05). Homogeneity of variances was assessed using Levene’s test, and all variables satisfied the assumption of equal variances (p > 0.05). Pairwise comparisons of means were performed using Tukey’s post hoc test to identify significant differences between the groups. All statistical analyses were conducted using R software (version 4.0.3), and results were considered significant at p < 0.05.

2.6.2. Histopathology

For oocyte counts (normal and atretic), statistical analyses were conducted to compare wild and farmed broodstock groups using R software (version 4.0.3). Data normality was assessed using the Shapiro–Wilk test (p < 0.05 was considered significant), and homogeneity of variances was tested with Levene’s test. Normal oocyte counts were found to be normally distributed (Shapiro–Wilk p = 0.071) and met the assumption of equal variances (Levene’s test p = 0.468). Therefore, a t-test was used to compare the means between farmed and wild broodstock. However, atretic oocyte counts did not meet the assumption of normality (Shapiro–Wilk p = 0.009), although variances were equal (p = 0.229). As a result, a Wilcoxon rank-sum test was used instead.
The distribution of digestive gland (DG) quality (good, fair, poor) was assessed for each individual in both groups (farmed and wild broodstock) across sexes (male and female). To compare the DG quality between groups and sexes, an ordinal logistic regression model was applied using the polr function from the MASS package in R. The ordinal response variable was DG quality, with the independent variables being group (farmed vs. wild broodstock) and sex (male vs. female). Post hoc pairwise comparisons between the groups and sexes were performed using estimated marginal means (EMMs), with Tukey’s adjustment for multiple comparisons to identify any significant differences in DG quality across levels of group and sex. The results of the pairwise comparisons, including p-values, were used to determine whether any significant differences (p < 0.05) existed between the groups and sexes. To compare the total number of ciliates between the different groups, the Kruskal–Wallis test was applied due to the non-parametric nature of the data. In addition, two-way analysis of variance (ANOVA) was conducted to assess the effects of group (farmed vs. wild broodstock) and sex (male vs. female) on ciliate counts. Tukey’s Honest Significant Difference (HSD) test was used for pairwise comparisons to identify significant interactions between factors. Data visualisation was performed using the ggplot2 package in R, with bar graphs illustrating the distribution and mean values of oocyte counts, digestive gland quality, and quantity of ciliates on the gill in each group.

2.6.3. Microbiome

Illumina sequences were processed through a modified DADA2 data processing pipeline [45] in R (version 4.2.2) to generate 16S rRNA amplicon sequence variants (ASVs), construct an ASV abundance table, and assign taxonomic information to the representative ASVs. Briefly, the 16S rRNA primers were removed from the forward and reverse pair-ended sequences using the “cutadapt” command [46], followed by filtering out erroneous sequences and removing chimaeras. The pair-ended, quality-filtered sequences were merged to form representative ASVs after being dereplicated. Microbial taxonomic information was assigned to the ASVs using the SILVA high-quality ribosomal RNA database (Version 138) [47]. Sequences from the negative control samples and chloroplast ASVs were removed to account for the interference created by the molecular processing and macroalgal artefacts, respectively.
Preliminary microbial comparisons were primarily focused on abalone buccal cavity samples between the wild and farmed broodstocks at the ASV and bacterial phylum levels. Venn diagrams were plotted between the wild and farmed broodstocks and across the five sample types to show the number of shared and unique ASVs using the “vegan” package in R [48]. Relative read abundance in a bar chart was plotted to compare bacterial compositions among the groups at the bacterial phylum level. Chao1 and Shannon’s diversity estimators were calculated at the bacterial phylum level to evaluate microbial diversity within each group (alpha-diversity). To compare between-group bacterial diversity (beta-diversity) among the sample types, the bacterial read abundance data at the bacterial phylum level were normalised by the total sum scaling method and converted to a Bray–Curtis dissimilarity matrix. The beta-diversity comparison among the sample types was revealed on a principal coordinate analysis (PCoA) plot, followed by permutational multivariate analysis of variance (PERMANOVA) tests. Furthermore, a core microbiota heatmap between the wild and farmed broodstocks was generated with the relative abundance threshold and prevalence set to be 0.01% and 20%, respectively. The relative abundance bar chart, alpha-, and beta-diversity statistical analyses and core microbiota heatmaps were all generated and conducted on the MicrobiomeAnalyst portal [49] and in R (version 4.2.2).

2.6.4. Proximate Analyses

For proximate analyses, effects of group (wild and farmed abalone), sex (male and female), and their interaction (group and sex) on crude protein, fat, crude fibre, moisture, and ash were tested using two-way ANOVA. Pairwise comparisons of EMMeans with multiple comparison adjustments (Tukey’s HSD) were used as a post hoc test. Before analysis, all residuals were tested for normality and equal variance using the Shapiro–Wilk (p > 0.05) and Levene’s tests (p > 0.05), respectively. Data that did not meet these assumptions were transformed before statistical analysis using log10, square root, or Tukey’s ladder of powers [50]. Statistical analyses were performed using R software (version 4.0.3) and figures were generated using GraphPad Prism (v.10).

2.6.5. Metabolomics

For metabolomics data, univariate and multivariate analyses were conducted using MetaboAnalyst 6.0 [51]. The data were generalised log (glog)-transformed to alleviate the dependency of the variance on the compound concentrations and subjected to t-tests to determine the metabolic differences per tissue type between farmed and wild abalone (p < 0.05). Abalone sex was considered a confounding factor but showed no significance and was subsequently eliminated as a statistical factor. Principal component analysis (PCA) was used to facilitate the visualisation of the variance in the data. Scatter plots of the PCA scores were plotted with 95% confidence ellipses to indicate groupings more effectively. Clustering as a heatmap (Supplementary Figure S1) was used to visualise metabolic differences based on the significantly different metabolites. Statistically significant metabolites per tissue type, displaying an increase or decrease in metabolite abundance, were plotted within a metabolic map.

3. Results

3.1. Morphometrics

The histological analysis confirmed seven males and three females in the wild population, while the farmed population comprised five males and five females. The wet weights for farmed abalone were 413.55 ± 56.95 g (mean ± STDEV) and 488.41 ± 74.61 g for wild abalone, which were significantly different (p < 0.001). Shell measurements showed no significant differences (Supplementary Table S1). The farmed broodstock had an average shell length, width, and height of 140.90 ± 6.31 mm, 105.00 ± 5.08 mm, and 40.30 ± 7.78 mm, respectively. The wild broodstock had a shell length, width, and height of 142.40 ± 4.97 mm, 101.10 ± 4.33 mm, and 37.00 ± 6.93 mm, respectively.

3.2. Histopathology

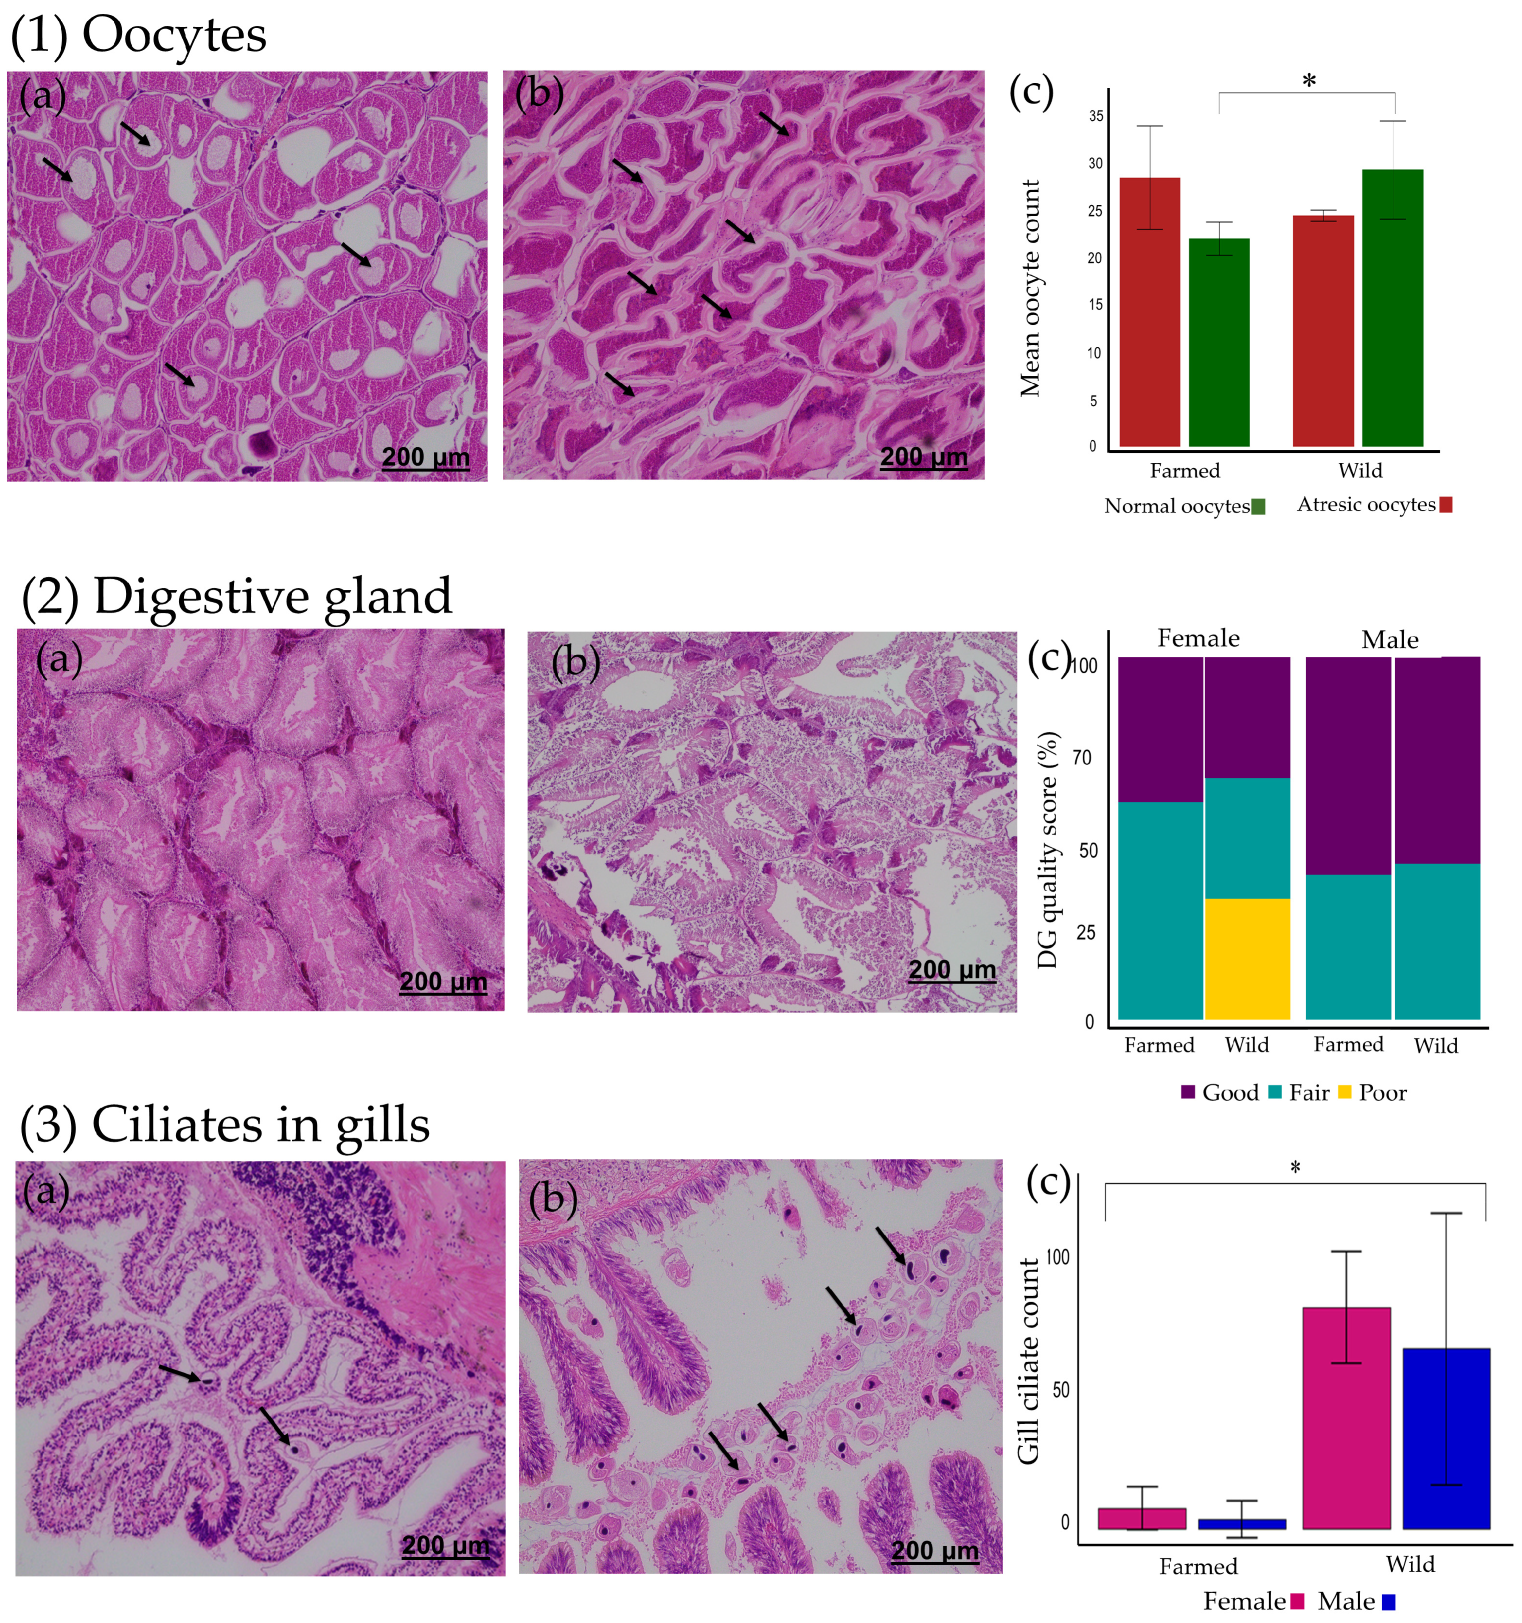
Photomicrographs of normal and atretic oocytes are presented in Figure 2(1a) and Figure 2(1b), respectively. The wild broodstock exhibited significantly higher normal oocyte counts (28.93 ± 5.08) compared to the farmed broodstock (21.76 ± 1.73) (Supplementary Table S2) (F = 9.082, p = 0.0236) (Figure 2(1c)). Photomicrographs illustrating good (Figure 2(2a)) and poor (Figure 2(2b)) quality abalone digestive glands are shown. The digestive gland quality showed no significant differences between farmed and wild broodstock (X2 = 1.111, df = 2, p = 0.574). Similarly, the digestive gland quality did not differ between male and female abalone (p > 0.05) (Figure 2(2c)) (Supplementary Table S3). Photomicrographs illustrate fewer ciliates seen in the farmed broodstock (Figure 2(3a)) compared the higher ciliate count in the wild broodstock (Figure 2(3b)). A significant difference was found in the total number of quantified ciliates between farmed (5.2 ± 7.04) and wild broodstock (68.0 ± 41.13), with the wild broodstock showing higher ciliate counts (p = 0.0002). In contrast, the number of ciliates did not differ between males and females, and there was no interaction between group and sex (p > 0.05) (Figure 2(3c)) (Supplementary Table S4).

3.3. Microbiome

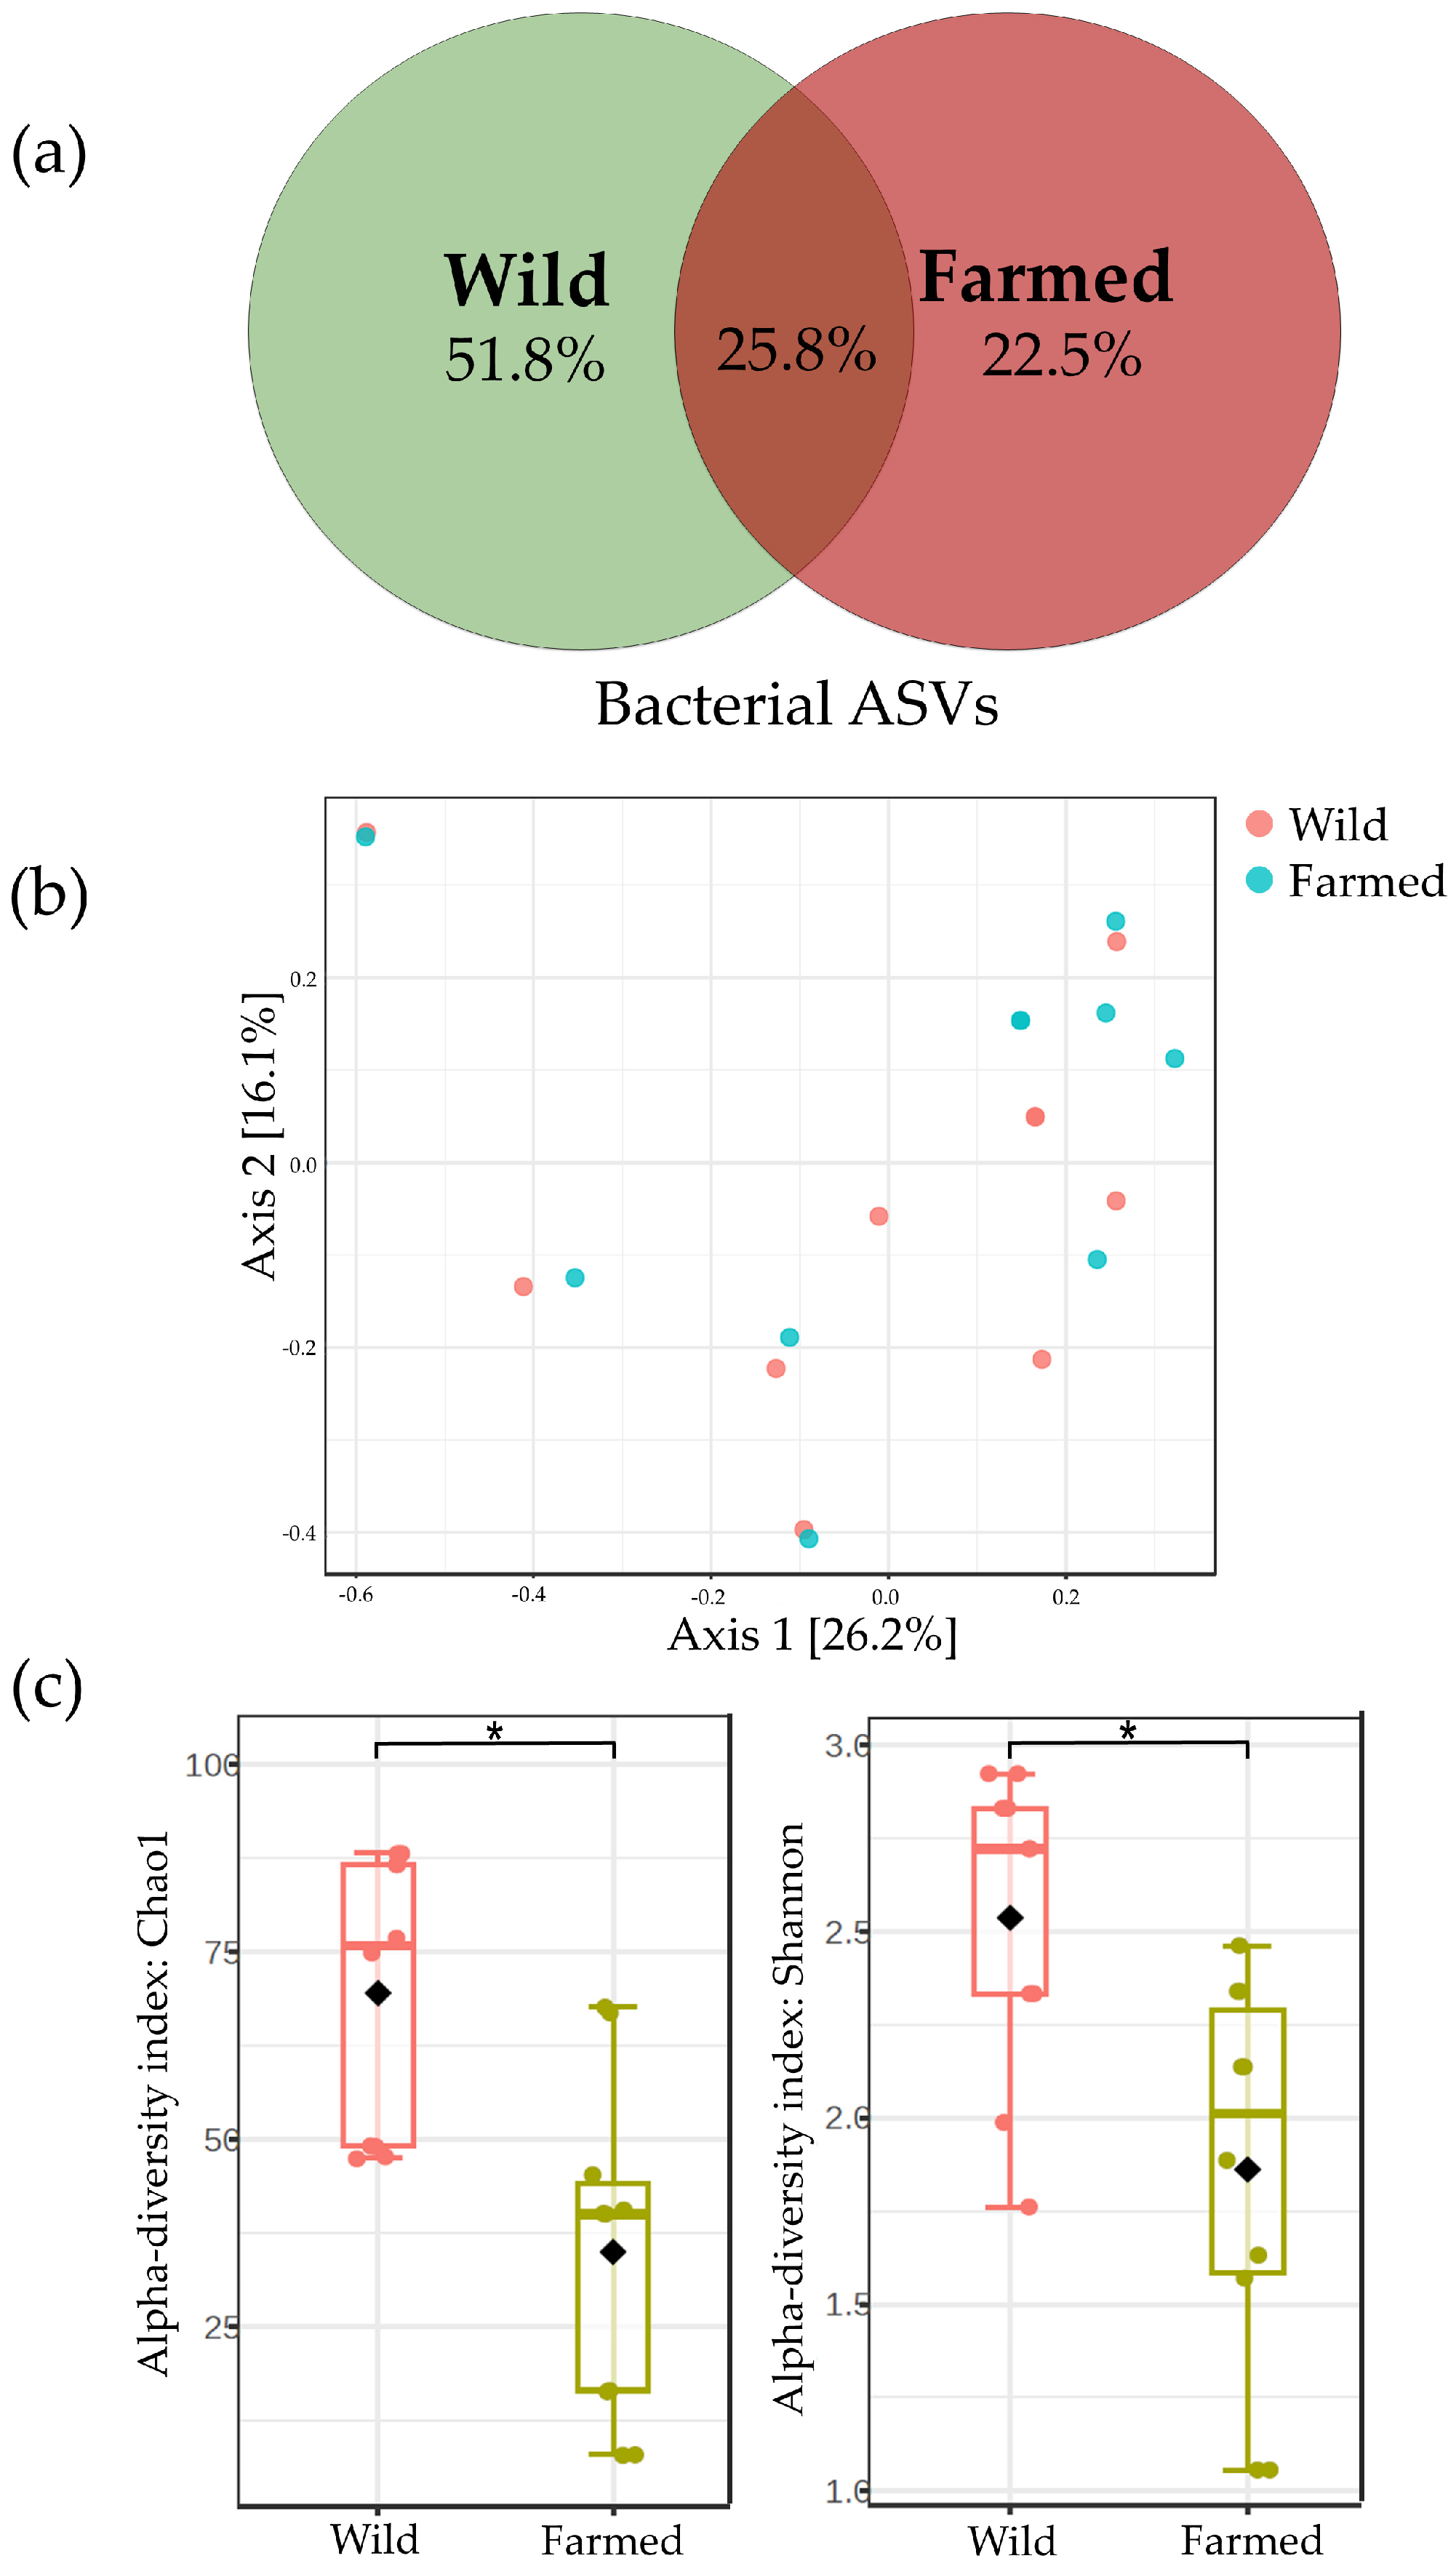
The sequencing results of all abalone samples generated 308,570 sequence reads from the wild abalone population and 316,573 sequence reads from the farmed population. Moreover, 1035 and 644 amplicon sequence variants [(ASVs)–i.e., specific identifiable changes in the DNA that can indicate different microbial species or strains] were observed in the wild and farmed populations, respectively. The Venn diagram shows that 51.8% of the ASVs were unique to the wild population, while 22.5% were unique to the farmed population, and 25.8% were shared between the two populations (Figure 3a). The principal coordinate analysis plot showed insignificant findings for the bacterial composition between wild and farmed broodstock (PERMANOVA test; Pseudo-F(1,18) = 0.98, p(permutation) = 0.46, number of permutations = 999; Figure 3b). The bacterial ASV Chao1 richness of the wild population (73.5 ± 2.2) was significantly higher (Kruskal–Wallis test; H = 95.0, df = 19, p = 0.007) than that of the farmed population (36.8 ± 2.2), and the Shannon’s diversity index (at the bacterial ASV level) of the wild population (2.6 ± 0.9) was also significantly higher (Kruskal–Wallis test; H = 83.0, df = 19, p = 0.03) compared to the farmed populations (1.8 ± 0.7; Figure 3c).
With respect to the bacterial composition, both the wild and farmed broodstock showed a similar relative abundance of the most abundant bacterial phyla in their buccal cavity samples, but more Firmicutes were observed among the wild abalone (Figure 4a). Moreover, the core microbiota of the buccal cavity samples collected from both wild and broodstocks were Proteobacteria, Bacteroidota, Campylobacterota, Fusobacteria, and Firmicutes (Figure 4b).

3.4. Proximate Composition of Tissues

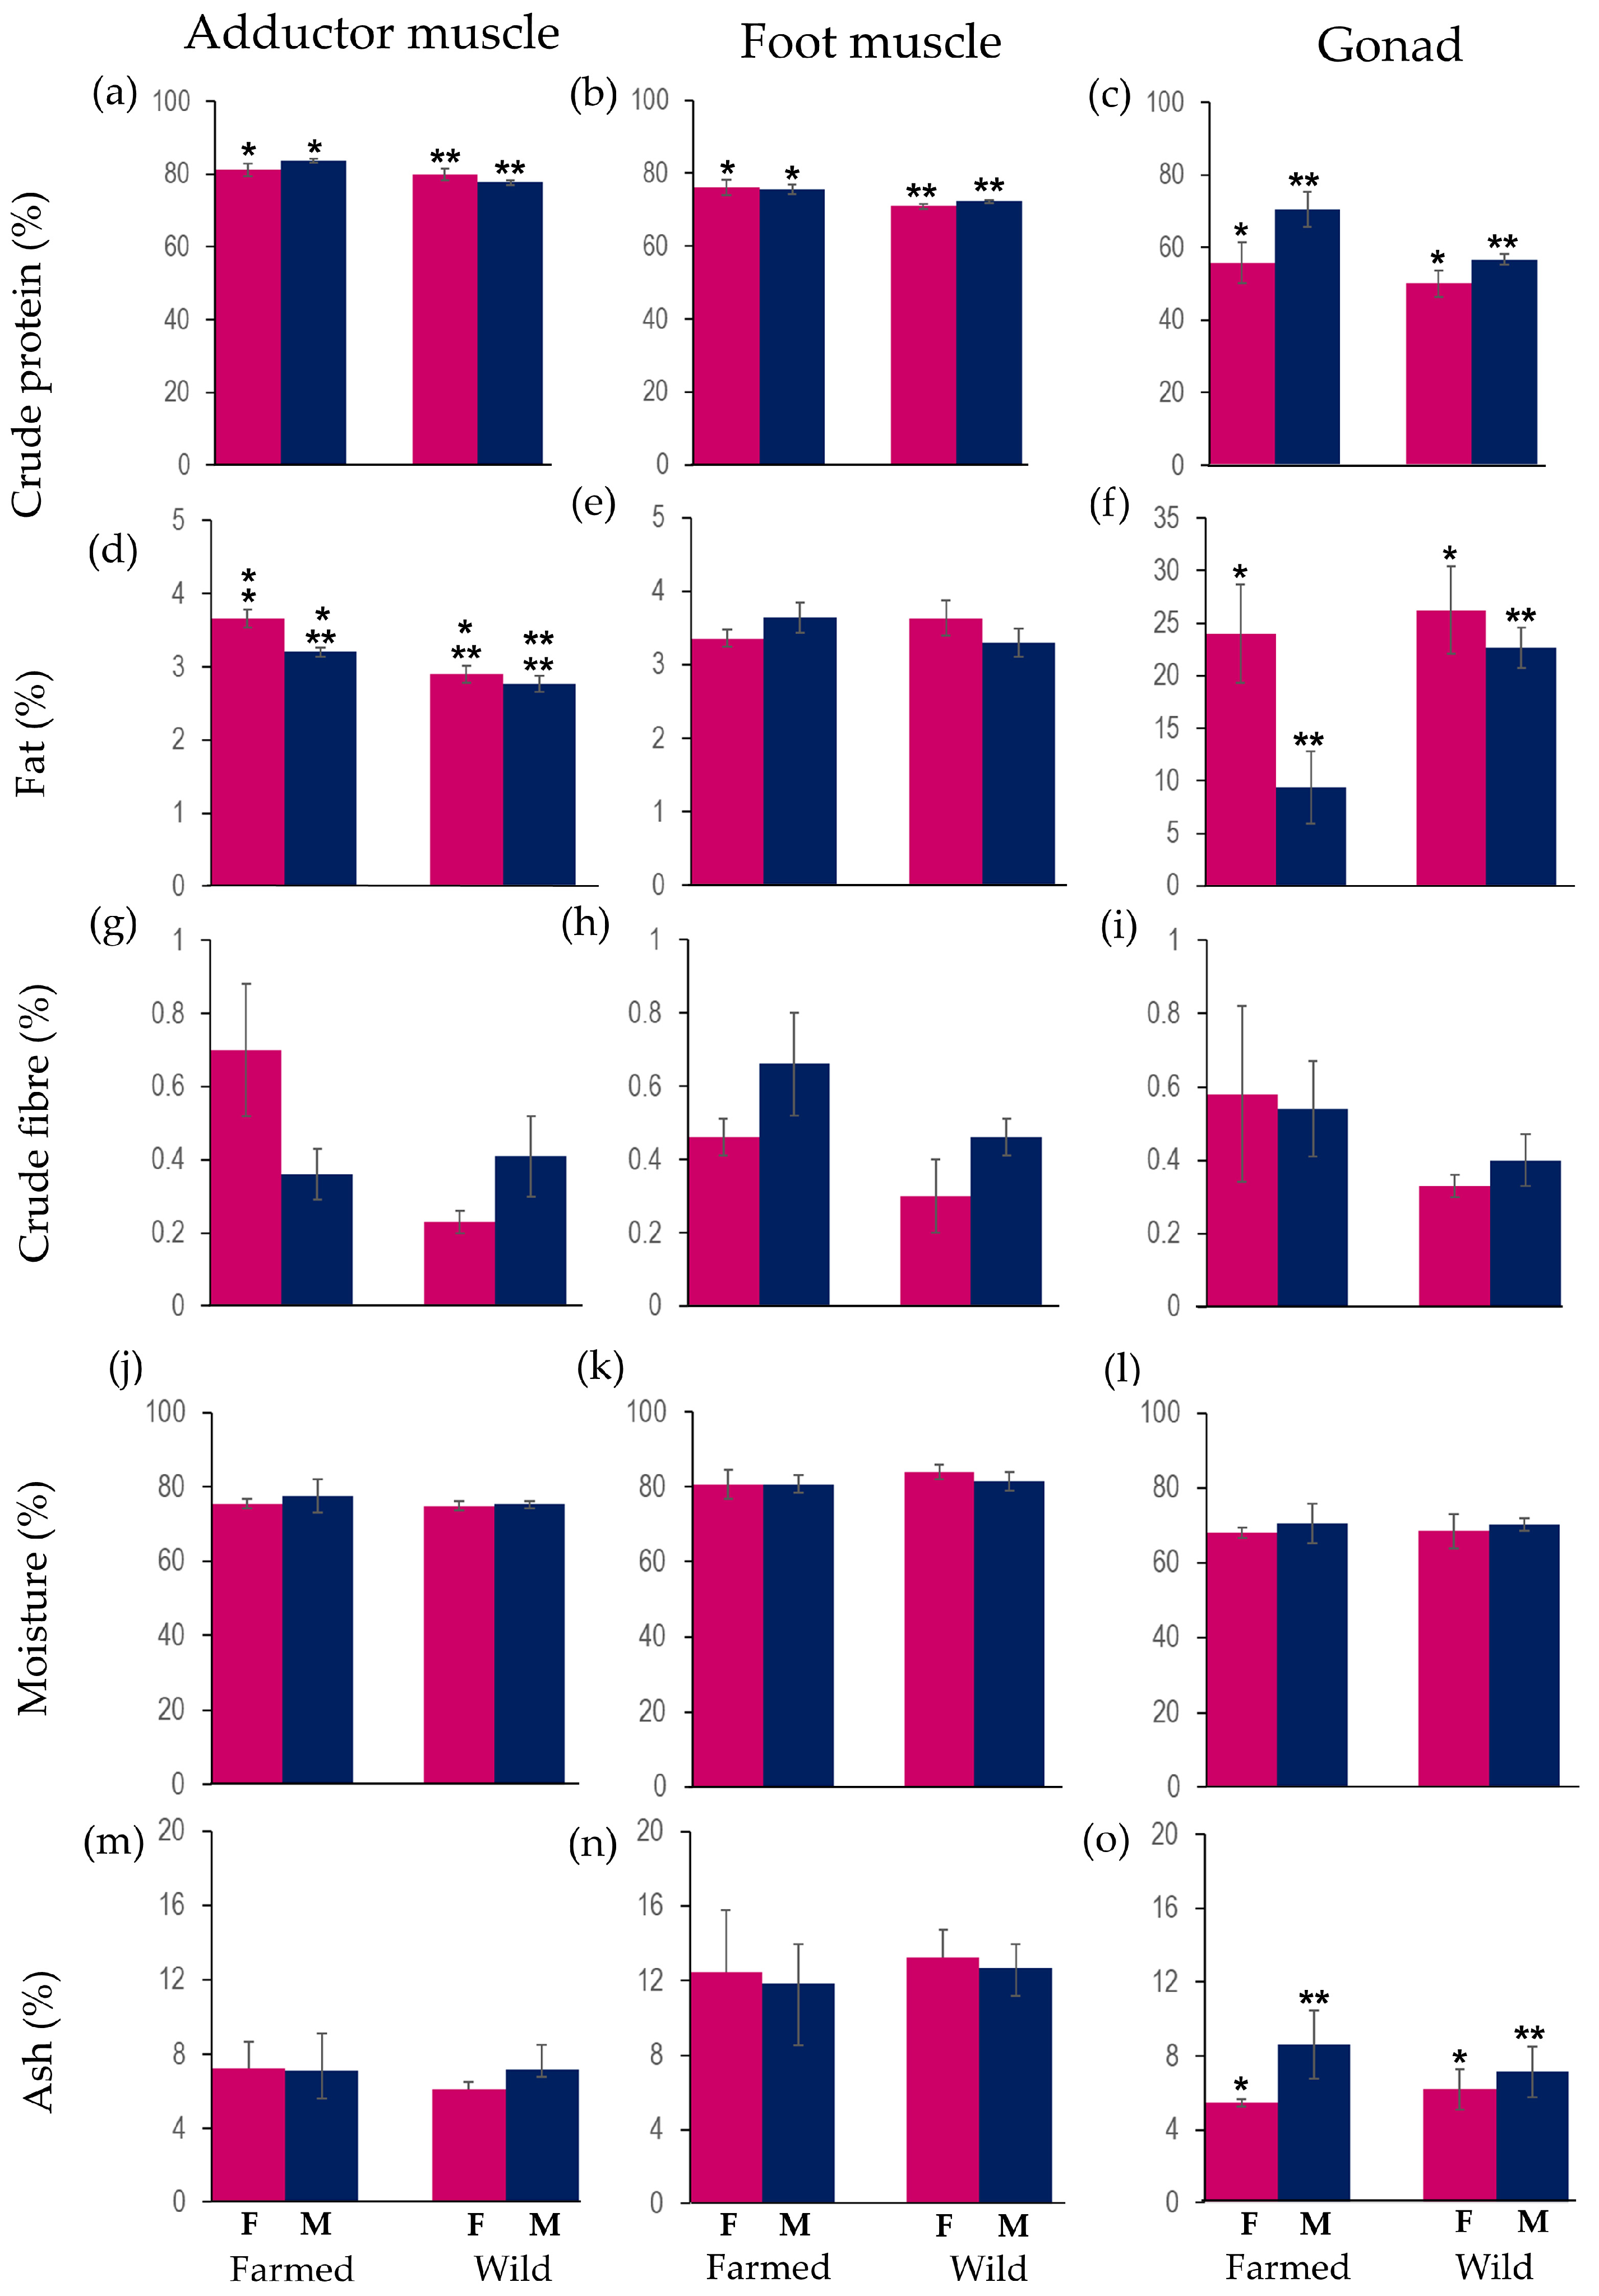
The crude protein content was significantly higher in the adductor muscle (Figure 5a, p = 0.002) and foot muscle (Figure 5b, p = 0.007) of farmed abalone (Table 1, Supplementary Table S5). Gonad tissue showed significantly higher protein in male than female abalone (Figure 5c, p = 0.017). The fat percentage in the adductor muscle (Figure 5d) was statistically significant for both group and sex, although there was no interaction effect. Farmed abalone had significantly higher fat contents in their adductor muscles compared to wild abalone (p = 4.83 × 10⁻⁵), while the adductor muscles of female abalone had significantly more fat than males (p = 0.018). The fat content in the foot muscle showed no significant variation (Figure 5e). Unsurprisingly, within the gonad tissue, fat (%) was significantly higher in females compared to males (Figure 5f, p = 0.016). Crude fibre (Figure 5g–i) and moisture analyses (Figure 5j–l) showed no statistical differences in the adductor muscle, foot muscle, or gonad tissues between groups or sexes. Lastly, the adductor muscle (Figure 5m) and foot muscle (Figure 5n) showed no significant difference in group or sex comparisons, but the gonad tissues of male abalone had significantly higher ash contents than those of female abalone (Figure 5o, p = 0.011).

3.5. Metabolomics

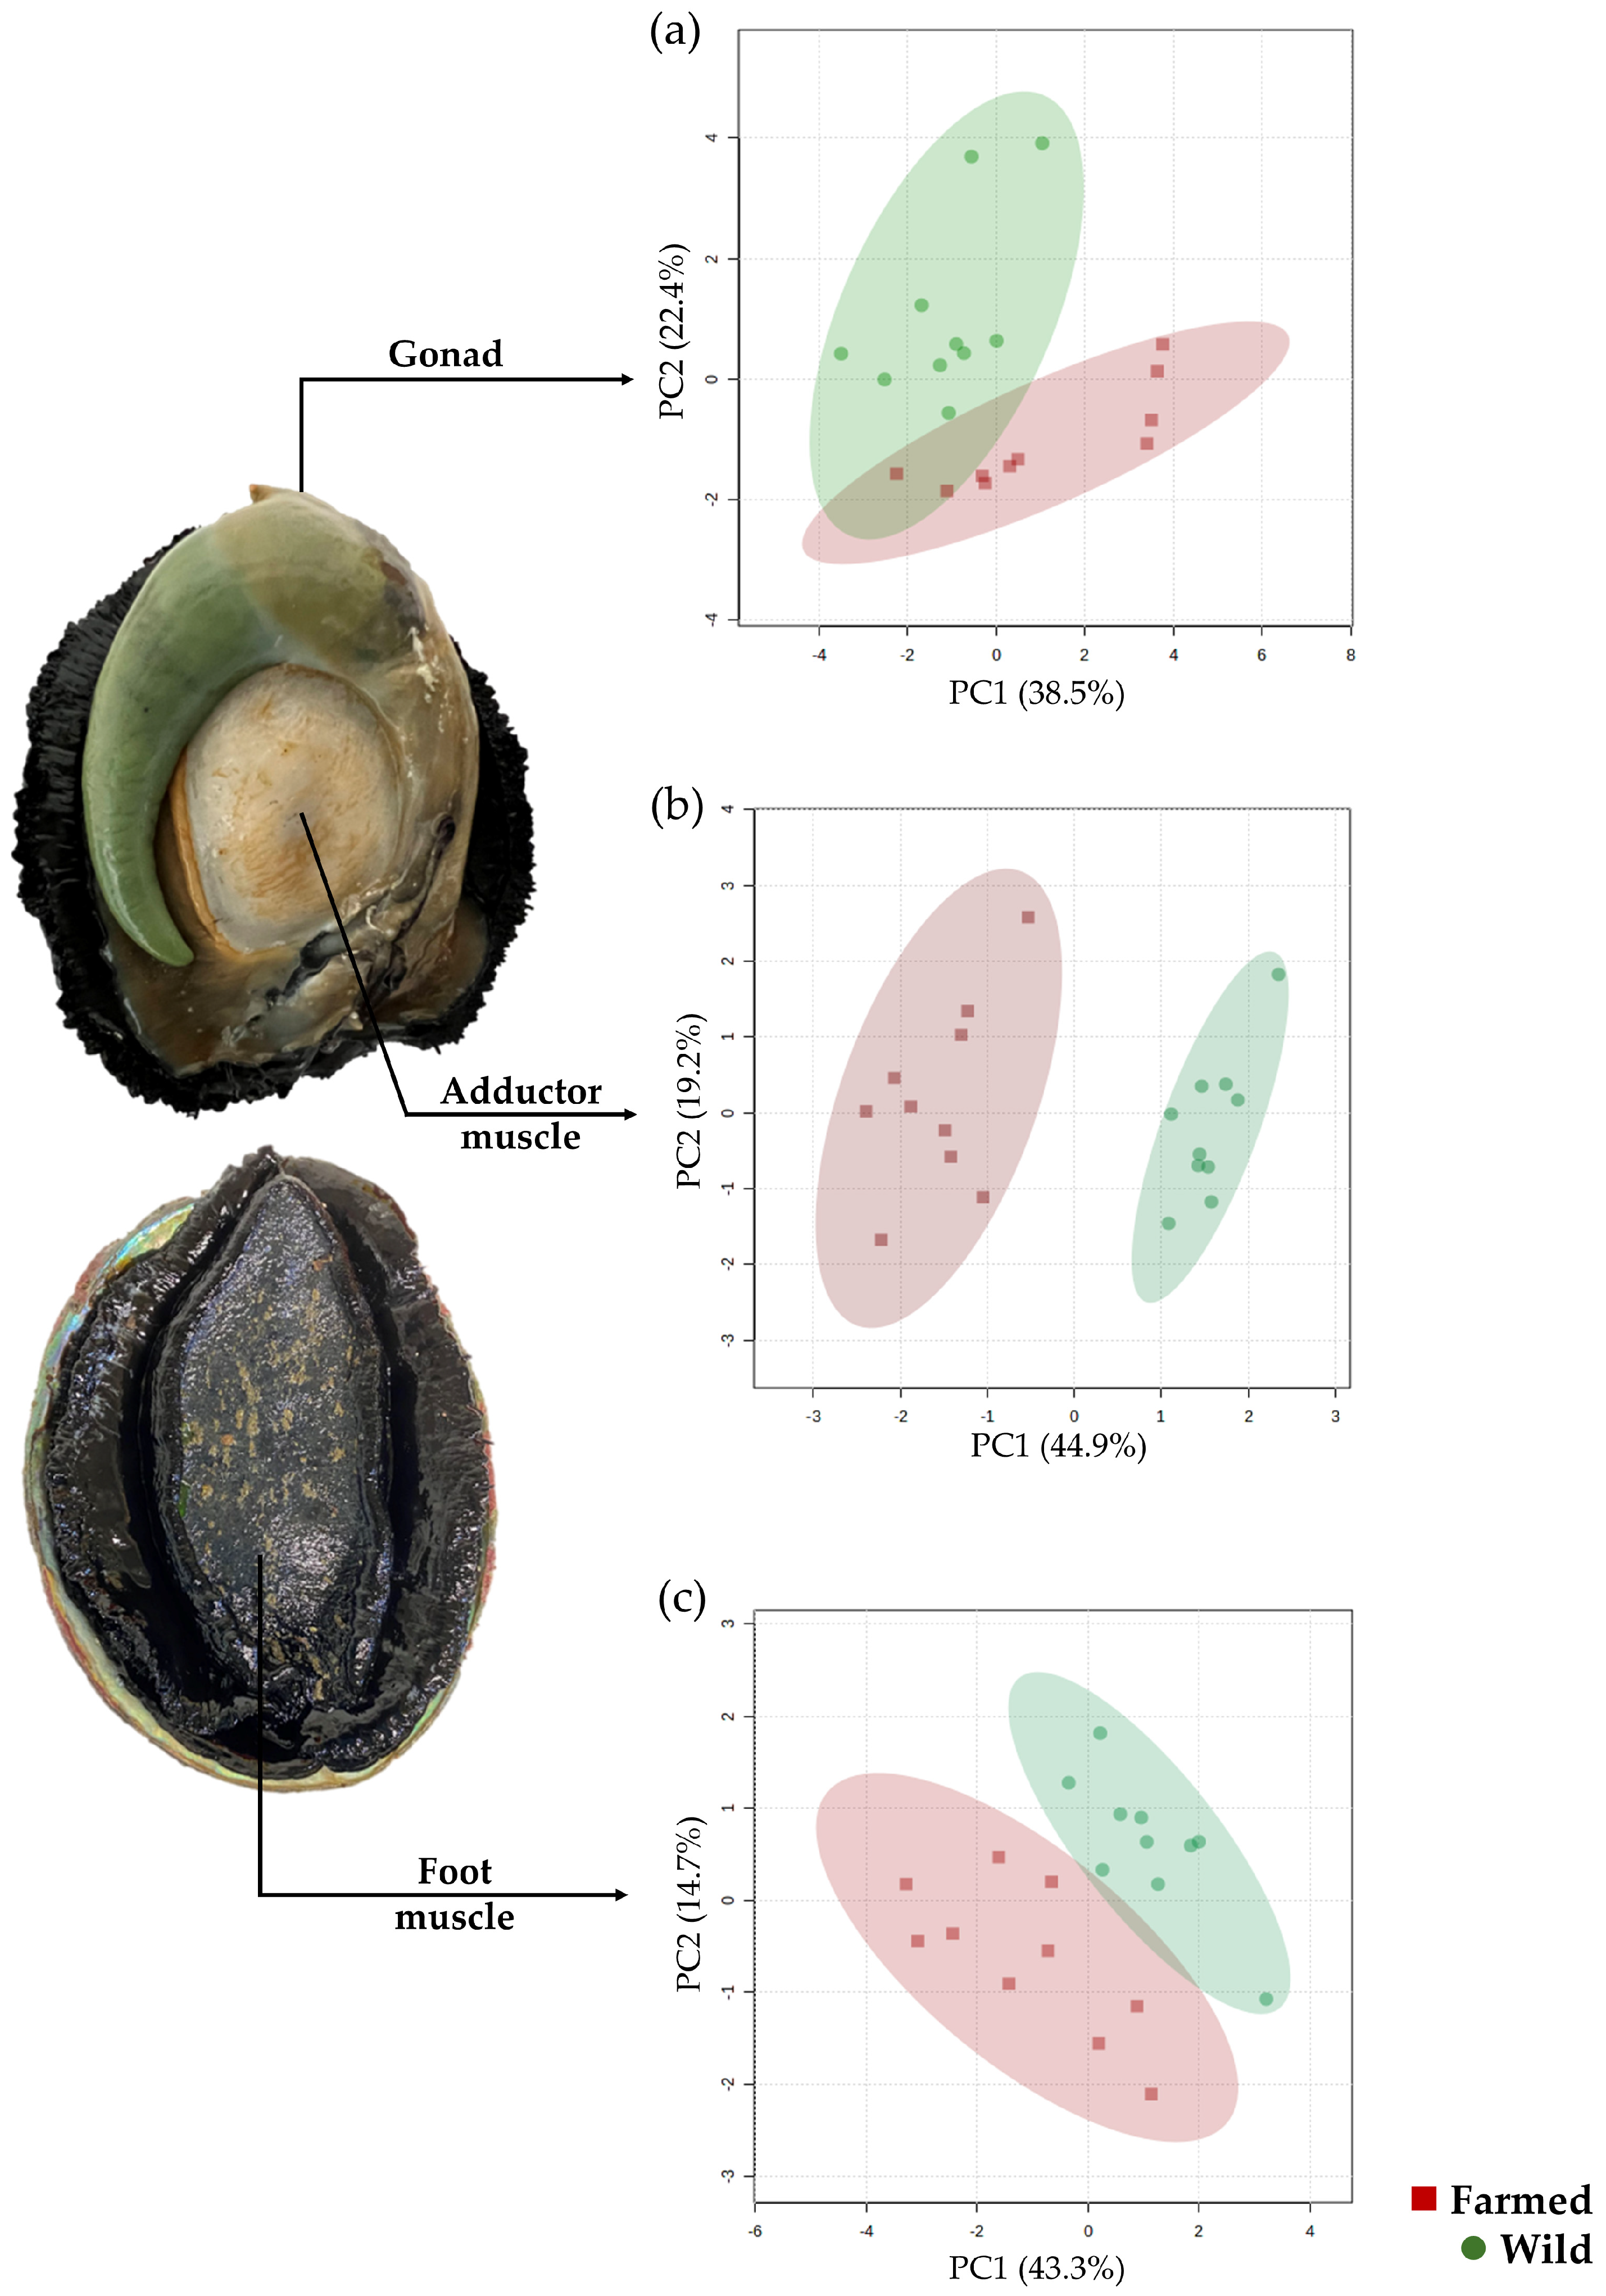
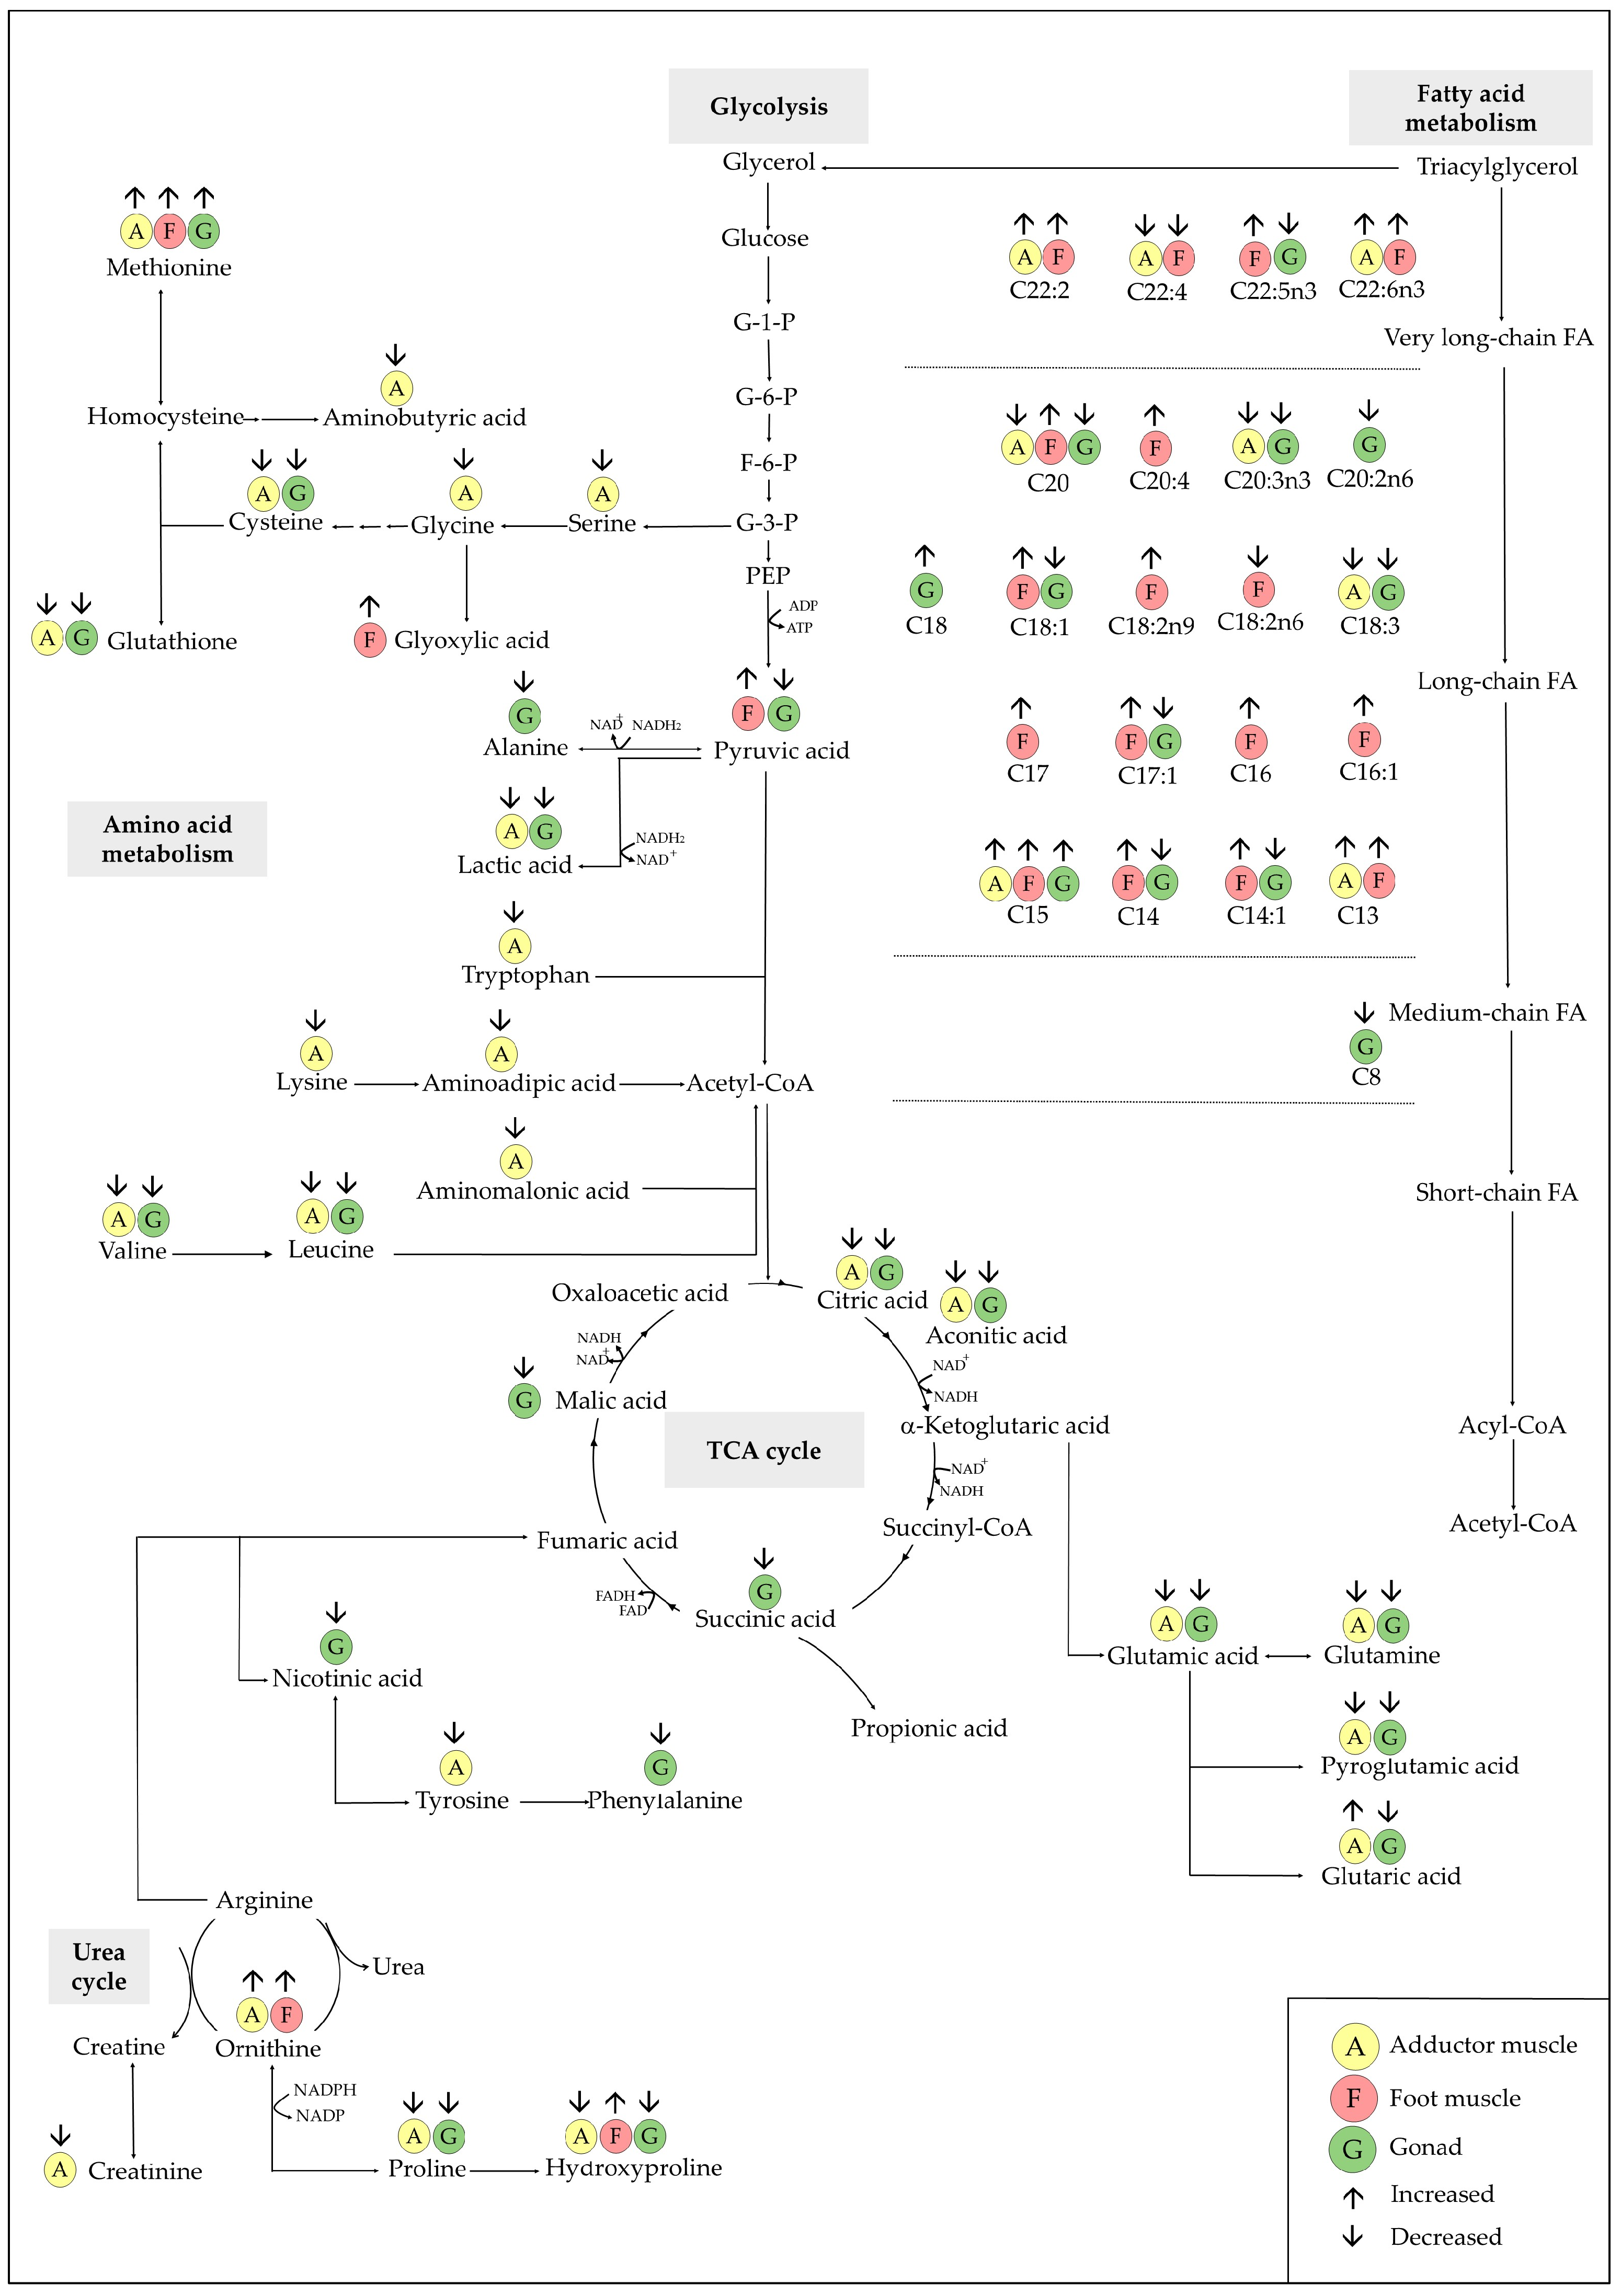
The metabolomic profiles varied greatly between tissues and groups (wild vs. farmed). GC-MS analysis identified a total of 105 features. Of these, 52 showed significant differences in the adductor muscle between wild and farmed populations, while 28 showed significant differences in the foot muscle and 43 showed significant differences in the gonad tissue. Multivariate principal component analyses (PCAs) of significant features per tissue type between wild and farmed broodstocks resulted in a moderate overlap in the gonad tissue (Figure 6a), a clear separation in the adductor muscle tissue (Figure 6b), and a moderate separation in the foot muscle tissue (Figure 6c). In each instance, the largest metabolite variation was captured using PC1, attributed to the metabolite differences between broodstock from differing populations (wild vs. farmed). From the metabolic map, the metabolite response from the adductor muscle and gonad tissues showed largely the same patterns within a population, while the foot muscle showed largely an opposing response (Figure 7). The metabolites of significance (Supplementary Table S6) can be summarised as long- and very long-chain fatty acids, carboxylic acids, amino acids, hydroxyl acids, and organic acids.

4. Discussion

In this study, we aimed to assess the physiological condition of wild and farmed broodstock abalone through a combination of histological, proximate composition, microbiome, and metabolomic analyses. Our objective was to compare these biological profiles for locally sourced broodstock that was either freshly harvested or maintained for multiple breeding cycles within a land-based holding system. Each analytical approach revealed distinct and significant differences between wild and farmed abalone, highlighting the value of an integrated assessment in evaluating broodstock physiological status.
Under farm conditions, abalone displayed large decreases in free amino acids detected in the adductor muscle and gonad tissues. Several glucogenic amino acids such as alanine, cysteine, glycine, glutamic acid, hydroxyproline, proline, serine, and valine were found in lower concentrations in the adductor muscle and/or gonad within the farmed population. Glucogenic amino acids can be used to produce glucose via gluconeogenesis [52], while they can also support other processes such as protein synthesis [53]. The reduced lactic acid levels (detected in the adductor muscle and gonad) also support the presence of gluconeogenesis, as previously reported in H. diversicolor exposed to thermal and hypoxic stress [52]. It is suggested that farmed abalone utilise amino acid sources to support energy production, as reported in H. discus hannai [54], potentially explaining the lower levels of amino acids detected in H. iris under investigation. Glucose is primarily used to generate adenosine triphosphate (ATP) through glycolysis and oxidative phosphorylation; however, it also serves as the main precursor for glycogen synthesis [55]. In abalone, the foot muscle is known to store large amounts of glycogen as an energy reserve, as reported in H. discus hannai [53] and H. diversicolor [52], where glycogen can be stored to balance cellular energy [53]. Moreover, high levels of glycogen can be used to generate pyruvic acid [56], which might be an explanation for the higher levels of pyruvic acid detected in the foot muscle of the farmed abalone analysed. Upon the depletion of glycogen reserves, abalone may utilise tissue lipids to meet energy demands via gluconeogenesis [57]. The findings from the current study suggest glycogen depletion in the adductor and gonad tissues of farmed abalone, as supported by the reduced levels of long-chain and very long-chain fatty acids. The opposite is also seen, where elevated fatty acids detected in the foot muscle of farmed H. iris are consistent with high glycogen reserves in this tissue. High glycogen availability is also linked to gonad development and gametogenesis [58], processes that are poorly documented in farmed H. iris.
Histological evaluations showed differences in gonad tissue and digestive gland structure, providing insight into reproduction conditions and gonad development. Wild populations of H. iris generally spawn in late summer or early autumn [59], but can vary yearly due to locality as described by Poore [60]. The status of the spawning cycle of the abalone under investigation remains unknown, which represents a limitation of this study, considering that the reproductive status can be largely affected by physiological changes [61]. Sampling took place in the spring, with the farmed abalone not subjected to spawning at that stage, and no data are available on the spawning of wild abalone for the specific period. The wild broodstock showed higher counts of normal oocytes compared to the farmed counterparts, which had higher counts of atretic oocytes. Generally, atretic oocytes indicate spawning [62], as they result from the degeneration and reabsorption of unspawned genetic material following the spawning event [63]. In the present study, however, the lower number of normal oocytes and increased atresia observed in farmed abalone are unlikely to indicate recent spawning, as visual inspection showed full and healthy gonads. Instead, this pattern may reflect pre-spawning atresia, where oocytes begin to break down in response to environmental stress (e.g., elevated temperature), allowing the animal to conserve energy and delay spawning until conditions improve [34,37]. Moreover, the increased atresia above physiological rates could lead to a reduced fecundity or reproductive failure, as observed in other species under captive conditions [64]. Additional monitoring of farmed abalone gonad conditions is required to determine whether oocyte atresia is consistently prevalent on-site. Also, larger sample numbers are required to eliminate inter-individual variation that might have been captured in this study. Future studies should also incorporate gamete volume fraction calculations to infer the reproductive investment in farmed abalone [65].
The digestive gland (DG) in abalone is associated with energy storage, enzyme synthesis, and gametogenesis [66]. In this study, histological comparisons revealed no major structural differences in the DG between farmed and wild H. iris. Based on quantitative scoring of the DG structure (as good, fair, or poor), male abalone obtained higher quality scores than the females (for both farmed and wild sources). Also observed was a number of wild female abalone containing a DG of poor quality. Previous studies suggest that male abalone often show a better DG condition, likely due to a lower energy expenditure on reproduction, whereas females allocate more energy toward gonad development, which may lead to DG depletion [67]. It might be that, in the wild, female abalone utilise DG sources to promote oocyte development, resulting in the poor DG detected in this cohort. Similar findings have been reported in H. discus hannai, where digestive gland tissue (also termed hepatopancreatic cells) supported oocyte growth through vitellogenesis [68].
The microbial characterisation of the buccal region of H. iris revealed a greater microbial diversity in the wild population, as indicated by a higher number of detected ASVs, suggesting a more complex microbial community structure in these animals [69]. A similar trend has been reported in tropical marine fish, where wild individuals showed higher Shannon diversity indices and a distinct microbiota composition compared to farmed fish [70]. It is likely that abalone in an aquaculture facility have a reduced microbial diversity due to standardised diets and controlled conditions. Considering that wild abalone likely consume a diet of mixed seaweed types, diversity in the gut microbiota is expected, with the potential to enhance beneficial bacterial populations and digestion efficiency [71]. Also, the increased Chao1 richness and Shannon’s diversity index may reflect that wild abalone experience larger ranges of biotic and abiotic factors, which can all contribute to the microbial diversity [72]. Histological findings also confirmed a higher abundance of sessile ciliates in the gills of wild abalone compared to the farmed counterparts. Free-living ciliates have previously been described in both farmed [73] and wild populations of H. iris [36]. In these studies, large numbers of ciliates were observed on the host, without causing any adverse effects.
The microbial composition of core bacterial groups observed in the buccal cavity also differed between the wild and farmed populations in the present study. For instance, abalone from the wild population had a greater abundance of Firmicutes. A study on H. discus hannai found higher Firmicutes in a larger (in weight) abalone cohort [74], which may provide net benefits to the host. In contrast to Firmicutes, several core bacterial taxa observed in the buccal cavity, such as Proteobacteria, which are the dominant microbial phylum in both farmed and wild H. iris, also overlapped with the core gut microbiota reported in other abalone species, including H. discus hannai [75], H. rufescens [29], and H. sorenseni [76]. This suggests that these bacteria may colonise the gastrointestinal tract and contribute to nutrient digestion. Proteobacteria are carbohydrate-fermenting bacteria and support the utilisation of carbohydrates in the intestines [77]. Carbohydrates form a large component of the abalone diet; for example, natural foods such as macroalgae contain 40–60% carbohydrates, while formulated diets have around 30–60% carbohydrates [10]. While dietary composition is known to influence microbial communities in abalone [78], the present study did not characterise the specific dietary components of each group. Therefore, further gut microbiota investigations of wild and farmed H. iris populations, especially under specific dietary treatments, are needed in the future to better understand the bacterial nutrient digestion functions. Nonetheless, the observed differences in microbial composition between wild and farmed H. iris highlight the potential role of feeding ecology in shaping the microbiome.
Diet can also influence the proximate composition of abalone, as previously reported in H. midae [79], H. asinina [80], H. discus hannai [81], and H. iris [82]. Based on the proximate composition assessments performed in this study, farmed abalone had higher protein concentrations in the adductor and foot muscle samples and had a higher fat percentage in the adductor muscle. Generally, protein accounts for 20–40% of the total ingredients in abalone formulated feed, as it serves as a macronutrient to build tissues [71]. Thus, the higher protein contents detected in the muscle samples of farmed abalone are most likely due to the diet consumed by these animals. A similar finding was seen in H. tuberculata coccinea, where increased dietary protein resulted in higher protein in the muscle and viscera [83]. Additionally, the literature suggests that formulated feeds contribute to the accumulation of lipids in abalone muscle [84]. Since farmed abalone consume formulated feed with between 1 and 5% lipids [71], higher levels are expected when compared to abalone from the wild, which consume macroalgae with low lipid contents [85]. Correspondingly, fatty acid metabolites (saturated fatty acids: C22; C20; C18; C17; C16; C15; C14; C13) were detected at higher levels in the foot muscle of farmed abalone, similar to those reported in H. fulgens [86]. It is suggested that lipids accumulate in the foot muscle of farmed abalone (as cells accumulate lipids under favourable growth conditions), typically to be used as triacylglycerols and also as phospholipids for cell division, but also to support structural components [66].
In contrast, the metabolism of the gonad of farmed H. iris showed lower levels of fatty acids (saturated fatty acids: C20, C14, C8; monounsaturated fatty acids: C18:1, C17:1, C14:1; polyunsaturated fatty acids: C22:5n3, C20:3n3, C20:2n6, C18:3) relative to the wild counterparts. Generally, fatty acids are higher in ripe gonads and lower when spawning takes place [87]. Hence, fatty acids could be utilised in farmed abalone to support cellular functions (such as tissue growth) [88], as spawning was not reported in this cohort. Moreover, the gonad showed reduced concentrations of metabolites (citric acid, aconitic acid, succinic acid, and malic acid) of the tricarboxylic acid (TCA) cycle, along with metabolites (alanine, phenylalanine, nicotinic acid, and glutamic acid) that feed into the TCA cycle. The TCA cycle serves as the main pathway for energy production and, considering the reduced metabolites, it is suggested that these metabolites were utilised by the TCA cycle for energy purposes [89]. Allocating energy to physiological functions such as growth and maintenance can constrain the resources available for gonadal development and gametogenesis [61]. Male gonad tissue showed a high protein content, which potentially reflects the protein-rich nature of sperm and the energetic demand of spermatogenesis [90]. In contrast, female gonad tissue exhibited higher lipid content, as mature eggs are known to accumulate lipids and glycogen to support oocyte maturation and provide essential energy reserves for early embryonic development [86,91,92]. This pattern supports the idea that females store lipids in preparation for spawning and to ensure successful embryo support during the early developmental stages.

5. Conclusions

This study offers a baseline physiological comparison between wild and farmed H. iris, addressing a critical knowledge gap in New Zealand abalone aquaculture. By integrating histology, proximate composition, microbiome, and metabolomics analyses, we identified key differences in reproductive health, nutritional status, and microbial diversity between populations. The histological analysis confirmed reproductive maturity in both populations. The elevated oocyte atresia in farmed abalone may limit spawning efficiency, while the reduced microbial and biochemical diversity could reflect restricted dietary and environmental exposure in cultured settings. Proximate composition analyses further indicated diet-driven variations, with farmed abalone having higher protein in muscle tissues as a result of the consumption of formulated feeds. Additionally, farmed abalone exhibited lower amino acid concentrations in the adductor muscle and fatty acids in the gonad, presumably linked to energy demands. The foot muscle showed increased fatty acid concentrations, potentially supporting growth. Both populations appeared physiologically viable, but the lower microbial diversity of the farmed stock could potentially benefit from probiotic supplementation, exposure to natural biofilms, or crossbreeding with wild broodstocks. Importantly, our results highlight actionable pathways for improving broodstock quality. By highlighting the differences between wild and farmed H. iris, this research contributes directly to enhancement of abalone-condition, supporting productivity of the industry. As aquaculture continues to expand, such integrated and comparative physiological assessments are essential for developing resilient, high-performing stocks suited for both commercial and environmental goals.

Supplementary Materials

The following supporting information can be downloaded at https://www.mdpi.com/article/10.3390/fishes10110566/s1. Supplementary Table S1: Abalone morphometrics (average ± STDEV) from wild and farmed broodstock populations. Supplementary Table S2: Histology oocyte count of female abalone (average ± STDEV) from wild and farmed broodstock populations. Supplementary Table S3: Digestive gland quality score distribution and average ± STDEV for wild and farmed broodstock by sex. Supplementary Table S4: Total number of gill ciliates (average ± STDEV) by group; * indicates significant difference between groups (based on ANOVA, p < 0.05). Supplementary Table S5: Proximate composition (average ± STDEV) of foot muscle, adductor muscle, and gonad from wild and cultured female and male H. iris. Supplementary Table S6: Metabolomics findings of H. iris, gonad (G), adductor muscle (AM), and foot muscle (FM) tissue. Supplementary Figure S1: Heatmap visualisation of metabolites identified in gonad (G), adductor muscle (AM), and foot muscle (FM) tissue in farmed (left) and wild (right) abalone. Supplementary Data S1: Metabolomics data. Supplementary Data S2: Microbiome data.

Author Contributions

Conceptualisation: N.L.C.R. and A.C.A.; methodology: R.S.S., L.V., A.A., J.G., J.C. and N.B.; software: R.S.S., L.V., A.A., J.G., J.C., N.B., T.C. and J.S.C.; formal analysis: R.S.S., L.V., A.A., J.G., J.C., N.B., T.C. and J.S.C.; investigation: R.S.S., L.V., A.A., J.G., J.C., N.B. and J.S.C.; resources: N.L.C.R. and A.C.A.; data curation: R.S.S., L.V., A.A., J.G., N.B., T.C., J.S.C., N.L.C.R., A.S. and A.C.A.; writing—original draft preparation: R.S.S. and L.V.; writing—review and editing: A.A., J.G., J.C., N.B., T.C., J.S.C., N.L.C.R., A.S. and A.C.A.; visualisation: R.S.S., L.V., A.A., J.G., N.B. and J.S.C.; supervision: A.S. and A.C.A.; project administration: N.L.C.R. and A.C.A.; funding acquisition: N.L.C.R. and A.C.A. All authors have read and agreed to the published version of the manuscript.

Funding

This research was supported by the Cawthron Institute’s Shellfish Aquaculture Research Platform (Ministry of Business, Innovation and Employment SSIF contract CAWX1801).

Institutional Review Board Statement

No ethical approval is required for this study. According to the New Zealand Animal Welfare Act, ethical approval for work using molluscs is not needed (except for cephalopods).

Informed Consent Statement

Not applicable.

Data Availability Statement

Data are contained within the article and Supplementary Materials.

Acknowledgments

Thank you to The New Zealand Abalone Company (Ocean Beach, Bluff, New Zealand) for providing animals for investigation. Sincere thanks to the team who assisted with specimen collection and dissections. Thank you to Tim Lawrence for technical assistance towards the microbiomics analyses.

Conflicts of Interest

The authors declare no conflicts of interest. The funders collaborated on the interpretation of data; and in the writing of the manuscript.

Abbreviations

The following abbreviations are used in this manuscript:
ANOVAAnalysis of variance
AOACAssociation of Official Agricultural Chemists
ASVAmplicon sequence variants
DGDigestive gland
EIElectron impact
GC-MSGas chromatography–mass spectrometry
gDNAGenomic deoxyribonucleic acid
glogGeneralised log transformed
HSDHonest Significant Difference
MCFMethyl chloroformate
NISTNational Institute of Standards and Technology
PCAPrincipal component analysis
PCoAPrincipal coordinate analysis
PCRPolymerase chain reaction
PERMANOVAPermutational multivariate analysis of variance
rRNARibosomal ribonucleic acid
TACCTotal Allowable Commercial Catch
TCATricarboxylic acid cycle

References

  1. Cook, P.A. Worldwide Abalone Production Statistics. J. Shellfish Res. 2019, 38, 401–404. [Google Scholar] [CrossRef]
  2. Walton, K.; Marshall, B.A.; Rawlence, N.J.; Spencer, H.G. Haliotis virginea Gmelin, 1791 and a new abalone from Aotearoa New Zealand (Mollusca: Gastropoda: Haliotidae). Molluscan Res. 2024, 44, 305–315. [Google Scholar] [CrossRef]
  3. Walton, K.; Spencer, G.H.; Rawlence, N. ‘The Pāua That Clings to the Sea’: A New Species of Abalone Found Only in Waters off a Remote NZ Island Chain. 2024. Available online: https://theconversation.com/the-paua-that-clings-to-the-sea-a-new-species-of-abalone-found-only-in-waters-off-a-remote-nz-island-chain-236568 (accessed on 29 September 2025).
  4. Gnanalingam, G.; Pritchard, D.W.; Richards, D.K.; Subritzky, P.; Flack, B.; Hepburn, C.D. Local management to support local fisheries: Rāhui (temporary closure) and bag limits for blackfoot abalone (Haliotis iris) in southern New Zealand. Aquat. Conserv. Mar. Freshw. Ecosyst. 2021, 31, 2320–2333. [Google Scholar] [CrossRef]
  5. Van Nguyen, T.; Alfaro, A.C.; Venter, L.; Ericson, J.A.; Ragg, N.L.C.; McCowan, T.; Mundy, C. Metabolomics approach reveals size-specific variations of blackfoot abalone (Haliotis iris) in Chatham Islands, New Zealand. Fish. Res. 2023, 262, 106645. [Google Scholar] [CrossRef]
  6. Ryder, F.J.; Sainsbury, K.J.; Hepburn, C.D.; Pritchard, D.W.; Gnanalingam, G. Re-assessment of a blackfoot abalone (Haliotis iris) population in Peraki Bay, New Zealand, after 45 years. N. Z. J. Mar. Freshw. Res. 2025, 59, 164–182. [Google Scholar] [CrossRef]
  7. Luo, Q.; Hamid, N.; Oey, I.; Leong, S.Y.; Kantono, K.; Alfaro, A.; Lu, J. Physicochemical changes in New Zealand abalone (Haliotis iris) with pulsed electric field (PEF) processing and heat treatments. LWT 2019, 115, 108438. [Google Scholar] [CrossRef]
  8. Bagarinao, N.C.; Kaur, L.; Boland, M. Effects of ultrasound treatments on tenderness and in vitro protein digestibility of New Zealand abalone, Haliotis iris. Foods 2020, 9, 1122. [Google Scholar] [CrossRef]
  9. Cook, P.A. Worldwide abalone production: An update. N. Z. J. Mar. Freshw. Res. 2025, 59, 4–10. [Google Scholar] [CrossRef]
  10. Li, X.; Huang, D.; Pan, M.; Sahandi, J.; Wu, Z.; Mai, K.; Zhang, W. Nutrition and feeds for abalone: Current knowledge and future directions. Rev. Aquac. 2024, 16, 1555–1579. [Google Scholar] [CrossRef]
  11. Hernández-Casas, S.; Seijo, J.C.; Beltrán-Morales, L.F.; Hernández-Flores, Á.; Arreguín-Sánchez, F.; Ponce-Díaz, G. Analysis of supply and demand in the international market of major abalone fisheries and aquaculture production. Mar. Policy 2023, 148, 105405. [Google Scholar] [CrossRef]
  12. Virgin, S.D.; Gerrity, S.; Schiel, D.R. Recreational fishing effects on New Zealand abalone (pāua, Haliotis iris) after five years of fishery closure: A matrix-based approach. Mar. Environ. Res. 2025, 210, 107276. [Google Scholar] [CrossRef]
  13. Wilkinson, V.; Morris, T. New Zealand Situation and Capabilities—Emerging and Future Platforms in New Zealand’s Bioeconomy. Coriolis (Research—Consulting—Strategy) for the Ministry of Business, Innovation and Employment, v1.00a. 2003. Available online: https://www.mbie.govt.nz/assets/new-zealand-situation-and-capabilities.pdf (accessed on 20 September 2025).
  14. Evans, B.; Bartlett, J.; Sweijd, N.; Cook, P.; Elliott, N. Loss of genetic variation at microsatellite loci in hatchery produced abalone in Australia (Haliotis rubra) and South Africa (Haliotis midae). Aquaculture 2004, 233, 109–127. [Google Scholar] [CrossRef]
  15. Li, Q.; Park, C.; Endo, T.; Kijima, A. Loss of genetic variation at microsatellite loci in hatchery strains of the Pacific abalone (Haliotis discus hannai). Aquaculture 2004, 235, 207–222. [Google Scholar] [CrossRef]
  16. Biandolino, F.; Parlapiano, I.; Grattagliano, A.; Fanelli, G.; Prato, E. Comparative characteristics of percentage edibility, condition index, biochemical constituents and lipids nutritional quality indices of wild and farmed scallops (Flexopecten glaber). Water 2020, 12, 1777. [Google Scholar] [CrossRef]
  17. Hall, S.A.; Méthé, D.; Stewart-Clark, S.E.; Clark, K.F.; Tremblay, R. Comparison of absorption efficiency and metabolic rate between wild and aquaculture oysters (Crassostrea virginica). Aquac. Rep. 2020, 16, 100263. [Google Scholar] [CrossRef]
  18. Benito, D.; Ahvo, A.; Nuutinen, J.; Bilbao, D.; Saenz, J.; Etxebarria, N.; Lekube, X.; Izagirre, U.; Lehtonen, K.K.; Marigómez, I. Influence of season-depending ecological variables on biomarker baseline levels in mussels (Mytilus trossulus) from two Baltic Sea subregions. Sci. Total Environ. 2019, 689, 1087–1103. [Google Scholar] [CrossRef]
  19. Oliveira, J.; Oliva-Teles, A.; Couto, A. Tracking biomarkers for the health and welfare of aquaculture fish. Fishes 2024, 9, 289. [Google Scholar] [CrossRef]
  20. Sabetian, A.; Hoang, L.H.; Zhang, J.; Lilkendey, J. Tracing transgenerational plasticity through ova fatty acid biomarkers in Giant Kōkopu (Galaxias argenteus). N. Z. J. Mar. Freshw. Res. 2025, 59, 356–367. [Google Scholar] [CrossRef]
  21. Hook, S.E.; Gallagher, E.P.; Batley, G.E. The role of biomarkers in the assessment of aquatic ecosystem health. Integr. Environ. Assess. Manag. 2014, 10, 327–341. [Google Scholar] [CrossRef]
  22. Kroon, F.; Streten, C.; Harries, S. A protocol for identifying suitable biomarkers to assess fish health: A systematic review. PLoS ONE 2017, 12, e0174762. [Google Scholar] [CrossRef]
  23. Sabetian, A.; Hoang, L.H.; Zhang, J.; White, W.L.; Chen, T.; Wang, H.; Lilkendey, J. Fatty acid biomarkers reveal maternal energy allocation strategies in spawning Snapper (Chrysophrys auratus). N. Z. J. Mar. Freshw. Res. 2025, 59, 1117–1130. [Google Scholar] [CrossRef]
  24. Brosset, P.; Cooke, S.J.; Schull, Q.; Trenkel, V.M.; Soudant, P.; Lebigre, C. Physiological biomarkers and fisheries management. Rev. Fish Biol. Fish. 2021, 31, 797–819. [Google Scholar] [CrossRef]
  25. Nguyen, T.V.; Alfaro, A.C.; Mundy, C.; Petersen, J.; Ragg, N.L. Omics research on abalone (Haliotis spp.): Current state and perspectives. Aquaculture 2022, 547, 737438. [Google Scholar] [CrossRef]
  26. Alfaro, A.C.; Young, T. Showcasing metabolomic applications in aquaculture: A review. Rev. Aquac. 2018, 10, 135–152. [Google Scholar] [CrossRef]
  27. Delorme, N.J.; Venter, L.; Rolton, A.; Ericson, J.A. Integrating animal health and stress assessment tools using the green-lipped mussel Perna canaliculus as a case study. J. Shellfish Res. 2021, 40, 93–112. [Google Scholar] [CrossRef]
  28. Hooper, C.; Day, R.; Slocombe, R.; Benkendorff, K.; Handlinger, J.; Goulias, J. Effects of severe heat stress on immune function, biochemistry and histopathology in farmed Australian abalone (hybrid Haliotis laevigata × Haliotis rubra). Aquaculture 2014, 432, 26–37. [Google Scholar] [CrossRef]
  29. Villasante, A.; Catalán, N.; Rojas, R.; Lohrmann, K.B.; Romero, J. Microbiota of the digestive gland of red abalone (Haliotis rufescens) is affected by withering syndrome. Microorganisms 2020, 8, 1411. [Google Scholar] [CrossRef]
  30. Ganogpichayagrai, A.; Suksaard, C. Proximate composition, vitamin and mineral composition, antioxidant capacity, and anticancer activity of Acanthopanax trifoliatus. J. Adv. Pharm. Technol. Res. 2020, 11, 179–183. [Google Scholar] [CrossRef]
  31. García-López, Á.; Pascual, E.; Sarasquete, C.; Martínez-Rodríguez, G. Disruption of gonadal maturation in cultured Senegalese sole Solea senegalensis Kaup by continuous light and/or constant temperature regimes. Aquaculture 2006, 261, 789–798. [Google Scholar] [CrossRef]
  32. Stentiford, G.; Massoud, M.; Al-Mudhhi, S.; Al-Sarawi, M.; Al-Enezi, M.; Lyons, B. Histopathological survey of potential biomarkers for the assessment of contaminant related biological effects in species of fish and shellfish collected from Kuwait Bay, Arabian Gulf. Mar. Environ. Res. 2014, 98, 60–67. [Google Scholar] [CrossRef]
  33. Jerez-Cepa, I.; Ruiz-Jarabo, I. Physiology: An important tool to assess the welfare of aquatic animals. Biology 2021, 10, 61. [Google Scholar] [CrossRef]
  34. Copedo, J.S.; Webb, S.C.; Delisle, L.; Knight, B.; Ragg, N.L.; Laroche, O.; Venter, L.; Alfaro, A.C. Elucidating divergent growth and climate vulnerability in abalone (Haliotis iris): A multi-year snapshot. Mar. Environ. Res. 2025, 207, 107090. [Google Scholar] [CrossRef] [PubMed]
  35. Howard, D.W. Histological Techniques for Marine Bivalve Mollusks and Crustaceans; National Centers for Coastal Ocean Service, National Ocean Service, NOAA: Silver Spring, MD, USA, 2004; Volume 5. [Google Scholar]
  36. Copedo, J.S.; Webb, S.C.; Ragg, N.L.; Venter, L.; Alfaro, A.C. Histopathological investigation of four populations of abalone (Haliotis iris) exhibiting divergent growth performance. J. Invertebr. Pathol. 2024, 202, 108042. [Google Scholar] [CrossRef] [PubMed]
  37. Beninger, P.G. Caveat observator: The many faces of pre-spawning atresia in marine bivalve reproductive cycles. Mar. Biol. 2017, 164, 163. [Google Scholar] [CrossRef]
  38. Bullon, N.; Alfaro, A.C.; Guo, J.; Copedo, J.; Nguyen, T.V.; Seyfoddin, A. Expanding the menu for New Zealand farmed abalone: Dietary inclusion of insect meal and grape marc (effects on gastrointestinal microbiome, digestive morphology, and muscle metabolome). N. Z. J. Mar. Freshw. Res. 2025, 59, 31–60. [Google Scholar] [CrossRef]
  39. Bullon, N.; Seyfoddin, A.; Hamid, N.; Manivannan, M.; Alfaro, A.C. Effects of insect meal and grape marc in the nutritional profile, growth, and digestibility of juvenile New Zealand farmed abalone. Aquac. Int. 2024, 32, 1507–1536. [Google Scholar] [CrossRef]
  40. Alfaro, A.C.; Nguyen, T.V.; Venter, L.; Ericson, J.A.; Sharma, S.; Ragg, N.L.; Mundy, C. The effects of live transport on metabolism and stress responses of abalone (Haliotis iris). Metabolites 2021, 11, 748. [Google Scholar] [CrossRef]
  41. Smart, K.F.; Aggio, R.B.; Van Houtte, J.R.; Villas-Bôas, S.G. Analytical platform for metabolome analysis of microbial cells using methyl chloroformate derivatization followed by gas chromatography-mass spectrometry. Nat. Protoc. 2010, 5, 1709–1729. [Google Scholar] [CrossRef]
  42. Young, T.; Walker, S.P.; Alfaro, A.C.; Fletcher, L.M.; Murray, J.S.; Lulijwa, R.; Symonds, J. Impact of acute handling stress, anaesthesia, and euthanasia on fish plasma biochemistry: Implications for veterinary screening and metabolomic sampling. Fish Physiol. Biochem. 2019, 45, 1485–1494. [Google Scholar] [CrossRef]
  43. Chen, T. Libracef Version 0.2: A Tool for Building Agilent Library Files from .cef Files of Mass Hunter Unknown Analysis. Available online: https://github.com/mzzzhunter/libracef/releases/tag/v0.2 (accessed on 1 January 2025).
  44. Sumner, L.W.; Amberg, A.; Barrett, D.; Beale, M.H.; Beger, R.; Daykin, C.A.; Fan, T.W.-M.; Fiehn, O.; Goodacre, R.; Griffin, J.L. Proposed minimum reporting standards for chemical analysis: Chemical analysis working group (CAWG) metabolomics standards initiative (MSI). Metabolomics 2007, 3, 211–221. [Google Scholar] [CrossRef]
  45. Archer, S.D.; Lee, K.C.; Caruso, T.; King-Miaow, K.; Harvey, M.; Huang, D.; Wainwright, B.J.; Pointing, S.B. Air mass source determines airborne microbial diversity at the ocean–atmosphere interface of the Great Barrier Reef marine ecosystem. ISME J. 2020, 14, 871–876. [Google Scholar] [CrossRef] [PubMed]
  46. Martin, M. Cutadapt removes adapter sequences from high-throughput sequencing reads. EMBnet. J. 2011, 17, 10–12. [Google Scholar] [CrossRef]
  47. Quast, C.; Pruesse, E.; Yilmaz, P.; Gerken, J.; Schweer, T.; Yarza, P.; Peplies, J.; Glöckner, F.O. The SILVA ribosomal RNA gene database project: Improved data processing and web-based tools. Nucleic Acids Res. 2012, 41, D590–D596. [Google Scholar] [CrossRef]
  48. Oksanen, J.; Blanchet, F.G.; Kindt, R.; Legendre, P.; Minchin, P.R.; O’hara, R.; Simpson, G.L.; Solymos, P.; Stevens, M.H.H.; Wagner, H. Package ‘vegan’. Community Ecol. Package Version 2013, 2, 1–295. [Google Scholar]
  49. Lu, Y.; Zhou, G.; Ewald, J.; Pang, Z.; Shiri, T.; Xia, J. MicrobiomeAnalyst 2.0: Comprehensive statistical, functional and integrative analysis of microbiome data. Nucleic Acids Res. 2023, 51, W310–W318. [Google Scholar] [CrossRef]
  50. Escobar-Bravo, R.; Schimmel, B.C.; Glauser, G.; Klinkhamer, P.G.; Erb, M. Leafminer attack accelerates the development of soil-dwelling conspecific pupae via plant-mediated changes in belowground volatiles. New Phytol. 2022, 234, 280–294. [Google Scholar] [CrossRef]
  51. Chong, J.; Soufan, O.; Li, C.; Caraus, I.; Li, S.; Bourque, G.; Wishart, D.S.; Xia, J. MetaboAnalyst 4.0: Towards more transparent and integrative metabolomics analysis. Nucleic Acids Res. 2018, 46, W486–W494. [Google Scholar] [CrossRef]
  52. Lu, J.; Shi, Y.; Wang, S.; Chen, H.; Cai, S.; Feng, J. NMR-based metabolomic analysis of Haliotis diversicolor exposed to thermal and hypoxic stresses. Sci. Total Environ. 2016, 545, 280–288. [Google Scholar] [CrossRef]
  53. Koyama, M.; Furukawa, F.; Koga, Y.; Funayama, S.; Furukawa, S.; Baba, O.; Lin, C.-C.; Hwang, P.-P.; Moriyama, S.; Okumura, S.-I. Gluconeogenesis and glycogen metabolism during development of Pacific abalone, Haliotis discus hannai. Am. J. Physiol. Regul. Integr. Comp. Physiol. 2020, 318, R619–R633. [Google Scholar] [CrossRef]
  54. Liu, J.; Yin, Z.; Yu, W.; Luo, X.; Ke, C.; You, W. The taste characteristics and metabolite variations of two Pacific abalone strains with different glycogen contents. LWT 2024, 195, 115820. [Google Scholar] [CrossRef]
  55. Livingstone, D.R.; De Zwaan, A. Carbohydrate metabolism of gastropods. In Metabolic Biochemistry and Molecular Biomechanics; Elsevier: Amsterdam, The Netherlands, 1983; pp. 177–242. [Google Scholar]
  56. Martinez-Cruz, O.; Sanchez-Paz, A.; Garcia-Carreño, F.; Jimenez-Gutierrez, L.; Muhlia-Almaza, A. Invertebrates Mitochondrial Function and Energetic Challenges; InTech: Rijeka, Croatia, 2012. [Google Scholar]
  57. Wang, X.; Li, E.; Chen, L. A review of carbohydrate nutrition and metabolism in crustaceans. N. Am. J. Aquac. 2016, 78, 178–187. [Google Scholar] [CrossRef]
  58. Li, B.; Song, K.; Meng, J.; Li, L.; Zhang, G. Integrated application of transcriptomics and metabolomics provides insights into glycogen content regulation in the Pacific oyster Crassostrea gigas. BMC Genom. 2017, 18, 713. [Google Scholar] [CrossRef] [PubMed]
  59. Naylor, J.; Andrew, N.; Kim, S. Demographic variation in the New Zealand abalone Haliotis iris. Mar. Freshw. Res. 2006, 57, 215–224. [Google Scholar] [CrossRef]
  60. Poore, G.C. Ecology of New Zealand abalones, Haliotis species (Mollusca: Gastropoda) 3. Growth. N. Z. J. Mar. Freshw. Res. 1972, 6, 534–559. [Google Scholar] [CrossRef]
  61. Morash, A.J.; Alter, K. Effects of environmental and farm stress on abalone physiology: Perspectives for abalone aquaculture in the face of global climate change. Rev. Aquac. 2016, 8, 342–368. [Google Scholar] [CrossRef]
  62. Moss, G.A. Effect of temperature on the breeding cycle and spawning success of the New Zealand abalone, Haliotis australis. N. Z. J. Mar. Freshw. Res. 1998, 32, 139–146. [Google Scholar] [CrossRef]
  63. Wood, A.; Buxton, C. Aspects of the biology of the abalone Haliotis midae (Linne, 1758) on the east coast of South Africa. 2. Reproduction. S. Afr. J. Mar. Sci. 1996, 17, 69–78. [Google Scholar] [CrossRef]
  64. Corriero, A.; Zupa, R.; Mylonas, C.C.; Passantino, L. Atresia of ovarian follicles in fishes, and implications and uses in aquaculture and fisheries. J. Fish Dis. 2021, 44, 1271–1291. [Google Scholar] [CrossRef]
  65. Osterheld, K.; Davidson, J.; Comeau, L.A.; Audet, C.; Hori, T.; Tremblay, R. Reproductive investment and gonad development in triploid mussels, Mytilus Edulis. Aquaculture 2024, 593, 741315. [Google Scholar] [CrossRef]
  66. Venter, L.; Loots, D.T.; Vosloo, A.; Jansen van Rensburg, P.; Lindeque, J.Z. Abalone growth and associated aspects: Now from a metabolic perspective. Rev. Aquac. 2018, 10, 451–473. [Google Scholar] [CrossRef]
  67. Ayres, D.W.P. Effect of Diet and Sex-Sorting on Growth and Gonad Development in Farmed South African Abalone, Haliotis midae. Master’s Thesis, Rhodes University, Grahamstown, South Africa, 2013. [Google Scholar]
  68. Kim, M.A.; Kim, T.H.; Lee, S.; Nam, B.H.; Lee, J.S.; Jang, W.; Sohn, Y.C. Ovarian transcriptome profiles associated with sexual maturation in Pacific abalone (Haliotis discus hannai). Genes Genom. 2020, 42, 1179–1188. [Google Scholar] [CrossRef]
  69. Straub, D.; Blackwell, N.; Langarica-Fuentes, A.; Peltzer, A.; Nahnsen, S.; Kleindienst, S. Interpretations of environmental microbial community studies are biased by the selected 16S rRNA (gene) amplicon sequencing pipeline. Front. Microbiol. 2020, 11, 550420. [Google Scholar] [CrossRef] [PubMed]
  70. Soh, M.; Tay, Y.C.; Lee, C.S.; Low, A.; Orban, L.; Jaafar, Z.; Seedorf, H. The intestinal digesta microbiota of tropical marine fish is largely uncultured and distinct from surrounding water microbiota. NPJ Biofilms Microbiomes 2024, 10, 11. [Google Scholar] [CrossRef] [PubMed]
  71. Bullon, N.; Seyfoddin, A.; Alfaro, A.C. The role of aquafeeds in abalone nutrition and health: A comprehensive review. J. World Aquac. Soc. 2023, 54, 7–31. [Google Scholar] [CrossRef]
  72. Jiang, J.-Z.; Zhao, W.; Liu, G.-F.; Wang, J.-Y. Relationships between and formation dynamics of the microbiota of consumers, producers, and the environment in an abalone aquatic system. PLoS ONE 2017, 12, e0182590. [Google Scholar] [CrossRef]
  73. Muznebin, F.; Alfaro, A.C.; Webb, S.C. Occurrence of Perkinsus olseni and other parasites in New Zealand black-footed abalone (Haliotis iris). N. Z. J. Mar. Freshw. Res. 2023, 57, 261–281. [Google Scholar] [CrossRef]
  74. Choi, M.-J.; Oh, Y.D.; Kim, Y.R.; Lim, H.K.; Kim, J.-M. Intestinal microbial diversity is higher in Pacific abalone (Haliotis discus hannai) with slower growth rates. Aquaculture 2021, 537, 736500. [Google Scholar] [CrossRef]
  75. Guo, Z.; Hou, X.; Chang, L.; Du, Z.; Shi, K.; Song, A.; Liang, Z.; Gu, J. Effects of different feeding patterns on growth, enzyme activity, and intestinal microbiome of the juvenile Pacific abalone Haliotis discus hannai. Aquac. Rep. 2024, 39, 102427. [Google Scholar] [CrossRef]
  76. Parker-Graham, C.A.; Eetemadi, A.; Yazdi, Z.; Marshman, B.C.; Loeher, M.; Richey, C.A.; Barnum, S.; Moore, J.D.; Soto, E. Effect of oxytetracycline treatment on the gastrointestinal microbiome of critically endangered white abalone (Haliotis sorenseni) treated for withering syndrome. Aquaculture 2020, 526, 735411. [Google Scholar] [CrossRef]
  77. Yu, W.; Lu, Y.; Shen, Y.; Liu, J.; Gong, S.; Yu, F.; Huang, Z.; Zou, W.; Zhou, M.; Luo, X. Exploring the intestinal microbiota and metabolome profiles associated with feed efficiency in Pacific abalone (Haliotis discus hannai). Front. Microbiol. 2022, 13, 852460. [Google Scholar] [CrossRef]
  78. Wei, X.; Zeng, W.; Tang, B.; Huang, M.; Luo, X.; Ke, C. Effects of Different Diets on Intestinal Microbiota Between Common and Orange-Muscle Mutant of Haliotis gigantea; Elsevier: Amsterdam, The Netherlands, 2024. [Google Scholar]
  79. Britz, P.J.; Hecht, T. Effect of dietary protein and energy level on growth and body composition of South African abalone, Haliotis midae. Aquaculture 1997, 156, 195–210. [Google Scholar] [CrossRef]
  80. Bautista-Teruel, M.N.; Millamena, O.M. Diet development and evaluation for juvenile abalone, Haliotis asinina: Protein/energy levels. Aquaculture 1999, 178, 117–126. [Google Scholar] [CrossRef]
  81. Ju, Z.Y.; Viljoen, C.; Hutchinson, P.; Reinicke, J.; Horgen, F.D.; Howard, L.; Lee, C.S. Effects of diets on the growth performance and shell pigmentation of Pacific abalone. Aquac. Res. 2016, 47, 4004–4014. [Google Scholar] [CrossRef]
  82. Tung, C.H.; Alfaro, A.C. Effect of dietary protein and temperature on the growth and health of juvenile New Zealand black-footed abalone (Haliotis iris). Aquac. Res. 2011, 42, 366–385. [Google Scholar] [CrossRef]
  83. Bilbao, A.; Uriarte, I.; del Pino Viera, M.; Sosa, B.; Fernández-Palacios, H.; Hernández-Cruz, C.M. Effect of macroalgae protein levels on some reproductive aspects and physiological parameters for the abalone, Haliotis tuberculata coccinea (Reeve 1846). J. World Aquac. Soc. 2012, 43, 764–777. [Google Scholar] [CrossRef]
  84. Dunstan, G.A.; Baillie, H.J.; Barrett, S.M.; Volkman, J.K. Effect of diet on the lipid composition of wild and cultured abalone. Aquaculture 1996, 140, 115–127. [Google Scholar] [CrossRef]
  85. Bansemer, M.S.; Qin, J.G.; Harris, J.O.; Howarth, G.S.; Stone, D.A. Nutritional requirements and use of macroalgae as ingredients in abalone feed. Rev. Aquac. 2014, 5, 121–135. [Google Scholar] [CrossRef]
  86. Nelson, M.M.; Leighton, D.L.; Phleger, C.F.; Nichols, P.D. Comparison of growth and lipid composition in the green abalone, Haliotis fulgens, provided specific macroalgal diets. Comp. Biochem. Physiol. Part B Biochem. Mol. Biol. 2002, 131, 695–712. [Google Scholar] [CrossRef]
  87. Mateos, H.T.; Lewandowski, P.; Su, X. Seasonal variations of total lipid and fatty acid contents in muscle, gonad and digestive glands of farmed Jade Tiger hybrid abalone in Australia. Food Chem. 2010, 123, 436–441. [Google Scholar] [CrossRef]
  88. Mau, A.; Jha, R. Aquaculture of two commercially important molluscs (abalone and limpet): Existing knowledge and future prospects. Rev. Aquac. 2018, 10, 611–625. [Google Scholar] [CrossRef]
  89. Venter, L.; Alfaro, A.C.; Van Nguyen, T.; Lindeque, J.Z. Metabolite profiling of abalone (Haliotis iris) energy metabolism: A Chatham Islands case study. Metabolomics 2022, 18, 52. [Google Scholar] [CrossRef] [PubMed]
  90. Boulais, M.; Demoy-Schneider, M.; Alavi, S.M.H.; Cosson, J. Spermatozoa motility in bivalves: Signaling, flagellar beating behavior, and energetics. Theriogenology 2019, 136, 15–27. [Google Scholar] [CrossRef]
  91. Najmudeen, T. Variation in biochemical composition during gonad maturation of the tropical abalone Haliotis varia Linnaeus 1758 (Vetigastropoda: Haliotidae). Mar. Biol. Res. 2007, 3, 454–461. [Google Scholar] [CrossRef]
  92. Williams, N.C.; O’Neill, L.A. A role for the Krebs cycle intermediate citrate in metabolic reprogramming in innate immunity and inflammation. Front. Immunol. 2018, 9, 141. [Google Scholar] [CrossRef]
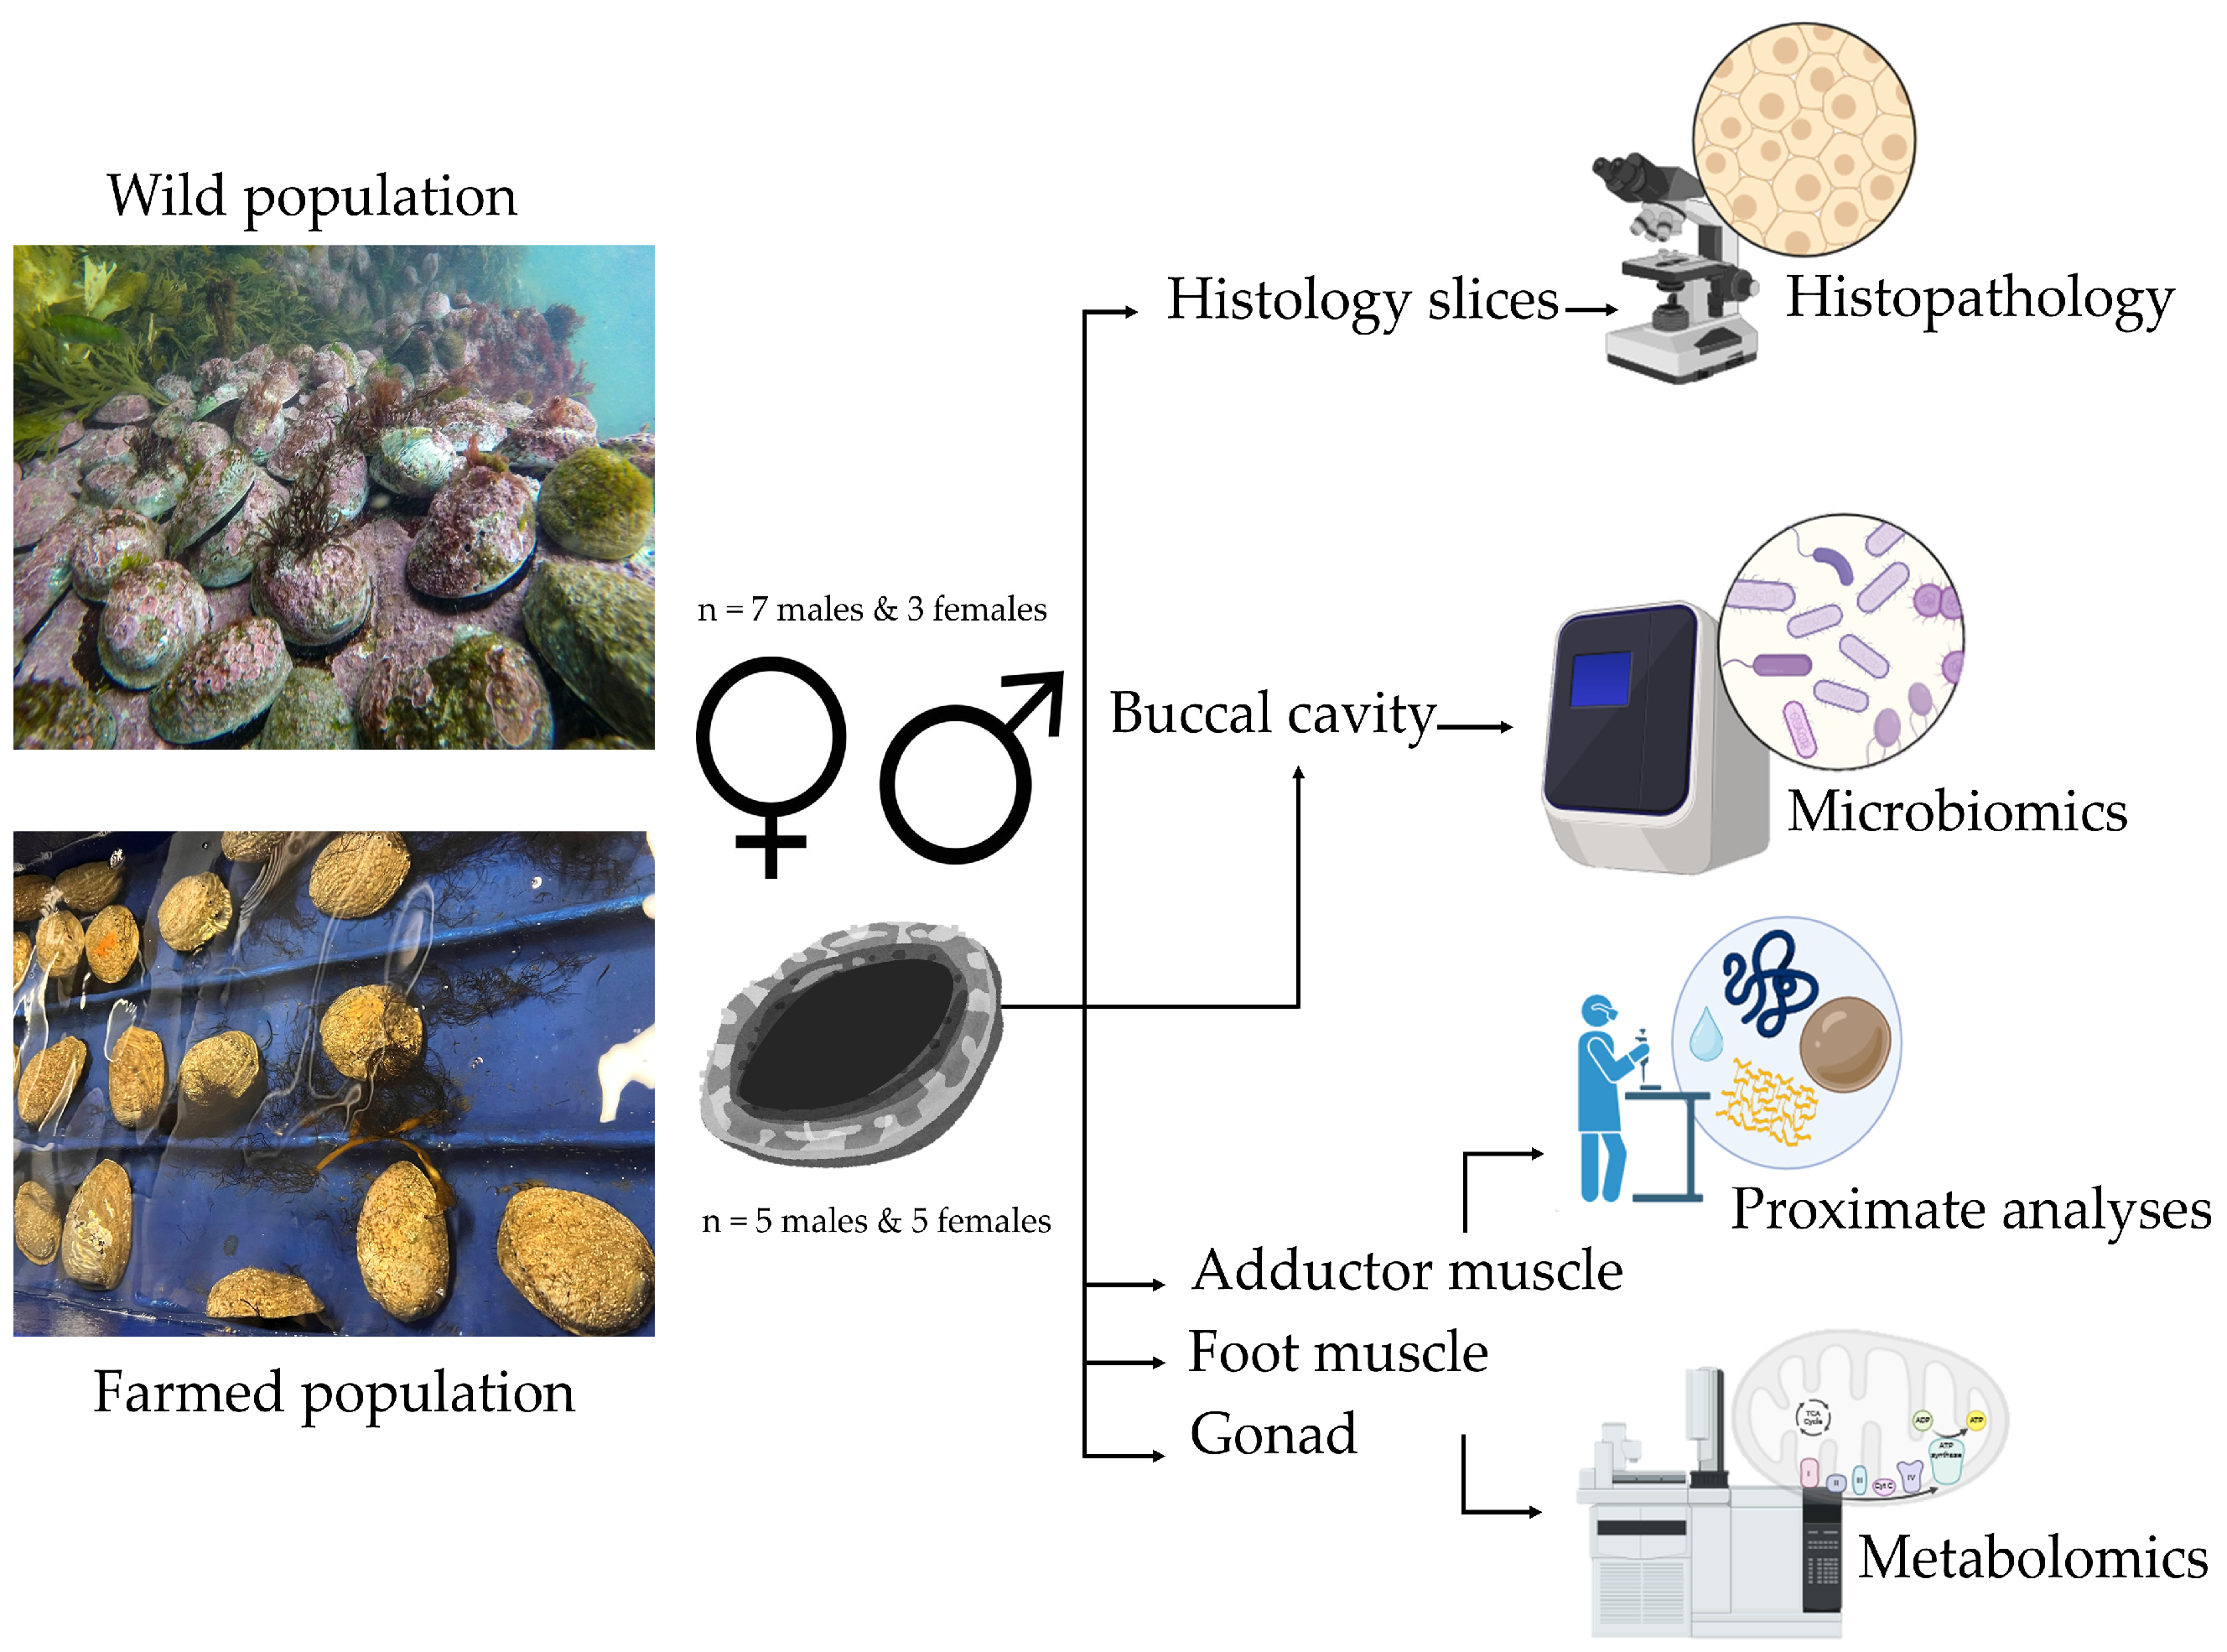
Figure 1. Wild and farmed, male and female Haliotis iris individuals were collected and assessed per sex to investigate physiological profiles of selected tissue via histopathology, microbiomics, proximate analyses, and metabolomics assessments.
Fishes 10 00566 g001
Figure 2. Histopathology results of Haliotis iris: (1) oocytes as photomicrographs of (a) normal oocyte tissue and (b) signs of atresia (arrows indicating oocytes), and (c) graphs with quantified oocytes counts (* illustrating statistical significance); (2) digestive gland as photomicrographs of (a) good and (b) poor quality digestive gland, and (c) graphs summarising digestive gland scores; (3) ciliates detected in gills as photomicrographs illustrating (a) farmed broodstock with fewer ciliates, (b) a higher ciliate density in wild broodstock (arrows indicating ciliates), and (c) graph summarising ciliate counts in male and female farmed and wild broodstock (* illustrating statistical significance).
Fishes 10 00566 g002
Figure 3. Microbiome assessments as (a) Venn diagrams showing the shared and unique bacterial ASVs (%) between the wild and farmed abalone; (b) principal coordinate analysis (PCoA) plots showing the bacterial composition between the wild and farmed abalone; and (c) Box plots showing the Chao1 richness and Shannon’s diversity index across samples collected from adult wild and farmed abalone. The alpha-diversity estimators were calculated at the bacterial ASV level. (* illustrating statistical significance).
Fishes 10 00566 g003
Figure 4. Microbiome findings depicted as (a) relative abundance of the most abundant bacterial phyla observed in abalone buccal cavity and (b) core microbiota heatmap for the buccal cavity samples collected from the wild and farmed abalone.
Fishes 10 00566 g004
Figure 5. Proximate composition determined as protein (ac), fat (df), fibre (gi), moisture (jl), and ash (mo) (% dry mass) measured in the adductor muscle (left column), foot muscle (middle column), and gonad (right column) tissue dissected from female and male Haliotis iris collected from farmed and wild sources (statistical significance for one factor is indicated by the * and for the second factor by the **).
Fishes 10 00566 g005
Figure 6. Principal component analysis score plots of (a) gonad-, (b) adductor muscle-, and (c) foot muscle-detected metabolites from wild (●) and farmed (∎) Haliotis iris populations.
Fishes 10 00566 g006
Figure 7. Overview of increased (↑) or decreased (↓) metabolite response of farmed Haliotis iris population (compared to wild stocks) as metabolites detected in the adductor muscle (A), foot muscle (F), and gonad (G) tissues.
Fishes 10 00566 g007
Table 1. Proximate composition (% dry mass-crude protein, fat, crude fibre, moisture, and ash) of adductor muscle, foot muscle, and gonad tissues collected from wild and farmed female and male Haliotis iris. Bold numbers indicate statistically significant (p < 0.05) effects of group and sex.
Two-Away ANOVA
ParameterTissueGroupSexGroup × Sex
Crude protein (%)Adductor muscle0.0020.7480.061
Foot muscle0.0070.8670.471
Gonad0.0510.0170.333
Fat (%)Adductor muscle4.83 × 10−50.0180.204
Foot muscle0.61610.153
Gonad0.0560.0160.141
Crude fibre (%)Adductor muscle0.5110.7040.34
Foot muscle0.0980.0590.813
Gonad0.2250.9540.725
Moisture (%)Adductor muscle0.3070.2230.439
Foot muscle0.3910.1370.303
Gonad0.1920.9470.766
Ash (%)Adductor muscle0.5220.5500.462
Foot muscle0.4400.5770.982
Gonad0.6060.0110.137
Disclaimer/Publisher’s Note: The statements, opinions and data contained in all publications are solely those of the individual author(s) and contributor(s) and not of MDPI and/or the editor(s). MDPI and/or the editor(s) disclaim responsibility for any injury to people or property resulting from any ideas, methods, instructions or products referred to in the content.