Article

Modeling Dress-Out Traits Based on Morphological Traits in the Siberian Prawn, Exopalaemon modestus (Heller, 1862)

College of Fisheries, Xinyang Agriculture and Forestry University, Xinyang 464000, China
*
Authors to whom correspondence should be addressed.
Fishes 2025, 10(10), 534; https://doi.org/10.3390/fishes10100534
Submission received: 8 September 2025 / Revised: 16 October 2025 / Accepted: 20 October 2025 / Published: 21 October 2025
(This article belongs to the Section Aquatic Invertebrates)

Abstract

Dress-out traits, such as abdominal meat weight and abdominal meat percentage, are difficult to improve through direct selection in aquatic species due to the lack of reliable measurement methods. To facilitate the prediction of these traits from morphological characteristics in live prawn, Exopalaemon modestus, a total of 518 individuals were collected in 2025 from Suyahu Reservoir in the upper Huaihe River, China. After excluding individuals with incomplete appendages and egg-bearing females, 301 prawns were randomly selected for model development, and the remaining 60 were used for validation. Based on integrated grey relational analysis and path analysis, body mass was identified as the most effective predictor of abdominal meat weight (p < 0.01), explaining 92.1% of the variation when used as the sole variable in the model. Residual analysis and cross-validation confirmed the adequacy and applicability of the abdominal meat weight model. In contrast, morphological traits exhibited low explanatory power for abdominal meat percentage, with all traits together explaining only 19.2% of the variance, indicating their inability to effectively predict this trait. Therefore, in breeding programs for E. modestus, indirect improvement in abdominal meat weight can be achieved via direct selection for increased body mass. However, abdominal meat percentage is not recommended as a target trait for genetic improvement.
Key Contribution: Body mass was established as the key predictor of abdominal meat weight in Exopalaemon modestus, achieving an R2 value of 0.921, which indicates that the model accounts for the majority of the variation. In contrast, abdominal meat percentage exhibited no reliable association with morphological traits and could not be effectively predicted using body measurements.

1. Introduction

Dress-out traits, especially abdominal meat weight and abdominal meat percentage, are economically important traits since they directly influence the meat product yield, quality grade, consumer preference, and therefore profitability. Several aquaculture breeding organizations have evaluated and incorporated these traits in their breeding goals [1]. In selective breeding, heritability, which is the proportion of total phenotypic variance in a trait attributed to additive genetic effects, is a crucial parameter for anticipating selection response. Heritability is one of the most important conventional means for evaluating the genetic variation of populations. To date, research for estimating heritabilities has been conducted in a multitude of aquaculture species. For example, in Procambarus clarkii, estimates of heritability were medium for abdominal meat weight (0.20–0.26) and dress-out percentage (0.21–0.30) [2]; in Litopenaeus vannamei, heritabilities for tail weight and tail weight percentage were estimated at 0.16 and 0.12, respectively [3]. Similar studies have been reported in some fish species. In Oncorhynchus kisutch, the heritability estimates were low for total fillet weight (0.18) and fillet percentage (0.11) [4]; while in Oreochromis niloticus, the heritability estimates were moderate for the fillet weight (0.23) and fillet yield (0.32) [5]. Overall, the heritability of dress-out traits was low to medium, indicating that a selective breeding program can effectively improve dress-out traits in aquatic animals. Vandeputte et al. [6] reported that the genetic gain for fillet percentage varied from 0.38% to 0.57% per generation in Dicentrarchus labrax under the hypothetical mass selection. However, a major challenge is that phenotypic values for dress-out traits cannot be measured directly on live animals. Obtaining accurate data requires the slaughter of a large number of individuals, which increases costs and reduces the number of candidates available for selection.
As an alternative to slaughter, studies have used various analytical methods to develop equations predicting dress-out traits based on highly correlated morphological traits. Accurate prediction could enable indirect selection for these traits without slaughtering the selection candidates. For instance, equations using body mass yielded R2 values of 0.97–0.98 for fillet weight in Lates calcarifer populations, while models for fillet yield incorporating 3–4 morphological traits showed much lower R2 values (0.15–0.28) [7]. In O. niloticus, the R2 for fillet weight was 0.95 compared to 0.15 for fillet yield [8]. Similarly, in Macrobrachium nipponense [9], models predicting abdominal meat weight from body mass achieved high R2 values (0.952 for females, and 0.949 for males), whereas models for abdominal meat percentage were far less accurate (0.128 for females, and 0.109 for males). By contrast, fillet (or meat) yield prediction showed higher potential in Pangasianodon hypophthalmus (R2 = 0.86) [10] and M. rosenbergii (R2 = 0.91) [11]. Collectively, these studies demonstrate that fillet (or meat) weight is effectively predicted from body traits, while prediction accuracy for fillet (or meat) yield percentages based on morphological traits that vary by species.
The freshwater prawn Exopalaemon modestus (Heller, 1862) belongs to the Palaemonidae family, and is naturally distributed from the Amur River, Siberian Russia, to Korea, China, and Taiwan [12], especially in the middle and lower reaches of the Yangtze River in southern and southeastern China [13]. Because of its tender meat, unique flavor, and high nutritional value, it has a high consumer demand. However, in recent years, the capture production of E. modestus has sharply declined, falling from 98 thousand tonnes in 2019 to 48 thousand tonnes in 2022 [14]. This drastic decline underscores the urgent need for enhanced natural resource protection and germplasm degeneration prevention. Genetic improvement information, which is essential for the sustainable management of E. modestus, remains limited. Additionally, the relationships between dress-out traits and morphological traits have yet to be reported for this species. In this study, we firstly estimated the contribution of morphological traits to dress-out traits and identified effective indicators influencing the dress-out traits using grey relational analysis and path analysis, and then established reliable prediction models based on the results of path analysis. This study would provide new insights into reliably projecting dress-out traits, contributing to the genetic improvement, fishery resource development, and management in E. modestus and other crustacean species.

2. Materials and Methods

2.1. Sample Collection

E. modestus was collected from the Suyahu Reservoir (the upper reaches of the Huaihe River, China) in May 2025. Suyahu Reservoir is the largest plain artificial lake in Asia and regulates a drainage area of 4498 km2. A total of 518 samples were collected from 9 sites (Figure 1, Table S1). After excluding specimens with incomplete appendages and egg-bearing females, 361 prawns were used for subsequent body measurements.

2.2. Trait Measurement

Approximately half an hour before slaughter, all the test prawn were killed by cold shock using ice. They were then washed and dried with absorbent paper, after which individual prawns were weighed to record body mass (BW) using a digital scale (Meilen: Shenzhen Mobil Electronics Co., Ltd., Shenzhen, China) with a precision of 0.01 g. Body length (BL), rostrum length (RL), carapace length (CL), carapace width (CW), carapace height (CH), abdominal length (AL), abdominal width (AW), abdominal height (AH), caudal fan length (FL), caudal fan width (FW), telson length (TeL), telson width (TeW), and telson height (TeH) were measured with IP54 digital display Vernier calipers (Syntek: Deqing Shengtaixin Electronic Technology Co., Ltd., Huzhou, China) to the nearest 0.01 mm. Immediately after body measurements and data recording, the cephathorax and exoskeleton of individual prawns were manually removed to record abdominal meat weight (AMW). Abdominal meat percentage (AMP) was computed as the percentage of abdominal weight divided by body mass.

2.3. Grey Relational Analysis

According to grey system theory [15], the dress-out trait (i.e., AMW or AMP) and 14 morphological traits were selected to be a grey system. The dress-out trait was reference sequences (X0), while the 14 morphological traits were comparison sequences (Xi, i = 1, 2, 3,…, 14).
The grey relational analysis was performed using Microsoft Excel (Microsoft Office 2019). Because the different influence factors have varying dimensions, the initial step involved linear normalization of raw data. The data preprocessing was performed by the following equation:
X i = X i X i ¯ σ
where X i is the value after standardization; X i is the value of each morphological traits; X i ¯ is the average value of X i ; σ is the standard deviation of X i ; and i is the morphological traits number (i = 1 to 14).
Then, the grey relational coefficient was calculated as
ξ i = min i + ρ max i i + ρ max i
where ξ i is the grey relational coefficient, which is the relationship between the best and the actual normalized data; i is the absolute values between reference sequence and comparison sequences, i = X 0 X i ; m i n i and m a x i are the minimum and the maximum value of the second level, respectively; and ρ is the distinguishing coefficient (ρ = 0.5).
Finally, the grey relational grade was calculated as follows:
r i = 1 n n ξ i
where r i is the grey relational grade, and n is the number of performance characteristics (n = 301).

2.4. Path Analysis

The direct path coefficients (path coefficient, P) can be obtained directly, as described by Du and Chen [16]. The determination coefficient was calculated using the formulas:
d i = P i 2
d i j = 2 r i j P i P j
D i = d i + d i j
where di is the direct determination of ith trait on the dress-out trait; dij is the co-determination of ith trait on the dress-out trait through the jth trait (ij); Pi and Pj are, respectively, the path coefficients of ith and jth traits on the dress-out trait; rij is the correlation coefficient between ith and jth traits on the dress-out trait; and Di is the overall determination of ith trait on the dress-out trait.
The multiple regression equation for dress-out trait (Y) was calculated as follows:
Y = a + b 1 X 1 + b 2 X 2 + b 3 X 3 + + b i X i
where Y is the dependent variable, a is the intercept, Xi are the independent variables, and bi are the partial regression coefficients for Xi on Y. Software SPSS 20.0 was used for path analysis and linear regression analysis.

2.5. Model Adequacy Checking and Cross-Validation

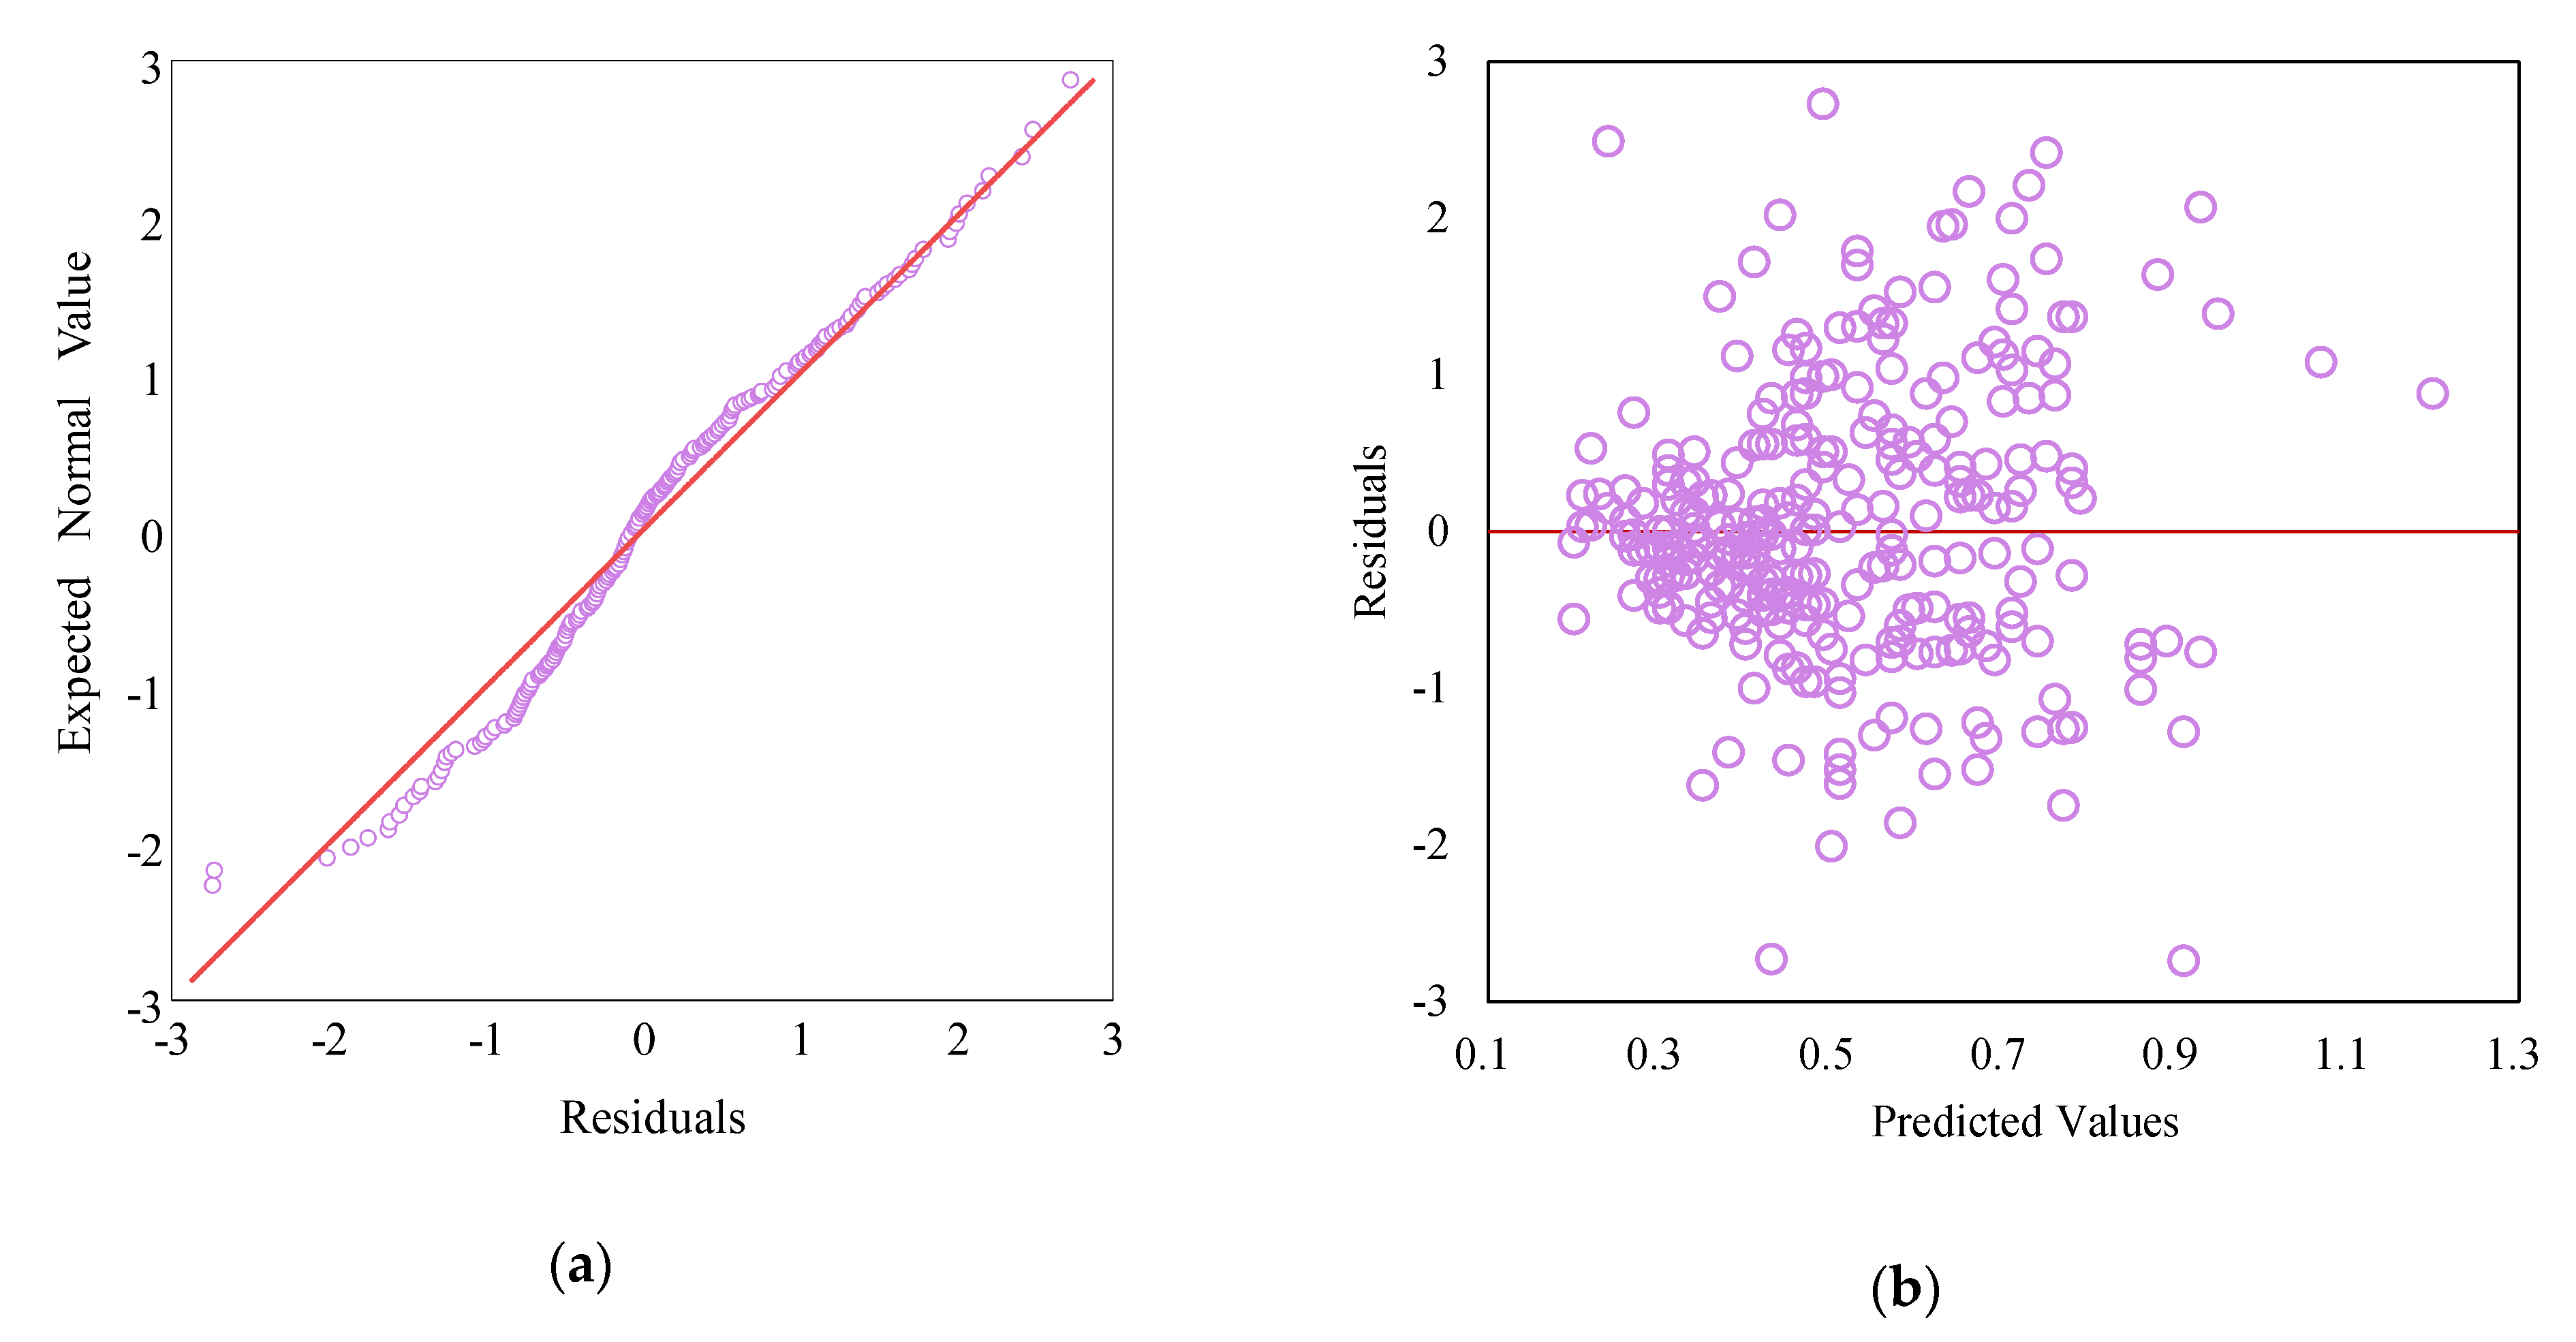
The assessment of model goodness of fit and adherence to statistical assumptions was conducted through an analysis of residuals, defined as the difference between the observed and predicted values. Specifically, we generated and inspected two diagnostic plots: a normal probability plot of the residuals to evaluate normality, and a plot of the residuals versus the predicted values to evaluate homoscedasticity. For the model to be considered adequate, we required the normal probability plot to approximate a straight line, indicating normally distributed residuals.
Furthermore, the holdout sample was taken to cross-validate the accuracy and reliability of the models, and the shrinkage on cross-validation correlation was computed to measure the predictive ability and applicability of the models. In this study, a random subset of 301 individuals divided from all samples was selected for the training group, while the remainder served as the holdout sample. The prediction Equation (7) for the training group was used to compute predicted values for the holdout sample, then the squared multiple correlation (R2∗) between these predicted values and the actual observed values in the holdout sample was computed. The cross-validation correlation is defined as the difference between R2 and R2∗.
To evaluate the predictive ability of the developed equations on new data, a cross-validation procedure was performed. In the cross-validation, a random subset of 301 individuals was selected from the entire sample to form the training group, while the remainder constituted the holdout sample. The prediction equation derived from the training group (7) was applied to the holdout sample to generate predicted values. The squared multiple correlation coefficient (R2∗) between these predicted values and the actual observed values in the holdout sample was then computed. The shrinkage on the cross-validation is defined as the difference between the R2 from the training sample and the R2∗ from the holdout sample.

3. Results

3.1. Statistical Analysis of Morphological and Dress-Out Traits in E. modestus

The mean, SD, and CV for the 14 morphological traits and dress-out traits of E. modestus are shown in Table 1. The average BW of E. modestus was 1.08 ± 0.36 g for the training group and 1.04 ± 0.34 g for the holdout sample, with a corresponding AMW of 0.51 ± 0.18 g and 0.49 ± 0.18 g, and AMP of 46.39 ± 4.46% and 46.62 ± 4.68%, respectively. The CV for AMW and BW exceeded 30%, significantly surpassing those of the other traits. In contrast, AMP exhibited the lowest CV values at 9.61% and 10.04%, respectively.

3.2. Correlation Coefficients Between Morphological and Dress-Out Traits in E. modestus

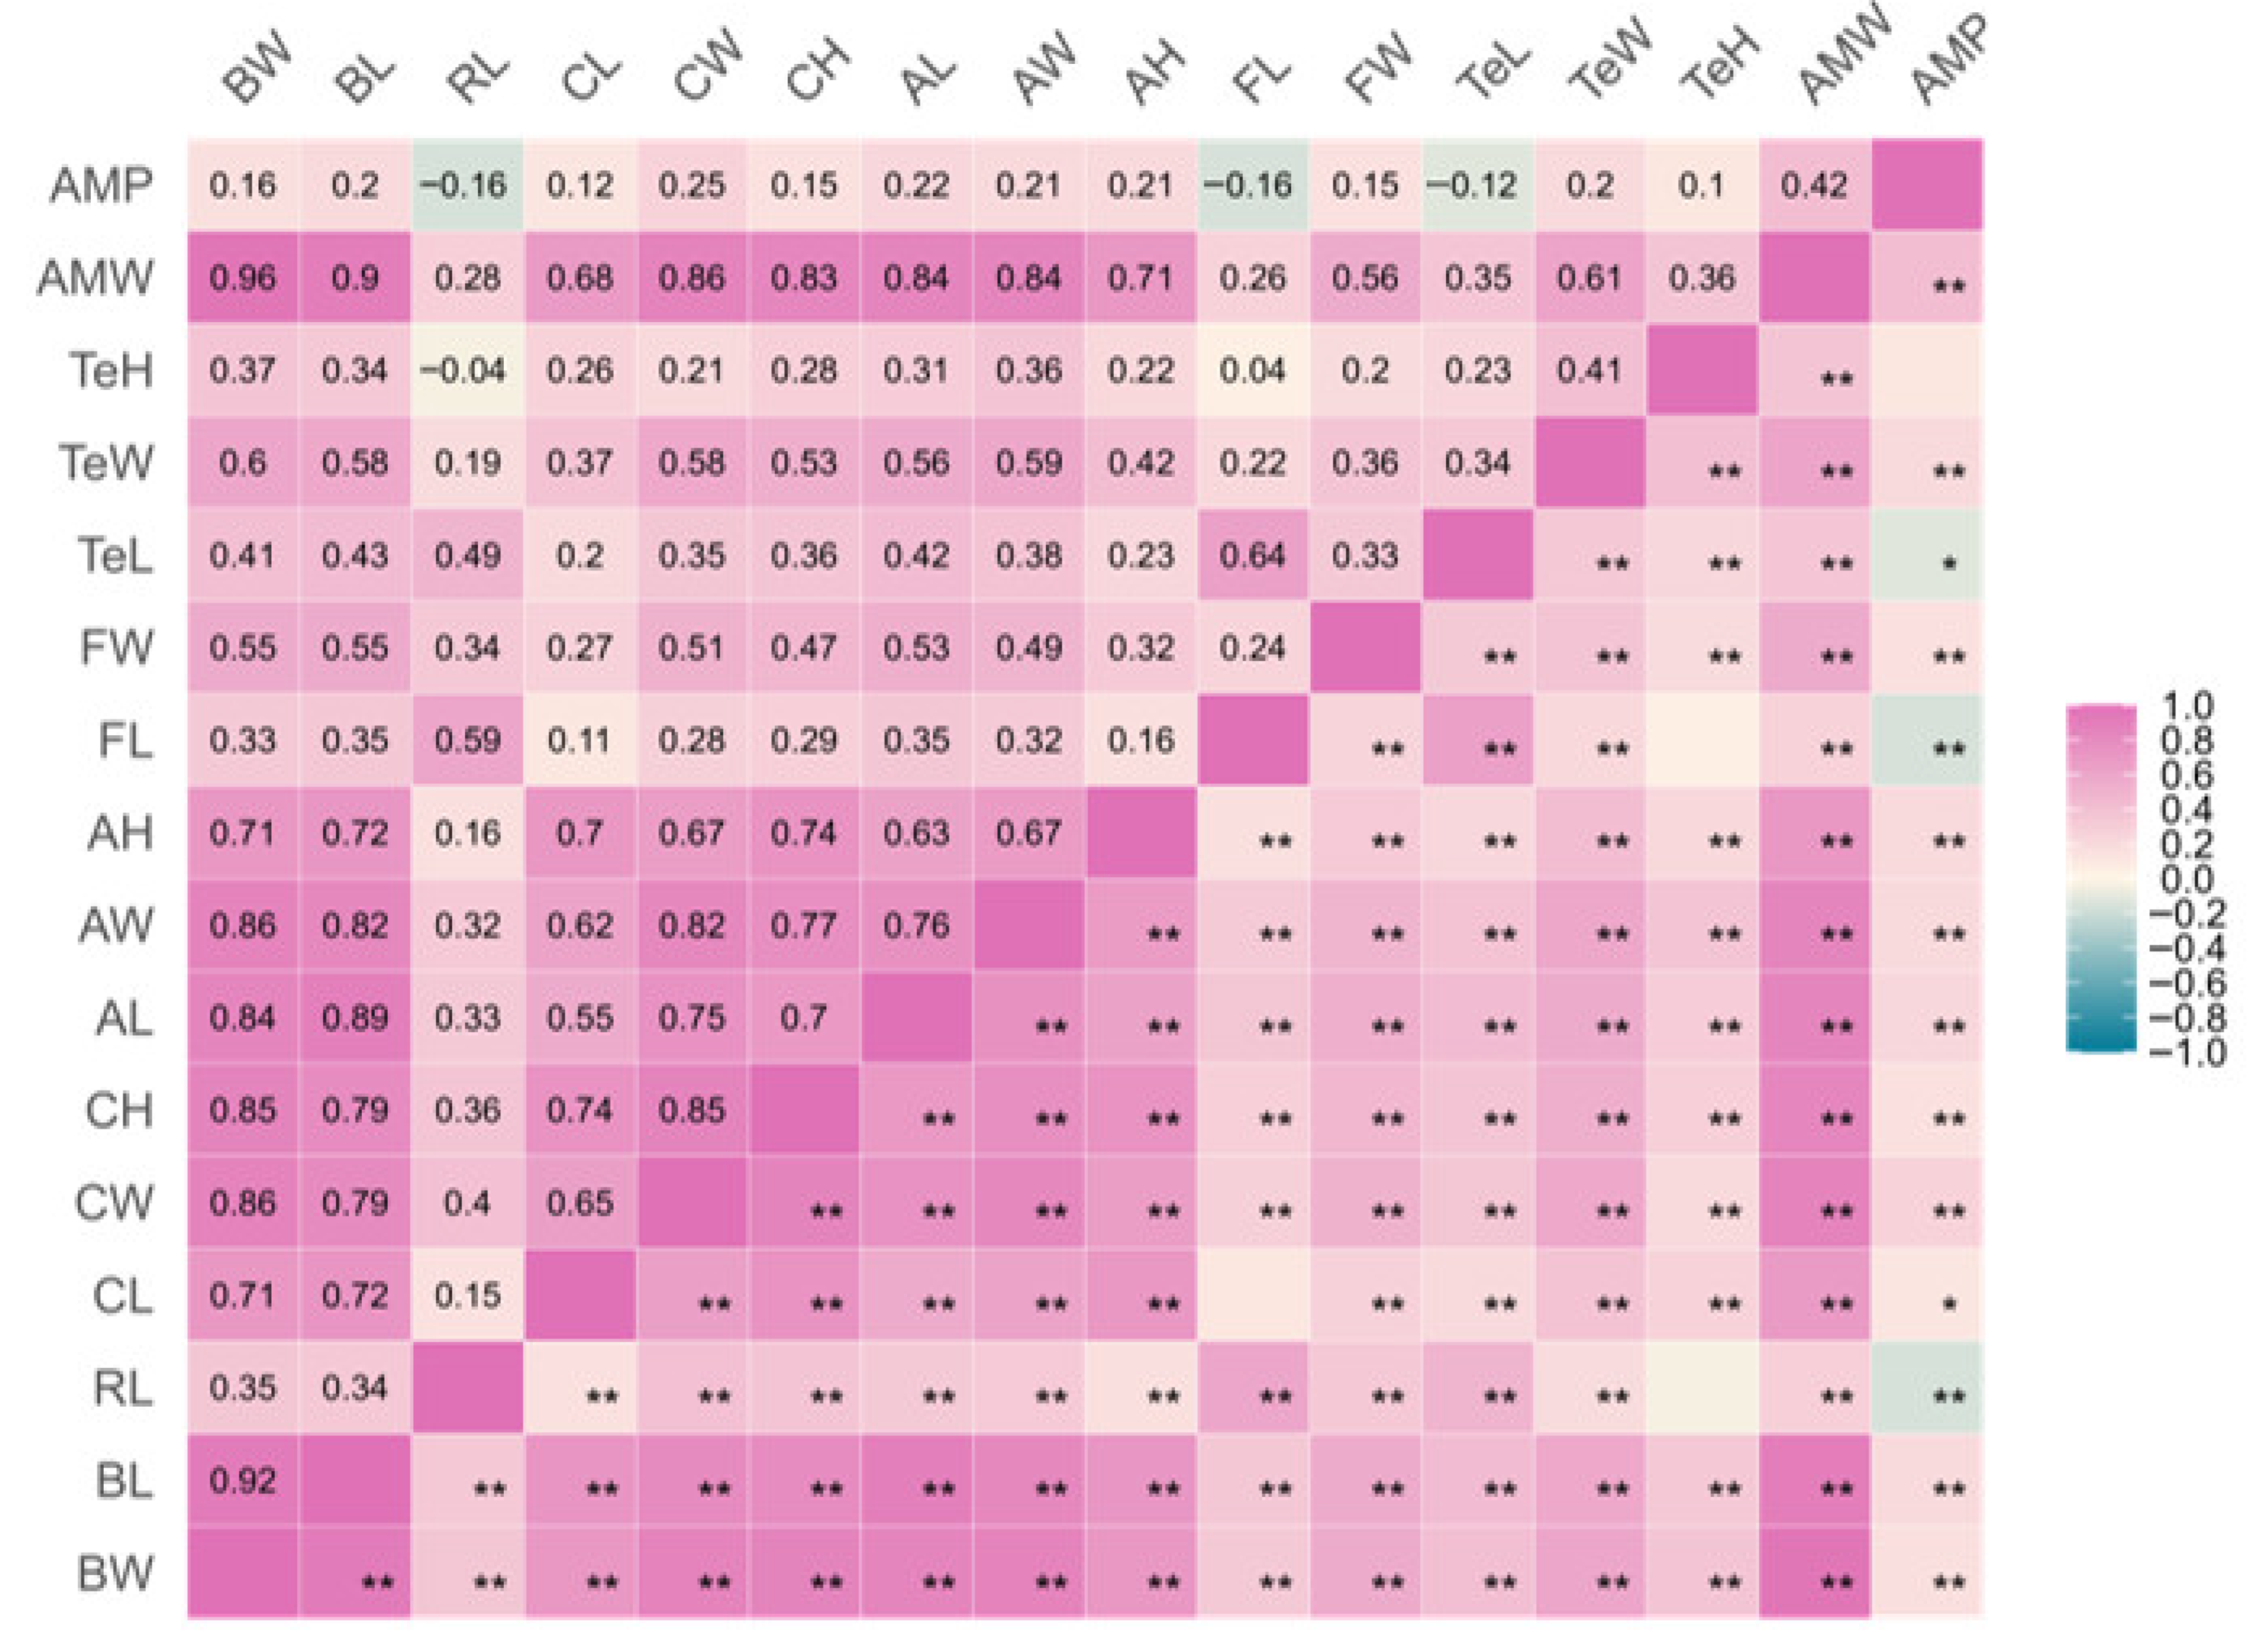
The correlation coefficients between morphological and dress-out traits in E. modestus are shown in Figure 2. Significant positive correlations (r = 0.26–0.96) were detected between morphological traits and AMW (p < 0.01). With the exception of TeH, all morphological traits showed significant correlations with AMP (p < 0.05 or p < 0.01), although these correlations were generally weak in magnitude, ranging from −0.16 to 0.25. Additionally, a moderate correlation (r = 0.42) was observed between AMW and AMP (p < 0.01).

3.3. Grey Relational Analysis of Morphological Traits on Dress-Out Traits in E. modestus

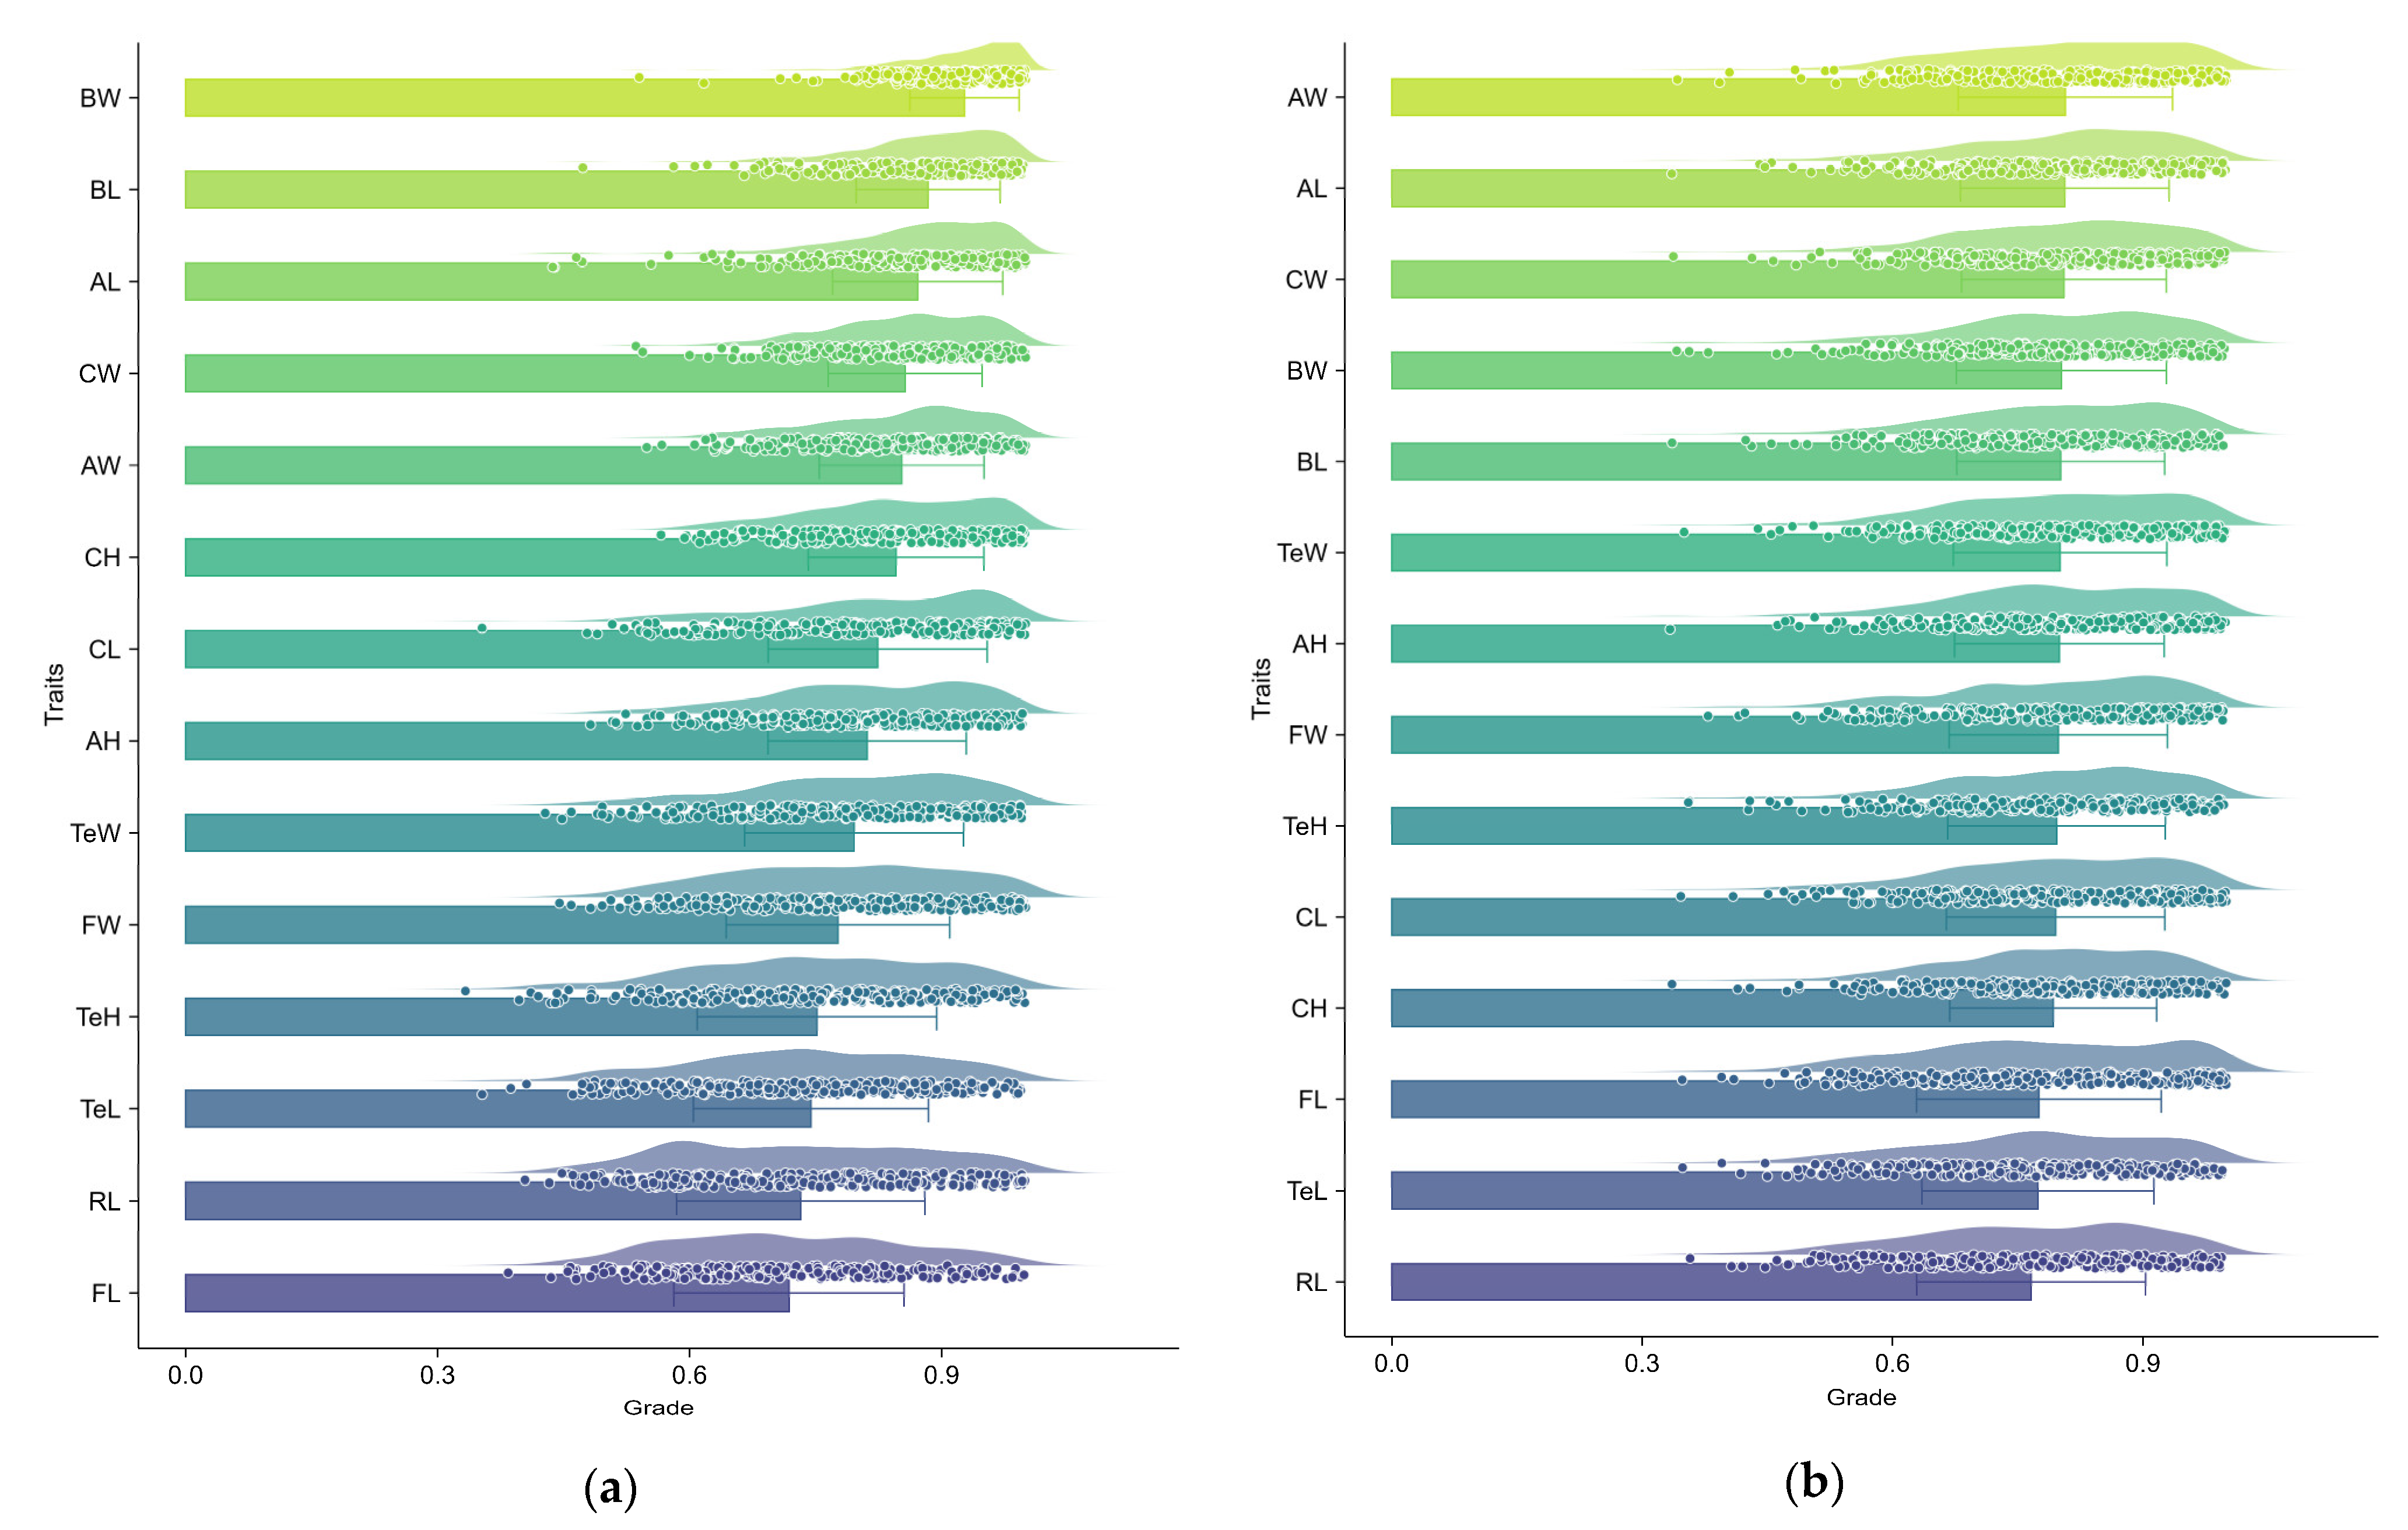
Figure 3 presents the grey relational grade of morphological traits on dress-out traits in E. modestus. The relational grade of the traits on AMW ranged between 0.718 and 0.927. The main factors affecting the AMW of E. modestus were BW, BL, AL, CW, AW, CH, CL, and AH, followed by TeW, FW, TeH, TeL, RL, and FL. The grey correlation grade for AMP varied from 0.766 to 0.807, with the order of correlation being AW > AL > CW > BW > BL > TeW > AH > FW > TeH > CL > CH > FL > TeL > RL. Although the top five morphological features with the highest grey correlation rankings for AMW and AMP were the same, their specific rankings differed.

3.4. Path Analysis of Morphological Traits on Dress-Out Traits in E. modestus

Path coefficients and variance inflation factors (VIFs) of morphological traits on dress-out traits in E. modestus are presented in Table 2. BW and CW exhibited significant positive effects on AMW (p < 0.01). In contrast, RL showed a significant negative effect on AMW (p < 0.01). Furthermore, CW demonstrated a highly significant positive effect on AMP (p < 0.01), whereas BW, RL, and TeL had significantly negatively effects on AMP (p < 0.05 or p < 0.01). Values of the VIF of BW and BL were both greater than 10, indicating that there may be a strong multicollinearity.
The direct, indirect, and total determinations of morphological traits on dress-out traits in E. modestus are summarized in Table 3. The total determination coefficient of BW on AMW was 0.664, indicating a highly significant positive impact (p < 0.01). In contrast, its effect on AMP was −0.336, showing a highly significant negative influence (p < 0.01). Among other morphometric traits, the determination of BL on AMW was 0.121 (p < 0.05), while that of CW on AMP was 0.102 (p < 0.01).

3.5. Regression Analysis of Morphological Traits on Dress-Out Traits in E. modestus

Based on the results of the determination coefficient and VIF, only BW was retained to construct the regression equation of AMW. The equation was as follows:
AMW = −0.019 + 0.484BW (R2 = 0.921, adjusted R2 = 0.921)
The coefficient of the regression equation for AMW was significative (p < 0.01). The relationship between observed and predicted values is visualized in Figure 4a. The Pearson correlation between observed and predicted values of AMW was 0.972, demonstrating that the model provided an adequate approximation to the true values of AMW.
The cumulative determinations of all morphological traits on AMP were below 0.85 (Table 3), suggesting the presence of other important influential traits on AMP that were not covered in this study. Moreover, the complete model incorporating all morphological traits for AMP yielded an R2 of 0.230 and an adjusted R2 of 0.192. Figure 4b illustrated that utilizing all morphological traits was inadequate for predicting AMP, contrasting sharply with the model’s fit for AMW in Figure 4a. Consequently, the regression equation for AMP was not provided.

3.6. Model Validation and Cross-Validation for the AMW Trait in E. modestus

The normal probability plot of residuals and the residual plots versus the predicted values for the model of AMW are shown in Figure 5a,b, respectively. The residuals are adjacent to the straight line, and there is no deviation from the straight line (Figure 5a). Moreover, there are no outlier points, and the plot shows a normal distribution of errors. The externally Studentized residuals of AMW were randomly scattered between −3 and 3, indicating no relationship between the residuals and the predicted values of AMW (Figure 5b). The squared multiple correlation R2∗ on the holdout sample was 0.914. The shrinkage on cross-validation was 0.007.

4. Discussion

Abdominal muscle is the main edible part of prawn. A higher dress-out trait involves a higher production of the edible portion, and they are more interesting for producers, directly influencing their profitability. Consequently, the economic value of prawns is determined by abdominal meat weight. Due to smaller size, E. modestus, in our study, exhibited lower abdominal meat weight (0.51 g) than reported values for other freshwater species; e.g., M. rosenbergii (11.9 g) [11], P. clarkii (5.07–5.58 g) [2,17], and M. nipponense (0.69–0.75 g) [9]. Interestingly, the abdominal meat percentage of E. modestus (46.39%) was much higher than that of M. rosenbergii (36.7%) [11], M. nipponense (33.94–34.67%) [9], and P. clarkii (14.15–15.58%) [2,17]. This pattern likely occurs because larger prawn exhibit proportionally larger cephalothoraxes (head), exoskeletons, and claws. For instance, dressing percentage with and without exoskeletons in M. rosenbergii was 45.7% and 36.7%, respectively [11], demonstrating how exoskeletons mass reduces edible yield.
Abdominal meat weight had the largest coefficient of variation (35.29%), which can provide sufficient material for sustained improvement of the breeding process. However, abdominal meat weight cannot be measured in live animals. Previous studies have suggested that abdominal meat weight can be predicted by morphological traits [9,11]. A correlation analysis indicated that all 14 morphological traits were significantly correlated with abdominal meat weight in E. modestus. Of all morphometric traits, the correlation coefficients of BW, BL, and CW with abdominal meat weight were all higher than 0.85. Prediction of abdominal meat weight with body measurements was therefore feasible.
Correlation analysis can reveal associations between morphological traits and abdominal meat weight, but it does not establish direct causality in the selective breeding. Grey relational analysis is an analytical method based on the development trend of the curve shape on each factor [18], and is particularly suitable for handling poor, incomplete, and uncertain information [19]. More recently, grey relational analysis was used to assess multi-indicator relationships in aquatic animals [20,21,22,23]. For instance, Li et al. [22] employed grey relational analysis to evaluate the correlation between morphological traits and body mass of P. clarkii in different culture models, while Liu et al. [23] used grey relational analysis to analyze the relationships between morphological traits and body mass across different geographical populations of M. nipponense. Thus, grey relational analysis has proven to be a reliable and effective method of assessing the complex interrelationships among multiple factors. In this study, grey relational analysis identified BW as the trait most strongly associated with abdominal meat weight in E. modestus. This finding is consistent with path analysis studies in M. nipponense [9] and P. clarkii [17], which also highlighted a strong relationship between abdominal meat weight and body mass. Path analysis is a powerful and simple tool used to quantify the relative contributions of causal variables within a predefined network of relationships (path diagram) [24]. Path analysis in this study further confirmed the dominant role of BW, showing both the highest direct path coefficient (0.719) and total determination coefficient (0.664). The consistency between the two analytical approaches underscores body weight as a pivotal trait for improving abdominal meat yield, suggesting that selection for larger body size is an effective breeding strategy in E. modestus.
In this study, the total determination coefficient, which integrates both direct and indirect effects, was employed to identify predictive variables for dress-out traits in E. modestus. Only BW and BL showed significant total determination coefficients with abdominal meat weight (0.664 and 0.121, respectively; p < 0.05). However, VIFs for both traits exceeded 10 (11.283 for BW, and 11.564 for BL), indicating strong multicollinearity. Given BW’s substantially higher determination coefficient and relatively lower VIF, BL was excluded from the final model. The resulting regression model based solely on BW explained 92.1% of the variation in abdominal meat weight (R2 = 0.921), demonstrating strong predictive ability. This result aligns with findings in M. nipponense, where BW-based models achieved R2 values of 0.949–0.952 [9]. Moreover, the results of model adequacy checking and cross-validation showed the adequacy and applicability of our models. An alternative approach for modeling dress-out traits is stepwise regression. However, this method often incorporates numerous traits, including some that are difficult to measure, which can limit its practical applications. For example, the meat weight model developed by Rutten et al. [11] for M. rosenbergii included three body traits (body mass, total length, and abdominal width), while Zhang et al. [8] used five body measurements (body mass, length, height, width, and fillet length) to predict fillet weight in tilapia (R2 = 0.95). In contrast, the model proposed in this study relies solely on BW, a trait that is both straightforward and efficient to measure under field conditions, thereby offering substantial advantages for practical application.
Abdominal meat percentage, a ratio trait, showed only weak correlations with all morphological traits (r = −0.16 to 0.25). Although path analysis indicated CW and BW as significant factors, their determination coefficients were low (0.102 and −0.336, respectively), and the full model’s explanatory power was limited (adjusted R2 = 0.192). This indicates that over 80% of the variation in abdominal meat percentage remains unaccounted for by morphological traits. This limited predictability aligns with converging results in other species [7,8,17,25,26,27], with only a few exceptions [10,11]. In E. modestus, abdominal meat weight increases with body mass, but the abdominal meat percentage remains constant, thus limiting its direct genetic improvement through morphological trait selection.

5. Conclusions

This study indicated that body mass is the most significant predictor of abdominal meat weight in E. modestus. Conversely, the abdominal meat percentage exhibited weak correlations with morphological traits, and the models developed to predict it based on these traits exhibited low explanatory power. The BW-based model developed enables non-destructive estimation of abdominal meat weight in live E. modestus, providing a practical tool to expedite genetic improvement in nucleus herds and enhance commercial production.

Supplementary Materials

The following supporting information can be downloaded at https://www.mdpi.com/article/10.3390/fishes10100534/s1; Table S1: Sample sites and numbers of E. modestus in Suyahu Reservoir.

Author Contributions

Conceptualization, L.Z., Z.H. and J.L.; methodology, L.Z.; software, Z.H.; validation, L.Z., Z.H. and J.L.; formal analysis, L.Z. and Z.H.; investigation, Z.H., C.D. and R.Z.; resources, X.G.; data curation, C.D. and R.Z.; writing—original draft preparation, L.Z.; writing—review and editing, J.L.; visualization, J.L. and Z.H.; supervision, X.G.; project administration, X.G.; funding acquisition, X.G. All authors have read and agreed to the published version of the manuscript.

Funding

This research was funded by the Natural Science Foundation of Henan, grant number 252300421681; the Key Scientific Research Project of Colleges and Universities in Henan Province, grant number 24B240001; the Youth Scholars Foundation of Xinyang Agriculture and Forestry University, grant number QN2021019; the Innovative Research Team of Dabie Mountains Fishery Resources Exploitation and Utilization in Xinyang Agriculture and Forestry University, grant number XNKJTD-015; the Aquatic Seed Industry Research Project in Henan Province; and the Investigation of Aquatic Biodiversity and Environmental Conditions in Key Waters of Henan Province.

Institutional Review Board Statement

The animal study protocol was approved by the Ethics Committee of Xinyang Agriculture and Forestry University (protocol code: XYNL-2025-0052; approval date: 2 April 2025).

Informed Consent Statement

Not applicable.

Data Availability Statement

The original contributions presented in this study are included in the article. Further inquiries can be directed to the corresponding authors.

Conflicts of Interest

The authors declare no conflicts of interest.

References

  1. Chavanne, H.; Janssen, K.; Hofherr, J.; Contini, F.; Haffray, P.; Komen, H.; Nielsen, E.E.; Bargelloni, L. A comprehensive survey on selective breeding programs and seed market in the European aquaculture fish industry. Aquac. Int. 2016, 24, 1287–1307. [Google Scholar] [CrossRef]
  2. Wang, H.; Wang, L.; Shi, W.J.; Zhu, C.K.; Pan, Z.J.; Wu, N.; Qiang, J.; Xu, P. Estimates of heritability based on additive-dominance genetic analysis model in red swamp crayfish, Procambarus clarkii. Aquaculture 2019, 504, 1–6. [Google Scholar] [CrossRef]
  3. Campos-Montes, G.R.; Montaldo, H.H.; Armenta-Córdova, M.; Martínez-Ortega, A.; Caballero-Zamora, A.; Castillo-Juárez, H. Incorporation of tail weight and tail percentage at harvest size in selection programs for the Pacific white shrimp Penaeus (Litopenaeus) vannamei. Aquaculture 2017, 468, 293–296. [Google Scholar] [CrossRef]
  4. Neira, R.; Lhorente, J.P.; Araneda, C.; Díaz, N.; Bustos, E.; Alert, A. Studies on carcass quality traits in two populations of Coho salmon (Oncorhynchus kisutch): Phenotypic and genetic parameters. Aquaculture 2004, 241, 117–131. [Google Scholar] [CrossRef]
  5. Garcia, A.L.S.; de Oliveira, C.A.L.; Karim, H.M.; Sary, C.; Todesco, H.; Ribeiro, R.P. Genetic parameters for growth performance, fillet traits, and fat percentage of male Nile tilapia (Oreochromis niloticus). J. Appl. Genet. 2017, 58, 527–533. [Google Scholar] [CrossRef] [PubMed]
  6. Vandeputte, M.; Puledda, A.; Tyran, A.S.; Bestin, A.; Coulombet, C.; Bajek, A.; Baldit, G.; Vergnet, A.; Allal, F.; Bugeon, J.; et al. Investigation of morphological predictors of fillet and carcass yield in European sea bass (Dicentrarchus labrax) for application in selective breeding. Aquaculture 2017, 470, 40–49. [Google Scholar] [CrossRef]
  7. Yenmak, S.; Joerakate, W.; Poompuang, S. Prediction of fillet yield in hatchery populations of Asian sea bass, Lates calcarifer (Bloch, 1790) using body weight and measurements. Int. Aquat. Res. 2018, 10, 253–261. [Google Scholar] [CrossRef]
  8. Rutten, M.J.M.; Bovenhuis, H.; Komen, H. Modeling fillet traits based on body measurements in three Nile tilapia strains (Oreochromis niloticus L.). Aquaculture 2004, 231, 113–122. [Google Scholar] [CrossRef]
  9. Wang, H.; Zhang, Y.; Wang, L.; Guan, T.Y.; Chang, G.L.; Zhao, H.T.; Wu, N. Modeling the relationships of growth and morphometrics to dress-out traits in the oriental river prawn, Macrobrachium nipponense. Aquac. Rep. 2022, 26, 101295. [Google Scholar] [CrossRef]
  10. Sang, N.V.; Thomassen, M.; Klemetsdal, G.; Gjøen, H.M. Prediction of fillet weight, fillet yield, and fillet fat for live river catfish (Pangasianodon hypophthalmus). Aquaculture 2009, 288, 166–171. [Google Scholar] [CrossRef]
  11. Hung, D.; Nguyen, N.H. Modeling meat yield based on measurements of body traits in genetically improved giant freshwater prawn (GFP) Macrobrachium rosenbergii. Aquac. Int. 2014, 22, 619–631. [Google Scholar] [CrossRef]
  12. Oh, C.W.; Suh, H.L.; Park, K.Y.; Ma, C.W.; Lim, H.S. Growth and reproductive biology of the freshwater shrimp Exopalaemon modestus (Decapoda: Palaemonidae) in a lake of Korea. J. Crustac. Biol. 2002, 22, 357–366. [Google Scholar] [CrossRef]
  13. Guo, Z.L.; Wang, X.Q.; Zhang, J.P. On the genus Exopalaemon (Decapoda, Caridea, Palaemonidae) in Guangdong Province, southern China. Crustaceana 2005, 78, 839–850. Available online: https://www.jstor.org/stable/20107552 (accessed on 1 September 2025). [CrossRef]
  14. FAO. Fishery and Aquaculture Statistics—Yearbook 2022; FAO Yearbook of Fishery and Aquaculture Statistics; Food and Agriculture Organization of the United Nations: Rome, Italy, 2025; p. 161. [Google Scholar] [CrossRef]
  15. Deng, J.L. Introduction to grey system theory. J. Grey Syst. 1989, 1, 1–24. [Google Scholar]
  16. Du, J.J.; Chen, Z.W. Carrying out path analysis by linear regression of SPSS. Bull. Biol. 2010, 45, 4–6. [Google Scholar]
  17. Wang, H.; Shi, W.J.; Wang, L.; Zhang, Y.; Zang, N.W.; Xue, C.P.; Chang, G.L.; Wu, N. Genetic determination of processing traits in the red swamp crayfish, Procambarus clarkii (Girard). Aquaculture 2020, 529, 735602. [Google Scholar] [CrossRef]
  18. Du, Z.; Hu, Y.G.; Buttar, N.A. Analysis of mechanical properties for tea stem using grey relational analysis coupled with multiple linear regression. Sci. Hortic. 2020, 260, 108886. [Google Scholar] [CrossRef]
  19. Yu, P.; Li, K. Grey correlation analysis of data on Microsoft Excel. Microcomput. Appl. 2011, 27, 29–30. [Google Scholar] [CrossRef]
  20. Yan, H.G.; Dong, Z.L.; Li, Y.; Ma, T.T.; Luo, H.; Ye, H.; He, W.P. Relationship Between Morphological Traits and Body Weight of Procypris rabaudi by Path Analysis and Grey Correlation Analysis. J. Southwest Univ. (Nat. Sci. Ed.) 2022, 44, 74–81. [Google Scholar] [CrossRef]
  21. Chen, Y.H.; Shao, Z.Y.; Zhou, G.L.; Hu, A.; Ding, H.B.; Li, H.Y.; Dong, Z.G.; Niu, D.H.; Li, J.L. Salinity tolerance assessment of different families of the razor clam Sinonovacula constricta using physiological traits. Aquaculture 2025, 595, 741494. [Google Scholar] [CrossRef]
  22. Li, J.L.; Qin, Q.; Tian, X.; Guo, J.R.; Tang, B.W.; He, Z.G.; Xie, Z.G.; Wang, Y.D.; Wang, D.W. Effects of Different Cultivation Modes on Morphological Traits and Correlations between Traits and Body Mass of Crayfish (Procambarus clarkii). Biology 2024, 13, 395. [Google Scholar] [CrossRef] [PubMed]
  23. Liu, J.H.; Hu, Z.G.; Su, C.Q.; Yang, T.Z.; Li, C.X.; Cheng, H.X.; Tian, Y.; Guo, X.S. Correlations Between Morphometric Traits and Body Mass Among Different Geographical Populations of Wild Macrobrachium nipponense in Upper Reaches of the Huaihe River, China. Fishes 2025, 10, 413. [Google Scholar] [CrossRef]
  24. Yuan, Z.F.; Guo, M.C.; Song, S.D.; Xie, X.L.; Liu, J.J.; Du, J.L.; Dong, X.M. Multivariate Statistical Analysis, 3rd ed.; Science Press: Beijing, China, 2018; pp. 125–142. [Google Scholar]
  25. Chai, Z.; Luan, S.; Luo, K.; Kong, J.; Xu, S.Y. Correlation Analysis of Fillet Yield with Phenotypic Traits for Families from Conservation Population of Litopenaeus vannamei. Prog. Fish. Sci. 2015, 36, 63–70. [Google Scholar] [CrossRef]
  26. Zhang, Q.; Wang, Q.C.; Yu, Y.; Zhang, C.S.; Huang, H.; Li, F.H.; Xiang, J.H. Correlation of morphometric attributes to net weight and fillet yield of Litopenaeus vannamei. Oceanol. Limnol. Sin. 2018, 49, 653–661. Available online: https://ols.iocasjournals.cn/thesisDetails#10.11693/hyhz20171100288&lang=zh (accessed on 1 September 2025). [CrossRef]
  27. Dai, P.; Li, D.Y.; Sui, J.; Kong, J.; Meng, X.H.; Luan, S. Prediction of meat yield in the Pacific whiteleg shrimp Penaeus vannamei. Aquaculture 2023, 577, 739914. [Google Scholar] [CrossRef]
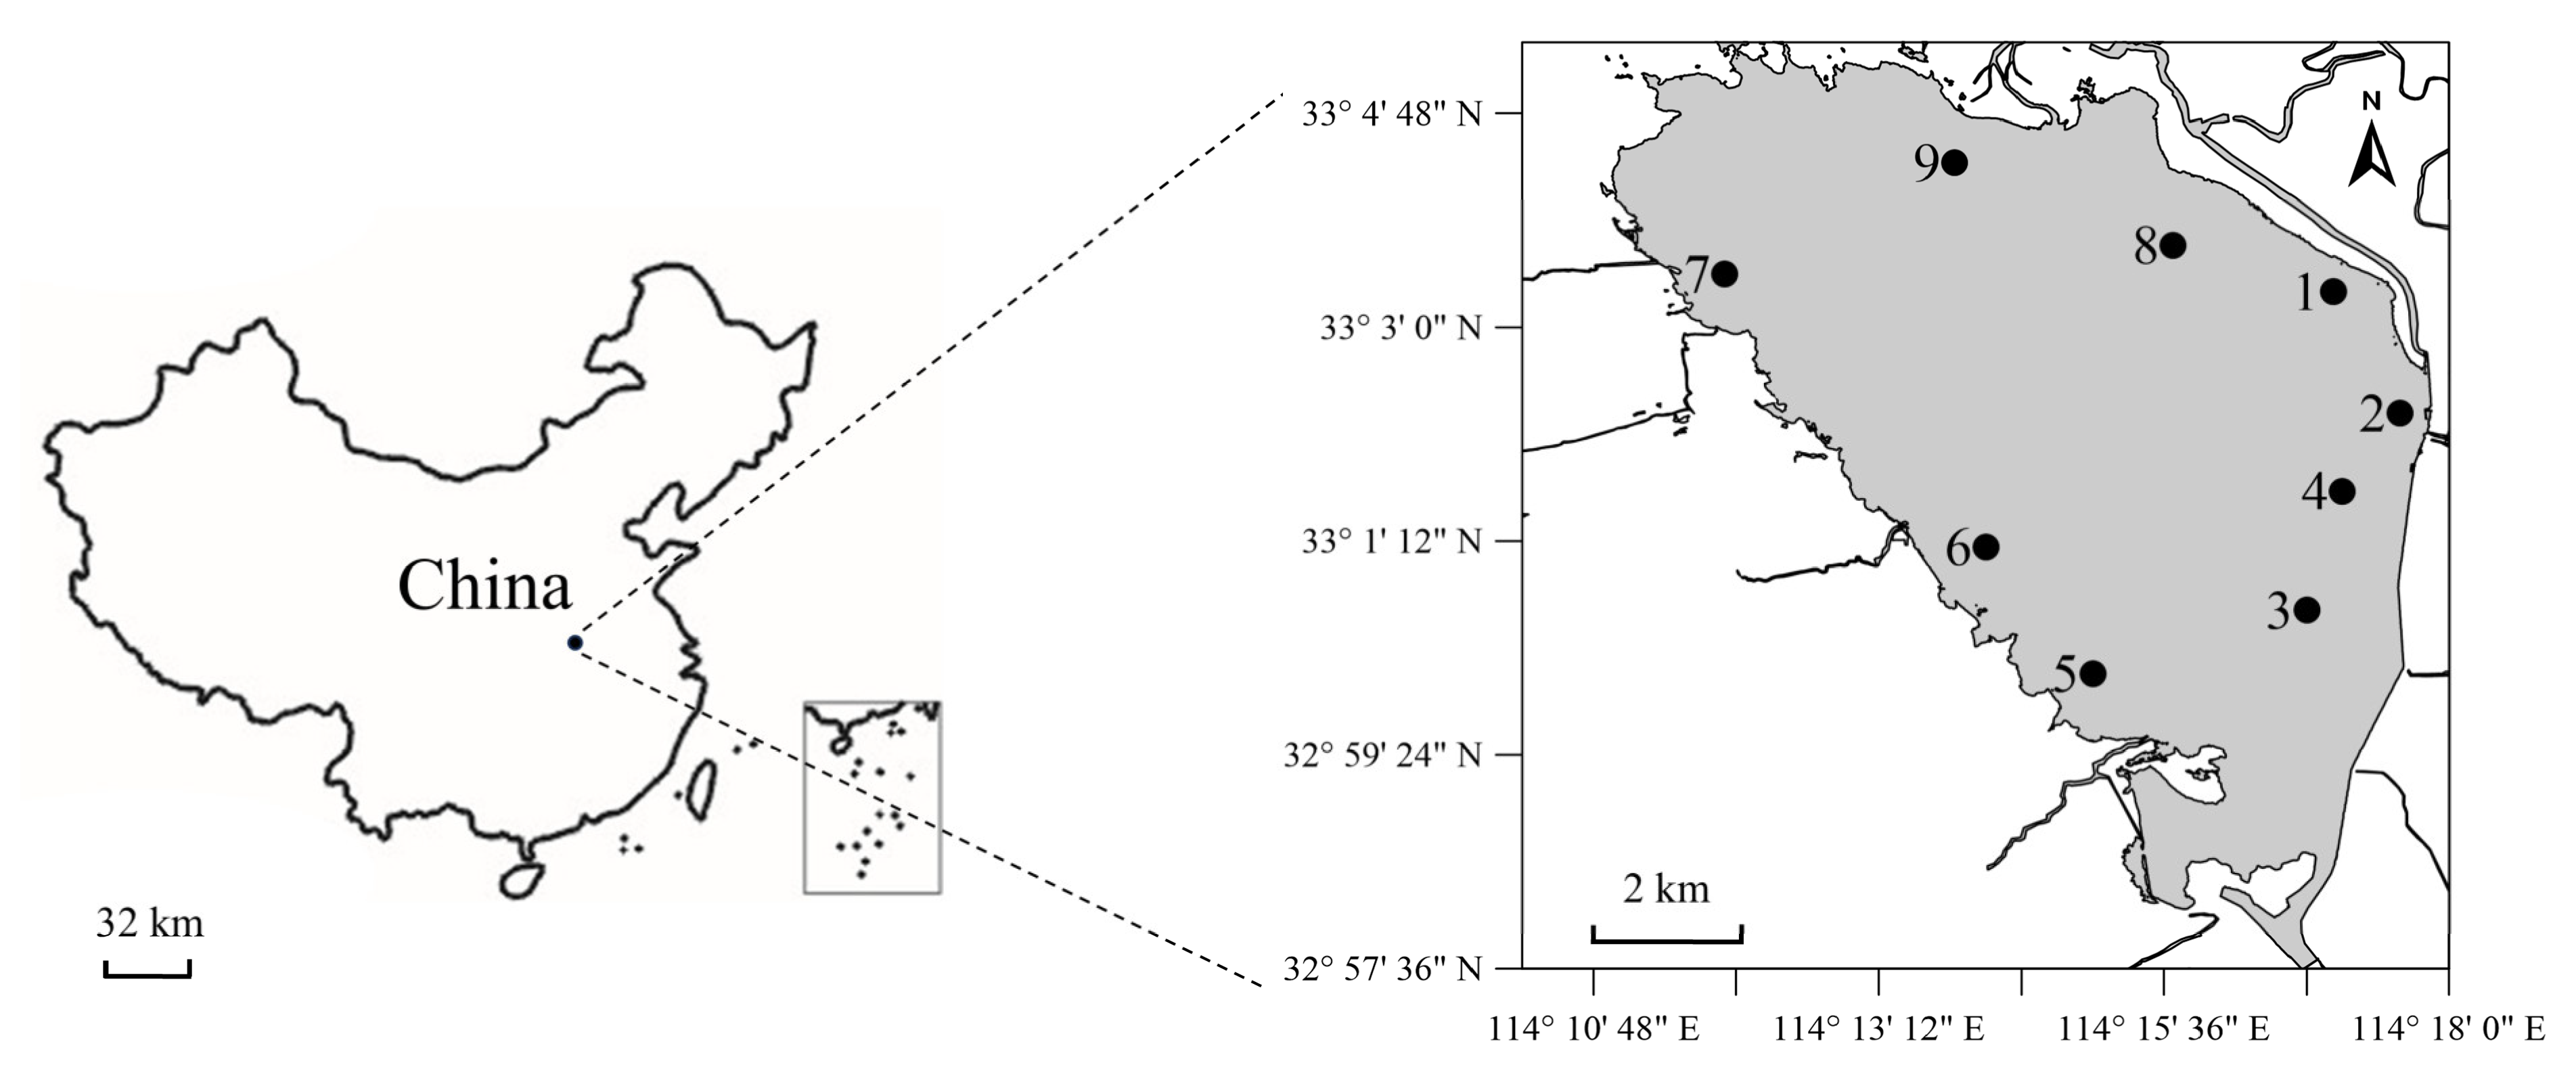
Figure 1. Map of the sampling sites in Suyahu Reservoir. The sampling sites (1~9) are shown circled in black.
Fishes 10 00534 g001
Figure 2. Correlation coefficients between morphological traits and dress-out traits in E. modestus (n = 301). ** represents extremely significant (p < 0.01), * represents significant (p < 0.05), and blank represents not significant (p > 0.05).
Fishes 10 00534 g002
Figure 3. Grey relational grade of morphological traits on AMW (a) and AMP (b) in E. modestus (n = 301).
Fishes 10 00534 g003
Figure 4. Scatter plots of observed values versus predicted values for AMW (a) and AMP (b) in E. modestus (n = 301).
Fishes 10 00534 g004
Figure 5. Checking the adequacy of the regression model of AMW (n = 301). (a) The normal probability plot of the externally Studentized residuals for the model of AMW; (b) the externally Studentized residuals plots versus the predicted values of AMW.
Fishes 10 00534 g005
Table 1. Descriptive statistics of morphological traits and dress-out traits in E. modestus.
TraitTraining Group (n = 301)Holdout Sample (n = 60)
MeanSDCV%MeanSDCV%
BW (g)1.080.3633.33 1.040.3432.69
BL (mm)42.514.5610.73 42.315.1212.10
RL (mm)11.682.2118.92 11.482.2119.25
CL (mm)10.481.4413.74 10.411.5915.27
CW (mm)5.920.9315.71 5.790.8414.51
CH (mm)6.340.8914.04 6.220.7512.06
AL (mm)31.763.8212.03 32.023.9512.34
AW (mm)5.690.8114.24 5.610.7713.73
AH (mm)6.460.9514.71 6.470.9915.30
FL (mm)9.361.1912.71 9.191.3214.36
FW (mm)13.222.0515.51 12.751.5412.08
TeL (mm)7.150.8712.17 6.850.7611.09
TeW (mm)1.790.3720.67 1.770.3720.90
TeH (mm)1.280.2721.09 1.240.2620.97
AMW (g)0.51 0.18 35.29 0.49 0.18 36.73
AMP (%)46.39 4.46 9.61 46.62 4.68 10.04
Table 2. Path coefficients and variance inflation factors of morphological traits on dress-out traits in E. modestus.
Morphological TraitAMW (n = 301)AMP (n = 301)
Pi (±Standard Error)VIFPi (±Standard Error)VIF
BW0.719 (±0.025) **11.283−0.557 (±2.139) **11.283
BL0.083 (±0.002)11.5640.262 (±0.172)11.564
RL−0.058 (±0.002) **1.881−0.207 (±0.144) **1.881
CL−0.039 (±0.027)3.305−0.125 (±0.293)3.305
CW0.140 (±0.007) **6.2490.535 (±0.620) **6.249
CH−0.018 (±0.007)5.778−0.128 (±0.625)5.778
AL0.063 (±0.002)5.5750.158 (±0.143)5.575
AW0.016 (±0.007)4.5900.061 (±0.609)4.59
AH0.033 (±0.005)2.7970.110 (±0.408)2.797
FL−0.021 (±0.003)2.199−0.078 (±0.287)2.199
FW0.034 (±0.002)1.6490.094 (±0.145)1.649
TeL−0.039 (±0.004)1.997−0.151 (±0.374) *1.997
TeW0.029 (±0.010)1.8600.058 (±0.864)1.860
TeH0.007 (±0.012)1.4800.070 (±1.047)1.480
** represents extremely significant difference (p < 0.01); * represents significant difference (p < 0.05).
Table 3. Determinations of morphological traits on dress-out traits in E. modestus.
Morphological TraitAMW (n = 301)AMP (n = 301)
DirectIndirectDirectIndirect
BW0.517 0.147 0.664 ** 0.311 −0.647 −0.336 **
BL0.007 0.114 0.121 *0.069 −0.100 −0.031
RL0.003 0.001 0.004 0.043 −0.072 −0.029
CL0.002 0.001 0.003 0.016 −0.066 −0.050
CW0.020 0.026 0.046 0.286 −0.184 0.102 **
CH0.000 0.000 0.000 0.016 −0.011 0.005
AL0.004 0.007 0.011 0.025 0.006 0.031
AW0.000 0.000 0.000 0.004 0.004 0.007
AH0.001 0.001 0.002 0.012 0.004 0.016
FL0.000 0.000 0.000 0.006 −0.003 0.003
FW0.001 0.001 0.002 0.009 0.003 0.012
TeL0.001 0.001 0.002 0.023 −0.001 0.022
TeW0.001 0.001 0.002 0.003 0.001 0.004
TeH0.000 0.000 0.000 0.005 0.000 0.005
** represents extremely significant difference (p < 0.01); * represents significant difference (p < 0.05).
Disclaimer/Publisher’s Note: The statements, opinions and data contained in all publications are solely those of the individual author(s) and contributor(s) and not of MDPI and/or the editor(s). MDPI and/or the editor(s) disclaim responsibility for any injury to people or property resulting from any ideas, methods, instructions or products referred to in the content.