Article

Nutrient Analysis of Raw and Sensory Evaluation of Cooked Red Tilapia Fillets (Oreochromis sp.): A Comparison Between Aquaculture (Red Kenyir™) and Wild Conditions

by
Aswir Abd Rashed
1,*,
Nurliayana Ibrahim
1,
Nurul Izzah Ahmad
2,
Mariam Marip
3,
Mohd Fairulnizal Md Noh
1 and
Mohammad Adi Mohammad Fadzil
1
1
Nutrition, Metabolism and Cardiovascular Research Centre (NMCRC), Institute for Medical Research (IMR), National Institutes of Health (NIH), Ministry of Health Malaysia (MOH), No. 1, Jalan Setia Murni U13/52, Seksyen U13 Setia Alam, Shah Alam 40170, Selangor, Malaysia
2
Infectious Diseases Research Centre (IDRC), Institute for Medical Research (IMR), National Institutes of Health (NIH), Ministry of Health Malaysia (MOH), No. 1, Jalan Setia Murni U13/52, Seksyen U13 Setia Alam, Shah Alam 40170, Selangor, Malaysia
3
Terengganu Fisheries Office, Department of Fisheries Malaysia, Chendering, Kuala Terengganu 21080, Terengganu, Malaysia
*
Author to whom correspondence should be addressed.
Fishes 2025, 10(10), 523; https://doi.org/10.3390/fishes10100523
Submission received: 31 August 2025 / Revised: 9 October 2025 / Accepted: 10 October 2025 / Published: 14 October 2025
(This article belongs to the Special Issue Seafood Products: Nutrients, Safety, and Sustainability)

Abstract

The tilapia sector is advancing due to breakthroughs in aquaculture techniques and genetic enhancements. Comprehending sensory qualities is crucial for producers striving to meet market demands efficiently. As consumer preferences play a significant role in shaping the market, enhancing the sensory attributes of both farmed and wild red tilapia will be key to ensuring their success in the competitive aquaculture industry. One of Malaysia’s most prominent aquaculture projects is the Como River Aquaculture Project located in Kenyir Lake, where tilapia fish farming, trademarked as Red Kenyir™, is conducted. Thus, this study aimed to evaluate the nutrient analysis of raw and five sensory attributes (appearance, texture, smell, taste, overall quality) of filets from Red Kenyir™ and wild red tilapia (Oreochromis sp.). Red Kenyir™ were fed three different commercial diets (A, B, and C) from fingerling to adulthood, while wild tilapia (W) was sourced from the market. Proximate and nutritional analyses were conducted based on the standard food analysis protocol by AOAC/AOCS. To the best of our knowledge, this is the first study to comprehensively document the nutrient analysis of raw and consumer sensory perception of cooked Red Kenyir™ aquaculture tilapia in direct comparison with wild red tilapia. The sensory evaluation was conducted using a consumer preference test. Statistical analysis was performed using SPSS. Nutrient analysis showed that Red Kenyir™ tilapia had lower fat (0.25–1.37 g/100 g vs. 4.30 g/100 g) and lower energy (77.38–113.46 kcal/100 g vs. 132.79 kcal/100 g) levels. Protein levels varied across groups (19–26.54 g/100 g vs. 22.95 g/100 g). The tryptophan content of the Red Kenyir™ tilapia samples ranged between 0.13 and 0.23 g/100 g, while the wild tilapia contained 0.19 mg/100 g. Sensory evaluation with 36 panelists revealed no significant differences in appearance, texture, or smell (p > 0.05). However, wild tilapia scored slightly higher in taste (4.14) than Red Kenyir™ (3.54–3.71) for steamed preparation (p < 0.05). In conclusion, these findings suggest that variations in the nutritional composition of Red Kenyir™ do not affect the sensory experience for consumer acceptance, making it a sustainable alternative for customers.
Key Contribution: This study provides the results of sensory and nutritional analysis, highlighting the consumer acceptability of aquaculture red tilapia; Red Kenyir™ is comparable to wild red tilapia.

Graphical Abstract

1. Introduction

The production of tilapia, particularly red tilapia (Oreochromis sp.), has garnered significant attention in aquaculture due to its increasing popularity among consumers [1]. Tilapia is among the most important freshwater fish in global aquaculture, with production exceeding 6 million tonnes annually [2]. Its rapid growth, adaptability, and mild flavor make it highly popular among consumers and producers [3]. Wild tilapias are typically harvested from natural freshwater sources, where their growth is influenced by environmental factors such as water quality, food availability, and seasonal changes. However, the yield can be unpredictable due to natural habitat variations and overfishing concerns. In contrast, farmed tilapia are raised in controlled environments like ponds or tanks, allowing for optimized growth conditions. As aquaculture continues to evolve, understanding the differences between the products will be crucial for producers aiming to meet market needs effectively [1].
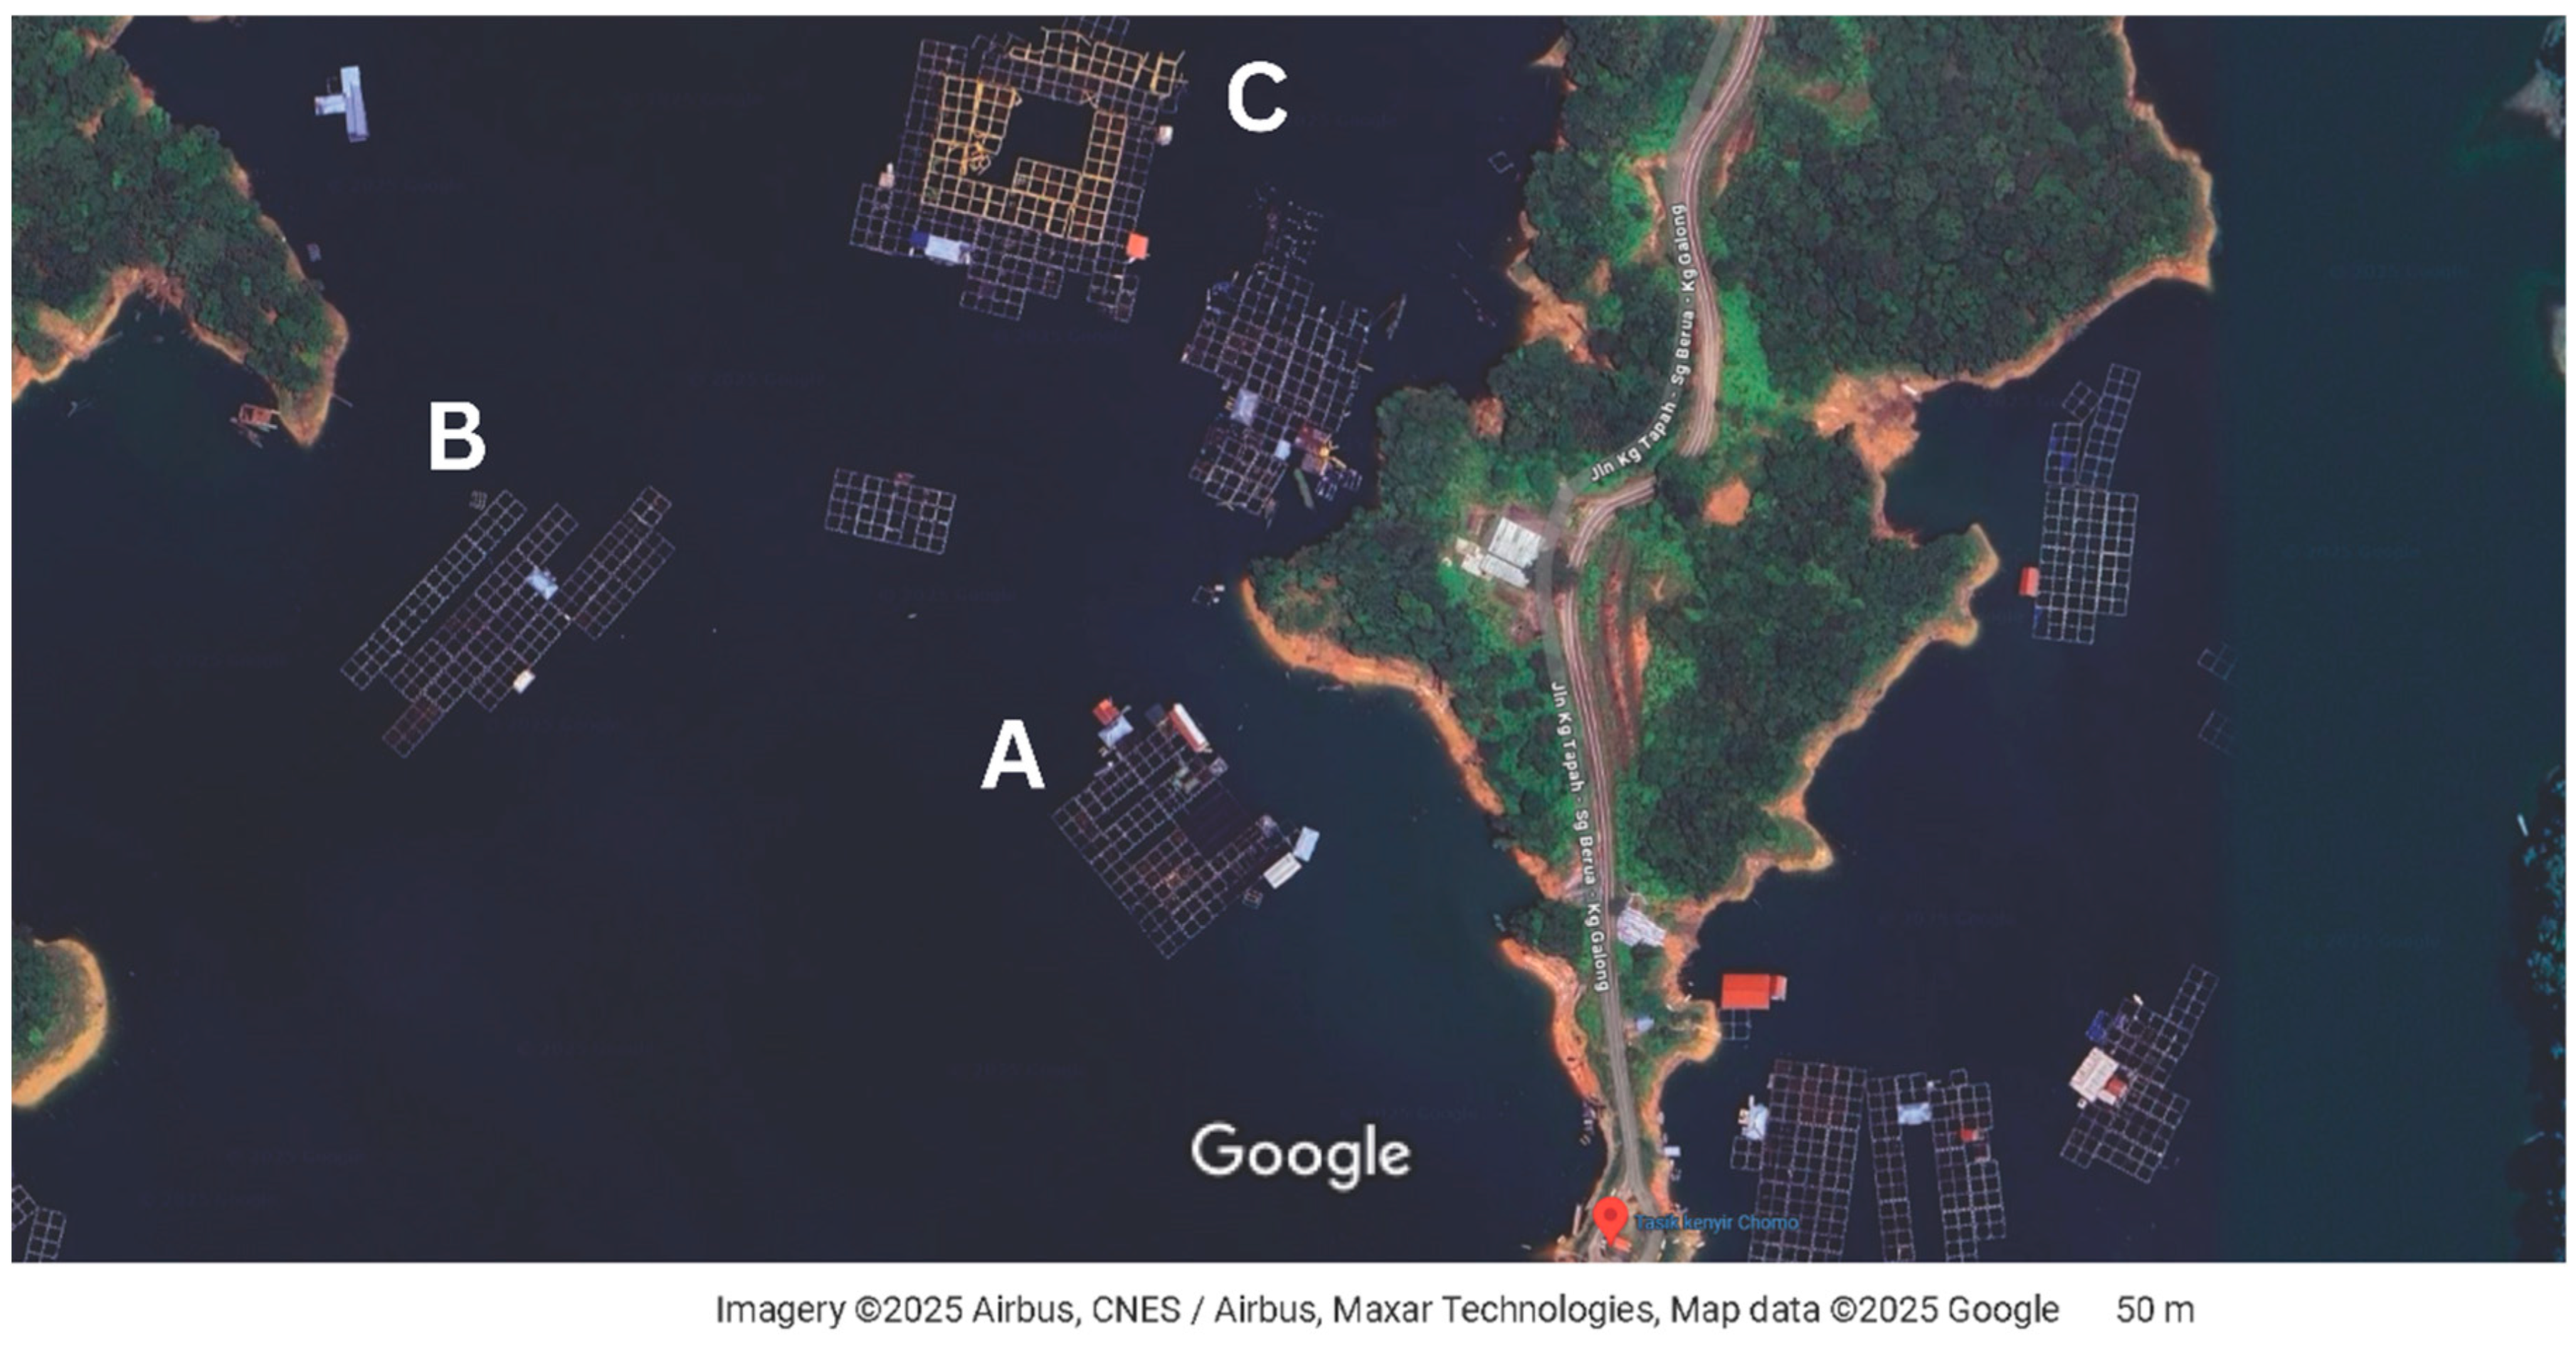
According to FAO (2020), aquaculture is central to meeting future seafood demand, but its growth must be aligned with sustainability, nutritional value, and consumer acceptance through the “Blue Transformation” agenda [2]. While major producers such as China and Egypt dominate tilapia production, Malaysia has increasingly invested in sustainable aquaculture systems. One notable aquaculture project in Malaysia is the Como River aquaculture project, which is illustrated in Figure 1. Red Kenyir™ is a registered trademark for red tilapia cultivated in Kenyir Lake, specifically within the Como River region. The Intellectual Property Corporation of Malaysia (MyIPO) has officially gazetted this trademark. Red Kenyir™ is recognized as a tilapia species that requires a relatively short cultivation period, possesses a firm white flesh texture, and is reputed to have superior taste qualities. The Fisheries Department has stipulated that all aquaculture operators within the Como River aquaculture zone must utilize 100 per cent formulated feed duly registered with the Fisheries Department. Red Kenyir™ were fed with formulated floating pellets commercially available in the market. At the early stage, Red Kenyir™ seed was introduced in the Como River, Kenyir Lake (approximately 3 inches in size), and Red Kenyir™ were fed with starter pellets containing 32% crude protein. After 1–2 months of rearing (approximately 6 inches in size), the fish were fed with pellets containing 28% crude protein upon reaching the grow-out phase. The protein sources in the commercial pellets were derived from non-ruminant ingredients, in compliance with aquafeed production regulations, which require all manufacturers or exporters to be registered with the Department of Veterinary Services (DVS) and the Department of Fisheries (DOF), and to ensure reliable sources of protein. Red Kenyir™ tilapia typically reach marketable size within 6–7 months of culture, attaining an average final weight of approximately 300 g, depending on feed type and stocking density. In contrast, wild tilapias are generally harvested from rivers, where other environmental factors influence growth.
Factors like familiarity, culture, and food beliefs impact consumer perception and acceptance of sensory attributes [5]. Understanding consumer perception of these attributes is key to optimizing products for success in the market. Positive sensory experiences lead to repeat purchase. Consumers evaluate food quality based on sensory characteristics like appearance, flavor, and texture [6]. These intrinsic attributes significantly influence overall liking and purchase intent. Sensory evaluation methods like descriptive analysis and consumer testing are widely used to assess sensory profiles, identify drivers of liking, and optimize products for consumer acceptance [6].
Previous research has shown that aquaculture feeds can alter fish lipid composition and subsequently affect nutritional quality and sensory attributes [7,8]. Francis et al. (2024) reported that formulated diets can reduce omega-3 fatty acids while increasing total fat and n-6 levels, leading to lower nutritional value and changes in flavor and texture compared to wild fish [7]. Similarly, Wan Nooraida (2022) highlighted that feed composition can significantly affect the sensory attributes of tilapia, particularly taste and overall acceptability [8]. The study by Obirikorang and his colleagues provides further evidence that aquaculture feeds can alter fish lipid composition and, in turn, affect both nutritional quality and sensory traits compared to wild fish [9]. In their trial, Nile tilapia (Oreochromis sp.) was fed diets with high levels of copra meal, a plant-based protein source that partially replaced conventional fishmeal. The results showed that such dietary changes influenced the fish’s growth performance, feed utilization, and sensory characteristics. However, there is a limited study comparing the sensory characteristics and nutritional composition of aquaculture and wild-caught fish, which are critical determinants of consumer acceptance and preference. The novelty of this study lies in its dual focus on the nutrient analysis of raw and consumer sensory perception of cooked Red Kenyir™ aquaculture tilapia filets (steamed and fried), a registered trademark with limited prior documentation. By integrating laboratory analysis with consumer-based assessments, the study provides comprehensive evidence of the quality and acceptability of Red Kenyir™, with implications for aquaculture branding, consumer perception, and food security. Thus, the objective of this study is to compare nutrient analysis and five sensory attributes (appearance, texture, smell, taste, overall quality) of filets from aquaculture-raised (Red Kenyir™) and wild red tilapia (Oreochromis sp.).

2. Methodology

2.1. Sampling Design

Red Kenyir™ samples were collected from three aquaculture farms (designated as A, B, and C) inside the Industrial aquaculture zone at the Como River, Kenyir Lake, Terengganu, Malaysia. Malaysia has a tropical climate with relatively consistent conditions year-round. Sampling was conducted in the morning in January 2024, under sunny weather conditions. The location was spread out in different sites in Kenyir Lake: A (bottom), B (middle), and C (top). All three operators reported using different commercial diets in the region, thereby allowing comparison of how feed formulation may influence the nutrient and sensory evaluation of the fish. This ensured that the observed differences could be reasonably attributed to variations in location or feed rather than random or uncontrolled factors. To minimize biological variation, fish were selected to be of comparable market size, averaging approximately 300 g per fish. The operators harvested all samples at the standard marketable age for red tilapia (6–7 months post-stocking). Sex differentiation was not carried out, as male and female red tilapia are marketed together and consumed interchangeably. Additionally, previous studies have found minimal and inconsistent differences in proximate composition between sexes at harvest size [10]. By standardizing weight and age, we controlled for the major sources of biological variation relevant to nutrient composition. For comparison, wild red tilapia (denoted as W) were purchased from a local fish market captured from river in Kampung Pantai Ali, Kuala Terengganu, Malaysia, as reported by the fish monger, the wild red tilapia were caught and not cultured, thus allowing for comparison between aquaculture and wild tilapia. A summary of the sampling location and fish meal is shown in Table 1. A total of 32 fish, averaging approximately 300 g each, were collected (n = 8 per group). The fish were cleaned by removing the gut and scales, weighed, and individually wrapped in food-grade plastic. Each sample was labeled according to its origin, frozen at −20 °C and transported in ice-filled polystyrene boxes to the Institute for Medical Research (IMR), Setia Alam, Selangor, Malaysia. Upon arrival, the samples were blinded by random labeling and stored at −20 °C in the cold room until analysis.

2.2. Nutrient Analysis

The nutritional composition of the fish samples was analyzed at the Nutrition Laboratory of IMR following the Protocol for Sampling and Methods of Analysis for the Malaysian Food Composition Database (MyFCD) established by the National Technical Working Group in 2011 [11]. Standard laboratory procedures from AOAC and AOCS were used, with minor modifications according to MyFCD guidelines. The analysis assessed various components, including moisture, ash, crude protein, crude fat, carbohydrate content, tryptophan, fatty acids, and mineral content, to determine the overall nutritional profile of the fish filets. Analysis was conducted in triplicate, and the mean values are reported with standard deviations. All nutritional values are expressed as g/100 g of the wet raw edible portion of fish filet.

2.2.1. Proximate Analysis

The total dietary fiber (TDF) analysis was performed using a Fibertec™ machine (FOSS Analytical A/S, Hillerød, Denmark). The procedure involved using 78% and 98% ethanol solutions, 0.561 N and 6 N hydrochloric acid (HCl), and 6 N sodium hydroxide (NaOH) for sequential digestion. Fat was extracted using the Soxhlet method. Protein analysis was determined using the DUMATHERM® nitrogen/protein analyzer (Gerhardt, Königswinter, Germany) equipped with an autosampler and controlled by DUMATHERM Manager software version V6.17d. Combustion gases were carried by helium, passed through reduction and trapping columns, and nitrogen was quantified by a thermal conductivity detector (TCD). Moisture content was measured using the oven-drying method. About 5 g of sample was weighed on an analytical balance (±0.1 mg) and placed in a nickel dish with a lid. The sample was dried in a hot-air oven at 105 °C until constant weight, then cooled in a desiccator with silica gel or other absorbents before reweighing. Moisture content was calculated from the weight loss. Ash content was determined in a muffle furnace at 500–600 °C to remove moisture and organic matter, leaving minerals as ash. Samples were placed in silica crucibles, heated, then cooled in a desiccator with silica gel before weighing. Finally, carbohydrates and calories were obtained by calculations.

2.2.2. Mineral Analysis

Mineral analysis was conducted using an Inductively Coupled Plasma–Optical Emission Spectrometer (ICP-OES) (PerkinElmer, Inc., Waltham, MA, USA) equipped with Perkin Elmer Syngistix software version 4.0. Before analysis, samples were digested using a Titan MPS™ microwave digestor (PerkinElmer, Inc., Waltham, MA, USA) with a 16-position pressure vessel system to ensure complete mineral extraction. For quantification, Perkin Elmer (Waltham, MA, USA) certified standards were employed, including QC21 (100 mg/L), phosphorus (P, 1000 mg/L), potassium (K, 1000 mg/L), calcium (Ca, 1000 mg/L), magnesium (Mg, 1000 mg/L), sodium (Na, 1000 mg/L), and mercury (Hg, 1000 mg/L).

2.2.3. Tryptophan Analysis

Tryptophan analysis was carried out using an ACQUITY UPLC BEH C18 column (1.7 µm, 2.1 × 100 mm; Waters) (Waters Corporation, Milford, MA, USA) coupled with a UV detector set at 280 nm. The injection volume is 2.0 µL, and the run time is 5 min. The mobile phase was delivered at flow rates of 0.5 mL/min.

2.2.4. Fatty Acid Composition Analysis

Fatty acid composition was analyzed according to AOCS Official Method Ce 1-62 (Reapproved 1997), using gas chromatography with a flame ionization detector (GC-FID). Fatty acid methyl esters (FAME) were separated and quantified to determine the fatty acid profile of the samples [12].

2.3. Sample Preparation for Sensory Evaluation

Sensory evaluation was approved by the Medical Research and Ethics Committee of the Ministry of Health Malaysia (MREC MOH), Reference No. 24-01474-KPK. The evaluation adhered to the ASTM International guidelines (2017) and the methodology outlined by Wan Nooraida et al. (2022), with slight modifications [8,13]. It took place over three days, from 14 to 17 January 2025.
The study employed two cooking methods, steaming and deep frying [14]. First, two blinded samples from each group were thawed at 8 °C for 6 h. Steaming was carried out using a conventional three-liter stove steamer. One liter of filtered water was filled into a pot and heated until boiling. Then, the fish were placed on the aluminum rack and covered for 15 min. Each fish was examined using a stick thermometer to reach a minimum of internal temperature of 66 °C for safe consumption. Next, deep frying was carried out using a pan filled with hot cooking oil on the stove. The fish were dropped into hot oil and deep-fried for 10 min. Similarly, the fish filets were checked using a stick thermometer, ensuring the minimum internal temperature reached 66 °C for safe consumption. The cooked samples were then allowed to cool before being held in a closed container for plating.
For serving, each fish was fileted along the anteroposterior axis, separating dorsal and ventral sections. Each section was further divided into filet blocks, dorsal–anterior (DA), dorsal–middle (DM), dorsal–posterior (DP), ventral–anterior (VA), ventral–middle (VM), and ventral–posterior (VP), yielding 12 blocks per fish (Figure 2).
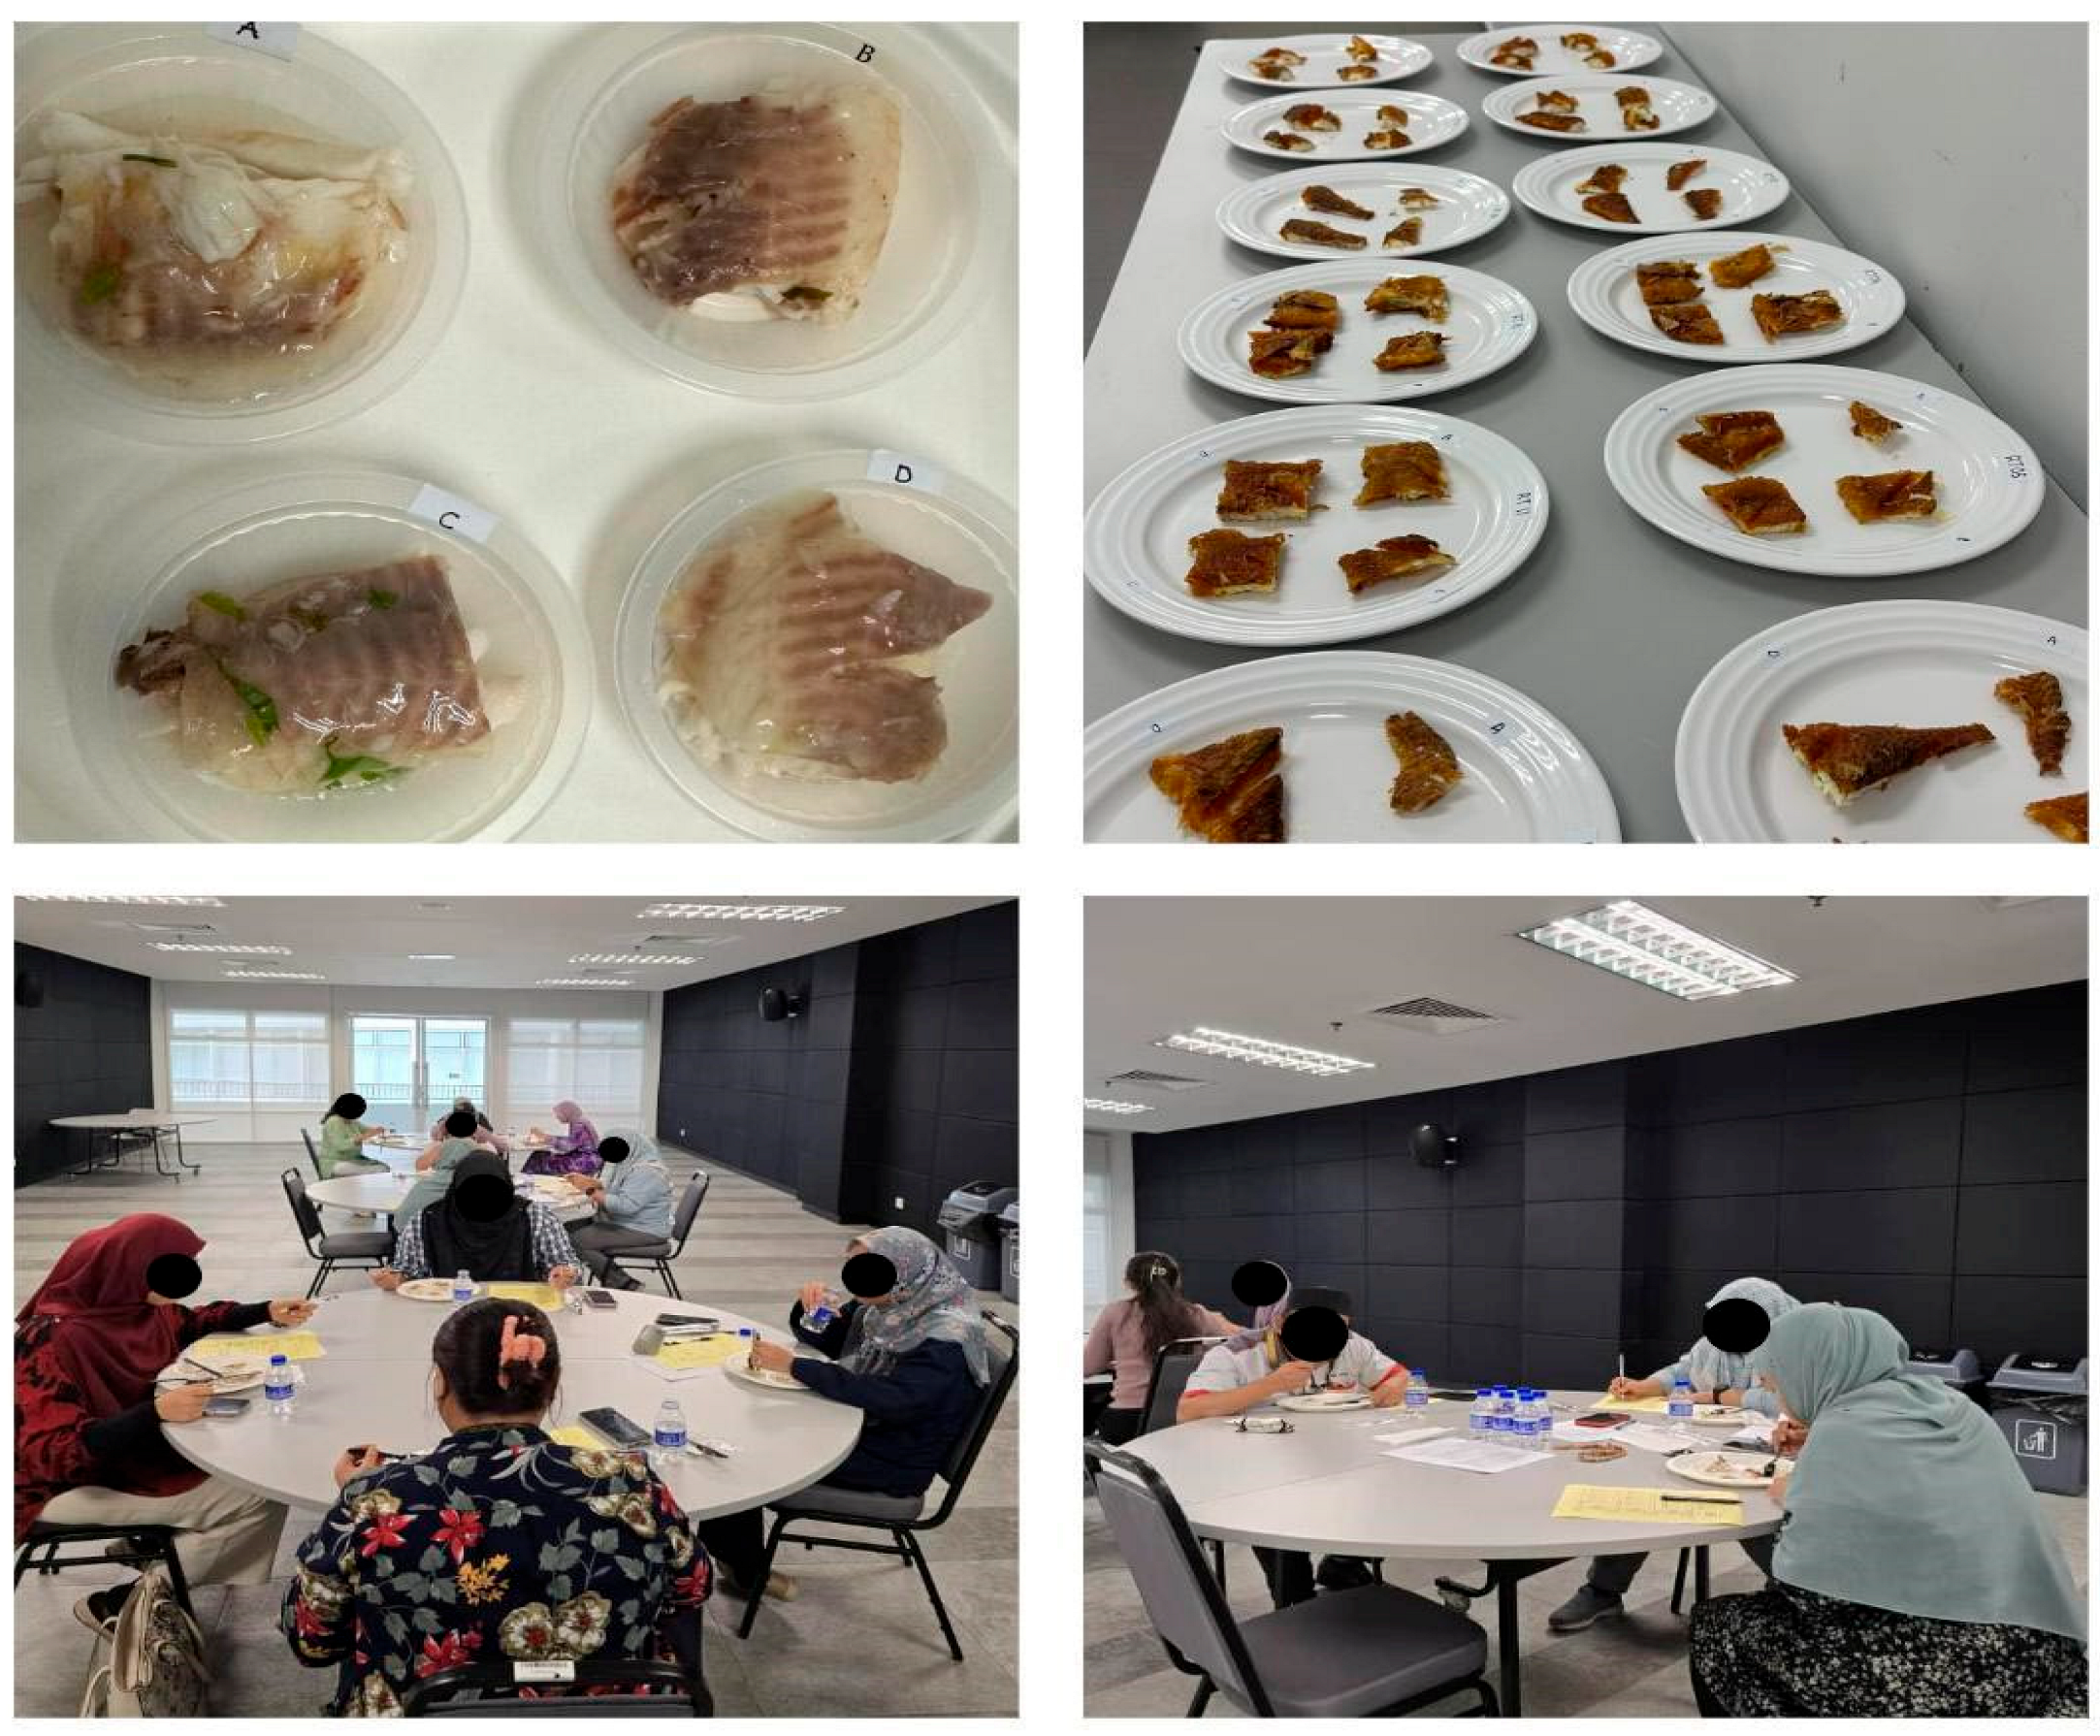
Thirty-six consumer panelists (untrained) were recruited for the sensory evaluation. We recruited thirty-six consumer panelists for the sensory evaluation based on the rule of thumb commonly applied in consumer sensory studies, and in alignment with the sample size of previous studies to ensure consistency and comparability [8]. Recruitment was performed by invitation to institutional staff via email; panelists directly involved in sample collection, processing, laboratory analysis or study design were excluded to avoid bias. Although most were institutional staff, additional criteria such as age, ethnicity, and fish consumption frequency were considered to provide diversity and representation in the sensory panel. Panelist selection targeted a broad cross-section of the adult consumer population: inclusion criteria were age 18–60 years, no self-reported seafood allergy or intolerance, and no acute upper respiratory infection or other condition expected to impair taste or smell. Panelists who smoked were omitted. All participants provided written informed consent. The evaluation was conducted in the institution’s banquet hall, a quiet, odor-free, well-lit, and well-ventilated room maintained at room temperature. Each panelist received a questionnaire, pen, tissue, plastic utensils, and bottled water for palate cleansing. To minimize potential influence among panelists during the round-table sensory test, all samples were blind-coded with randomization using alphabets (A, B, C and D) and presented in randomized order. Panelists were seated apart, instructed not to communicate during evaluation, and monitored by moderators to ensure compliance. Each sample was served individually, with palate cleansers (water) provided and a short interval observed between tastings. These measures ensured independent and unbiased assessments. During the evaluation, each panelist was given four steamed filet blocks from different groups (A, B, C, and W), all sourced from the same filet section of the fish (DA, DM, DP, VA, VM, and VP). For example, if a panelist received samples from group A-filet section DA, they would also be given the same filet section DA from the other groups (B, C, and W). The same procedure was applied to the fried filet blocks. All filet samples were blind-coded and served on clean plastic plates (Figure 3). A structured questionnaire was used to collect sensory responses, including panel ID, sample codes, and five sensory attributes: appearance, texture, smell, taste, and overall quality. A 5-point hedonic scale was used, where 1 = “dislike extremely,” 2 = “dislike,” 3 = “neither like nor dislike,” 4 = “like,” and 5 = “like extremely.” Overall acceptability was also recorded to assess the general liking of the samples. Upon completion, questionnaires were collected, and the booths were cleaned and prepared for the next panelist.

2.4. Data Analysis

Nutritional composition data were recorded using Microsoft Excel, whereas sensory evaluation data were recorded throughout the experimental procedure using a physical questionnaire and tabulated in a Microsoft Excel template. The data were then analyzed statistically using analysis of variance (ANOVA) followed by Tukey’s post hoc test to identify significant differences between groups. Group comparisons were conducted between Red Kenyir™ samples A, B, C, and wild tilapia (W). Non-parametric tests, Kruskal–Wallis and Mann–Whitney analysis were employed to compare fatty acids composition. Statistical analysis was performed using SPSS software version 30, and differences were considered statistically significant when p < 0.05.

3. Results and Discussion

3.1. Nutrient Analysis of Red Kenyir™ and Wild Tilapia

Wild tilapia showed significantly higher caloric value (132.79 ± 4.69 kcal/100 g) than Red Kenyir™ groups (77.38–113.46 kcal/100 g), driven mainly by its higher total fat value. In terms of intra-group variability, caloric values were also higher in Red Kenyir™ sample C (113.46 ± 3.76 kcal/100 g), driven mainly by its higher protein fraction as compared to Red Kenyir™ samples A and B (77.38–85.46 kcal/100 g). Abd-Allah and colleagues reported apparent differences between wild and cultured Nile tilapia in Egypt (Assiut), in energy values, where they found cultured tilapia to contain significantly more calories (100.73 ± 1.44 kcal/100 g) than wild fish (83.29 ± 0.06 kcal/100 g). Notably, the energy range observed in our study (77.38–132.79 kcal/100 g) was broader than that reported by them (73.75–124.77 kcal/100 g), indicating greater variability across strains and culture treatments [15]. In Bangladesh, Islam and his colleagues reported that cage-cultured tilapia exhibited higher caloric values than wild fish, with elevated energy (126.73 vs. 97.62 kcal/100 g). This opposite pattern emerged in our study, where wild red tilapia recorded substantially higher caloric value than cultured red tilapia [16]. Similarly, Francis et al. (2024) found that farmed tilapia in Sabah exhibited higher energy (94.50 kcal/100 g) compared with their wild counterparts (82.50 kcal/100 g) [7]. In contrast, our findings on Red Tilapia showed the opposite trend, where wild fish retained the highest energy density (132.79 kcal/100 g). Nevertheless, Al-Taee et al. (2022) reported that wild Nile tilapia contained a higher energy value (167.82 kcal/100 g) compared to cultured fish (152.13 kcal/100 g) [17]. This is consistent with the trend recorded in the present study, which found caloric values in our samples. These divergent patterns highlight how species strain culture environment, and feeding regimes may differentially influence nutrient partitioning, with aquaculture promoting lipid accumulation in some tilapia populations but enhancing protein deposition in others.
Wild tilapia showed significantly higher fat content (4.30 ± 0.36 g/100 g) than Red Kenyir™ groups (0.25–1.37 g/100 g). No significant differences in fat content were observed within the Red Kenyir™ groups. The proximate composition of Stirling Nile tilapia and red hybrid tilapia showed crude fat of 2.07% and 0.33%, respectively [1]. Al-Taee et al. (2022) reported that wild Nile tilapia contained fat (7.67%) compared to cultured fish (6.97% fat) [17]. Job et al. (2015) reported that wild Nile tilapia contained 0.57% crude fat while cultured fish contained 0.30% [18]. These findings align with current findings as wild tilapia recorded higher fat content. However, two studies have also shown opposite trends compared to the current findings. Abd-Allah et al. (2016) reported cultured fish contained higher fat (2.82%) levels compared to wild tilapia, which recorded 1.20% [15]. Francis et al. (2024) found that farmed tilapia in Sabah exhibited higher fat (3.55%) compared with their wild counterparts (1.35% fat) [7]. The higher fat content in wild tilapia may be attributed to differences in diet, habitat, and activity levels, where natural feeding patterns and diverse food sources can promote greater lipid accumulation. Meanwhile, aquaculture fishes such as Red Kenyir™, often raised on formulated feeds and under controlled conditions, tend to develop leaner flesh due to standardized diets and possibly higher stocking densities, which influence their proximate composition and caloric profile. However, variations compared to previous findings also elucidated the roles of other environmental factors, such as feed type and time, that could affect fat content.
Protein was also relatively higher in wild tilapia (22.95 ± 1.17 g/100 g) than Red Kenyir™ samples A and B, although protein content for sample C (26.54 ± 0.20 g/100 g) is significantly higher than both wild and other aquaculture groups. Despite receiving the highest-quality feed (Fish Meal 1; 28% crude protein) (as detailed in Table 1), Red Kenyir™ sample A exhibited the lowest protein content. This indicates that protein levels may depend on fish meal quality and factors like feeding frequency, feed storage, and fish metabolism. The protein values observed in the present study (22.95–26.54 g/100 g) were higher than those reported in many earlier studies, though the relative trends between wild and cultured tilapia showed both consistencies and contradictions. Garduño-Lugo et al. (2007) recorded crude protein levels of 17.0% in Stirling Nile tilapia and 17.8% in red hybrid tilapia [1], while Al-Taee et al. (2022) similarly found higher protein content in wild Nile tilapia (16.88%) compared with cultured fish (15.26%) [17]. Job et al. (2015) reported minimal differences between wild (17.40%) and cultured (17.10%) Nile tilapia [18], whereas Abd-Allah et al. (2016) noted the reverse pattern, with cultured fish containing more protein (17.91%) than wild fish (17.50%) [15]. In Bangladesh, Islam et al. (2021) also reported slightly elevated protein levels in cage-cultured tilapia (16.03%) compared with wild fish (15.87%) [16]. Conversely, Francis et al. (2024) found higher protein in wild tilapia (16.90%) than in farmed counterparts (15.65%) [7], which aligns with the findings of Raymond et al. (2020), who observed protein levels of 20.2–21.9% in wild fish compared to 16.6–18.9% in farmed fish [19]. Collectively, these studies highlight that protein content in tilapia is highly variable across strains, culture systems, and environments, and the elevated values found in the Red Kenyir™ sample C suggest that aquaculture practices can, under certain conditions, yield protein levels even higher than those typically reported for wild populations.
In terms of moisture, wild tilapia (70.96 ± 0.76 g/100 g) had lower values than Red Kenyir™ sample A and sample B (>77 g/100 g), consistent with its higher protein and fat. Red Kenyir™ Sample C recorded reduced moisture (70.27 ± 0.76 g/100 g), consistent with an inverse relationship between protein and water retention in fish muscle. Our findings are consistent with several previous reports. The proximate composition of Stirling Nile tilapia and red hybrid tilapia showed moisture levels of 79.1% and 80.0% [1]. Al-Taee et al. (2022) reported that cultured tilapia exhibited slightly higher moisture (75.22%) compared to wild Nile tilapia [17]. According to Raymond et al. (2020), farmed tilapia exhibited higher moisture content (75.2–78.1%) than wild tilapia (71.2–73.1%) [19]. These reports align with higher moisture content in cultured tilapia than in wild tilapia. However, several reports show the opposite trend. Abd-Allah et al. (2016) reported wild fish retained more moisture compared to cultured Nile tilapia (79.63% vs. 77.17%) [15]. In Bangladesh, Islam et al. (2021) reported wild tilapia retained more moisture (80.97% vs. 79.12%) [16]. Two reports noted minor differences between farmed and wild tilapia regarding moisture content. Francis et al. (2024) found that farmed tilapia in Sabah exhibited only minor differences between farmed and wild tilapia (80.25% vs. 78.13% moisture) [7]. Job et al. (2015) reported that wild Nile tilapia contained 80.90% moisture while cultured fish contained 80.80% [18]. The moisture-protein-fat relationship can explain these variations in moisture reports. The moisture–protein trend aligns with previous findings that reported higher protein levels generally coincide with lower moisture in fish, including tilapia, as protein matrices have a limited water-binding capacity [20]. Here, Red Kenyir sample C had the highest protein and the lowest moisture, demonstrating this pattern. Similarly, the moisture–fat inverse relationships were evident in W, which had the highest fat content but reduced moisture (70.96 ± 0.76 g/100 g). This aligns with previous findings that reported fat deposition displaces water in muscle tissue, lowering water-holding capacity [21,22]. Overall, the moisture content of tilapia muscle is closely linked to its protein and fat composition, and may reflect physiological and ecological influences on flesh quality.
No significant differences were observed in ash (1.31–1.55 g/100 g) and total carbohydrate content (0.15–1.50 g/100 g) between wild and Red Kenyir™ tilapia, nor among the Red Kenyir™ groups (sample A–C). Dietary fiber was not detected in either aquaculture or wild samples. Garduño-Lugo et al. (2007) observed ash levels of 0.65% in Stirling Nile tilapia and 0.12% in red hybrid tilapia, lower than the current study’s values [1]. Similarly, Olopade et al. (2016) reported ash of 1.36% in wild tilapia, while Al-Taee et al. (2022) found slightly higher values in cultured fish (1.86%) [17,23]. Job et al. (2015) noted comparable ash contents between wild (1.20%) and cultured Nile tilapia (1.31%), along with carbohydrate levels of 0.22% and 0.20%, respectively, consistent with the minimal differences observed here [18]. Abd-Allah et al. (2016) also demonstrated only modest variation between cultured (1.17%) and wild (1.04%) Nile tilapia in Egypt [15]. In Bangladesh, Islam et al. (2021) reported lower ash contents in both cage-cultured (0.53%) and wild (0.34%) tilapia compared with the present values [16]. A similar trend was reported by Francis et al. (2024), who observed comparable ash levels between cultured and wild groups (9.22% vs. 8.51%), and by Raymond et al. (2020), who recorded higher ash in wild (1.8–1.9%) than farmed tilapia (1.2–1.4%) [7,19]. Collectively, these findings indicate that while ash and carbohydrate contents vary across species, culture systems, and geographical regions, differences between wild and farmed tilapia are generally small and often not statistically significant, supporting the patterns observed in the current study.
Overall, the proximate analysis revealed distinct nutritional differences between Red Kenyir™ and wild tilapia. Wild tilapia exhibited significantly higher caloric value and fat content, while protein was highest in Red Kenyir™ sample C. Moisture content was generally greater in aquaculture groups A and B, but lower in wild fish and Red Kenyir™ sample C, consistent with their higher protein and fat fractions. In contrast, ash and carbohydrate contents showed no significant variation across groups, and dietary fiber was not detected. These findings highlight that while wild tilapia retained greater energy density through fat deposition, Red Kenyir™ tilapia demonstrated comparable nutritional quality, with certain groups (sample C) achieving superior protein levels under controlled aquaculture conditions, such as perhaps better feed timing, quality and aquaculture practice. Table 2 summarizes the proximate and nutrient analysis of aquaculture Red Kenyir™ (A, B and C) and wild (W) red tilapia (Oreochromis sp.).
For mineral content, no significant differences (p > 0.05) were observed between wild and Red Kenyir™ tilapia nor among the Red Kenyir™ groups (sample A–C) across all measured minerals. However, numerically, wild tilapia showed slightly higher calcium (79.43 ± 0.82 mg/100 g vs. 27.26–57.86 mg/100 g in Red Kenyir groups) and zinc (0.43 ± 0.01 mg/100 g vs. 0.28–0.38 mg/100 g), while Red Kenyir groups generally had higher magnesium and phosphorus. Numerical variation was also observed among the Red Kenyir groups; sample C showed the highest phosphorus (229.99 ± 6.94 mg/100 g) and potassium (473.57 ± 9.64 mg/100 g). Sample A had slightly higher sodium (127.05 ± 5.50 mg/100 g) than samples B and C. Previous studies have reported similar variability in tilapia mineral profiles across regions and production systems. Garduño-Lugo et al. (2007) found lower calcium in Stirling Nile and red hybrid tilapia (13.6–14.2 mg/100 g) [1], while Olopade et al. (2016) reported calcium levels of 32.4 mg/100 g in wild tilapia [23]. Al-Taee et al. (2022) observed higher calcium in cultured Nile tilapia (86.2 mg/100 g) compared to wild fish (71.5 mg/100 g) [17], and Job et al. (2015) also noted minor differences between wild and cultured tilapia for phosphorus and sodium [18]. Similarly, Abd-Allah et al. (2016) in Egypt and Islam et al. (2021) in Bangladesh reported minor but inconsistent variations in minerals between farmed and wild fish [15,16], while Francis et al. (2024) and Raymond et al. (2020) highlighted that differences in mineral content are often modest and influenced by environmental and dietary factors [7,19]. This observation aligns with the previous findings that noted the diet and environment’s significant impact on tilapia’s mineral levels [10]. In short, these findings are consistent with the present results, suggesting that mineral composition in tilapia is relatively stable, with only minor variations attributable to diet, water quality, and culture conditions. Table 3 summarizes the minerals analysis of aquaculture Red Kenyir™ (A, B and C) and wild (W) red tilapia (Oreochromis sp.).
Tryptophan level was also relatively higher in wild tilapia (0.19 ± 0.00 g/100 g) than Red Kenyir™ sample A and B (0.13 ± 0.00 and 0.16 ± 0.03 g/100 g, respectively), although tryptophan content for sample (0.23 ± 0.03 g/100 g) is significantly higher than both wild and other aquaculture groups. This trend is consistent with the findings of total protein contents in the proximate analysis. Tryptophan is an essential amino acid that plays important roles in fish protein synthesis and metabolic processes [24]. A balanced level of tryptophan promotes healthy fish growth and reduces the risk of damage by oxidative stress and diseases [25]. Higher tryptophan content correlates with improved total protein levels, reflecting better nutritional quality in wild tilapia [26]. Studies also show that dietary tryptophan supplementation in aquaculture can enhance growth performance and muscle protein deposition, which may explain the significantly higher level observed in sample C, potentially due to better feed formulations [27]. Thus, improved tryptophan results support its essential role in protein synthesis and relevance to fish growth and human nutrition. This finding also suggests that cultured tilapia, particularly Red Kenyir sample C, may offer better amino acid availability, which could influence feed formulations or growth conditions [27]. In conclusion, the significantly higher tryptophan content observed, particularly in Red Kenyir™ sample C, highlights its potential nutritional advantage that possibly comes from better feed formulation, aquaculture practice and other environmental factors. However, a more detailed feed composition and amino acids analysis are warranted for more cautious interpretation and further validation. Table 4 summarizes the tryptophan analysis of aquaculture Red Kenyir™ (A, B and C) and wild (W) red tilapia (Oreochromis sp.).
For fatty acid composition, no significant differences (p > 0.05) were observed between wild and Red Kenyir™ tilapia nor among the Red Kenyir™ groups (sample A–C) across all measured minerals. However, numerically, the fatty acid profile revealed markedly higher levels of saturated (1.687 g/100 g), monounsaturated (1.765 g/100 g), and polyunsaturated fatty acids (0.921 g/100 g) in wild tilapia compared with Red Kenyir groups. Among the Red Kenyir groups (samples A, B and C), fatty acid concentrations were generally low, with no consistent differences. Trace amounts of palmitic (C16:0), oleic (C18:1), and lauric acids (C12:0) were detected, but overall, Red Kenyir fish showed a narrower fatty acid profile compared to wild. On the other hand, wild tilapia accumulated substantially more diverse fatty acids in their filets. Farmed tilapia displayed notably lower levels of key SFAs, such as palmitic acid (C16:0; 0.045–0.046 g/100 g) and stearic acid (C18:0; 0.016–0.023 g/100 g), compared to wild tilapia (1.141 g/100 g and 0.266 g/100 g, respectively). Similarly, oleic acid (C18:1n9c), the principal MUFA, was lower in farmed samples (0.026–0.050 g/100 g) than in wild fish (1.403 g/100 g). PUFAs, including linoleic acid (C18:2n6c), linolenic acid (C18:3n3), and docosahexaenoic acid (DHA, C22:6n3), were present only in trace amounts or undetectable in farmed tilapia, whereas wild tilapia contained substantially higher concentrations (0.627, 0.091, and 0.096 g/100 g, respectively). These findings align with previous studies, such as Karapanagiotidis et al. (2017), who reported higher n-3 PUFA levels and favorable n-3/n-6 ratios in wild compared to farmed tilapia, and Suloma et al. (2008), who emphasized that Nile tilapia reared under intensive conditions often exhibit intermediate nutritional quality and require dietary adjustments to enhance n-3 highly unsaturated fatty acids [22,28]. These data confirm that farmed tilapia generally contain lower levels of essential fatty acids than their wild counterparts. The observed differences in fatty acid profiles can be attributed to several factors. Dietary composition plays a significant role, as formulated feeds for farmed tilapia often lack sufficient n-3 PUFAs, whereas wild tilapia consumes a more diverse natural diet, which provides essential fatty acids [29]. Environmental conditions, including water quality, temperature, and genetic strain, can further modulate lipid metabolism and fatty acid composition [22]. Understanding these factors is critical for optimizing aquaculture practices to enhance the nutritional quality of farmed tilapia and produce filets with fatty acid profiles closer to those of wild fish. Table 5 summarizes the fatty acid composition analysis of aquaculture Red Kenyir™ (A, B and C) and wild (W) red tilapia (Oreochromis sp.).

3.2. Sensory Evaluation of Red Kenyir™ and Wild Tilapia

The demographic of the sensory panelists (n = 36) shows a diverse group in terms of age, ethnicity, and fish consumption habits. The panel was dominated by respondents aged 25–44 (p < 0.001). The largest age group (38.9%) was individuals aged 35–44, with a significant proportion (30.6%) in the 25–34 age range. In terms of ethnicity, most participants were Malay (69.4%), with smaller proportions of other ethnicities (22.2%), Indian (5.6%), and Chinese (2.8%) (p < 0.05). Regarding fish consumption, certain categories were more dominant (p < 0.05): freshwater fish was most consumed twice a month (58.3%), while marine fish was consumed more frequently, with 41.7% eating it once or twice a week and 36.1% three to six times a week. These results indicate clear demographic and consumption patterns among the sample subjects, though the distributions do not represent the general population proportionally. The demographic information of the panelists is summarized in Table 6.

3.2.1. Sensory Evaluation for Deep-Fried Red Kenyir™ and Wild Tilapia

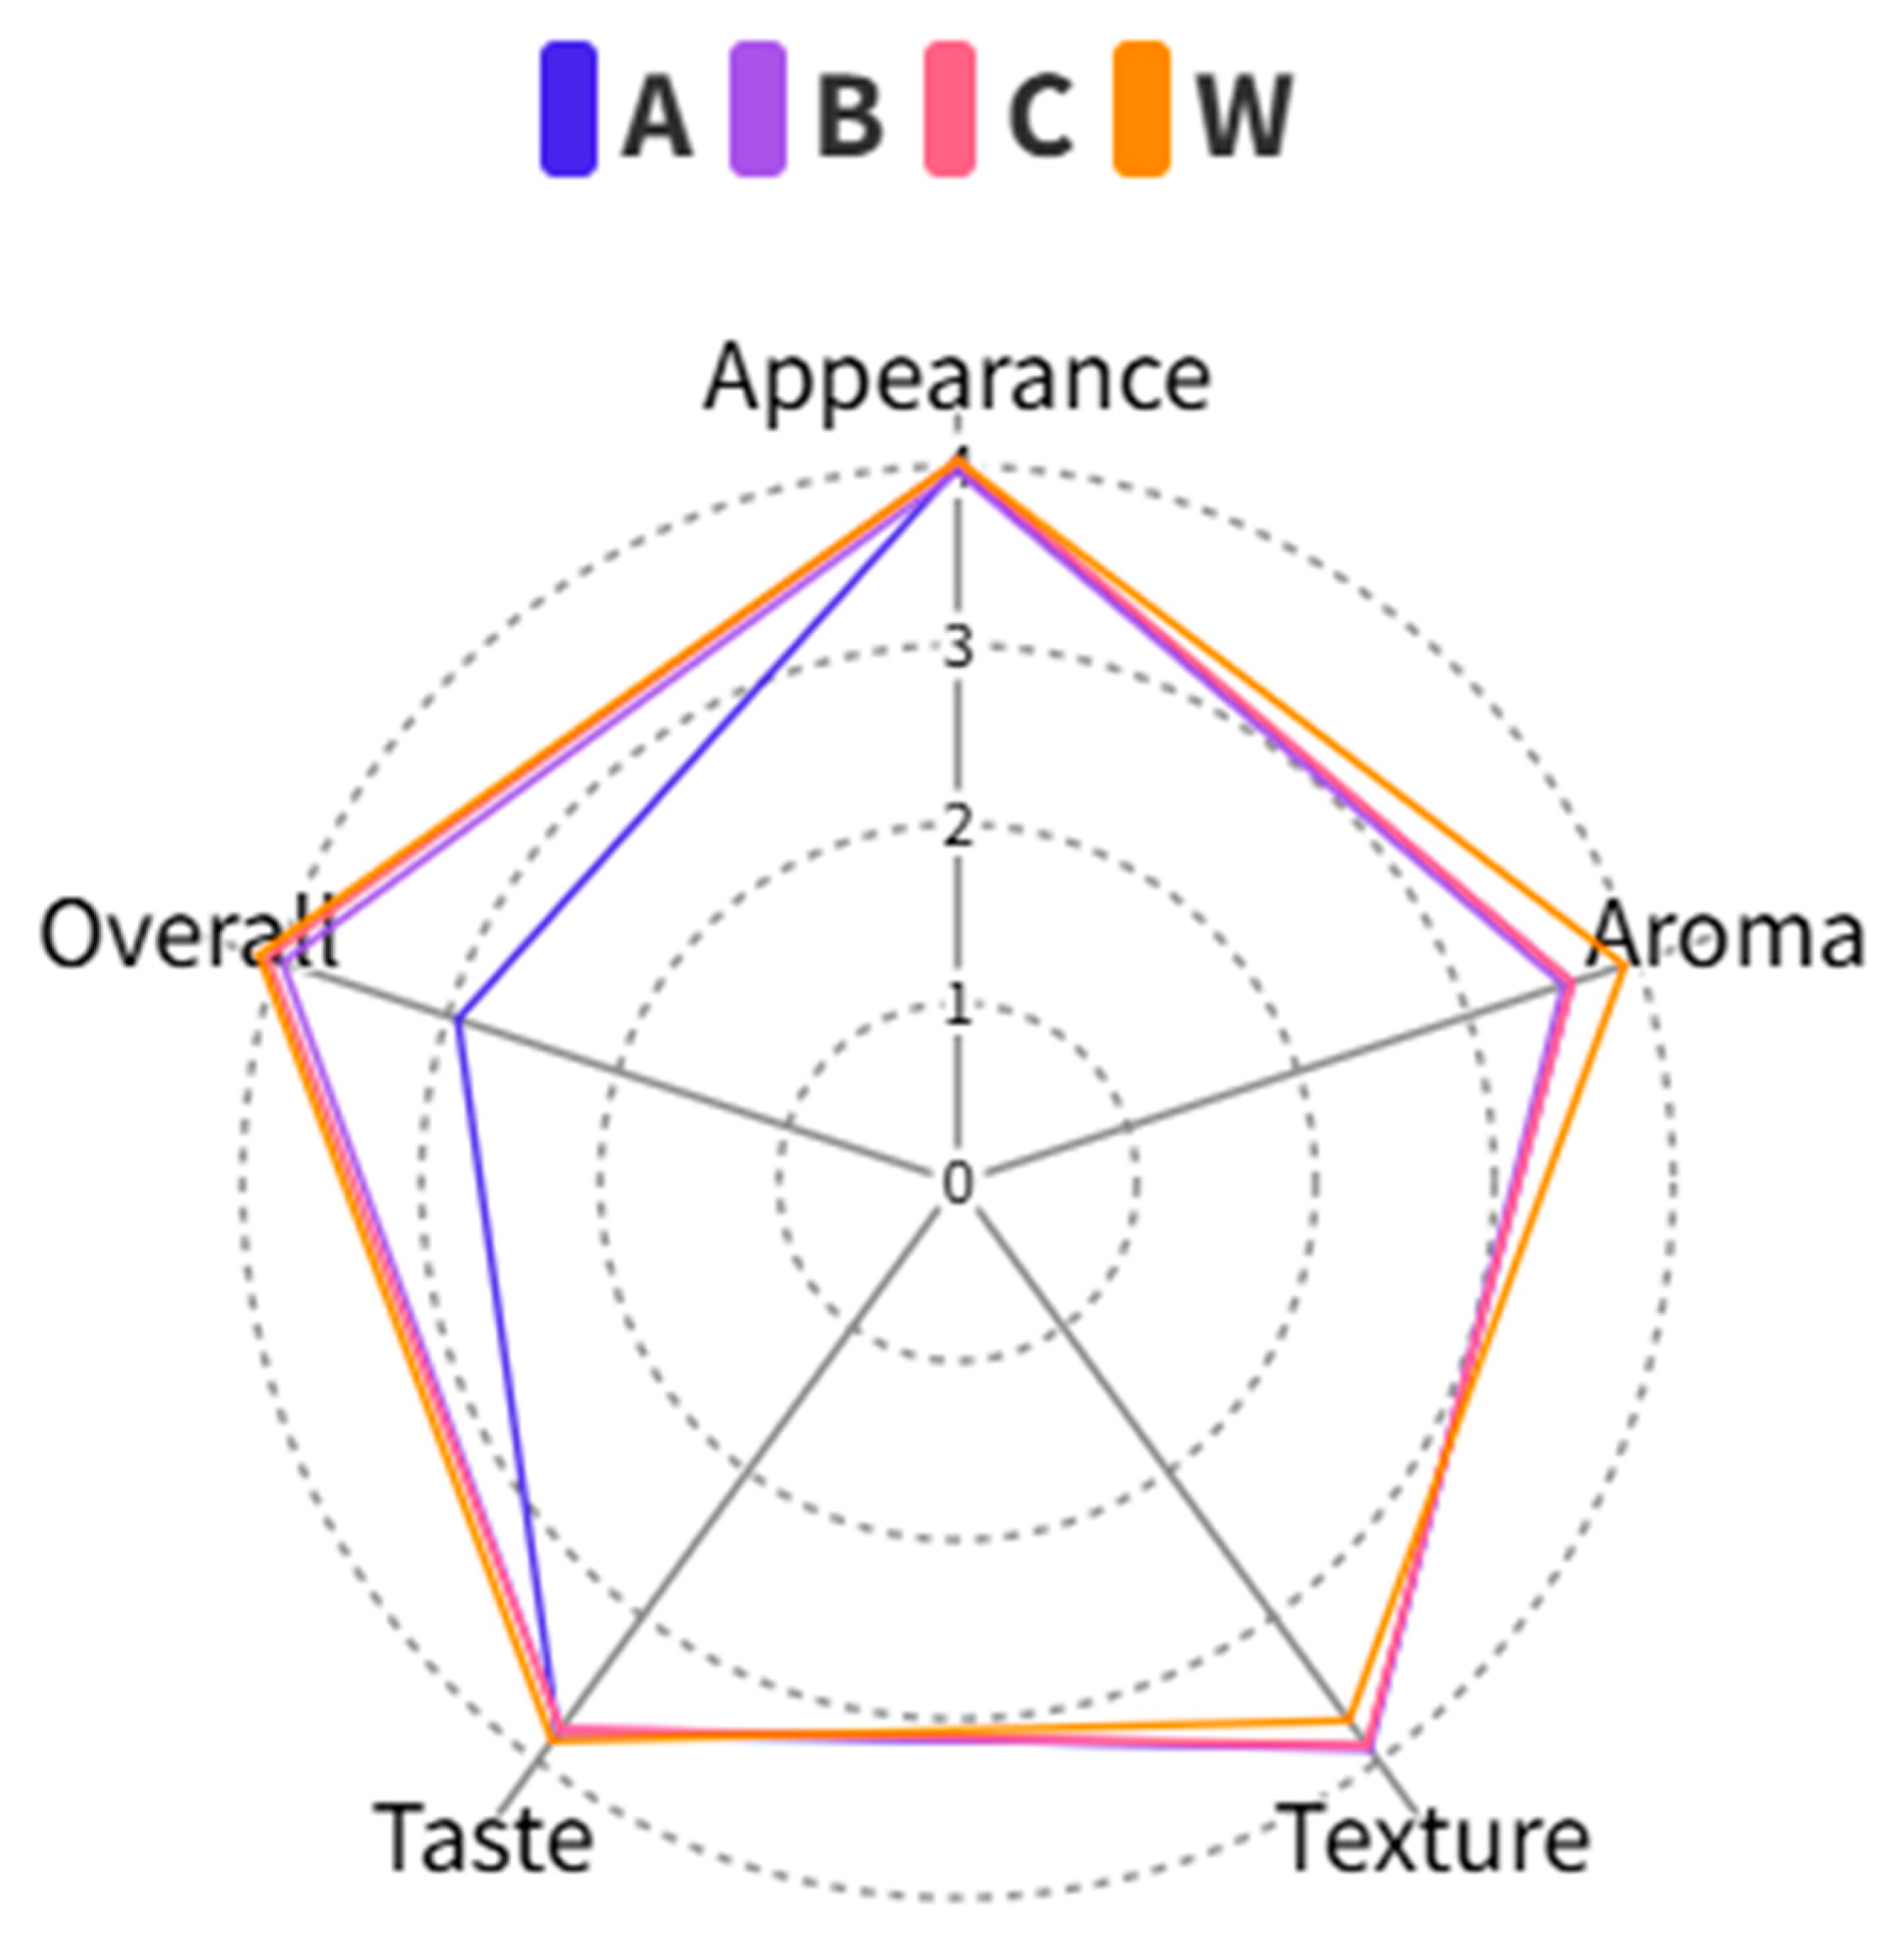
The sensory evaluation of deep-fried red tilapia filets (aquaculture samples A, B, C, and wild sample W) revealed no significant differences across all attributes (p > 0.05). Appearance scores were similar, ranging from 3.97 to 4.03. Aroma, texture, and taste ratings also showed minimal variation, with mean values ranging from 3.6 to 3.9. The overall acceptability was slightly higher for wild tilapia (4.11) than Red Kenyir™ samples (2.94–4.06), but the difference was not statistically significant. These results suggest that panelists perceived deep-fried filets from both sources similarly, indicating that the aquaculture system did not significantly influence the sensory qualities in this preparation method. Consistent with our findings, one study observed that fried wild tilapia retained favorable sensory traits, while another study reported that frying tilapia enhances desirable attributes and alters nutritional indices [30,31]. The results for sensory evaluation of deep-fried red tilapia are summarized in Table 7 and Figure 4.

3.2.2. Sensory Evaluation for Steamed Red Kenyir™ and Wild Tilapia

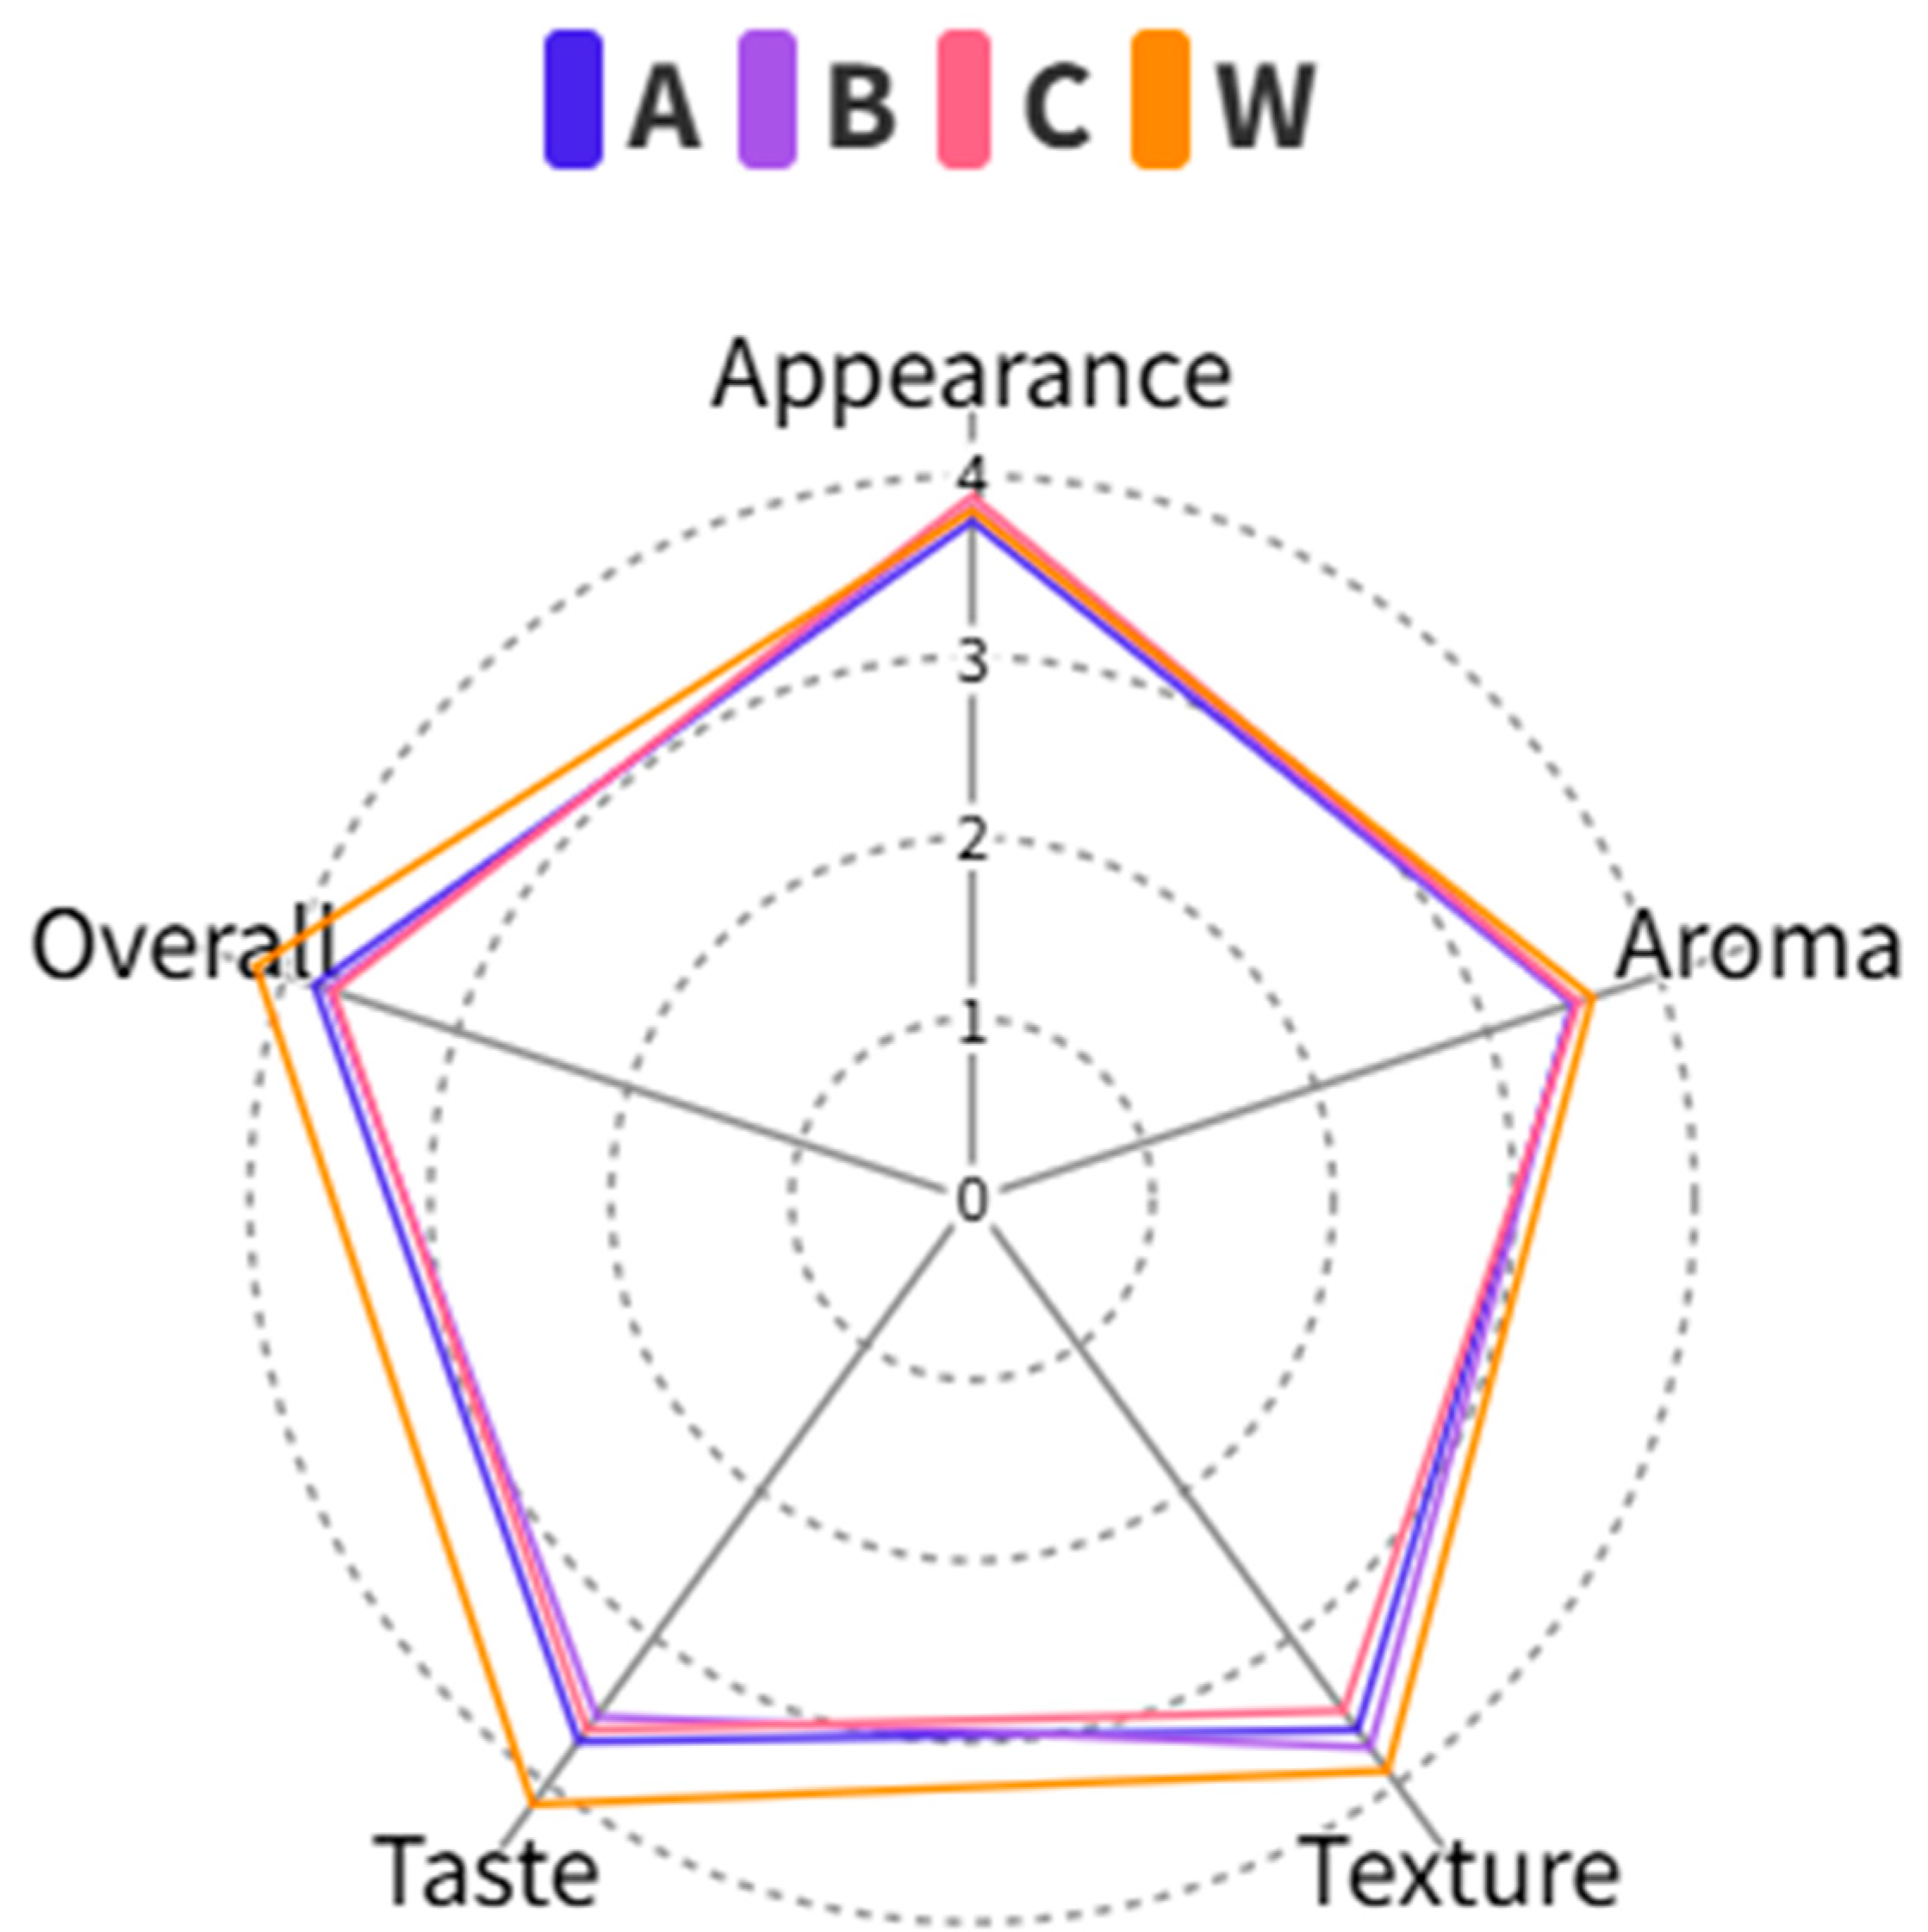
The sensory evaluation of steamed red tilapia filets showed no significant differences in appearance, aroma, texture, or overall acceptability (p > 0.05). However, a significant difference was observed in taste (p = 0.019), with wild tilapia (4.14) receiving a higher score compared to aquaculture samples, particularly the Red Kenyir sample B (3.54). These results suggest that while the visual and textural aspects of steamed fish were similar across all samples, panelists preferred the taste of wild tilapia. This could be attributed to differences in diet and habitat, which may influence flavor development. A related study also evaluated the sensory attributes of steamed tilapia, reporting that aquaculture tilapia retained a good odor and appearance comparable to that of wild samples [1]. The results for sensory evaluation of steamed Red Kenyir™ and wild tilapia are summarized in Table 8 and Figure 5.

3.2.3. Combination Analysis of Deep-Fried and Steamed Red Kenyir™ and Wild Tilapia

The sensory evaluation for a combination of deep-fried and steamed red tilapia filets (Red Kenyir™ A, B, C, and wild sample W) revealed no significant differences across all attributes (p > 0.05). Appearance scores were similar, ranging from 3.88 to 3.96. The aroma, texture, taste and overall acceptability were slightly higher for wild tilapia than Red Kenyir™, but the difference was not statistically significant. In this study, a significant difference in taste was detected only in steamed samples (p = 0.019), with wild tilapia scoring the highest, supporting the view that higher lipid and PUFA levels in wild fish contribute to a superior flavor when not masked by frying. Fat contributes to flavor, aroma, and mouth-coating sensations thus the variations in fat content alter flavor intensity and juiciness [32]. However, this effect did not persist across both cooking methods, limiting its overall impact. Also, protein content and moisture present in fish filets, when altered through denaturation and loss during cooking, play a key role in the development of the characteristic flavor and firmer texture of cooked fish [33]. Thus, Red Kenyir™ sample C, which had the highest protein content (26.54 g/100 g), achieved sensory scores approaching those of wild fish, indicating that compositional differences beyond fat may also contribute to consumer perception. Previous studies have reported that feed composition can influence flavor intensity and consumer preference in tilapia filets, reflecting the strong diet-sensory linkage [8]. In line with these findings, our results demonstrate that although wild tilapia displayed some sensory advantages, Red Kenyir aquaculture tilapia provided a sensory profile largely comparable to that of wild fish across various cooking methods, underscoring its potential as a consumer-acceptable and nutritionally competitive alternative. The results for sensory evaluation of steamed Red Kenyir™ and wild tilapia are summarized in Table 9 and Figure 6.
The detailed profiling of proximate composition, fatty acids, and tryptophan provides a nutritional benchmark for aquaculture producers. Such information can be used to refine feed formulations to optimize growth, filet quality, and nutrient content in Red Kenyir™ tilapia, ensuring consistency with wild counterparts. Sensory results demonstrating comparable acceptability between Red Kenyir™ and wild tilapia directly support marketing strategies for this branded aquaculture product. These findings counteract consumer perceptions that wild fish are superior, enhancing the positioning of farmed tilapia as an alternative. By establishing that aquaculture Red Kenyir™ tilapia offers equivalent nutritional and sensory quality to wild fish, this study provides evidence that aquaculture have the potential to meet consumer expectations while reducing reliance on wild stocks. This contributes to sustainable fisheries management and long-term food security.

3.3. Limitations of the Study

This study has several limitations that should be acknowledged. First, amino acid profiling was restricted to tryptophan, and therefore does not represent the full spectrum of essential and non-essential amino acids in tilapia filets, thus limiting applicability of the findings to real dietary intake. Second, nutrient analysis was performed only on raw filets, while the cooked samples were assessed solely through sensory evaluation. Thus, nutrient retention or losses during cooking were not quantified. Third, the aquaculture samples were collected exclusively from farms in Kenyir Lake, Terengganu, Malaysia, which may limit the generalizability of the findings to other aquaculture regions or production systems. Fourth, the sensory panel (n = 36) comprised mainly institutional staff and may not fully represent the general consumer population.

3.4. Recommendations for Future Study

Future studies should expand amino acid profiling to cover the full amino acid composition, conduct nutrient analyses on cooked samples to better reflect consumer intake, include aquaculture operations from diverse regions and production systems across Malaysia, and evaluate the impact of feed formulations enriched with omega-3 sources on improving the nutritional quality of aquaculture tilapia. Finally, involve larger and more diverse consumer panels to improve representativeness and strengthen the generalizability of sensory findings.

4. Conclusions

The comparative nutritional analysis of Red Kenyir™ and wild red tilapia elucidated a compelling narrative of aquatic excellence. While both share no significant difference for ash, fiber, and mineral contents, wild tilapia recorded higher energy density, protein, and fatty acid composition, particularly omega-3 PUFAs. In contrast, Red Kenyir™ showed lower calorie levels and fat content. On the other hand, the sensory evaluation of red tilapia (Oreochromis sp.) filets, comparing aquaculture and wild, demonstrated that there were no significant differences in most sensory attributes, including appearance, aroma, texture, and overall acceptability, across both deep-fried and steamed preparations. These findings indicate aquaculture can ensure a quality and sensory experience comparable to the wild. To the best of our knowledge, the current study is the first to document the nutritional and sensory attributes of Red Kenyir™ aquaculture tilapia, offering a novel benchmark for consumer preference for supporting its role in sustainable aquaculture. By integrating raw nutrient composition with cooked sensory evaluation, the study contributes new evidence to the aquaculture and food science literature, while supporting the promotion of branded aquaculture products as viable, high-quality alternatives to wild fish.

Author Contributions

Conceptualization: A.A.R., M.A.M.F. and N.I.; methodology and formal analysis: A.A.R., N.I. and M.A.M.F.; sample collection: M.M., M.F.M.N. and N.I.A.; funding acquisition: M.M., M.F.M.N. and N.I.A.; data curation and statistical analysis: M.F.M.N. and M.A.M.F.; sensory evaluation: A.A.R., M.A.M.F. and N.I.; nutritional composition analysis: N.I. and M.F.M.N.; writing—original draft preparation: A.A.R., M.A.M.F. and N.I.; writing—review and editing: M.F.M.N. and N.I.A.; supervision: A.A.R. All authors have read and agreed to the published version of the manuscript.

Funding

This research is funded by Menteri Besar Incorporated (MBI) Terengganu Sdn. Bhd. Reference No. MBI/DOF/2404/086.

Institutional Review Board Statement

The study was approved by the Medical Research and Ethics Committee of the Ministry of Health Malaysia (MREC MOH), approval code: 24-01474-KPK, approval date: 4 July 2024.

Informed Consent Statement

Not applicable.

Data Availability Statement

The data that support the findings of this study are available from the corresponding author upon reasonable request.

Acknowledgments

The authors thank the Director General of Health Malaysia and the Director of the Institute for Medical Research (IMR), Malaysia, for permitting to publish this article. The authors would like to thank the Director of Terengganu State Fisheries Office, Malaysia for supporting this project.

Conflicts of Interest

The authors declare that this study received funding from Menteri Besar Incorporated (MBI) Terengganu Sdn. Bhd. The funder was not involved in the study design, collection, analysis, interpretation of data, the writing of this article or the decision to submit it for publication.

References

  1. Garduño-Lugo, M.; Herrera-Solís, J.R.; Angulo-Guerrero, J.O.; Muñoz-Córdova, G.; De La Cruz-Medina, J. Nutrient composition and sensory evaluation of fillets from wild-type Nile tilapia (Oreochromis sp., Linnaeus) and a red hybrid (Florida red tilapia x red O. niloticus). Aquac. Res. 2007, 38, 1074–1081. [Google Scholar] [CrossRef]
  2. FAO. The State of World Fisheries and Aquaculture 2010. 1 June 2020. Available online: https://openknowledge.fao.org/server/api/core/bitstreams/170b89c1-7946-4f4d-914a-fc56e54769de/content (accessed on 28 September 2025).
  3. Fitzsimmons, K.; Martinez-Garcia, R.; Gonzalez-Alanis, P. Why Tilapia Is Becoming The Most Important Food Fish on The Planet. In Proceedings of the 9th International Symposium on Tilapia in Aquaculture, Shanghai, China, 22–24 April 2011; Available online: www.cabidigitallibrary.org/doi/pdf/10.5555/20133318786 (accessed on 4 September 2025).
  4. Google Maps. Kenyir Lake, Terengganu. 2025. Available online: https://maps.app.goo.gl/r1D7dWt9wBTzYwtp6 (accessed on 30 August 2025).
  5. Yang, J.; Lee, J. Application of sensory descriptive analysis and consumer studies to investigate traditional and authentic foods: A review. Foods 2019, 8, 54. [Google Scholar] [CrossRef] [PubMed]
  6. Ruiz-Capillas, C.; Herrero, A.M. Sensory analysis and consumer research in new product development. Foods 2021, 10, 582. [Google Scholar] [CrossRef]
  7. Francis, L.G.; Aming, M.F.; Idris, S.I.M.; Mazlan, N.; Othman, R.; Fui, C.F.; Shapawi, R.; Shah, M.D. Comparison of nutritional compositions and heavy metals analysis between wild and farmed Tilapia (Oreochromis sp.) and Asian Seabass (Lates sp.) in Sabah, Malaysia. J. Food Compos. Anal. 2024, 133, 106467. [Google Scholar] [CrossRef]
  8. Wan Nooraida, W.M.; Abidah, M.N.; Nur Atikah, I.; Mookiah, S.; Muhammad Amirul, F.; Rafidah, A.H. Sensory evaluation of fillets from tilapia (Oreochromis sp.) fed diets containing oil palm lipids. J. Oil Palm. Res. 2022, 34, 177–183. [Google Scholar]
  9. Obirikorang, K.A.; Amisah, S.; Skov, P.V. Growth Performance, Feed Utilization and Sensory Characteristics of Nile Tilapia, Oreochromis sp. Fed Diets with High Inclusion Levels of Copra Meal. J. Anim. Res. Nutr. 2016, 1, 18. [Google Scholar] [CrossRef]
  10. Sayouh, M.; Ali, M.; Li, Y.; Tao, Y.F.; Lu, S.Q.; Qiang, J. Differences in Growth Performance and Meat Quality between Male and Female Juvenile Nile Tilapia (Oreochromis sp.) during Separate Rearing. Animals 2024, 14, 2954. [Google Scholar] [CrossRef]
  11. Malaysian Food Composition Database (MYFCD). Protocol for Sampling and Method of Analysis for Malaysian Food Composition Database; Malaysian Food Composition Database (MYFCD): Putrajaya, Malaysia, 2011. [Google Scholar]
  12. AOCS. Fatty acid composition by gas chromatography (Reapproved 1997). In Official Methods and Recommended Practices of the AOCS, 5th ed.; AOCS: Urbana, IL, USA, 1997. [Google Scholar]
  13. ASTM International. Guide for Serving Protocol for Sensory Evaluation of Foods and Beverages. E1871−17. 1 September 2017. Available online: http://www.astm.org/cgi-bin/resolver.cgi?E1871-17 (accessed on 29 August 2025).
  14. Codex Alimentarius Commission. Guidelines for the Sensory Evaluation of Fish and Shellfish in Laboratories (CAC/GL 31-1999); FAO: Rome, Italy; WHO: Geneva, Switzerland, 1999. [Google Scholar]
  15. Abd-Allah, S.M.S.; Ismail, H.A.A. Quality parameters and nutritive value of wild and cultured Nile tilapia sold in assiut city, egypt. Assiut Vet. Med. J. 2016, 62, 90–100. [Google Scholar]
  16. Islam, S.; Bhowmik, S.; Majumdar, P.R.; Srzednicki, G.; Rahman, M.; Hossain, M.A. Nutritional profile of wild, pond-, gher- and cage-cultured tilapia in Bangladesh. Heliyon 2021, 7, e06968. [Google Scholar] [CrossRef]
  17. Al-Taee, A.M.; Yesser, A.T.; Alhamdany, Q.H.; Al-Faiz, N.A. Chemical composition and nutritive value of wild and cultured Tilapia, Southern Iraq. J. Homepage Ijichthyol. Iran J. Ichthyol. 2022, 9, 124–130. [Google Scholar]
  18. Job, B.E.; Antai, E.E.; Inyang-Etoh, A.P.; Otogo, G.A.; Ezekiel, H.S. Proximate composition and mineral contents of cultured and wild tilapia (Oreochromis sp.) (pisces: Cichlidae) (linnaeus, 1758). Pak. J. Nutr. 2015, 14, 195–200. [Google Scholar] [CrossRef]
  19. Raymond, J.K.; Onyango, A.N.; Onyango, C.A. Proximate Composition and Mineral Contents of Farmed and Wild Fish in Kenya. J. Food Res. 2020, 9, 53. [Google Scholar] [CrossRef]
  20. Aberoumand, A. Proximate composition of less known some processed and fresh fish species for determination of the nutritive values in Iran. J. Agric. Technol. 2012, 8, 917–922. [Google Scholar]
  21. Morady, Y.; Mashaeii, N.; Karami, B.; Zare Ghasti, G. Investigation on proximate composition, fatty acid profile and sensory evaluation of Nile (Oreochromis sp.) and Hybrid Red Tilapia fillet farmed in brackish ground water of Bafgh, Yzad. Iran. Sci. Fish. J. 2012, 21, 125–132. [Google Scholar]
  22. Karapanagiotidis, I.T. Nutrient profiles of tilapia. In Tilapia in Intensive Co-Culture; Wiley: Hoboken, NJ, USA, 2017; pp. 261–305. [Google Scholar]
  23. Olopade, O.A.; Taiwo, I.O.; Lamidi, A.A.; Awonaike, O.A. Proximate Composition of Nile Tilapia (Oreochromis sp.) (Linnaeus, 1758) and Tilapia Hybrid (Red Tilapia) from Oyan Lake, Nigeria. Bull. Univ. Agric. Sci. Vet. Med. Cluj-Napoca Food Sci. Technol. 2016, 73, 19–23. [Google Scholar]
  24. Kalaiselvan, P.; Ranjan, A.; Thangarani, A.J.; Felix, N.; Akamad, D.K. The Fate of Dietary Tryptophan in Fish: Unveiling Its Sources, Transport, Metabolism, and Multifaceted Impacts. J. Nutr. 2025, 155, 2017–2042. [Google Scholar] [CrossRef]
  25. Ahmed, I.; Ahmad, I.; Malla, B.A. Effects of dietary tryptophan levels on growth performance, plasma profile, intestinal antioxidant capacity and growth related genes in rainbow trout (Oncorhynchus mykiss) fingerlings. Aquaculture 2024, 15, 585. [Google Scholar] [CrossRef]
  26. Zhang, X.; Chang, E.; Fu, Y.; Liu, X.; Xu, J.; Wu, Y.; Wang, A.; Dong, X.; Miao, S. Tryptophan can alleviate the inhibition in growth and immunity of tilapia (GIFT Oreochromis spp.) induced by high dietary soybean meal level. Aquac. Rep. 2023, 31, 101646. [Google Scholar] [CrossRef]
  27. Al Hafedh, Y.S. Effects of dietary protein on growth and body composition of Nile tilapia, Oreochromis sp. L. Aquac Res. 1999, 30, 385–393. [Google Scholar] [CrossRef]
  28. Suloma, A.; Ogata, H.Y.; Garibay, E.S.; Chavez, D.R.; El-Haroun, E.R. Fatty Acid Composition of Nile Tilapia Oreochromis sp. Muscles: A Comparative Study with Commercially Important Tropical Freshwater Fish in Philippines. 2008. Available online: https://www.researchgate.net/publication/268005488 (accessed on 4 September 2025).
  29. Turchini, G.M.; Torstensen, B.E.; Ng, W.K. Fish Oil Replacement in Finfish Nutrition; Reviews in Aquaculture; Wiley-Blackwell: Hoboken, NJ, USA, 2009; Volume 1, pp. 10–57. [Google Scholar]
  30. Mchazime, I.; Kapute, F. Sensory and nutrient quality of wild captured Oreochromis shiranus (Boulenger, 1897) stored at ambient temperature. Int. Food Res. J. 2018, 25, 127–132. [Google Scholar]
  31. Mekonnen, M.F.; Desta, D.T.; Alemayehu, F.R.; Kelikay, G.N.; Daba, A.K. Evaluation of fatty acid-related nutritional quality indices in fried and raw nile tilapia, (Oreochromis sp.), fish muscles. Food Sci. Nutr. 2020, 8, 4814–4821. [Google Scholar] [CrossRef]
  32. Villatoro, K.M.; Yang, F.; Duarte, T.; Phillips, C.R.; Woerner, D.R.; Chao, M.D.; Yang, X. Quality, proximate composition, and sensory characteristics of Dorper, domestic commercial crossbred, and Australian sheep meat: A comparative study. Transl. Anim. Sci. 2021, 5, txab024. [Google Scholar] [CrossRef]
  33. Gokoglu, N.; Yerlikaya, P.; Cengiz, E. Effects of cooking methods on the proximate composition and mineral contents of rainbow trout (Oncorhynchus mykiss). Food Chem. 2004, 84, 19–22. [Google Scholar] [CrossRef]
Figure 1. Industrial aquaculture zone at Como River, Kenyir Lake, Terengganu, Malaysia. A, B & C shows the different sampling locations. Imagery © 2025 Airbus, CNES/Airbus, Maxar Technologies, Map data © Google. Retrieved from https://maps.google.com, accessed on 30 August 2025 [4].
Fishes 10 00523 g001
Figure 2. Division of fish into dorsal and ventral filet blocks along the anteroposterior axis.
Fishes 10 00523 g002
Figure 3. Serving method and panelist arrangement for sensory evaluation.
Fishes 10 00523 g003
Figure 4. Sensory evaluation of deep-fried red tilapia (Oreochromis sp.). A, B, & C are Red Kenyir™. W is wild.
Fishes 10 00523 g004
Figure 5. Sensory evaluation of steamed red tilapia (Oreochromis sp.). A, B, & C are Red Kenyir™. W is wild.
Fishes 10 00523 g005
Figure 6. Sensory evaluation of deep-fried and steamed red tilapia (Oreochromis sp.). A, B, & C are Red Kenyir™. W is wild.
Fishes 10 00523 g006
Table 1. Sampling Locations.
Sample No.LocationsFish Meal
AKenyir Lake Aquaculture AFish Meal 1
BKenyir Lake Aquaculture BFish Meal 2
CKenyir Lake Aquaculture CFish Meal 1 + Fish Meal 3
WWildNot Applicable
Note: Fish Meal 1 (28% Crude Protein); Fish Meal 2 (20% Crude Protein); Fish Meal 3 (27% Crude Protein).
Table 2. Proximate analysis of red tilapia (Oreochromis sp.).
ParametersABCWp-Value
Proximate Analysis
Unitsg/100 g of Wet Raw Edible Portion of Fish Filet
Calorieskcal77.38 ± 4.47 a85.46 ± 2.50 a113.46 ± 3.76 b132.79 ± 4.69 c0.000
Total fatg0.25 ± 0.02 a1.37 ± 1.76 a1.04 ± 0.06 a4.30 ± 0.36 b0.010
Total carbohydrateg0.15 ± 0.10 a1.12 ± 0.05 a1.50 ± 0.53 a0.40 ± 0.99 a0.202
Proteing19.00 ± 0.78 a19.82 ± 0.67 ac26.54 ± 0.20 b22.95 ± 1.17 c0.002
Moisture contentg79.27 ± 0.88 a77.34 ± 0.73 a70.27 ± 0.76 b70.96 ± 0.76 b0.001
Ash contentg1.5 ± 0.10 a1.50 ± 0.11 a1.55 ± 0.06 a1.31 ± 0.09 a0.186
Total dietary fibergNDNDNDNDND
Tukey post hoc analysis: different superscript letters indicate significant difference between groups within the same row (p < 0.05). ND: not detected due to values lower than detection limit. p < 0.05 indicates significant differences for ANOVA.
Table 3. Minerals analysis of red tilapia (Oreochromis sp.).
ParametersABCWp-Value
Minerals
Units>mg/100 g of Wet Raw Edible Portion of Fish Filet
Ironmg/100 g0.44 ± 0.030.41 ± 0.020.41 ± 0.010.38 ± 0.020.999
Zincmg/100 g0.33 ± 0.020.28 ± 0.000.38 ± 0.010.43 ± 0.010.990
Magnesiummg/100 g23.15 ± 1.4825.80 ± 1.0233.63 ± 0.9528.66 ± 0.980.994
Phosphorusmg/100 g169.76 ± 12.58163.12 ± 2.64229.99 ± 6.94212.31 ± 0.170.993
Sodiummg/100 g127.05 ± 5.5085.53 ± 3.95106.81 ± 2.1671.96 ± 3.390.975
Calciummg/100 g42.84 ± 8.0827.26 ± 9.9857.86 ± 0.7879.43 ± 0.820.945
Potassiummg/100 g344.82 ± 14.41356.53 ± 16.11473.57 ± 9.64373.55 ± 10.600.995
p < 0.05 indicates significant differences for ANOVA. Tukey post hoc analysis was not conducted due to the lack of significant differences.
Table 4. Tryptophan analysis of red tilapia (Oreochromis sp.).
ParametersABCWp-Value
Unitsg/100 g of Wet Raw Edible Portion of Fish Filet
Tryptophang/100 g0.13 ± 0.00 a0.16 ± 0.03 ab0.23 ± 0.03 b0.19 ± 0.00 ab0.039
p < 0.05 indicates significant differences for ANOVA. Tukey post hoc analysis: different superscript letters indicate significant difference between groups within the same row (p < 0.05).
Table 5. Fatty acids composition of red tilapia (Oreochromis sp.).
ParametersABCWp-Value
Fatty Acids
Unitsg/100 g of Wet Raw Edible Portion of Fish Filet
Saturated Fatty Acids (SFA)g0.0610.1370.1451.6870.072
Monounsaturated Fatty Acids (MUFA)g0.0260.050<0.0101.7650.072
Polyunsaturated Fatty Acids (PUFA)g<0.010<0.010<0.0100.9210.072
Caprylic Acid (C8:0)g<0.010<0.0100.021<0.0100.072
Lauric Acid (C12:0)g<0.0100.0530.1240.0590.072
Myristic Acid (C14:0)g<0.0100.015<0.0100.1640.072
Palmitic Acid (C16:0)g0.0450.046<0.0101.1410.075
Palmitoleic Acid (C16:1)g<0.010<0.010<0.0100.2580.072
Stearic Acid (C18:0)g0.0160.023<0.0100.2660.072
Oleic Acid (C18:19c)g0.0260.050<0.0101.4030.072
Linoleic Acid (C18:2n6c)g<0.010<0.010<0.0100.6270.072
Linolenic Acid (C18:3n3)g<0.010<0.010<0.0100.0910.072
Eicosanoic Acid (C20:1)g<0.010<0.010<0.0100.0780.072
Heneicosanoic Acid (C21:0)g<0.010<0.010<0.0100.0570.072
cis-11,14,17-Eicosatrienoic Acid (C20:3n3)g<0.010<0.010<0.0100.1070.072
Nervonic Acid (C24:1)g<0.010<0.010<0.0100.0260.072
DHA (C22:6n3)g<0.010<0.010<0.0100.0960.072
<0.010 is the analytical lower limit of detection. p < 0.05 indicates significant differences for Kruskall–Wallis testing. Pairwise analysis was not conducted due to the lack of significant differences.
Table 6. Demographic of the panelist.
N%p-Value
Age
18–2412.8<0.001
25–341130.6
35–441438.9
45–54925.0
55+12.8
Total36100.0
Ethnicity
Malay2569.4<0.05
Chinese12.8
Indian25.6
Others822.2
Total36100.0
Fish Consumption Frequency
1. Freshwater Fish
Never25.6<0.05
Twice a month2158.3
Once or twice a week1027.8
3 or 6 times a week12.8
Once a day00.0
More than 3 times a day25.6
Total36100.0
2. Marine Fish
Did Not Answer12.8<0.05
Never12.8
Twice a month411.1
Once or twice a week1541.7
3 or 6 times a week1336.1
Once a day12.8
More than 3 times a day12.8
Total36100.0
Note: p < 0.05 are significant for chi-square test.
Table 7. Sensory evaluation of deep-fried red tilapia (Oreochromis sp.).
AttributesSamplep-Value
ABCW
Appearance4.00 ± 0.8283.97 ± 0.6964.03 ± 0.7744.03 ± 0.8100.989
Aroma3.61 ± 0.9033.56 ± 1.0543.61 ± 0.7663.92 ± 0.7700.295
Texture3.80 ± 0.7593.86 ± 1.0183.89 ± 0.7853.72 ± 0.8820.853
Taste3.81 ± 0.9513.78 ± 1.0453.78 ± 0.9293.86 ± 0.7980.979
Overall2.94 ± 0.9843.97 ± 1.0554.06 ± 0.7914.11 ± 0.7470.856
Note: A, B, & C are aquaculture red tilapia. W is wild red tilapia. p < 0.05 are significant differences for ANOVA test. Tukey post hoc analysis was not conducted due to the lack of significant differences.
Table 8. Sensory evaluation of steamed red tilapia (Oreochromis sp.).
AttributesSamplep-Value
ABCW
Appearance3.75 ± 0.874 a3.83 ± 0.737 a3.89 ± 0.708 a3.81 ± 0.822 a0.900
Aroma3.50 ± 0.811 a3.50 ± 0.878 a3.53 ± 0.878 a3.61 ± 1.022 a0.947
Texture3.63 ± 0.942 a3.75 ± 0.841 a3.50 ± 0.878 a3.91 ± 0.906 a0.239
Taste3.71 ± 0.871 ab3.54 ± 0.950 a3.63 ± 0.731 ab4.14 ± 0.845 b0.019
Overall3.83 ± 0.910 a3.75 ± 0.937 a3.72 ± 0.779 a4.17 ± 0.878 a0.124
Note: A, B, & C are aquaculture red tilapia, Red Kenyir™. W is wild red tilapia. p < 0.05 are significant differences for ANOVA test. Tukey Post hoc Analysis: different superscript letters indicate significant difference between groups within the same row (p < 0.05).
Table 9. Sensory evaluation of deep-fried and steamed red tilapia (Oreochromis sp.).
AttributesSamplep-Value
ABCW
Appearance3.88 ± 0.8553.90 ± 0.7153.96 ± 0.7403.92 ± 0.8180.935
Aroma3.56 ± 0.8543.53 ± 0.9643.57 ± 0.8193.76 ± 0.9110.366
Texture3.71 ± 0.8543.81 ± 0.9293.69 ± 0.8503.82 ± 0.8930.776
Taste3.76 ± 0.9083.66 ± 0.9993.70 ± 0.8354.00 ± 0.8280.111
Overall3.89 ± 0.9433.86 ± 0.9973.89 ± 0.7974.14 ± 0.8100.204
Note: A, B, & C are aquaculture red tilapia. W is wild red tilapia. p < 0.05 are significant differences for ANOVA test. Tukey post hoc analysis was not conducted due to the lack of significant differences.
Disclaimer/Publisher’s Note: The statements, opinions and data contained in all publications are solely those of the individual author(s) and contributor(s) and not of MDPI and/or the editor(s). MDPI and/or the editor(s) disclaim responsibility for any injury to people or property resulting from any ideas, methods, instructions or products referred to in the content.