Article

Acoustic Estimation of Blue Mackerel (Scomber australasicus) Spawning Biomass in Yilan Bay, Taiwan: Integrating Depth Compensation and Fishery Data (2021–2024)

by
Ting-Chieh Huang
1,2,
Kuo-Wei Yen
2,
Ruei-Gu Chen
3,
Chia-Hsu Chih
2 and
Hsueh-Jung Lu
1,4,*
1
Department of Environment Biology and Fishery Science, National Taiwan Ocean University, No. 2, Beining Rd., Keelung City 202301, Taiwan
2
Marine Fisheries Division, Fisheries Research Institute, Ministry of Agriculture, No. 199, He 1st Rd., Keelung City 202008, Taiwan
3
Penghu Fishery Research Center, Fisheries Research Institute, Ministry of Agriculture, No. 266, Shili, Magong City 880033, Penghu County, Taiwan
4
Center of Excellence for the Oceans, National Taiwan Ocean University, No. 2, Beining Rd., Keelung City 202301, Taiwan
*
Author to whom correspondence should be addressed.
Fishes 2025, 10(10), 522; https://doi.org/10.3390/fishes10100522
Submission received: 19 August 2025 / Revised: 28 September 2025 / Accepted: 11 October 2025 / Published: 14 October 2025

Abstract

The mackerel fishery is Taiwan’s most productive coastal fishery sector, with the blue mackerel (Scomber australasicus) being its primary target species. Given the economic and ecological significance of this fishery, considerable attention has been devoted to assessing stock status and promoting sustainable use. Between 2021 and 2024, acoustic transect surveys were conducted in Yilan Bay during the blue mackerel spawning season, supplemented by hook-and-line sampling to confirm the identity of single-target acoustic signals. Acoustic detections within ±10 m of capture depth and ±10 min of capture time were used to establish a depth-compensated regression model linking target strength (TS) to fork length (FL). Validation revealed that over 80% of the hook-and-line samples were blue mackerel. After careful noise filtering, a depth-compensated regression model was established to relate TS to FL and sampling depth. The model incorporated both logarithmic body length and depth terms, effectively accounting for vertical variations in TS. The model improved alignment with biological sampling data by effectively accounting for depth-related variations in TS, thereby enhancing biomass estimation accuracy. Cross-validation with auction records from Nan-Fang-Ao Fishing Harbor confirmed that the acoustic biomass estimates closely mirrored commercial catch trends. These findings highlight the effectiveness of depth-compensated acoustic methodologies for obtaining reliable, fishery-independent spawning biomass estimates, supporting their continued application in long-term monitoring and spatial resource management.
Key Contribution: In this study, we developed a depth-compensated target strength model for blue mackerel (Scomber australasicus) that significantly improves the accuracy of fishery-independent acoustic biomass estimates in Yilan Bay. By integrating four years of hydroacoustic surveys with commercial fishery data, the research provides robust evidence supporting the use of acoustic methods as a reliable tool for spawning stock assessment and fisheries management.

1. Introduction

The Taiwanese purse-seine fishery is one of the most productive coastal and offshore fisheries in the region, primarily targeting blue mackerel (Scomber australasicus), chub mackerel (Scomber japonicus), and jack mackerel (Trachurus japonicus) [1,2]. The northeastern waters of Taiwan, particularly the area between Pengjia Islet and Nan-Fang-Ao, are critical spawning and feeding grounds for these pelagic species. These habitats are shaped by dynamic oceanographic features, including the Kuroshio Current and coastal upwelling [3]. Among the targeted species, blue mackerel is the most abundant in Taiwanese waters and typically occupies surface to midwater depths, extending to approximately 200 m [4]. In the East China Sea, blue mackerel migrate southward to the waters around Taiwan to spawn between January and May and then gradually return northward as sea surface temperatures rise in summer [5].
In recent decades, concerns have been raised over the declining abundance of mackerel stocks, driven by a combination of intensified fishing pressure and shifts in oceanographic conditions. These concerns are exacerbated by the ecological importance of mackerel and the observed decline in catches [6]. In response, the Taiwanese government introduced the Mackerel and Carangid Fishery Management Measures in February 2013 through the Fisheries Agency of the Council of Agriculture—now the Fisheries Agency of the Ministry of Agriculture (FA, MOA)—to promote sustainable use of key pelagic resources. These measures include an annual ban from June 1 to June 30, during which the use of net gears targeting mackerel and carangid species is prohibited north of 24° N latitude. In 2018, additional restrictions were proposed, extending the closure to a 20-day period during the Lunar New Year (from the 29th day of the 12th lunar month to the 18th day of the 1st lunar month), with flexibility for future adjustments based on resource status and management outcomes.
However, environmental variability may be altering the reproductive dynamics of mackerel populations [7]. For instance, Sinaga et al. [8] reported shifts in the spawning season and frequency of blue mackerel, possibly linked to rising sea temperatures. In addition, the effectiveness of local management measures may be undermined by external fishing pressures and climate-induced habitat changes [2]. Most importantly, many studies rely on fishery-dependent data—such as landings statistics and biological sampling—raising concerns about their ability to capture real-time fluctuations in spawning biomass.
Over the past decade, numerous investigations have attempted to characterize the abundance and distribution of mackerel and carangid resources [9,10,11]. However, most of these studies relied on fishery-dependent indicators. In the northeastern waters of Taiwan, critical spawning habitats have been identified around the Northern Three Islets (Pengjia, Mianhua, and Huaping), Diaoyutai Island, and Yilan Bay (Figure 1), based mainly on commercial fishing activities and plankton-based indices [8,12]. Wei [13] described blue mackerel spawning grounds extending from the Mianhua Submarine Canyon to the offshore waters of Yilan, with peak spawning between March and May. Liao et al. [14] similarly documented chub mackerel spawning between Pengjia Islet and the offshore area near Su’ao during the same period. These findings suggest that Yilan Bay is the southernmost boundary of blue mackerel spawning activity.
However, dependence on fishery-based indicators for stock assessments introduces substantial uncertainty. Estimates derived from such data are prone to biases from variable fishing effort, environmental fluctuations, and market-driven dynamics [15,16,17]. In Taiwan, assessments of mackerel resources have primarily relied on fishery-dependent methods, including catch reports and port sampling [18,19]. While these approaches provide valuable information, they are limited by potential biases related to fishing effort and fisher behavior. Although prior studies offered valuable insights into the temporal and spatial distribution of spawning [13,14], the absence of fishery-independent assessments limits the reliable estimation of the true spawning biomass.
To address this gap, the present study applies fishery-independent acoustic surveys to estimate the spawning biomass of blue mackerel in Yilan Bay, located at the southern edge of their known spawning grounds. This approach provides spatially resolved insights into spawning habitat use and complements existing fishery-dependent knowledge of blue mackerel reproductive ecology. Acoustic surveys—widely applied in fisheries science for estimating pelagic species distribution and abundance—are recognized for their non-destructive nature [20,21,22,23]. Given the seasonality and spatial aggregation of blue mackerel during spawning, acoustic methods are particularly well suited for monitoring these populations.
To enhance the robustness of acoustic-based biomass estimates, this study incorporates a depth-adjusted TS model to correct for vertical variability in echo intensity, which is known to introduce bias if unaccounted for [24,25]. Acoustic-derived biomass estimates are then compared with commercial fishery records to assess consistency and evaluate the applicability of acoustic methods in regional stock assessments. Drawing on four years of fishery-independent acoustic surveys, this study provides a more accurate, ecologically grounded framework for estimating spawning biomass and informing sustainable fishery management in Taiwanese waters.

2. Materials and Methods

2.1. Survey Area and Transect Design

The research area, Yilan Bay in northeastern Taiwan (Figure 1), is a key fishing ground for blue mackerel. Acoustic surveys were conducted during the spawning seasons from 2021 to 2024, with 8 transects in 2021 and 2022 and 6 in 2023 and 2024. Although acoustic surveys were conducted in all four years (2021–2024), biological sampling data (e.g., catch composition, TS–FL regression) were available only for 2021–2023, as logistical constraints prevented sampling in 2024. Nevertheless, acoustic and commercial data from 2024 were included to maintain a continuous four-year dataset. The survey design aimed to ensure a coverage coefficient greater than 2 whenever possible, in accordance with Aglen [26], who recommended this threshold to reduce random error in acoustic abundance estimates. The transect layout was designed to span various depths, crossing isobaths from the shallow coastal zone to approximately 200 m, thereby encompassing the known vertical distribution range of spawning blue mackerel in Yilan Bay. Previous studies report that blue mackerel in Taiwanese waters spawn primarily from January to May, with peak activity in April [27,28]. Therefore, all surveys in this study were scheduled within this period to coincide with peak reproductive aggregations.
Commercial fishing vessels were employed to conduct acoustic surveys in 2021, 2022, and 2024 with a portable Simrad EY60 echo sounder (Kongsberg Maritime, Kongsberg, Norway). In 2023, the survey was conducted using the R/V Fishery Researcher 2, equipped with a Simrad EK60 echo sounder system (Kongsberg Maritime, Kongsberg, Norway). Survey speeds were maintained between 4 and 6 knots to ensure data stability and minimize distortion from vessel motion.
Given that species such as mackerels exhibit positive phototaxis and are frequently targeted at night with light-based fishing techniques [8,29], all surveys were conducted during daylight hours. This protocol aimed to minimize behavioral disturbance and improve the accuracy of acoustic detections by capturing fish in their natural, undisturbed distribution. The phototactic behavior of mackerels has also been confirmed experimentally under controlled light conditions, particularly in Atlantic mackerel [30,31].

2.2. Echo Sounder Calibration

To ensure accurate acoustic measurements, the echo sounder system was calibrated prior to each survey following established protocols [32]. Calibration was performed using Simrad ER60 software (v2.1.0, Kongsberg Maritime, Kongsberg, Norway), with data recorded during the procedure. A standard 13.7 mm calibration sphere was suspended 15 to 20 m from the transducer.
Before each calibration, water temperature and salinity were measured with a thermometer and a salinometer to calculate the speed of sound in water. This step minimized potential deviations and ensured reliable calibration results under varying environmental conditions. The echo sounder system settings for each device are summarized in Table 1.

2.3. Experimental Operations

Biological sampling was conducted using hook-and-line methods [33], with capture time, depth, and species systematically recorded. To distinguish between blue mackerel (Scomber australasicus) and chub mackerel (Scomber japonicus), preliminary identification followed morphological criteria referenced from Taiwan FishBase [34]. Specifically, individuals with more than 11 first dorsal fin spines were classified as blue mackerel. Those with exactly 10 spines were further examined for spots below the lateral line extending to the abdomen; if present, they were also classified as blue mackerel. Corresponding echo sounder data were analyzed within a 20 m vertical window (±10 m from capture depth) and a 10 min interval preceding each catch. The mean TS within this window was assigned as the TS value for the individual fish [35,36]. This approach established the relationship between individual body length and acoustic backscatter intensity (TS), forming the basis for subsequent TS–FL model development [37]:
T S = m × log L b
m: slope.
b: intercept.
Matched biological and acoustic data were grouped into 1 cm FL intervals and stratified into shallow (≤50 m) and deep (>50 m) layers. For each group, mean TS and mean capture depth were calculated. A simple linear regression was then applied to quantify the compensatory relationship between TS and depth. The resulting depth-corrected TS values were subsequently integrated into the original TS–FL model, yielding an adjusted TS–FL–depth model. This approach accounted for both morphological and environmental influences on acoustic backscatter, thereby improving length estimation accuracy under varying depth conditions [38,39].
Despite these methodological improvements, some limitations remain. Hook-and-line sampling, for instance, may introduce selectivity bias by favoring more active individuals. Additionally, environmental factors such as temperature and salinity can affect acoustic signal propagation. Nonetheless, careful instrument calibration and standardized survey protocols were rigorously applied to minimize these sources of uncertainty.

2.4. Data Processing and Analysis

Acoustic data were processed and analyzed using Echoview software (v12, Echoview Software Pty Ltd., Vancouver, Australia). Echoes were classified into biological and non-biological signals. Biological echoes formed the basis for biomass estimation, while non-biological signals—originating from surface turbulence, fishing gear, air bubbles, or electronic noise—were filtered out to ensure data quality [40]. For instance, signals detected within five meters of the surface were excluded, and non-biological echoes were labeled as “bad data.” During the data export, these echoes were assigned blank values and omitted from subsequent echo integration analyses.
The Elementary Sampling Distance Unit (ESDU) was defined as a horizontal interval of 500 m and a vertical interval of 50 m. Since blue mackerel typically inhabit depths shallower than 200 m, acoustic analyses were limited to a maximum depth of 200 m.
The abundance index Sv is defined as the mean scattering intensity per unit volume [37]:
s v = n × σ b s V , S v = 10 log 10 s v
where sv is the linear volume backscattering coefficient (m−1), n is the number of targets in the sampled volume, σbs is the backscattering cross-section of a single individual (m2), V is the sampled water volume (m3), and Sv is the mean volume backscattering strength (dB re 1 m−1).
By substituting definitions and applying a logarithmic transformation, the volume backscattering strength Sv can be explicitly related to known acoustic and physical parameters, namely the target number density (n/V) and the TS:
S v = 10 log 10 n × σ b s V = 10 log 10 n V + 10 log 10 σ b s = 10 log 10 n V + T S
where Sv is the mean volume backscattering strength (dB re 1 m−1), n is the number of targets, σbs is the backscattering cross-section of a single individual (m2), V is the sampled water volume (m3), and TS is the target strength of an individual fish (dB re 1 m2).
From this, the total number of individuals (n) in the sampled volume can be calculated using
n = 10 S v T S 10 × V
where n is the number of targets, Sv is the volume backscattering strength (dB re 1 m−1), TS is the target strength (dB re 1 m2), and V is the sampled water volume (m3).
To facilitate comparison with other studies and to express abundance in standardized units, Sv was also converted to the Nautical Area Scattering Coefficient (NASC), the vertically integrated backscatter standardized to one nautical mile [37]. While the NASC was used for reporting standardized abundance indices, subsequent biomass estimates were calculated directly from Sv First, Sv was converted to its linear form:
s v = 10 S v 10
The area backscattering coefficient was then obtained by integrating sv over the vertical thickness of the scattering layer (T):
s a = Z 1 Z 2 s v d z s v × T
Finally, the NASC was calculated by scaling sa to standardized units in nautical miles:
s A = 4 π 1852 2   × s a = 4 π   ×   1852 2 × 10 S v 10 × T
sA represents the NASC (m2/n.mi.2), 4π is the geometric factor used in the conversion of Sv (dB) to scattering cross-section per unit area, Sv is the volume backscattering strength (dB), and T is the thickness of the scattering layer (m).
The biomass estimation process can be summarized in a stepwise manner, illustrating how acoustic measurements are converted into target density and biomass:
1.
Filter echoes to remove non-biological signals.
2.
Compute Sv from the filtered echoes.
3.
Calculate the number of targets (n) using Sv and TS.
4.
Convert Sv to the NASC for standardized abundance reporting, while retaining Sv for standing-crop calculations.
5.
Estimate individual weight using length–weight relationships.
6.
Calculate the standing crop in the survey area.
Acoustic estimates were converted to biomass using length–weight relationships to facilitate comparison with commercial fishery data. To reduce inaccuracies in weight measurements from fishing experiments, TS values were first converted to fork length (FL) and then to body weight (BW) using the following equation [6]:
B W = 0.005   ×   F L 3.276
where BW is the body weight (g) and FL is the fork length (cm)
After obtaining individual weight estimates, and assuming a uniform density of blue mackerel within and outside the surveyed transects, total standing biomass in Yilan Bay was calculated in two steps. First, the total number of individuals (n) in the sampled volume (V) was derived from the measured Sv and the known TS using
n = 10 S v T S 10 ×   V
where n is the number of blue mackerel, Sv is the volume backscattering strength (dB re 1 m−1), TS is the target strength of an individual fish (dB re 1 m2), and V is the sampled water volume (m3).
Second, the density of blue mackerel (D) was calculated using
D = n V = 10 S v T S 10
Finally, the total standing crop in the survey area was obtained by multiplying the density by the total survey volume and the mean individual weight (W):
S t a n d i n g   c r o p   = V   ×   D × W
where Standing crop is the total biomass of blue mackerel within the surveyed area (kg), V is the water volume of the surveyed area (m3), D is the density of blue mackerel (ind./m3), and W is the mean weight of blue mackerel (kg).
These calculations enabled the derivation of both individual density and biomass estimates, forming the basis for subsequent comparison with commercial landings.

2.5. Commercial Fishing Data

Commercial catch data for blue mackerel were obtained from Nan-Fang-Ao Fishery Harbor, the primary landing site for vessels operating in Yilan Bay. These data included total landings recorded throughout the spawning season, as well as short-term landings collected within a 7-day window before and after each acoustic survey. Following the approach of Alglave et al. [41], who combined scientific surveys with commercial fishery data, the present study analyzed commercial catch data alongside acoustic biomass estimates to assess both long-term seasonal trends and short-term variability in blue mackerel abundance (Table 2).

3. Results

3.1. Catch Composition and Sampling Overview

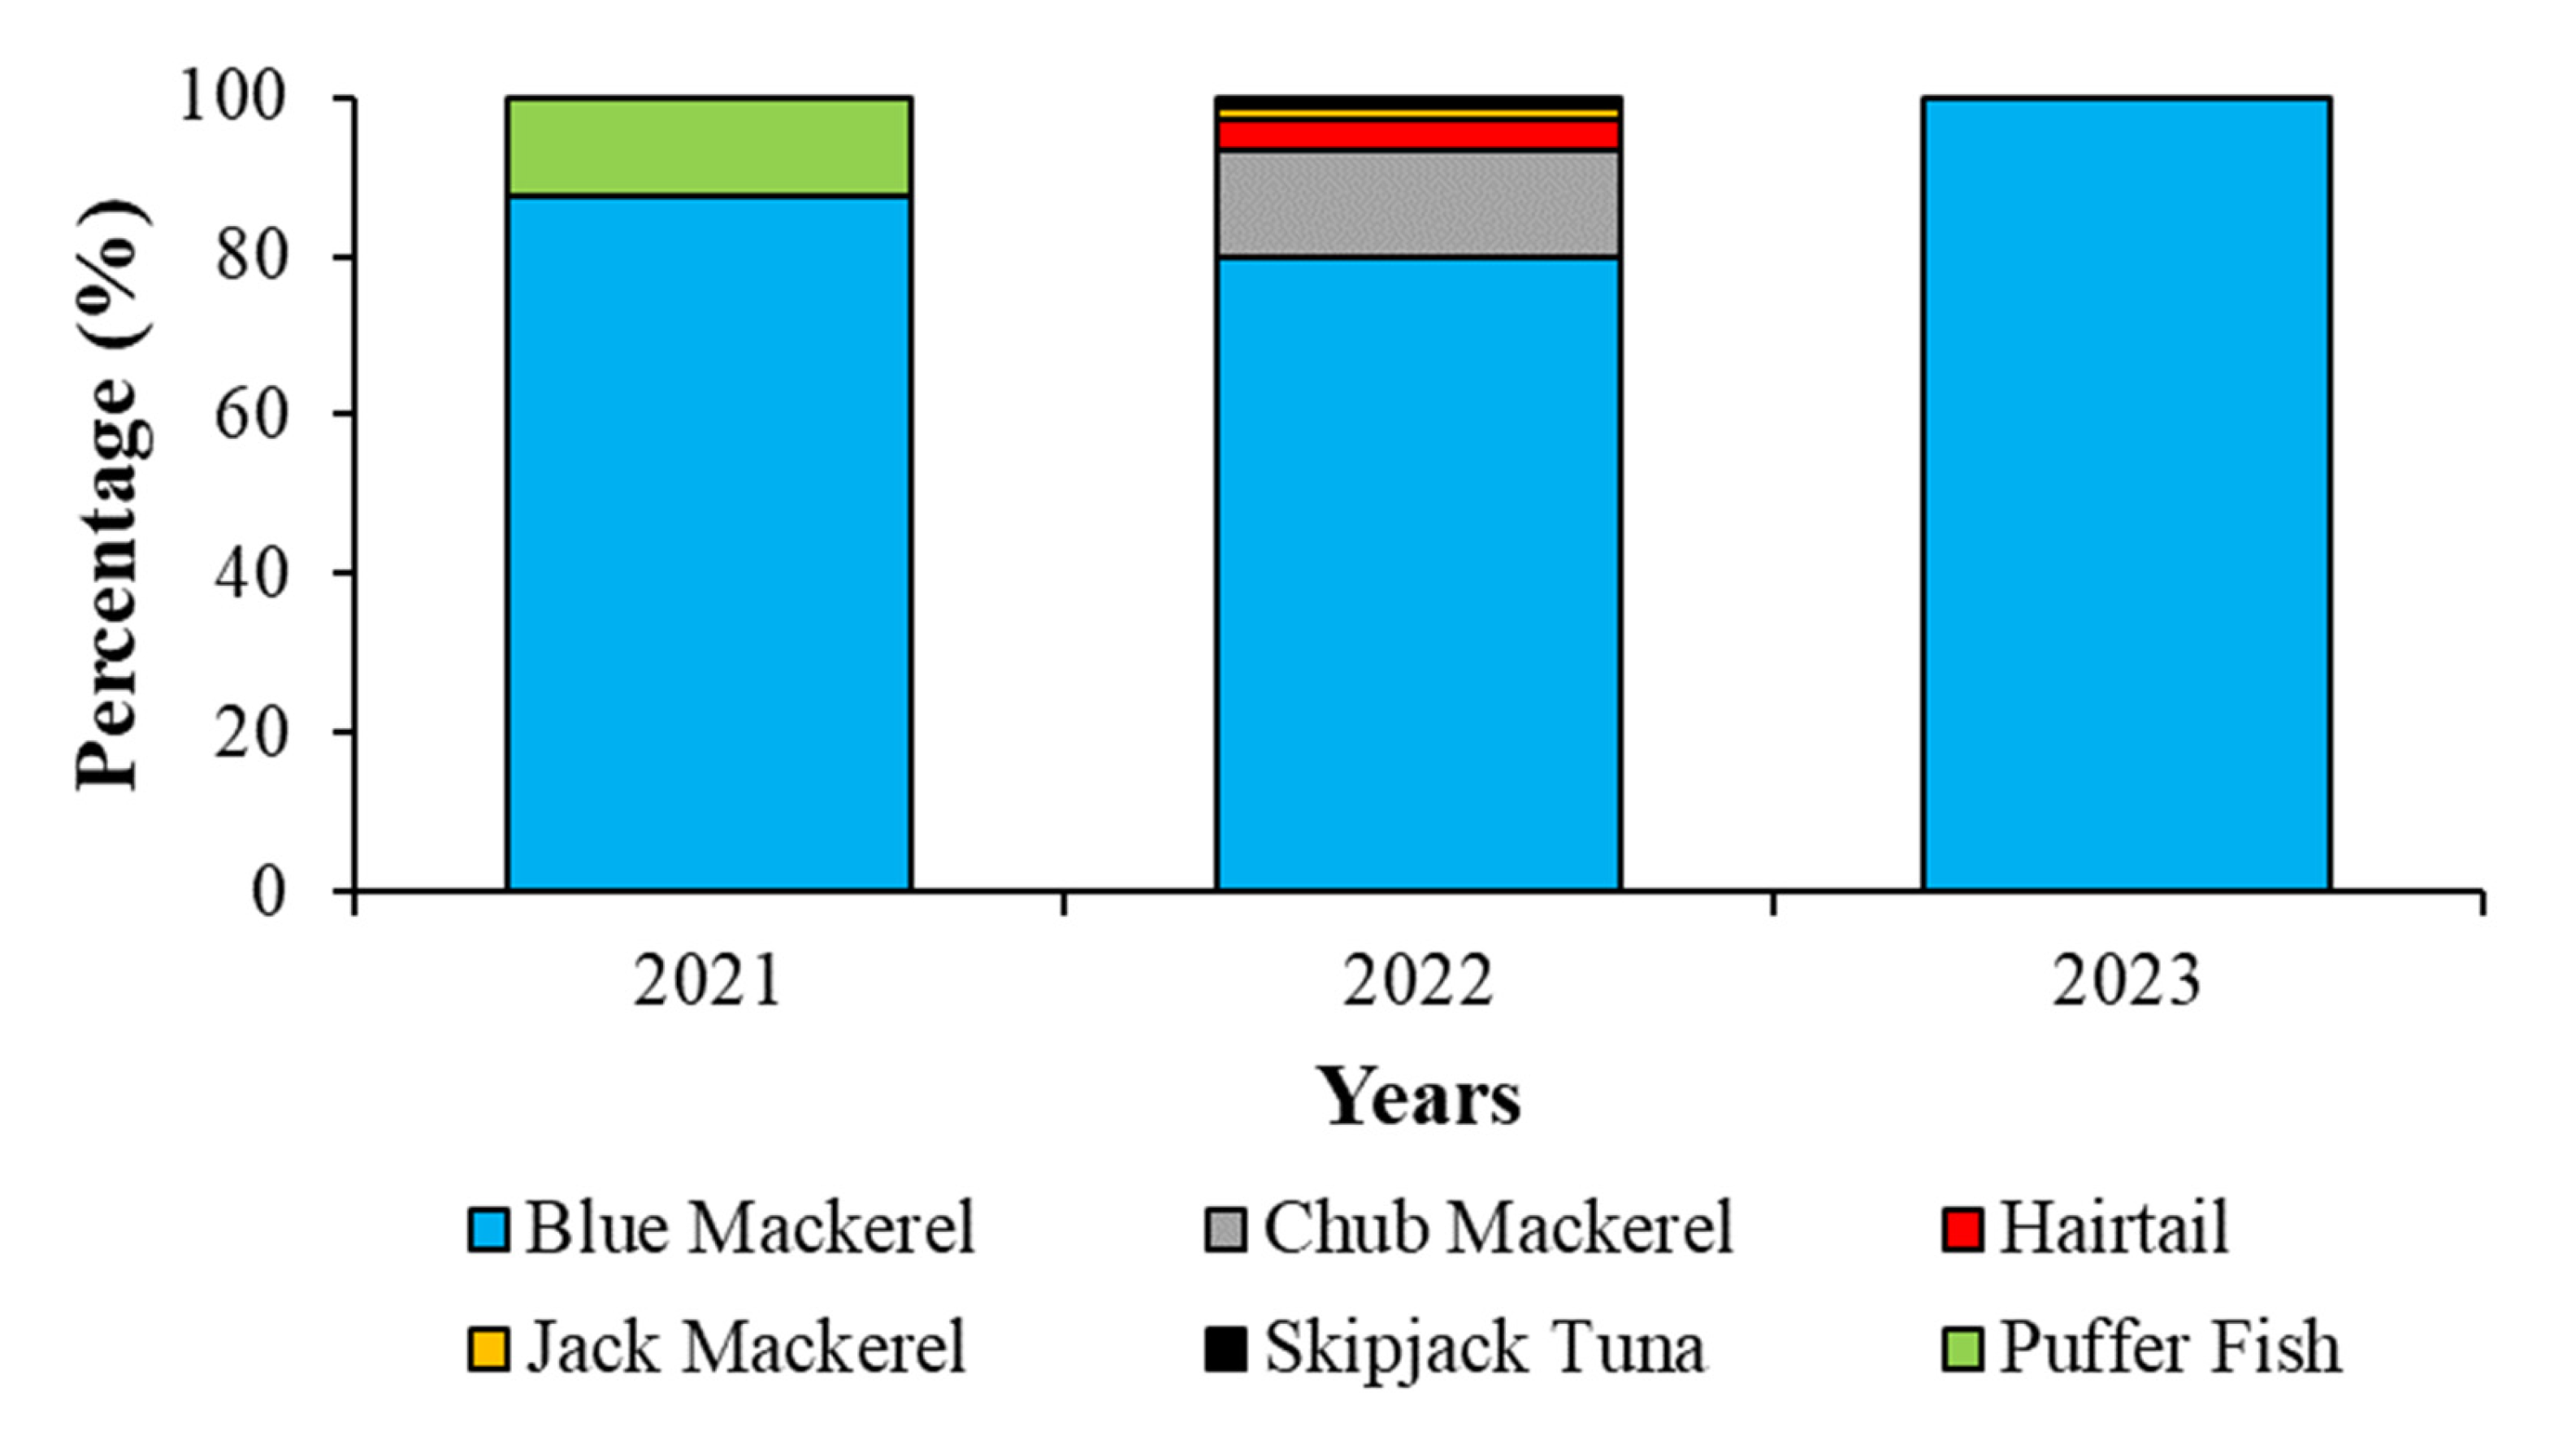
During the three acoustic surveys, hook-and-line sampling showed that blue mackerel consistently dominated the catch composition in Yilan Bay throughout the spawning season. In 2021, they accounted for 87% of the total catch. Although this proportion declined slightly to 80% in 2022, other species—such as chub mackerel, jack mackerel, skipjack tuna, and hairtail—were also recorded. By 2023, all individuals caught were blue mackerel (Figure 2).
This analysis focuses on the period from 2021 to 2023, when catch composition data were systematically collected using consistent fishing methods across the spawning season. The sustained dominance of blue mackerel, consistently exceeding 80% of the total catch, strengthens the reliability of subsequent species-specific analyses.
Although no catch composition data were collected in 2024 due to logistical constraints, both acoustic survey data and commercial fishery records for that year were still analyzed.

3.2. Depth and TS Distribution

From 2021 to 2023, interannual variation in the primary catch depth was observed during the spawning season in Yilan Bay. In 2021, catches predominantly occurred at depths exceeding 50 m, with most individuals concentrated around 100 m. In contrast, during 2022 and 2023, the main catch depth shifted to shallower waters, centering around 50 m (Figure 3, right). These shifts may reflect environmental changes or behavioral adaptations in spawning aggregations.
TS distributions correspondingly exhibited clear vertical stratification around 50 m in 2021 and 2022, but no stratification in 2023. Additionally, the mean TS value in 2023 was higher than in the previous two years (Figure 3, left).
This analysis focuses on the years 2021 to 2023, when both acoustic and catch-depth data were available. No such data were collected in 2024.

3.3. Frequency Distributions of Fork Length and TS

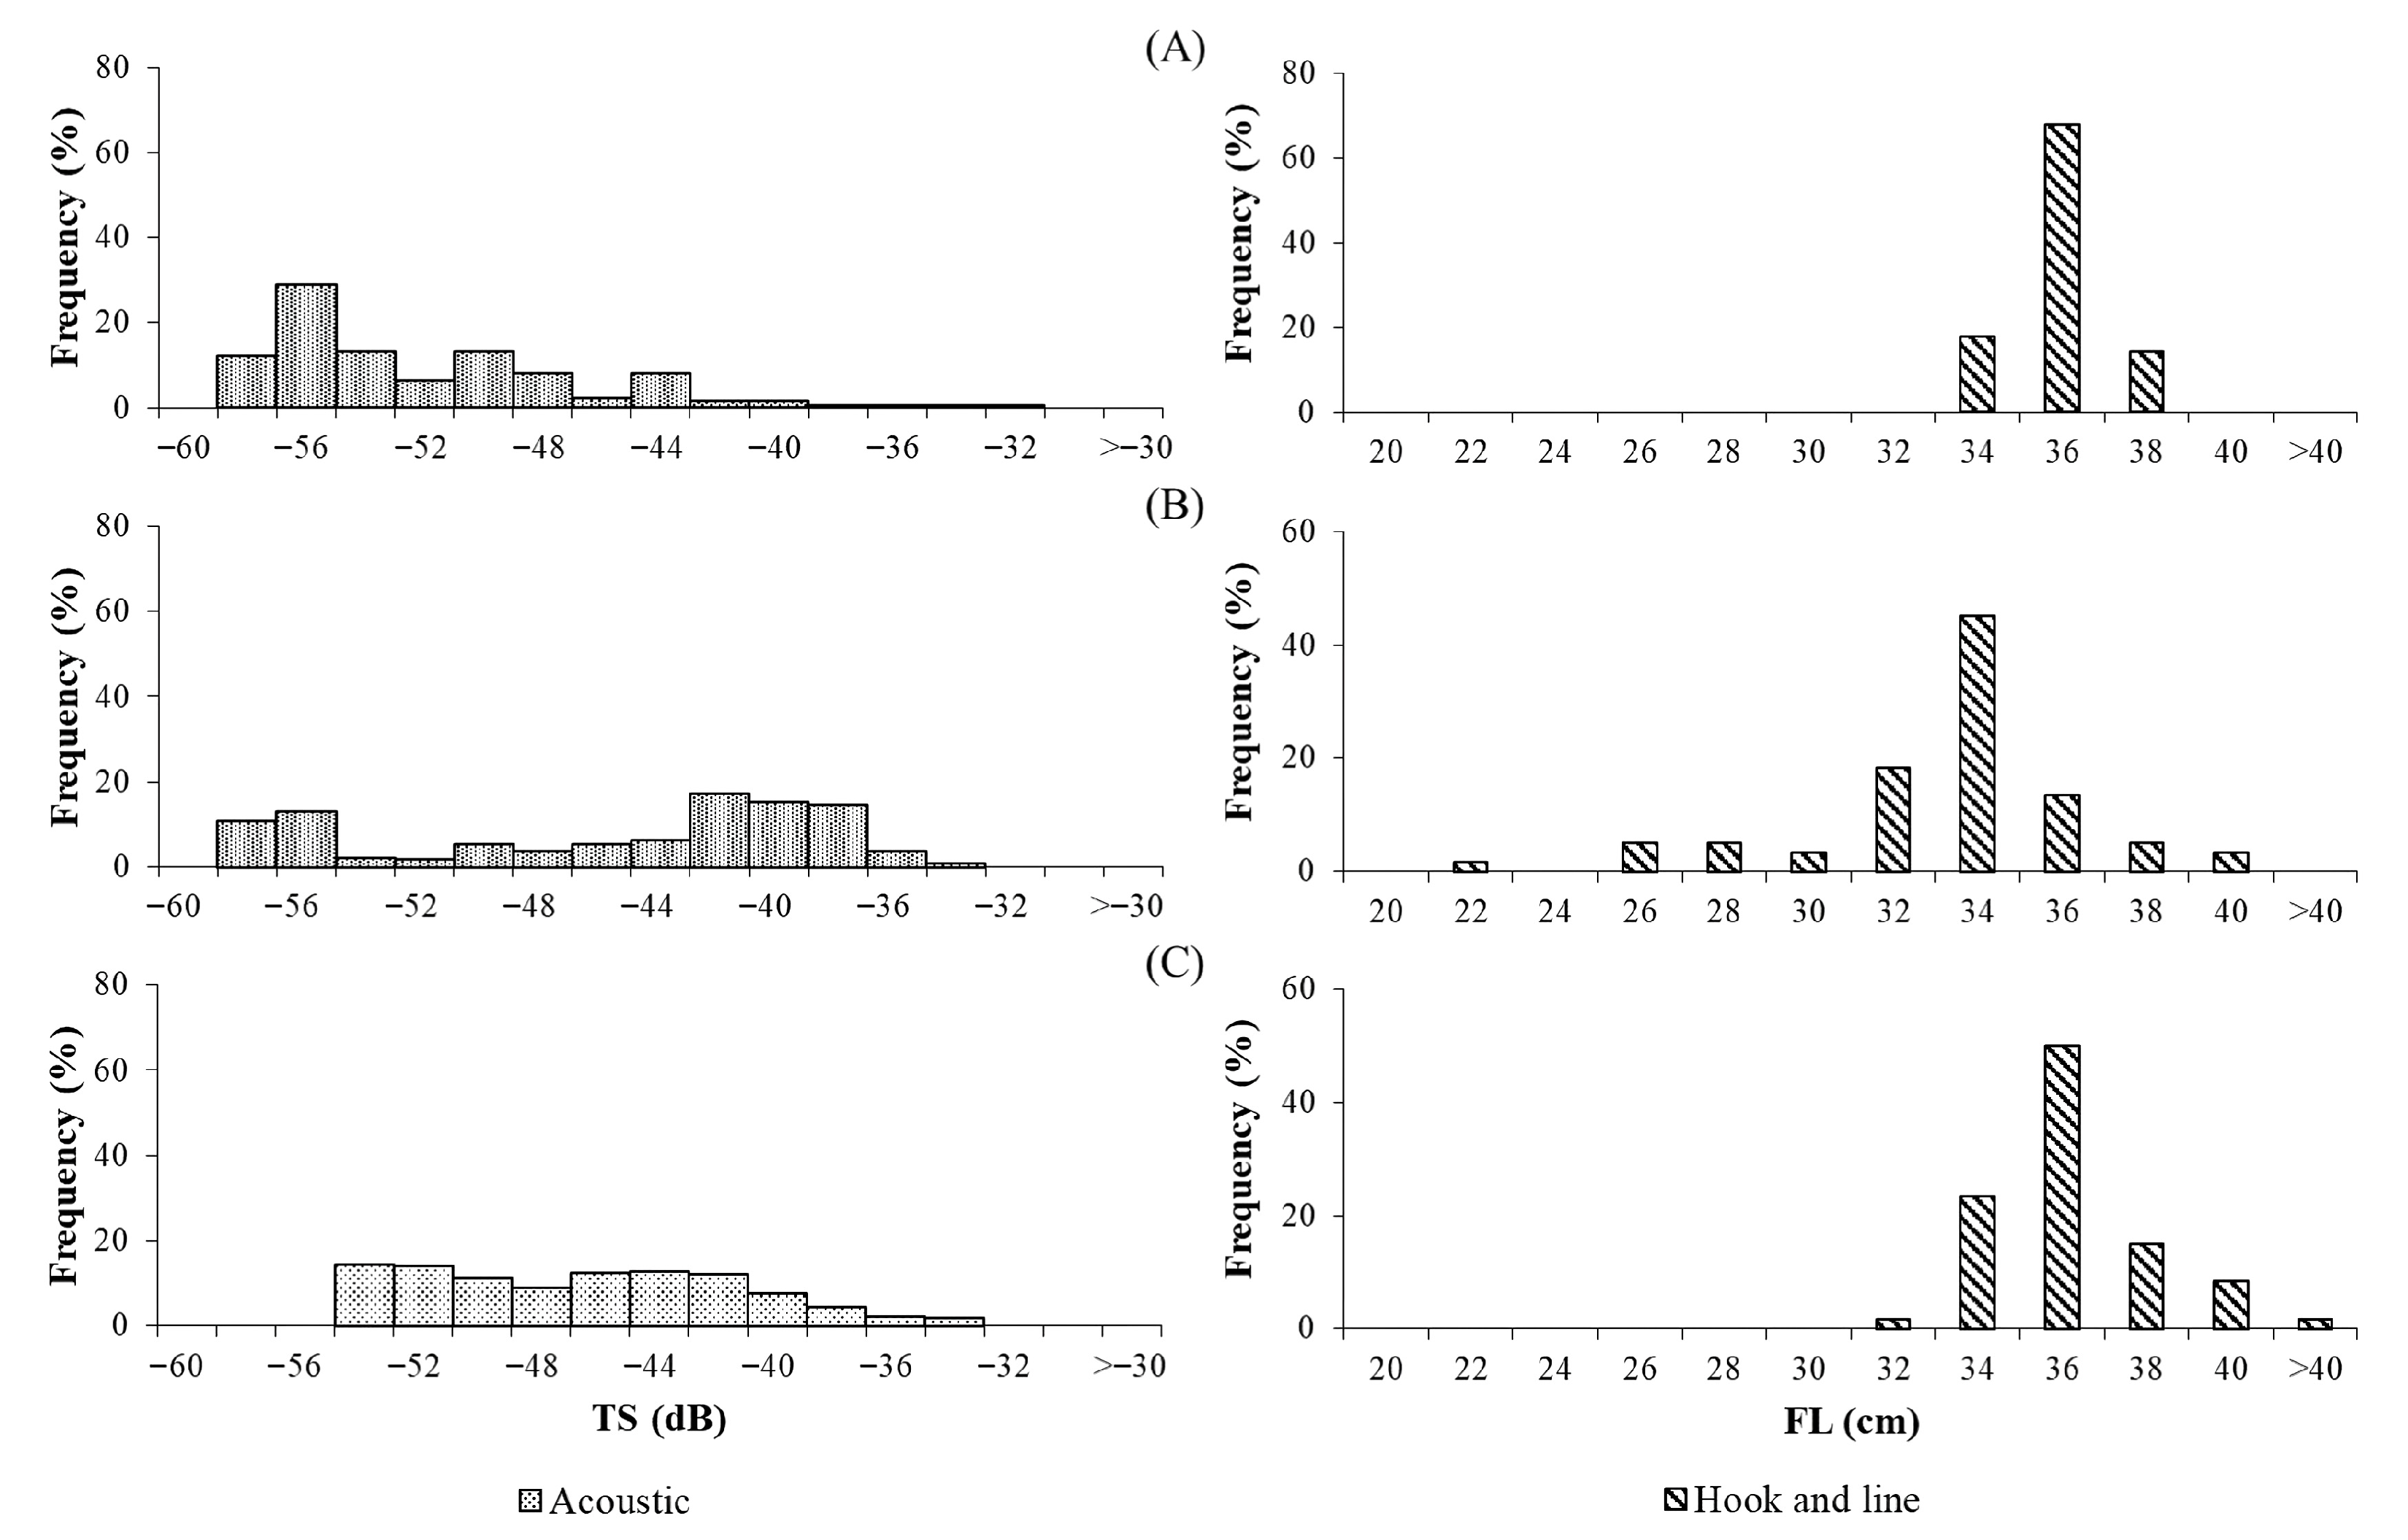
In 2021, the dominant fork length of blue mackerel in the catch was approximately 36 cm. In 2022, the dominant length decreased to around 34 cm, accompanied by a broader size distribution and a lower average length. By 2023, the dominant catch length returned to approximately 36 cm (Figure 4, right), suggesting interannual variability in cohort composition or growth conditions.
Acoustic measurements over the same period revealed notable differences in TS values. In 2021, a total of 121 TS measurements were recorded, primarily ranging from −50 to −58 dB. In 2022, the number increased to 241, with values clustering between −38 and −42 dB, indicating a substantial rise compared with the previous year. In 2023, 510 measurements were collected, with values more broadly distributed between −36 and −48 dB (Figure 4, left).
Although the annual TS distributions differed, the catch compositions in all years were dominated by the target species, with capture rates exceeding 80% (Figure 2). Therefore, it is reasonable to assume that the TS values used in subsequent analyses primarily represent the target fish, supporting development of a species-specific TS–FL model.

3.4. TS–FL Regression and Depth-Compensation Model

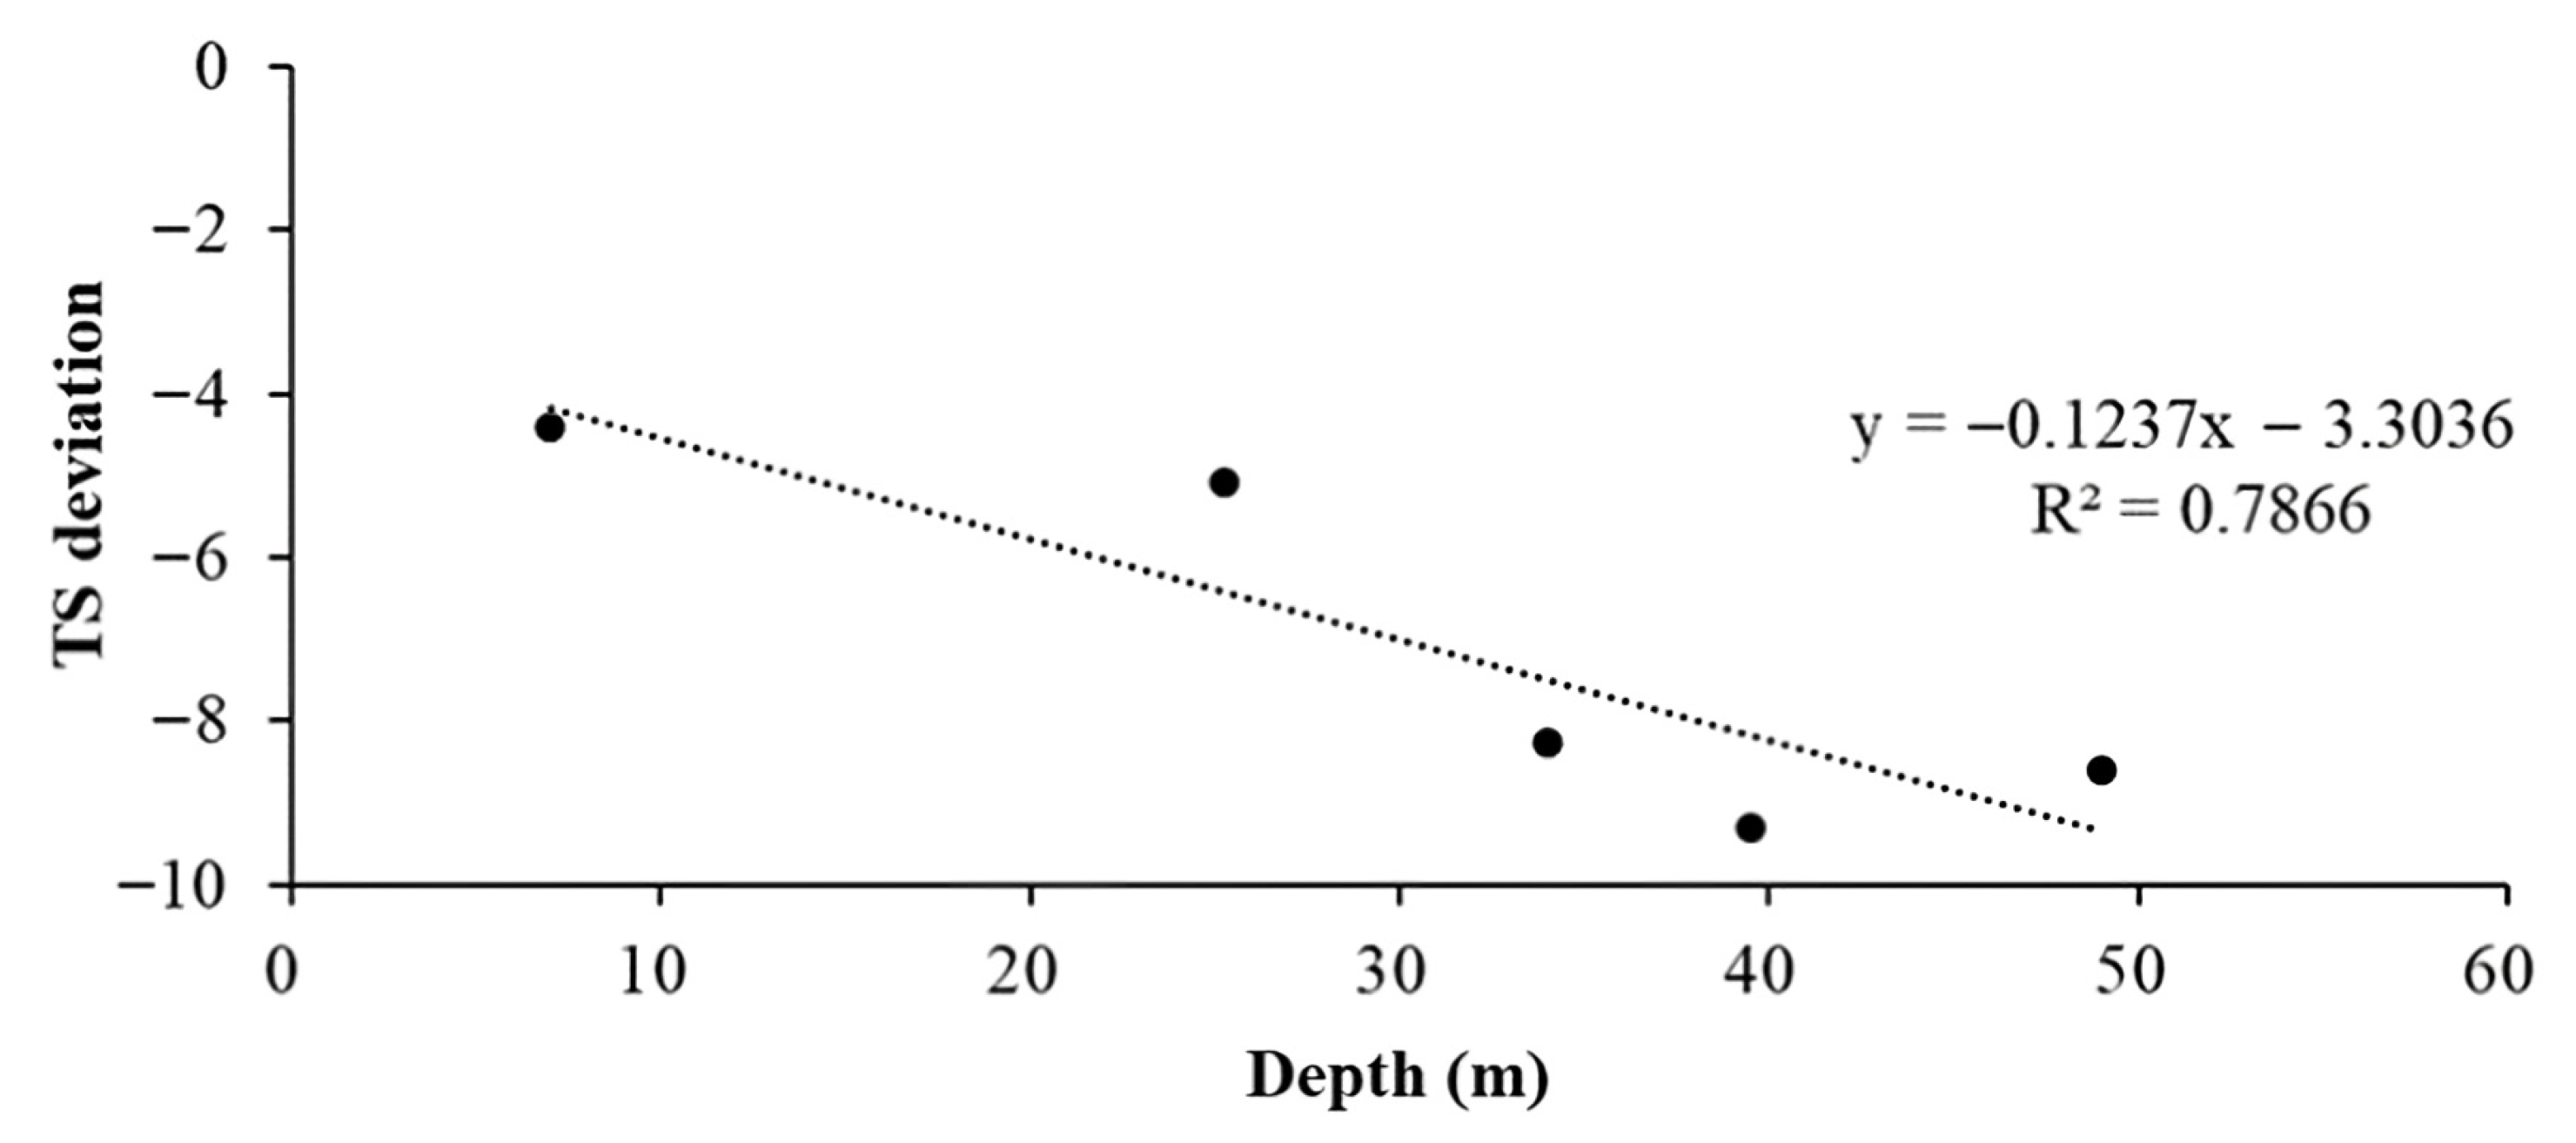
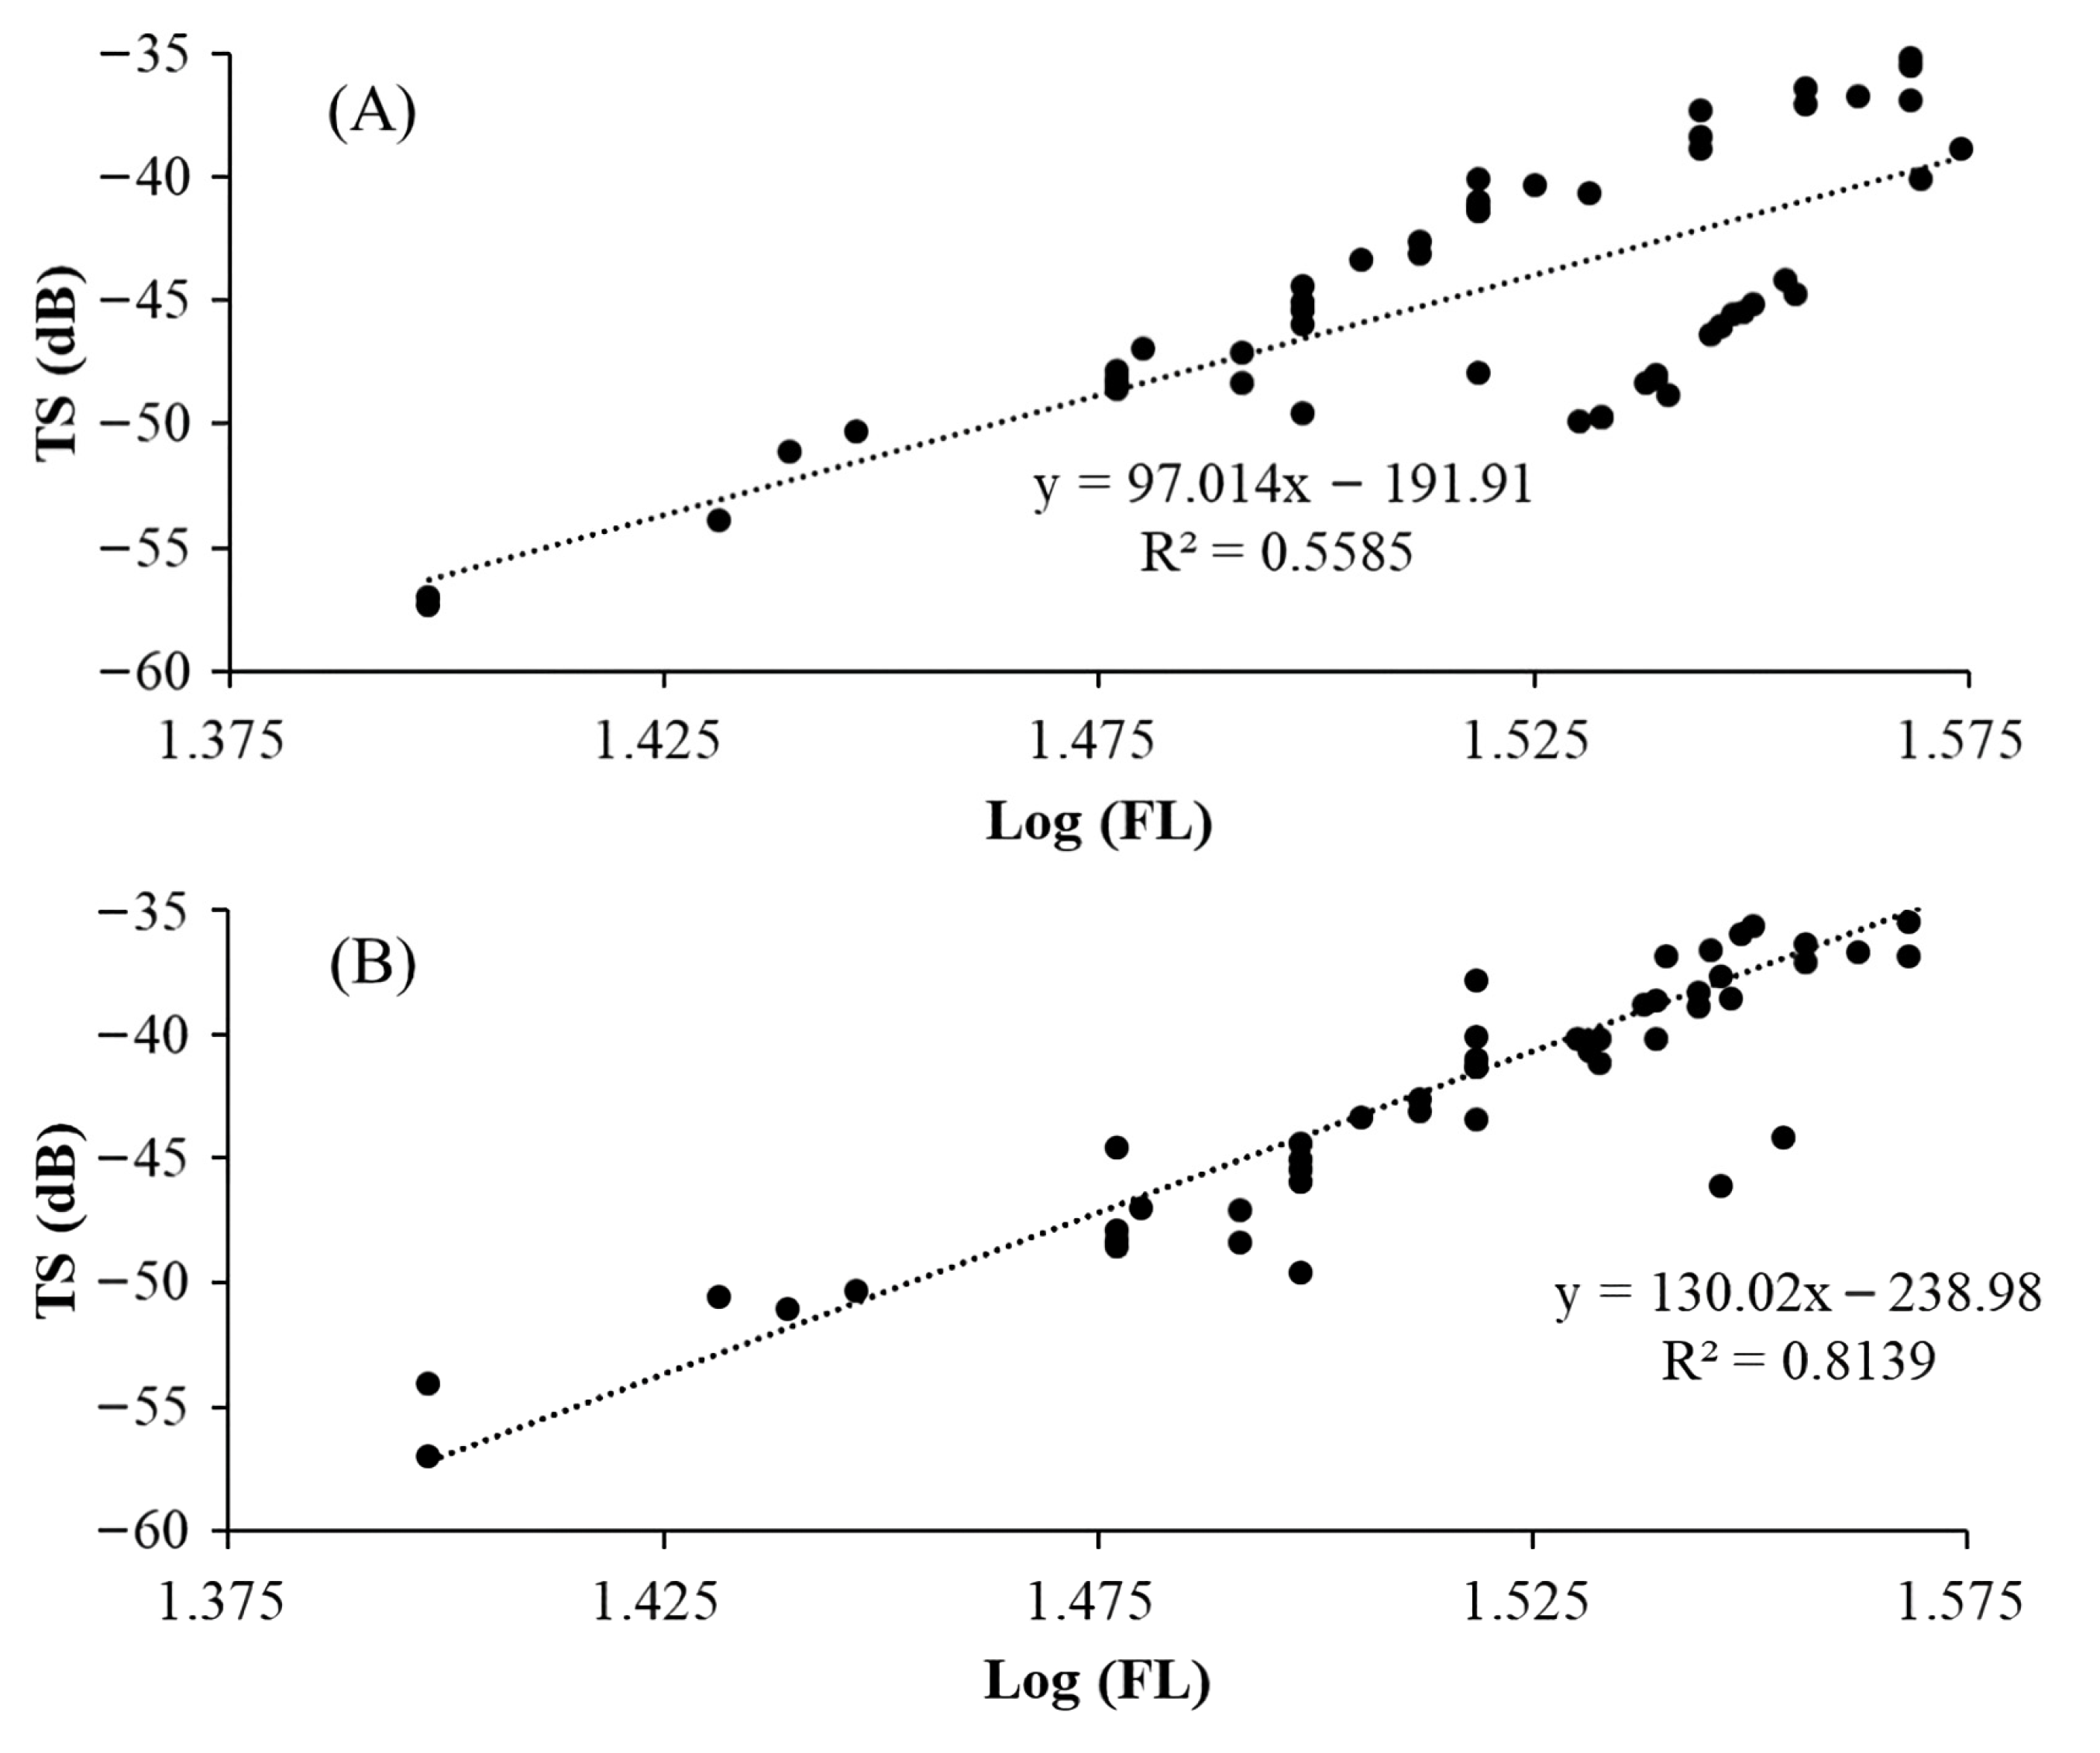
Given that the primary fishing depth was approximately 50 m, this depth was used as a threshold to examine vertical variation in TS. FL data were grouped into 1 cm intervals, and for each interval, the mean TS and mean capture depth were calculated within the shallow (≤50 m) and deep (>50 m) strata. A linear regression was then performed on the averaged TS and depth values per FL class, yielding a depth-correction function (Figure 5). Although Figure 5 is based on only five FL intervals per depth stratum and serves as a preliminary assessment of vertical TS variation, the depth-corrected TS–FL model presented in Figure 6 incorporates all sampled individuals and provides a robust basis for TS estimation.
To ensure analytical consistency, only FL intervals represented in both depth strata across the 2021–2023 surveys were included. Although only five FL classes satisfied this criterion, each regression data point was based on multiple acoustic detections, providing a robust basis for quantifying depth-related variation in TS.
This depth-correction function was subsequently incorporated into the original TS–FL model to generate an adjusted regression equation. Incorporating depth as an explanatory variable substantially improved explanatory power, with the coefficient of determination (R2) increasing from 0.5585 to 0.8139 (Figure 6). The enhanced TS–FL–Depth model effectively reduces bias introduced by vertical variability in acoustic backscatter and enables more accurate size estimation under stratified environmental conditions.

3.5. Estimated Length and Spatial Distribution of Blue Mackerel

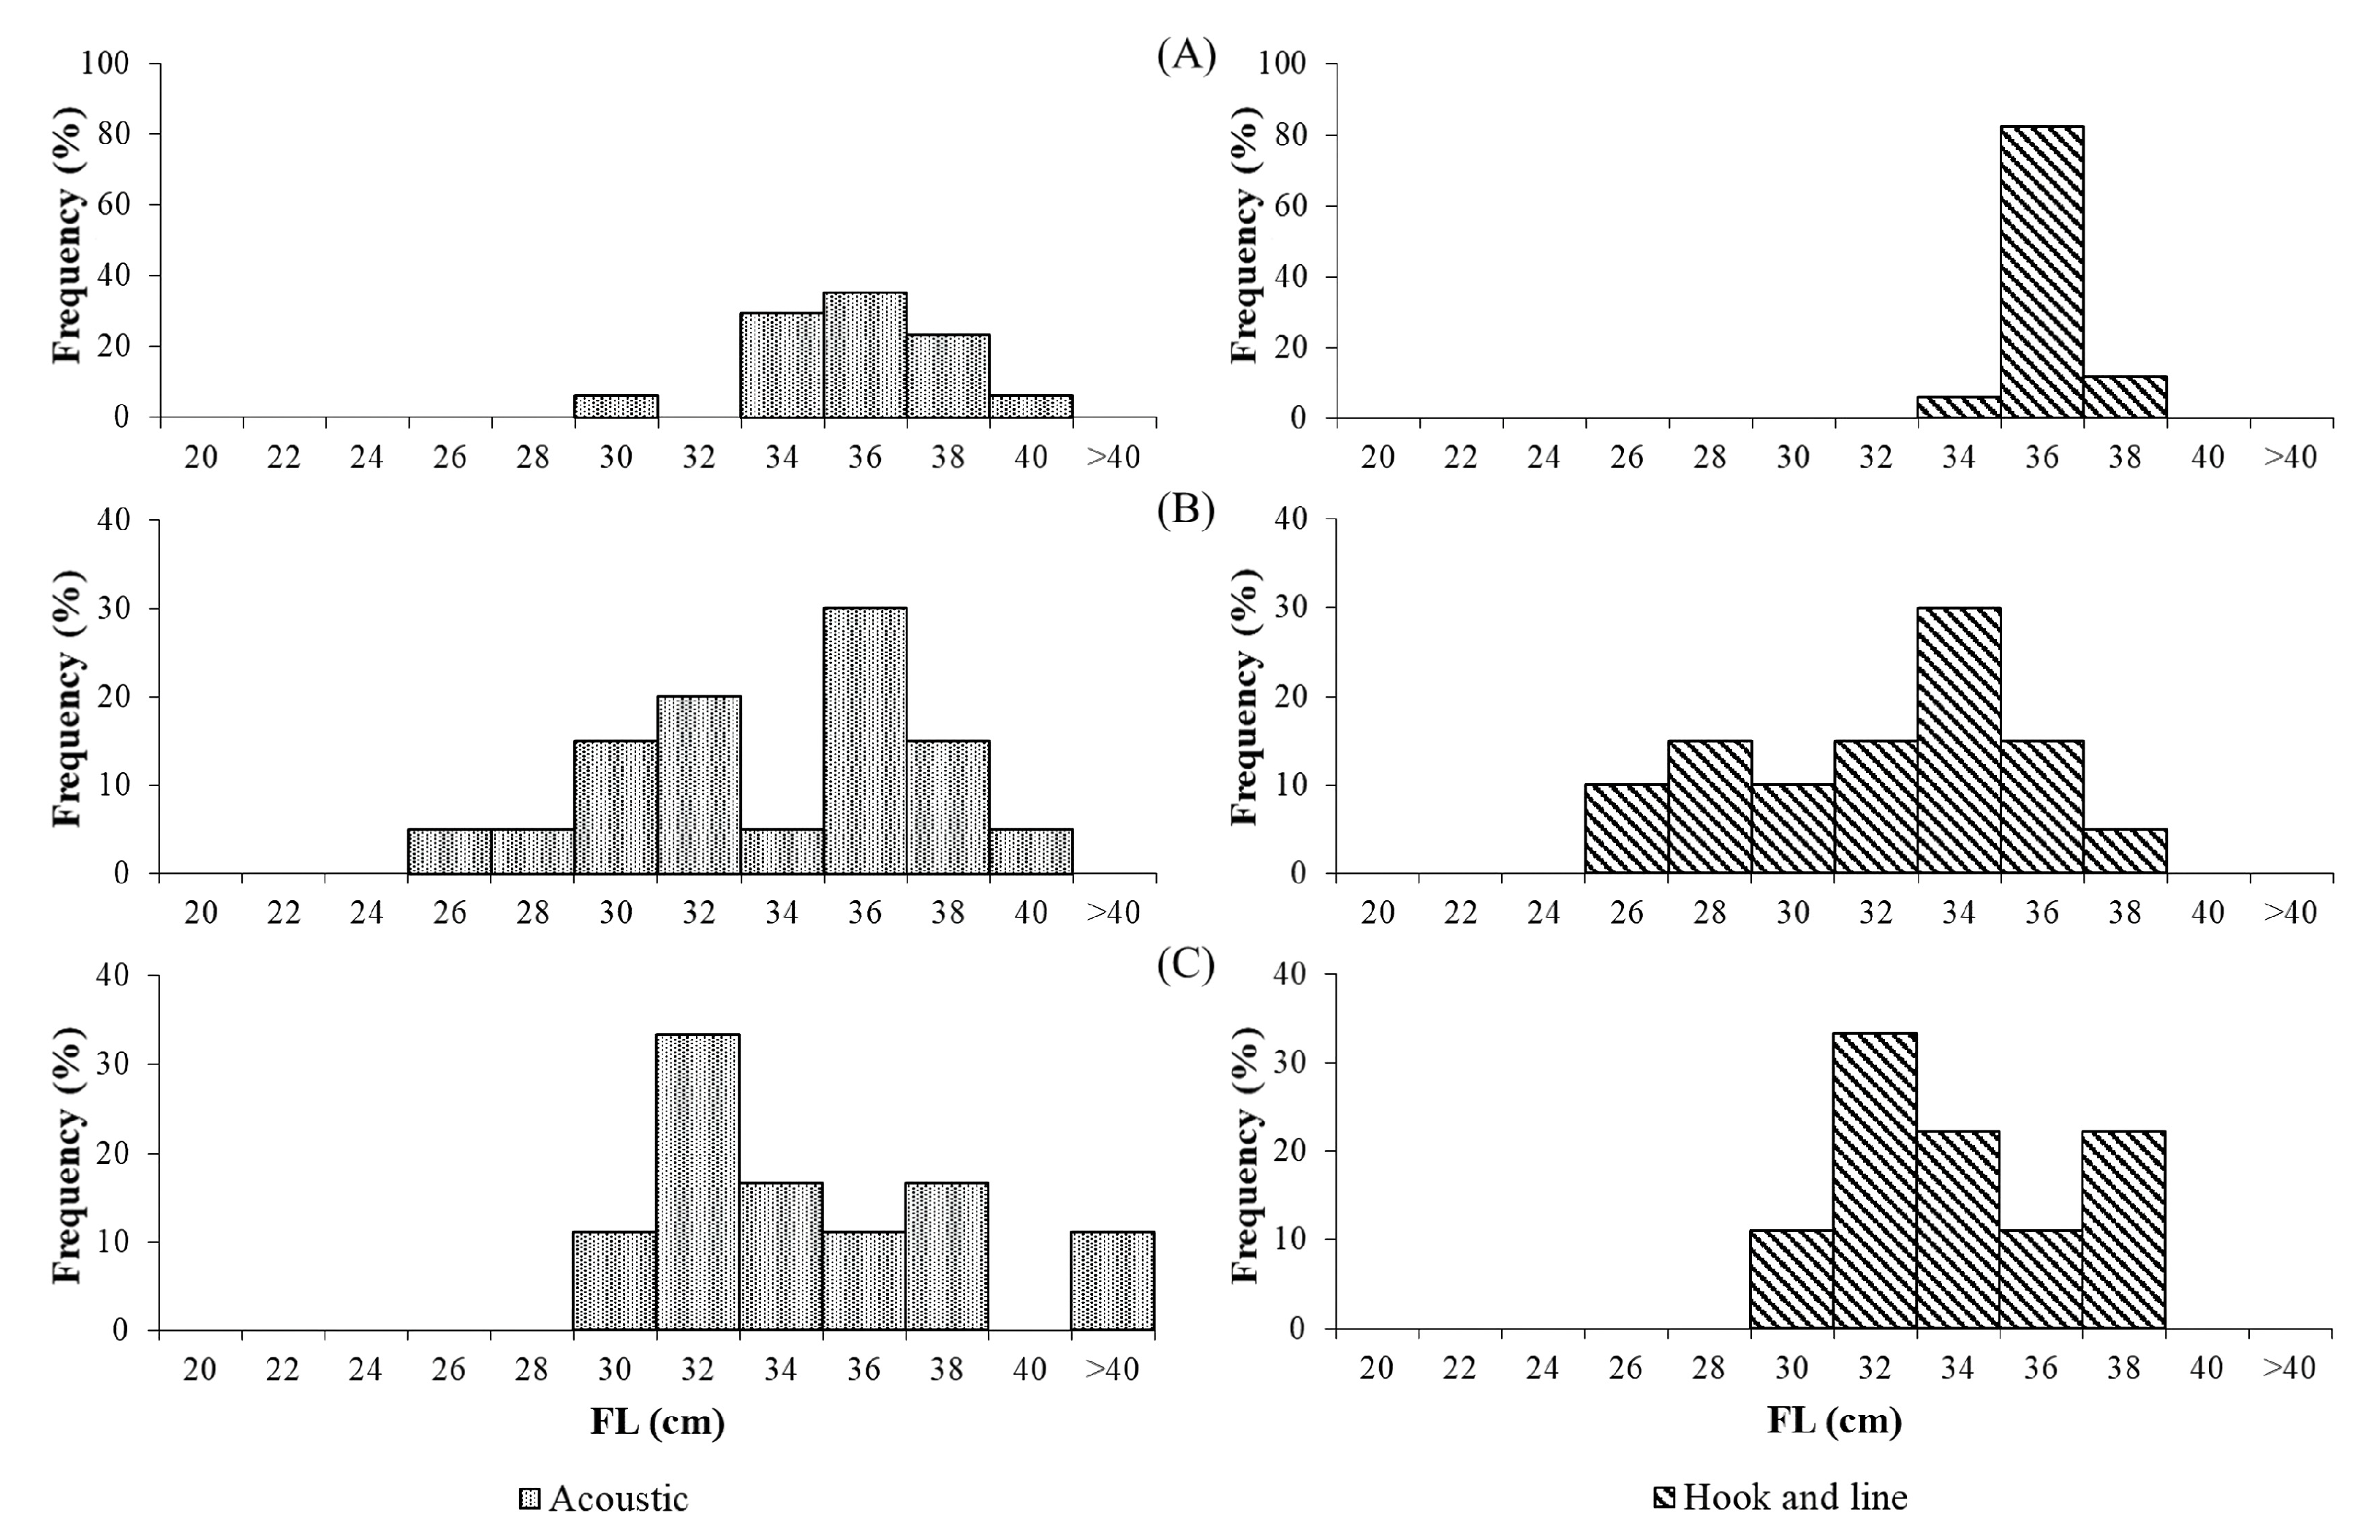
Figure 7 compares FL distributions estimated from acoustic data with those derived from hook-and-line sampling for 2021–2023. In 2021, the acoustic-estimated FL distribution was centered around 36 cm but slightly deviated from the measured catch data. In 2022 and 2023, the estimated distributions aligned more closely with observed values, although they tended to overestimate the proportion of larger individuals (>36 cm). This general agreement supports the validity of the depth-compensated TS–FL model for accurately representing the size structure of blue mackerel during the spawning season.
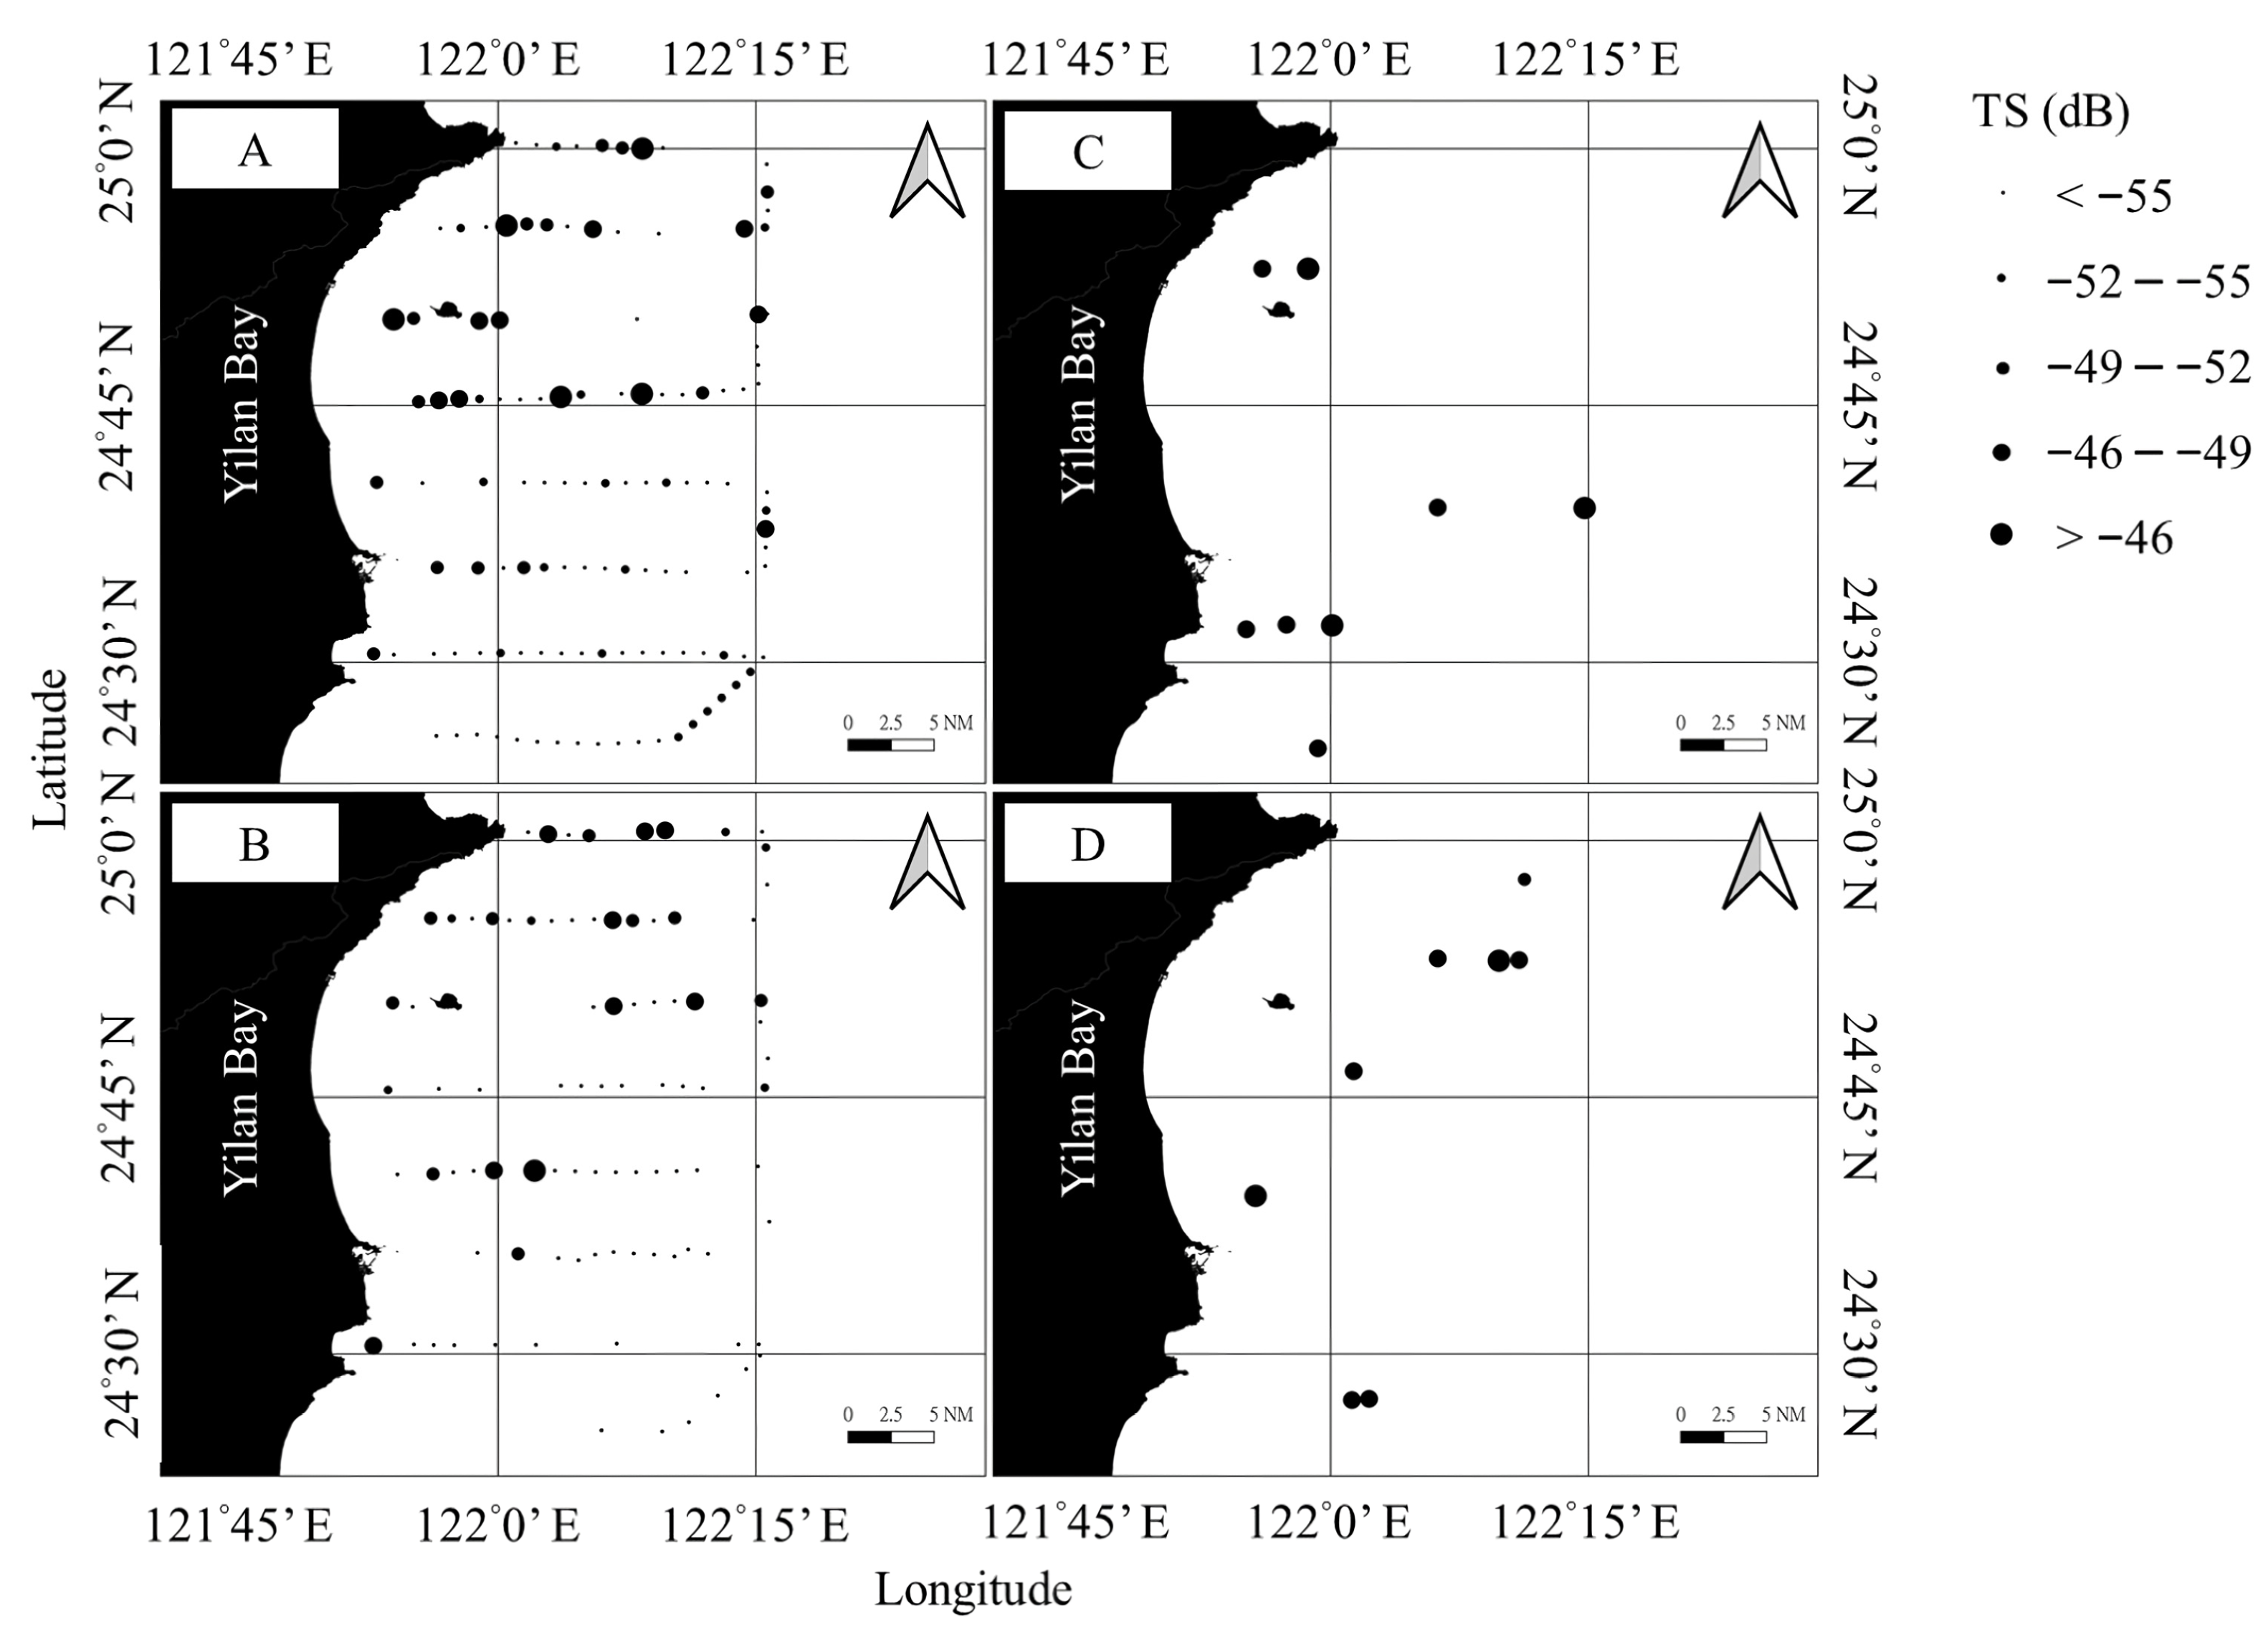
In 2021, relatively high TS values were concentrated near Guishan Island, suggesting localized aggregations of larger individuals. In contrast, TS distributions in 2022 and 2024 were more dispersed, with elevated TS values observed outside Nan-Fang-Ao Fishing Port and at several stations along the northern margin of Yilan Bay. No clear spatial pattern was evident in 2023.
Across the four-year survey period (2021–2024), consistently low TS values were recorded on the southeastern side of Yilan Bay, indicating a lower probability of encountering larger individuals there (Figure 8). The localized aggregation of high TS values observed near Guishan Island in 2021 did not recur in subsequent years, suggesting interannual variation in the spatial distribution of larger blue mackerel.

3.6. Biomass Estimation and Comparison with Commercial Data

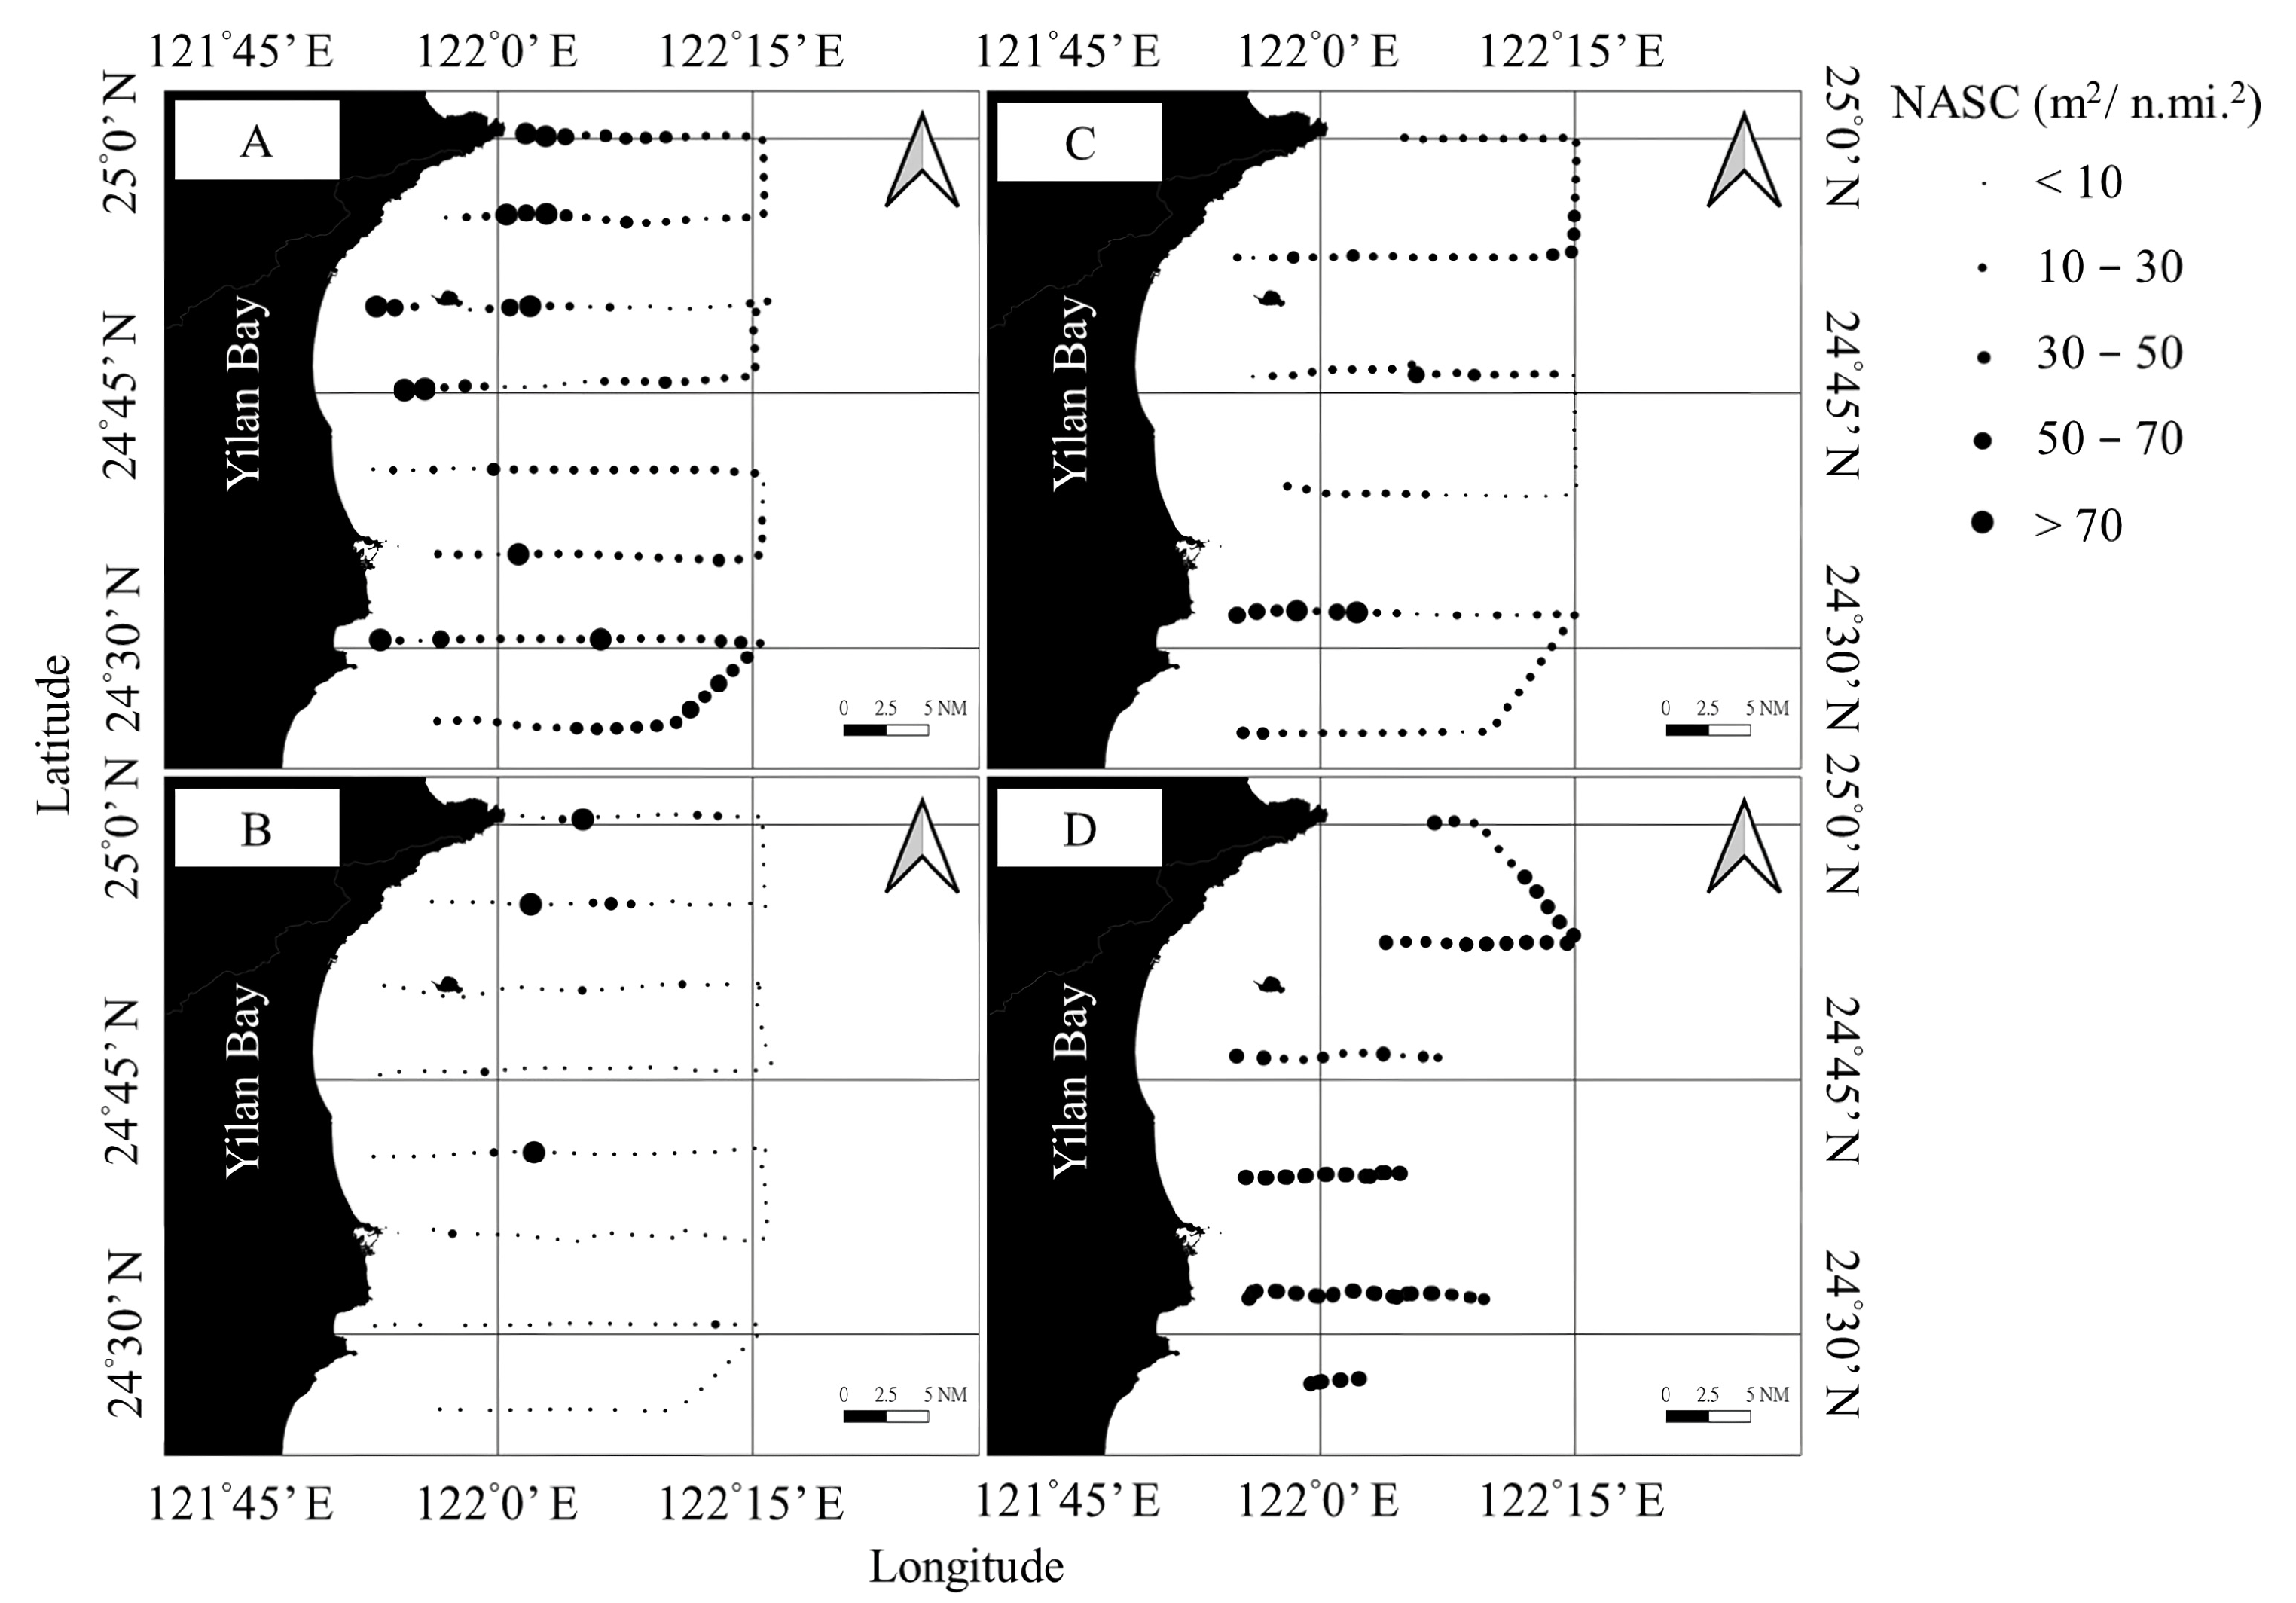
In 2021, blue mackerel density was highest among the first three years, with a pronounced concentration south of Guishan Island. In 2022, density declined markedly across the entire survey area. By 2023, intermediate density levels were observed, particularly near Nan-Fang-Ao Fishing Port.
Figure 9 presents the spatial distribution of NASC values, used as a proxy for blue mackerel density, across the four survey years. In 2021, high NASC values were concentrated in the southwestern part of the bay, especially south of Guishan Island. In 2022, overall NASC values dropped significantly, and no clear density hotspots were observed. In 2023, moderate values were observed near Nan-Fang-Ao and along the central coast. By 2024, high-density zones reemerged, particularly in the southeastern and central-eastern regions of Yilan Bay. These results underscore marked interannual variation in the spatial distribution of spawning aggregations.
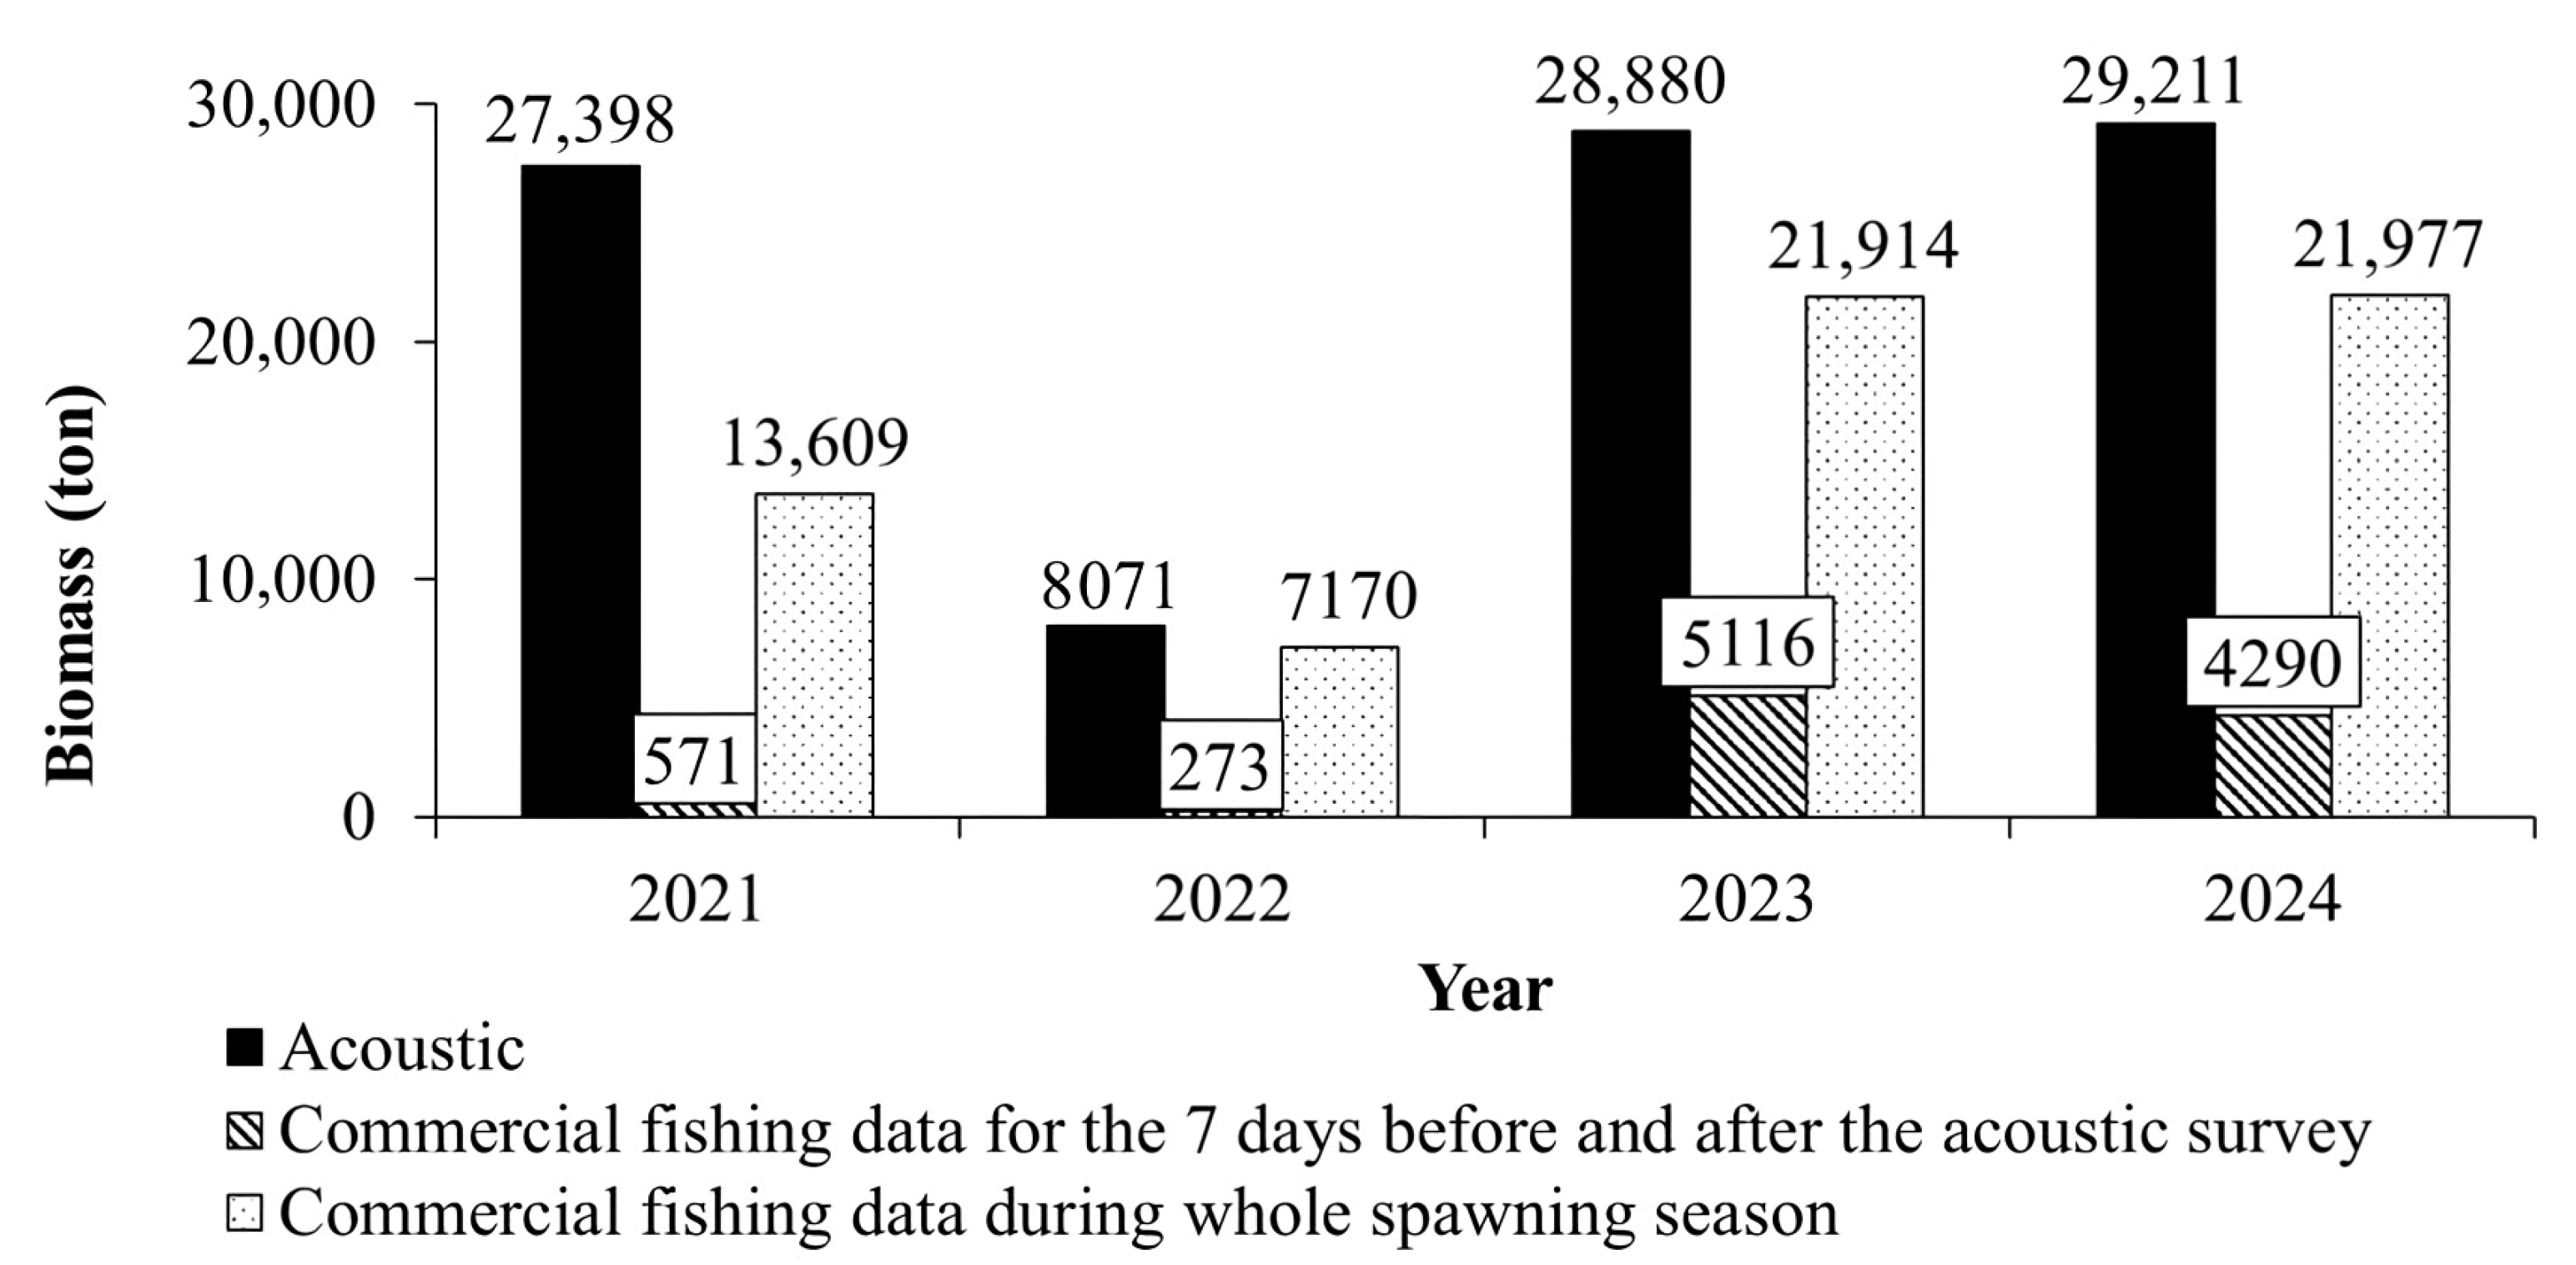
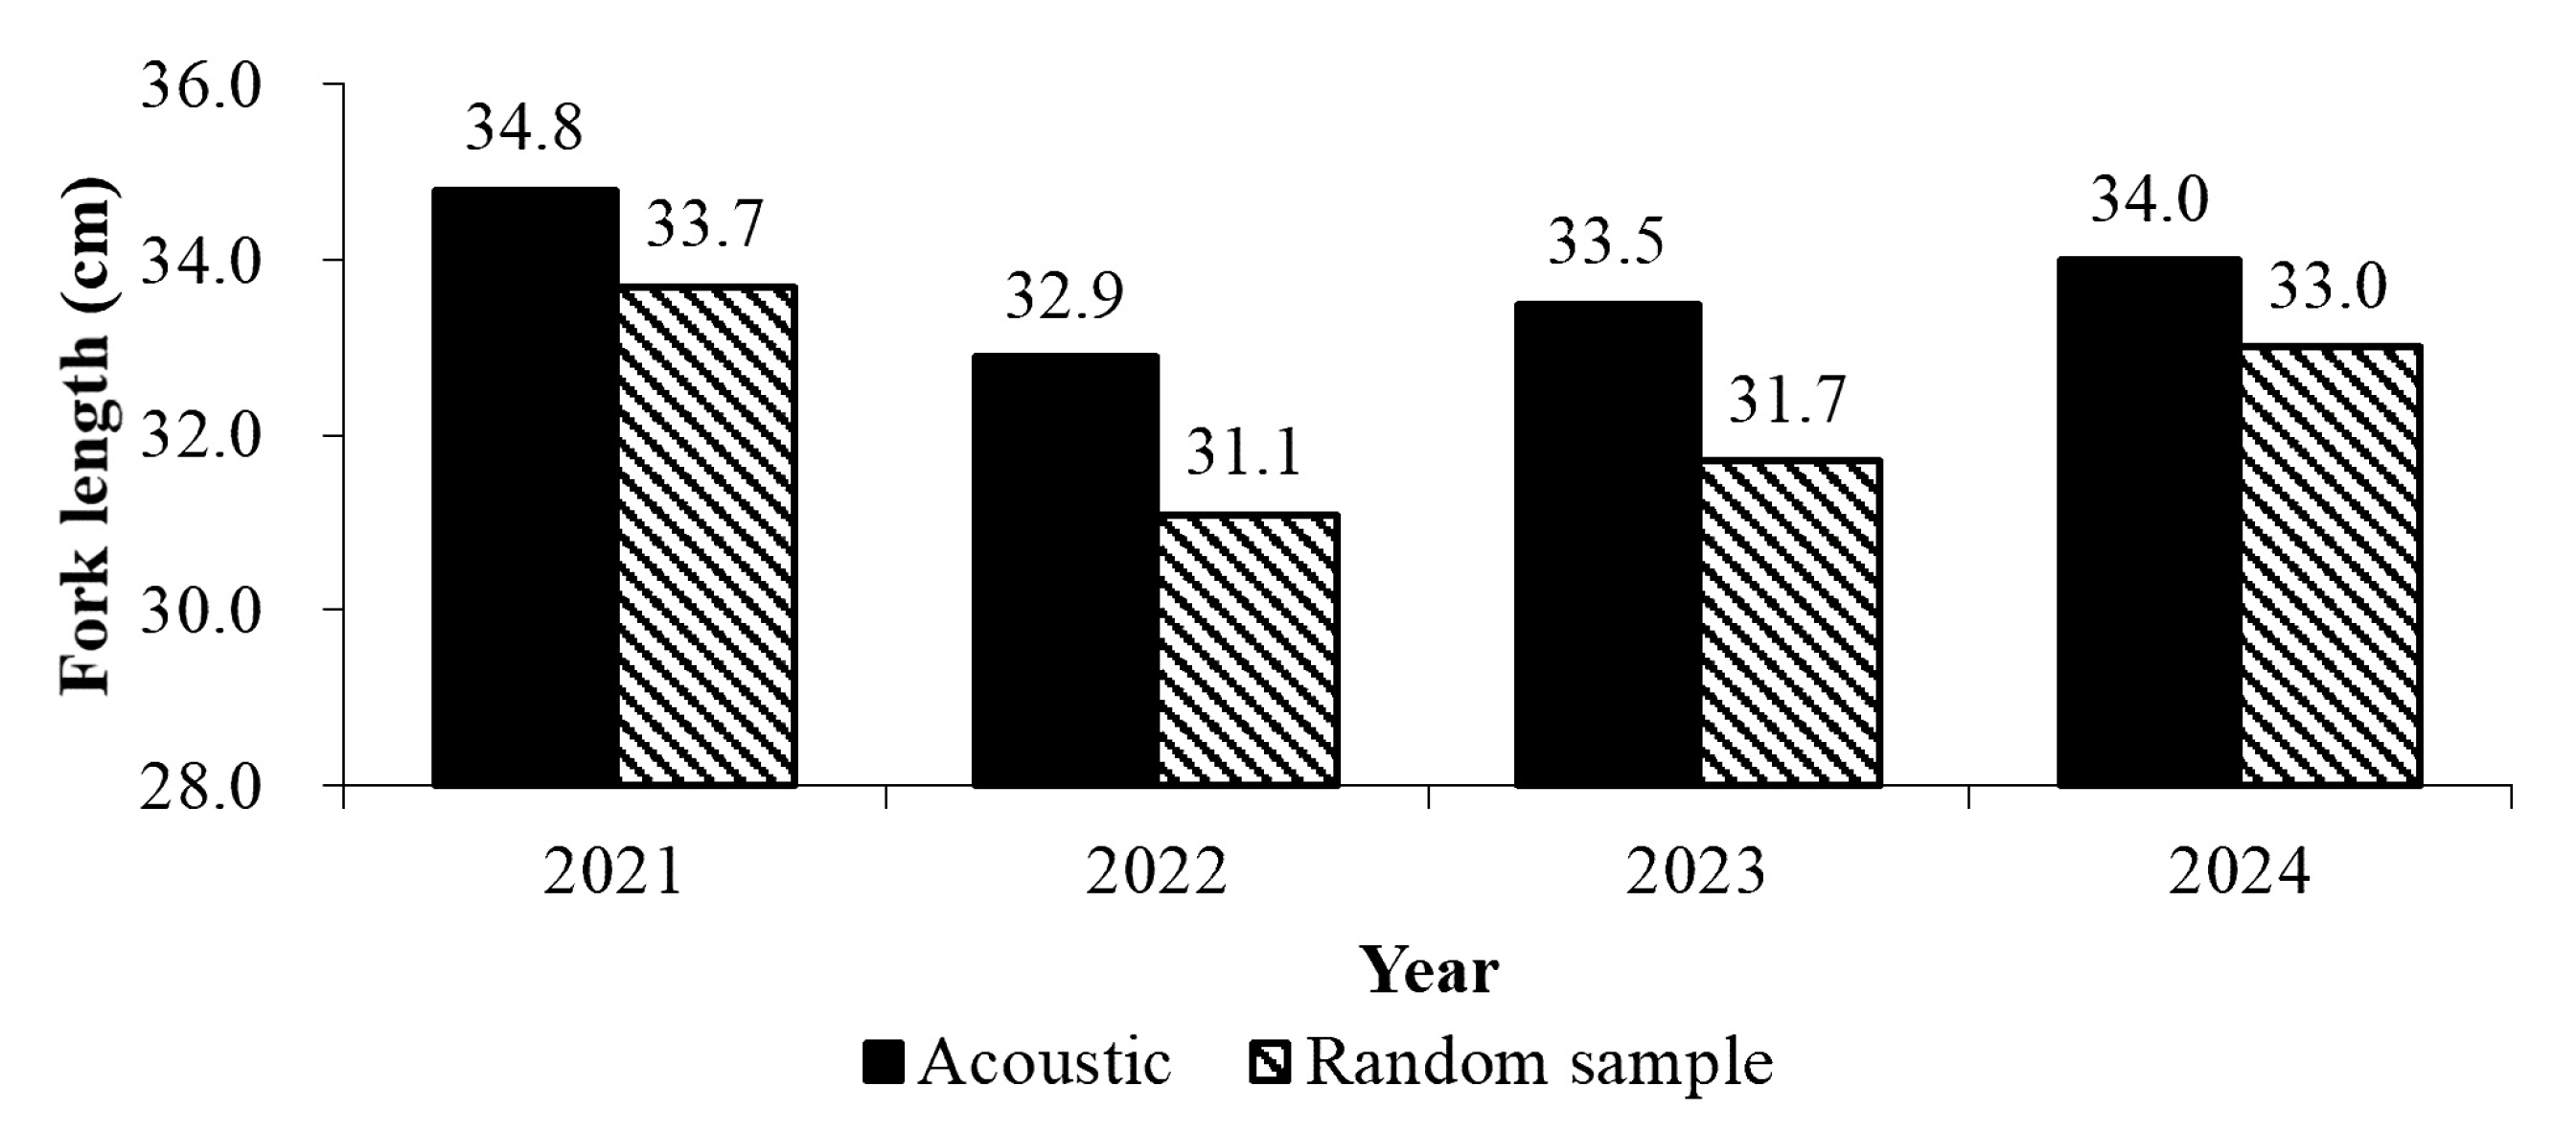
Commercial catch data collected during the spawning seasons broadly corroborated the acoustic biomass estimates. Seasonal peaks occurred in 2023 and 2024, followed by 2021, with the lowest levels recorded in 2022 (Figure 10). This pattern generally reflects the interannual fluctuations observed in acoustic-based biomass assessments.
However, short-term commercial catch data (within ±7 days of each acoustic survey) differed notably from acoustic results, particularly in 2021 and 2024. These inconsistencies may reflect temporal mismatches between survey timing and fishing activity, environmental variability, or changes in fishing effort.
Despite these short-term deviations, the overall seasonal trends in commercial landings strongly support the reliability of acoustic-based assessments for reflecting spawning stock abundance.

4. Discussion

4.1. Acoustic Estimation and Commercial Fishing

Sunarti et al. [8] reported fork lengths at 50% sexual maturity for blue mackerel as 32.02 cm, 32.14 cm, and 29.64 cm in 2017, 2018, and 2019, respectively. In the present study, most individuals detected acoustically—and partially validated through hook-and-line sampling—exceeded 32 cm FL, indicating that the surveyed population predominantly comprised mature, reproductively active individuals. As shown in Figure 11, the observed size distributions generally surpassed the reported maturity thresholds, further supporting the reproductive relevance of the acoustic detections.
During the study period, acoustically estimated spawning biomass of blue mackerel in Yilan Bay was 27,398, 8071, 28,880, and 29,211 metric tons in 2021, 2022, 2023, and 2024, respectively, while corresponding commercial landings were 13,609, 7170, 21,914, and 21,977 metric tons. These results show a generally positive seasonal relationship between acoustic biomass estimates and commercial catch, particularly in 2023 and 2024, when both were relatively high. Nevertheless, discrepancies in some years—such as the relatively high acoustic biomass estimate but low adjacent-week catch in 2021 and 2024—highlight the influence of factors such as fishing effort distribution, environmental variability, and fish availability. Acoustic surveys therefore reflect seasonal trends rather than provide exact short-term catch predictions. Integrating longer-term acoustic time series with complementary fishery-dependent or alternative assessment methods remains important for capturing interannual dynamics more comprehensively.
Due to the absence of biological sampling in 2024, acoustic-based size and biomass estimates for that year could not be directly validated against measured length distributions. Partial validation is nevertheless supported by the overall congruence between acoustic biomass estimates and commercial catch trends, underscoring the utility of the acoustic approach while acknowledging its limitations.

4.2. Fishing Grounds and Survey Coverage

The primary spawning and fishing grounds for blue mackerel around Taiwan include the Northern Three Islets, the Diaoyu Islands, and Yilan Bay. Yilan Bay was selected as the focal area due to its relatively simpler fishery composition and stricter spatial regulations. Under current government policies, fishing vessels exceeding 100 gross tons are restricted from operating within 6–12 nautical miles of the coastline, limiting industrial fishing pressure in this region.
In most survey years, the coverage coefficient exceeded the recommended value of 2 [26,42], with values of 3.82 in 2021 and 2022, 3.49 in 2023, and 1.8 in 2024. These values indicate that survey resolution was generally sufficient to ensure spatial representativeness and to support reliable estimates of standing stock.

4.3. Factors Influencing Detection Results

Although FL distributions derived from acoustic data generally matched those obtained from hook-and-line sampling, a slight tendency toward overestimation was noted (Figure 7). This discrepancy may reflect gear selectivity, species-specific aggregation, or vertical distribution within the water column.
Furthermore, differences between acoustically estimated spawning biomass and reported commercial landings (Figure 10) suggest that a substantial portion of the spawning biomass remains unharvested during the peak season. This partial exploitation may have implications for stock sustainability and management.
The limited availability of shallow-layer samples constrained the development of a fully depth-stratified TS–FL model (Figure 5), necessitating extrapolation from deeper strata. This underscores the importance of improving vertical sampling resolution in future surveys to enhance model accuracy and reduce potential estimation bias. Sustained long-term monitoring, combined with consistent acoustic methodologies, is essential for tracking interannual changes in spawning dynamics and supporting robust fishery-independent assessments.

4.4. Implications of the Depth-Compensated TS–FL Model

The depth-compensated TS–FL model demonstrates that vertical position significantly affects TS in blue mackerel (Scomber australasicus), highlighting the importance of accounting for depth in acoustic-based size and biomass estimation. While depth was the primary factor identified in this study, other influences such as swimbladder compression, body tilt, and schooling behavior may also contribute to TS variation [20,25]. Incorporating depth into the TS–FL regression improved the accuracy of density and size estimates. Future applications could further enhance reliability by combining depth-stratified acoustic surveys with multi-frequency data and underwater video to capture fish orientation and behavior, providing a more comprehensive understanding of factors influencing TS.

5. Conclusions

This study demonstrates that integrating depth-compensated acoustic methods with fishery sampling can reliably reflect the trends of blue mackerel spawning biomass across an entire spawning season in Yilan Bay. The TS–FL–depth regression model effectively corrected vertical variability in TS and aligned well with biological sampling data. Nevertheless, short-term estimates may deviate from catch data and should therefore be interpreted in the context of fishery operation dynamics and environmental conditions.
These results support the use of hydroacoustic surveys as a valuable complement to traditional fishery-dependent data, particularly in coastal regions with spawning aggregations. The improved temporal and spatial resolution of this approach can contribute to more science-based and adaptive management of pelagic fisheries in Taiwan. Future applications may extend this methodology to adjacent waters and refine the model by incorporating multi-frequency acoustic data and real-time environmental observations.

Author Contributions

Conceptualization, T.-C.H., K.-W.Y. and H.-J.L.; methodology, T.-C.H. and R.-G.C.; formal analysis, T.-C.H.; investigation, T.-C.H., R.-G.C. and C.-H.C.; writing—original draft preparation, T.-C.H.; writing—review and editing, K.-W.Y.; supervision, H.-J.L. All authors have read and agreed to the published version of the manuscript.

Funding

This research received no external funding.

Institutional Review Board Statement

Not applicable. This study did not involve humans or animals.

Informed Consent Statement

Not applicable. This study did not involve humans.

Data Availability Statement

The raw data supporting this study are maintained by the Fisheries Research Institute, Ministry of Agriculture, Taiwan. Data may be obtained from the corresponding author upon reasonable request and with approval from the relevant authorities.

Acknowledgments

The authors thank the captain and crew of R/V Fishery Researcher No. 1, R/V Fishery Researcher No. 2, and the recreational fishing vessels Hai-Chong and Hua-Kuo 189 for their support during the acoustic surveys. We also thank the staff of the Fisheries Research Institute for their assistance with field sampling and technical support.

Conflicts of Interest

The authors declare no conflicts of interest.

References

  1. Fisheries Agency, Ministry of Agriculture. Fisheries Statistical Yearbook-Taiwan, Kinmen and Matsu Area; Fisheries Agency, Ministry of Agriculture: Taipei, Taiwan, 2023. [Google Scholar]
  2. Lu, H.J. Present situation and outlook for mackerel and scad fisheries. Presented at Symposium on Sustainable Utilization and Outlook for the Taiwan’s Offshore and Coastal Fisheries. Keelung, Taiwan, 20 September 2018. [Google Scholar]
  3. Hsia, K.Y.; Lee, K.-T.; Liao, C.-H.; Wang, J.-E. Effects of changes in sea surface temterature on fluctuation in larval anchovy resources in coastal waters of Taiwan. J. Fish. Soc. Taiwan 2004, 31, 127–140. [Google Scholar]
  4. Tzeng, C.H.; Chen, C.S.; Tang, P.C.; Chiu, T.S. Microsatellite and mitochondrial haplotype differentiation in blue mackerel (Scomber australasicus) from the western North Pacific. ICES J. Mar. Sci. 2009, 66, 816–825. [Google Scholar] [CrossRef]
  5. Chang, K.H.; Wu, W.L. Tagging experiments on the spotted mackerel (Scomber australasicus) in Taiwan. Bull. Inst. Zool. Acad. Sin. 1970, 16, 137–139. [Google Scholar]
  6. Hsiao, Y.Y. Changes in the Sizes-at-Maturity of Spotted Mackerel (Scomber australicus) Under Fishing and Environmental Variations. Master’s Thesis, National Taiwan Ocean University, Keelung, Taiwan, 2011. [Google Scholar]
  7. Beare, D.J.; Reid, D.G. Investigating spatio-temporal change in spawning activity by Atlantic mackerel between 1977 and 1998 using generalized additive models. ICES J. Mar. Sci. 2002, 59, 711–724. [Google Scholar] [CrossRef]
  8. Sinaga, S.; Lu, H.J.; Lin, J.R. Mackerel (Scomber australasicus) Reproduction in Northeastern Taiwan. J. Mar. Sci. Eng. 2021, 9, 1341. [Google Scholar] [CrossRef]
  9. Lin, C.Y.; Wang, S.P.; Chiang, W.C.; Griffiths, S.; Yeh, H.M. Ecological risk assessment of species impacted by fisheries in waters off eastern Taiwan. Fish. Manag. Ecol. 2020, 27, 345–356. [Google Scholar] [CrossRef]
  10. Oh, T.Y.; Shim, K.B.; Seo, Y.I.; Kwon, D.H.; Kang, S.K.; Lim, C.W. A study on resource utilization and management of chub mackerel, Scomber japonicus consider to proximate composition. J. Korean Soc. Fish. Ocean Technol. 2016, 52, 130–140. [Google Scholar] [CrossRef]
  11. Wu, L.I.; Wang, C.H.; Chen, C.S. Applying life history traits to eco-labelling schemes for fisheries management: A case study in Taiwan. Mar. Policy 2023, 148, 105412. [Google Scholar] [CrossRef]
  12. Lin, P.Y. Analysis on Mackerel Fishing Conditions for the Taiwanese Seine Fishery in Waters off Northeastern Taiwan. Master’s Thesis, National Taiwan Ocean University, Keelung, Taiwan, 2024. [Google Scholar]
  13. Wei, L.Y. A Preliminary Studies on the Reproductive Biology of the Scomber australasicus in the Northeastern Waters off Taiwan. Master’s Thesis, National Taiwan Ocean University, Keelung, Taiwan, 2003. [Google Scholar]
  14. Liao, C.H.; Lee, K.W.; Wei, L.Y. Development of Mackerel Fisheries in Taiwan: A Brief Overview. Fish. Ext. Rep. 2011, 41, 1–16. [Google Scholar]
  15. Caputi, N.; de Lestang, S.; Newman, S.J.; Jackson, G.; Smith, K. Stakeholder-government collaboration in developing cost-effective fishery-independent surveys in rights-based and co-managed fisheries. Mar. Policy 2021, 128, 104510. [Google Scholar] [CrossRef]
  16. Davies, T.D.; Jonsen, I.D. Identifying nonproportionality of fishery-independent survey data to estimate population trends and assess recovery potential for cusk (Brosme brosme). Can. J. Fish. Aquat. Sci. 2011, 68, 413–425. [Google Scholar] [CrossRef]
  17. Pennino, M.G.; Conesa, D.; López-Quílez, A.; Munoz, F.; Fernández, A.; Bellido, J.M. Fishery-dependent and-independent data lead to consistent estimations of essential habitats. ICES J. Mar. Sci. 2016, 73, 2302–2310. [Google Scholar] [CrossRef]
  18. Huang, P.M. Age and Growth of the Blue Mackerel (Scomber australasicus) in the Northeastern Waters off Taiwan. Master’s Thesis, National Taiwan Ocean University, Keelung, Taiwan, 2021. [Google Scholar]
  19. Lu, H.J.; Lin, P.Y.; Handayani, K.; Sinaga, S. Blue Mackerel (Scomber australasicus Cuvier, 1832) Spawning Off Northeastern Taiwan: Characterization of Spatio-Temporal Variability in Spawning Grounds. SSRN Electron. J. 2024, 4684263. [Google Scholar] [CrossRef] [PubMed]
  20. Fernandes, P.G.; Gerlotto, F.; Holliday, D.V.; Nakken, O.; Simmonds, E.J. Acoustic Applications in Fisheries Science: The ICES Contribution. ICES Mar. Sci. Symp. 2002, 215, 483–492. [Google Scholar]
  21. Ito, K.; Sonoki, S.; Minami, K.; Chiba, S.; Shirakawa, H.; Kawajiri, T.; Zhu, Y.; Miyashita, K. Spatial and economic quantification of provisioning service by eelgrass beds in Lake Notoro, Hokkaido, Japan. Sci. Rep. 2024, 14, 3742. [Google Scholar] [CrossRef]
  22. Moreno, A.; Conde, A.; Carrera, P.; Feijó, D.; Henriques, E.; Mendes, H.; Oliveira, P.; Silva, A.; Amorim, P.; Costa, M.; et al. PELAGO23 acoustic survey in the Atlantic Iberian waters of ICES area 9a (River Minho–Cape Trafalgar). In Working Group on Acoustic and Egg Surveys for Small Pelagic Fish in Northeast Atlantic (WGACEGG; Outputs from 2023 Meeting); ICES Scientific Reports; International Council for the Exploration of the Sea: Copenhagen, Denmark, 2023; Volume 6. [Google Scholar] [CrossRef]
  23. Rowell, T.J.; Demer, D.A.; Aburto-Oropeza, O.; Cota-Nieto, J.J.; Hyde, J.R.; Erisman, B.E. Estimating fish abundance at spawning aggregations from courtship sound levels. Sci. Rep. 2017, 7, 3340. [Google Scholar] [CrossRef]
  24. Ona, E. Physiological factors causing natural variations in acoustic target strength of fish. J. Mar. Biol. Assoc. UK 2009, 70, 107–127. [Google Scholar] [CrossRef]
  25. Scoulding, B.; Gastauer, S.; MacLennan, D.N.; Fässler, S.M.; Copland, P.; Fernandes, P.G. Effects of variable mean target strength on estimates of abundance: The case of Atlantic mackerel (Scomber scombrus). ICES J. Mar. Sci. 2017, 74, 822–831. [Google Scholar] [CrossRef]
  26. Aglen, A. Random errors of acoustic fish abundance estimates in relation to the survey grid density applied. FAO Fish. Rep. 1983, 300, 293–298. [Google Scholar]
  27. Simmonds, J.; MacLennan, D. Fisheries Acoustics: Theory and Practice, 2nd ed.; Blackwell Publishing: Hoboken, NJ, USA, 2005. [Google Scholar] [CrossRef]
  28. Shao, K.T.; Taiwan FishBase. Taiwan Fish Database. 2025. Available online: http://fishdb.sinica.edu.tw (accessed on 24 September 2025).
  29. Solomon, O.O.; Ahmed, O.O. Fishing with light: Ecological consequences for coastal habitats. Int. J. Fish. Aquat. Stud. 2016, 4, 474–483. [Google Scholar]
  30. Glass, C.W.; Wardle, C.S.; Mojsiewicz, W.R. A light intensity threshold for schooling in the Atlantic mackerel, Scomber scombrus. J. Fish. Biol. 1986, 29, 71–81. [Google Scholar] [CrossRef]
  31. Macy, W.K.; Sutherland, S.J.; Durbin, E.G. Effects of zooplankton size and concentration and light intensity on the feeding behavior of Atlantic mackerel Scomber scombrus. Mar. Ecol. Prog. Ser. 1998, 172, 89–100. [Google Scholar] [CrossRef]
  32. Foote, K.G.; Knudsen, H.P.; Vestnes, G.; MacLennan, D.N.; Simmonds, E.J. Calibration of Acoustic Instruments for Fish Density Estimation: A Practical Guide; ICES Cooperative Research Report No. 144; International Council for the Exploration of the Sea: Copenhagen, Denmark, 1987. [Google Scholar]
  33. Fernandes, P.G.; Copland, P.; Garcia, R.; Nicosevici, T.; Scoulding, B. Additional evidence for fisheries acoustics: Small cameras and angling gear provide tilt angle distributions and other relevant data for mackerel surveys. ICES J. Mar. Sci. 2016, 73, 2009–2019. [Google Scholar] [CrossRef]
  34. Fisheries Agency, Ministry of Agriculture, Wholesale Market Trading Quotations for Fishery Products. Taipei, Taiwan. 2024. Available online: https://efish.fa.gov.tw/efish/statistics/daymultidayonemarketonefish.htm (accessed on 18 June 2024).
  35. Chen, X.-H.; Lian, Y.-X.; Huang, G.; Xiang, T.; Zhang, T.-L.; Liu, J.-S.; Ye, S.-W.; Li, Z.-J. The experimental design and application of hydroacoustical techniques for target strength of two commercial Cyprinidae fish species. Acta Hydrobiol. Sin. 2019, 43, 854–860. [Google Scholar] [CrossRef]
  36. Huang, H.H. A Tank Experimental Analysis on the Precision of Size and Abundance Estimation Using Echo Integration Method. Master’s Thesis, National Taiwan Ocean University, Keelung, Taiwan, 2014. [Google Scholar]
  37. MacLennan, D.N.; Fernandes, P.G.; Dalen, J. A consistent approach to definitions and symbols in fisheries acoustics. ICES J. Mar. Sci. 2002, 59, 365–369. [Google Scholar] [CrossRef]
  38. Dunning, J.; Jansen, T.; Fenwick, A.J.; Fernandes, P.G. A new in-situ method to estimate fish target strength reveals high variability in broadband measurements. Fish. Res. 2023, 261, 106611. [Google Scholar] [CrossRef]
  39. Wu, Z.; Song, Y.; Zhao, G.; Shi, Y.; Wu, Y.; Zhang, S. Assessment of Fish Biomass and Distribution in a Nuclear Power Plant’s Water Intake Zone Using Acoustic and Trawl Methods. Animals 2025, 15, 987. [Google Scholar] [CrossRef]
  40. Scoulding, B.; Gastauer, S.; Taylor, J.C.; Boswell, K.M.; Fairclough, D.V.; Jackson, G.; Sullivan, P.; Shertzer, K.; Campanella, F.; Bacheler, N.; et al. Estimating abundance of fish associated with structured habitats by combining acoustics and optics. J. Appl. Ecol. 2023, 60, 1274–1285. [Google Scholar] [CrossRef]
  41. Alglave, B.; Rivot, E.; Etienne, M.P.; Woillez, M.; Thorson, J.T.; Vermard, Y. Combining scientific survey and commercial catch data to map fish distribution. ICES J. Mar. Sci. 2022, 79, 1133–1149. [Google Scholar] [CrossRef]
  42. Godlewska, M.; Długoszewski, B.; Doroszczyk, L.; Jóźwik, A. The relationship between sampling intensity and sampling error—Empirical results from acoustic surveys in Polish vendace lakes. Fish. Res. 2009, 96, 17–22. [Google Scholar] [CrossRef]
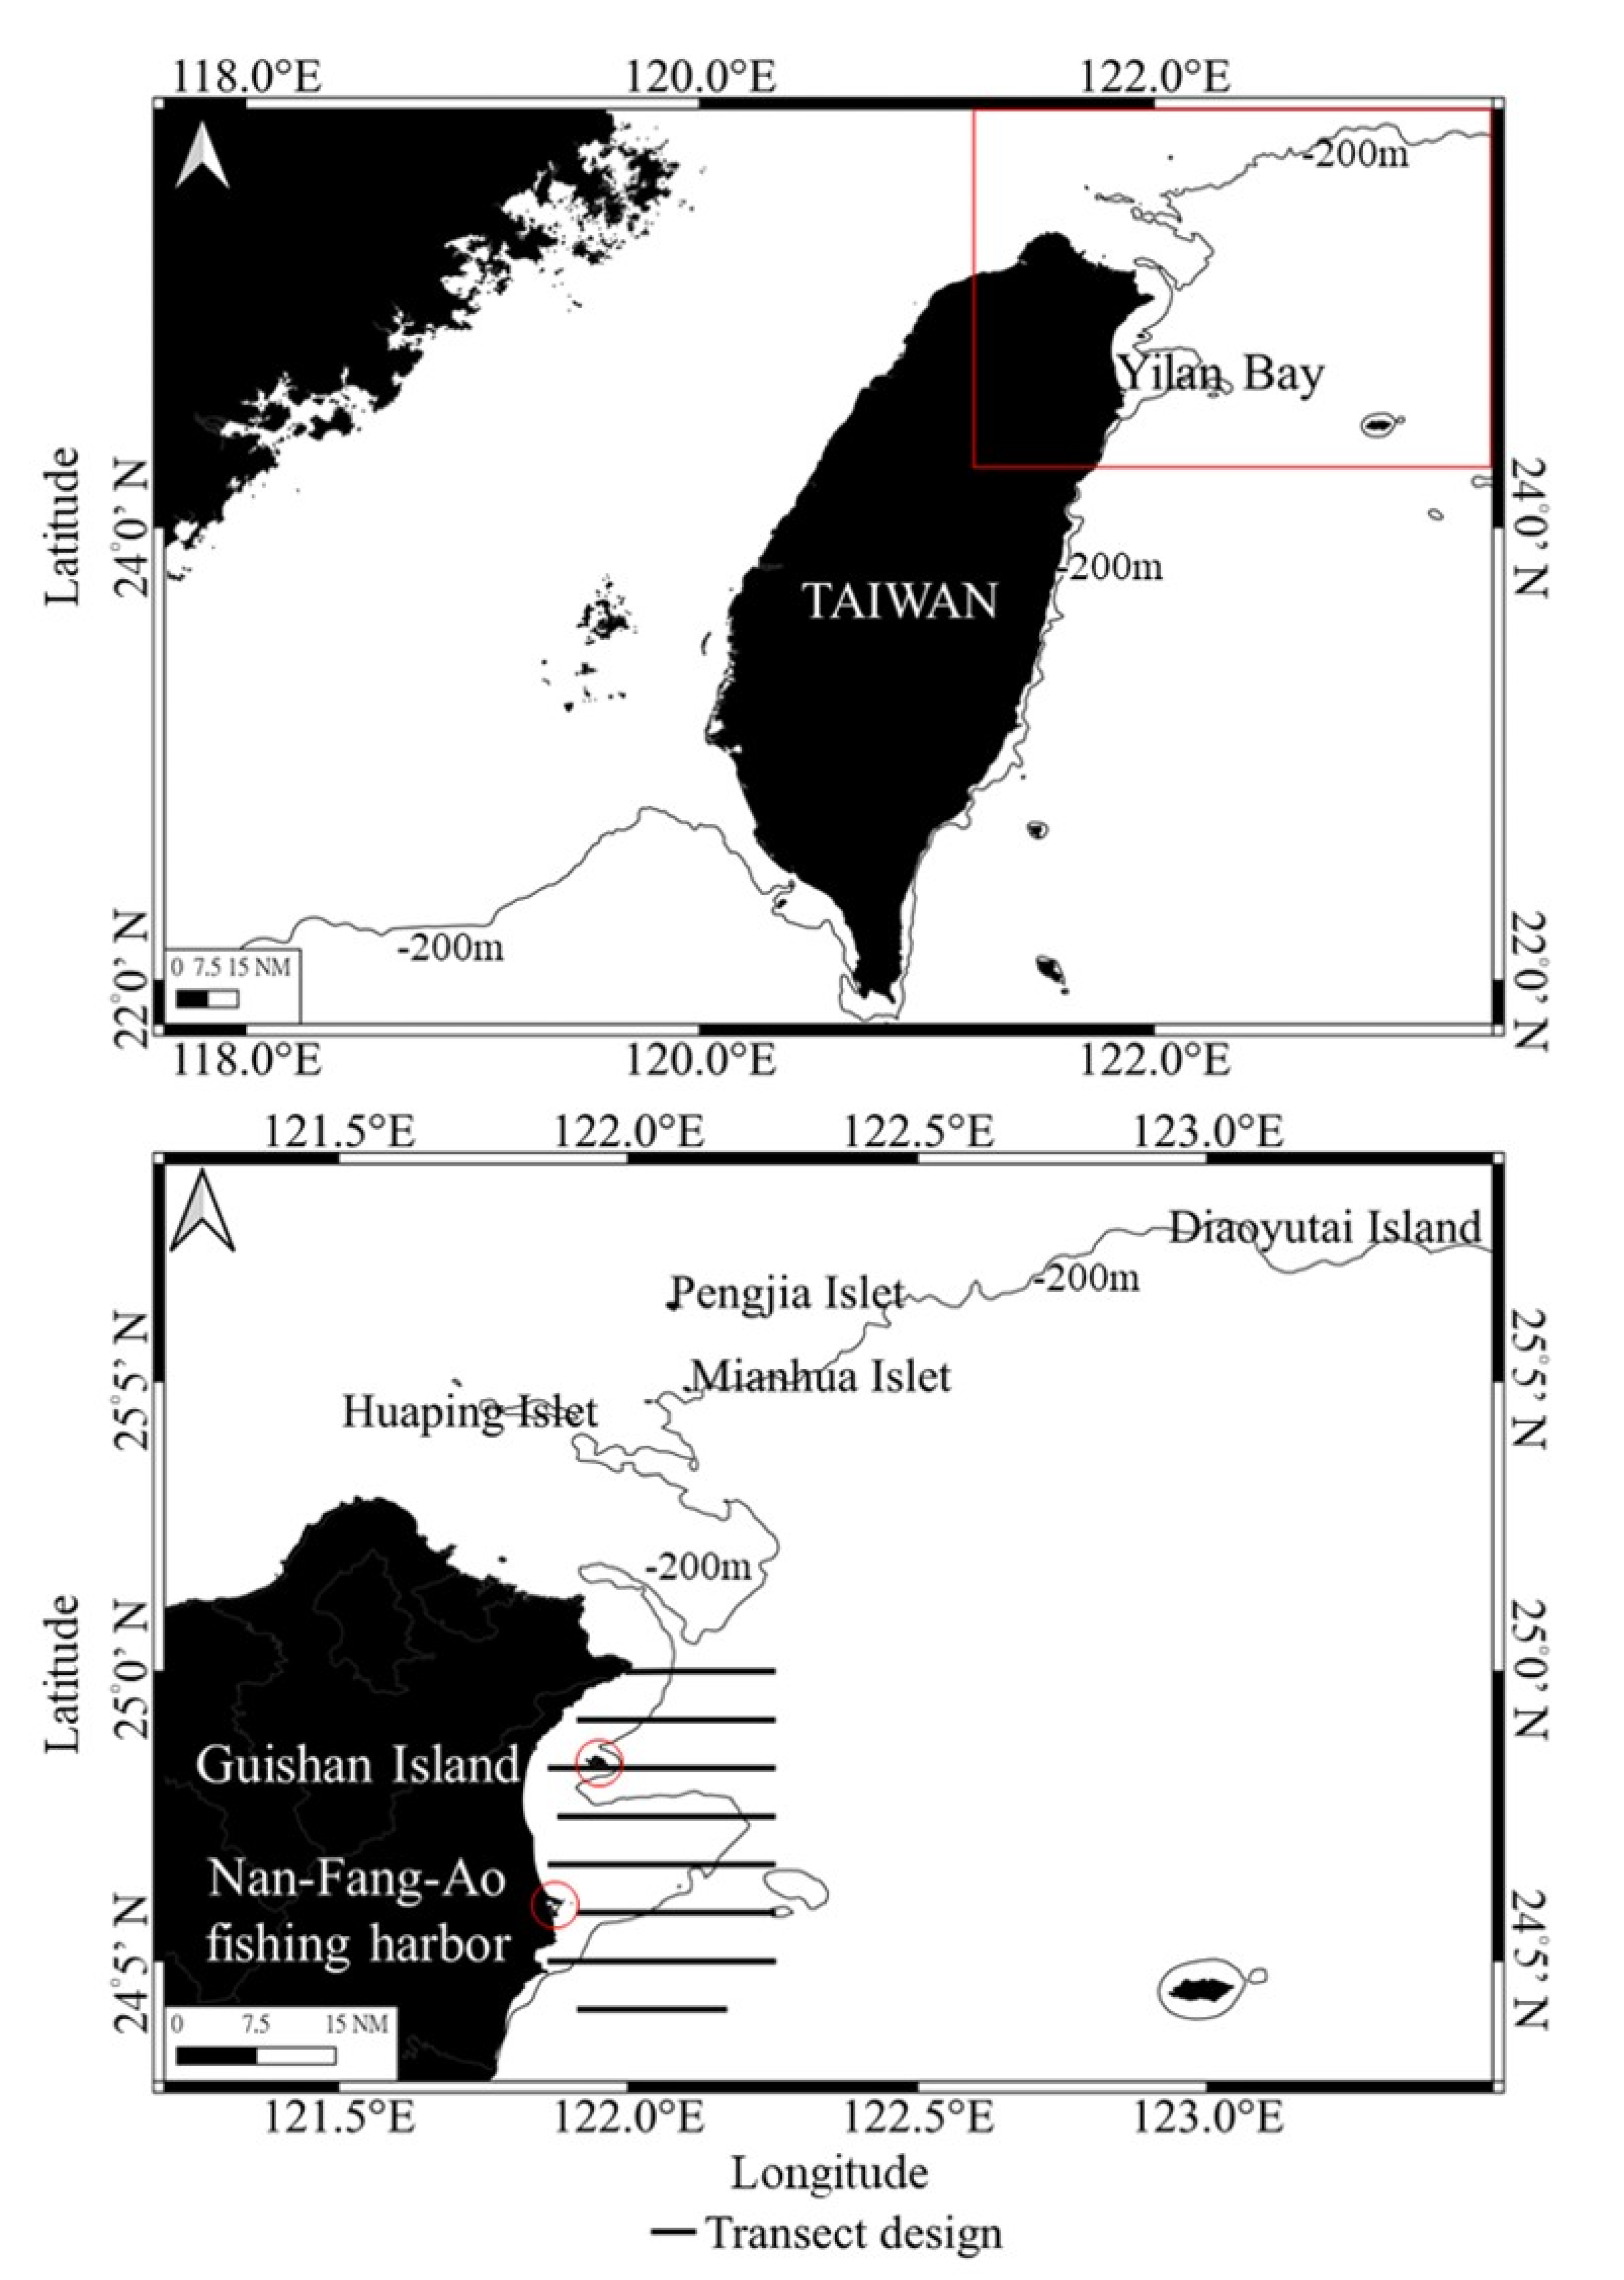
Figure 1. Survey area in Yilan Bay, northeastern Taiwan, showing transect lines covered during acoustic surveys conducted from 2021 to 2024. The boxes indicate the study areas, and the circles represent the corresponding locations (Guishan Island and Nan-Fang-Ao fishing harbor).
Fishes 10 00522 g001
Figure 2. Annual species composition of hook-and-line catch samples. Proportions are expressed as percentages of total individuals per year.
Fishes 10 00522 g002
Figure 3. Frequency distributions of hook-and-line samples in (A) 2021, (B) 2022, and (C) 2023, shown together with TS detections across the full surveyed water column.
Fishes 10 00522 g003
Figure 4. Frequency distributions of fork lengths from hook-and-line samples and TS values from acoustic detections in (A) 2021, (B) 2022, and (C) 2023.
Fishes 10 00522 g004
Figure 5. Relationship between TS deviation and mean depth across fork-length classes. Each point represents the mean TS and depth within a 1 cm length interval, based on 2021–2023 data.
Fishes 10 00522 g005
Figure 6. Comparison of TS–FL regression models. (A) Original model without depth compensation (R2 = 0.5585); (B) depth-compensated model incorporating mean depth (R2 = 0.8139).
Fishes 10 00522 g006
Figure 7. Comparison of estimated and observed fork-length distributions for (A) 2021, (B) 2022, and (C) 2023.
Fishes 10 00522 g007
Figure 8. Spatial distributions of TS values for blue mackerel from acoustic detections in (A) 2021, (B) 2022, (C) 2023, and (D) 2024.
Fishes 10 00522 g008
Figure 9. Spatial distribution of NASC values as a proxy for blue mackerel density, estimated from acoustic data collected in (A) 2021, (B) 2022, (C) 2023, and (D) 2024.
Fishes 10 00522 g009
Figure 10. Annual comparison of spawning biomass estimates (metric tons) derived from acoustic surveys and commercial landings reported at Nan-Fang-Ao Harbor for 2021–2024. Bars represent seasonal totals; short-term landings (±7 days) are discussed in the text.
Fishes 10 00522 g010
Figure 11. Yearly comparison of fork-length distributions estimated from acoustic data and validated with hook-and-line samples.
Fishes 10 00522 g011
Table 1. Acoustic parameters used in the echo sounder system.
ParameterSetting
SystemEY60EK60
Frequency200 kHz200 kHz
Absorption coefficient0.070 dB/m0.083 dB/m
Pulse rate1 pings/s1 pings/s
Pulse length1.024 ms1.024 ms
Transmitted Power1000 W1000 W
Two-way beam angle−20.70 dB−20.70 dB
Transducer gain26.54 dB27.59 dB
Maximum depth200 m200 m
Table 2. Commercial fishing sampling periods corresponding to acoustic surveys.
YearPeriod TypeDate RangeTotal Weight (Tons)
2021Entire spawning period4 January to 31 May13,609
±7 days of survey21 March to 7 April571
2022Entire spawning period1 January to 31 May7170
±7 days of survey8 March to 26 March273
2023Entire spawning period4 January to 24 May21,917
±7 days of survey13 March to 30 March5116
2024Entire spawning period1 January to 31 May21,977
±7 days of survey17 March to 3 April4290
Disclaimer/Publisher’s Note: The statements, opinions and data contained in all publications are solely those of the individual author(s) and contributor(s) and not of MDPI and/or the editor(s). MDPI and/or the editor(s) disclaim responsibility for any injury to people or property resulting from any ideas, methods, instructions or products referred to in the content.