
Long-Term Trends in Brook Trout Habitat in Appalachian Headwater Streams †
Abstract
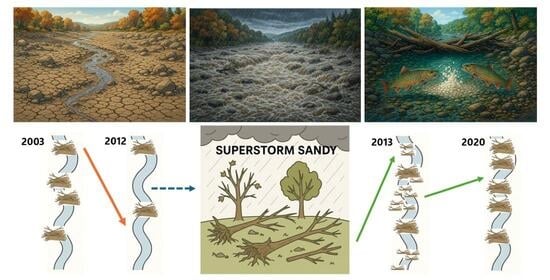
1. Introduction
2. Materials and Methods
2.1. Long-Term Data Collection
2.2. Digitization
2.3. Spatial Analysis
2.4. Statistical Analysis
3. Results
Spatial Patterns in Pools
4. Discussion
Limitations
5. Conclusions
Author Contributions
Funding
Institutional Review Board Statement
Informed Consent Statement
Data Availability Statement
Acknowledgments
Conflicts of Interest
References
- Dadswell, M.; Spares, A.; Reader, J.; McLean, M.; McDermott, T.; Samways, K.; Lilly, J. The decline and impending collapse of the Atlantic Salmon (Salmo salar) population in the North Atlantic Ocean: A review of possible causes. Rev. Fish. Sci. Aquac. 2022, 30, 215–258. [Google Scholar] [CrossRef]
- Kaeriyama, M. Warming climate impacts on production dynamics of southern populations of Pacific salmon in the North Pacific Ocean. Fish. Ocean. 2023, 32, 121–132. [Google Scholar] [CrossRef]
- Mills, K.E.; Pershing, A.J.; Sheehan, T.F.; Mountain, D. Climate and ecosystem linkages explain widespread declines in North American Atlantic salmon populations. Glob. Change Biol. 2013, 19, 3046–3061. [Google Scholar] [CrossRef]
- Nicola, G.G.; Elvira, B.; Jonsson, B.; Ayllon, D.; Almodovar, A. Local and global climatic drivers of Atlantic salmon decline in southern Europe. Fish. Res. 2018, 198, 78–85. [Google Scholar] [CrossRef]
- Peterman, R.M.; Dorner, B. A widespread decrease in productivity of Sockeye Salmon (Oncorhynchus nerka) populations in western North America. Can. J. Fish. Aq. Sci. 2012, 69, 1255–1260. [Google Scholar] [CrossRef]
- Skalski, J.R.; Whitlock, S.L.; Townsend, R.L.; Harnish, R.A. Passage and survival of juvenile salmonid smolts through dams in the Columbia and Snake Rivers, 2010–2018. N. Am. J. Fish. Manag. 2021, 41, 678–696. [Google Scholar] [CrossRef]
- Duda, J.J.; Torgersen, C.E.; Brenkman, S.J.; Peters, R.J.; Sutton, K.T.; Connor, H.A.; Kennedy, P.; Corbett, S.C.; Welty, E.Z.; Pess, G.R.; et al. Reconnecting the Elwha River: Spatial patterns of fish response to dam removal. Front. Ecol. Evol. 2021, 9, 765488. [Google Scholar] [CrossRef]
- Dodd, J.R.; Cowx, I.G.; Joyce, D.A.; Bolland, J.D. Can’t pass or won’t pass: The importance of motivation when quantifying improved connectivity for riverine brown trout Salmo trutta. J. Fish Biol. 2024, 104, 851–865. [Google Scholar] [CrossRef]
- Copeland, T.; Blythe, D.; Schoby, W.; Felts, E.; Murphy, P. Population effect of a large-scale stream restoration effort on Chinook salmon in the Pahsimeroi River, Idaho. Riv. Res. Appl. 2021, 37, 100–110. [Google Scholar] [CrossRef]
- Hill, N.L.; Trueman, J.R.; Prévost, A.D.; Fraser, D.J.; Ardren, W.R.; Grant, J.W.A. Effect of dam removal on habitat use by spawning Atlantic salmon. J. Great Lakes Res. 2019, 45, 394–399. [Google Scholar] [CrossRef]
- Hogg, R.S.; Coghlan, S.M.; Zydlewski, J.; Gardner, C. Fish community response to a small-stream dam removal in a Maine coastal river tributary. Trans. Am. Fish. Soc. 2015, 144, 467–479. [Google Scholar] [CrossRef]
- Hodge, B.W.; Henderson, R.; Brehme, C.E. Restoration effects on a native cutthroat trout stream. Riv. Res. Appl. 2025, 41, 541–552. [Google Scholar] [CrossRef]
- Richer, E.E.; Graf, S.; Kondratieff, M.C. Evaluating the performance of instream structures for a stream restoration project in Colorado. Riv. Res. Appl. 2024, 40, 308–321. [Google Scholar] [CrossRef]
- Rogers, K.M.; Rummel, S.M.; Lavelle, K.M.; Duchamp, J.E.; Niles, J.M.; Janetski, D.J. A comparison of Brook Trout passage at road culverts to broadscale assessment criteria in a Pennsylvania headwater stream. N. Am. J. Fish. Manag. 2021, 41, 1351–1359. [Google Scholar] [CrossRef]
- Davis, L.A.; Wagner, T. Scale-dependent seasonal pool habitat use by sympatric wild Brook Trout and Brown Trout populations. Trans. Am. Fish. Soc. 2016, 145, 888–902. [Google Scholar] [CrossRef]
- Dare, M.R.; Hubert, W.A.; Gerow, K.G. Changes in habitat availability and habitat use and movements by two trout species in response to declining discharge in a regulated river during winter. N. Am. J. Fish. Manag. 2002, 22, 917–928. [Google Scholar] [CrossRef]
- Hallbert, T.B.; Keeley, E.R. Instream complexity increases habitat quality and growth for cutthroat trout in headwater streams. Can. J. Fish. Aquat. Sci. 2023, 80, 992–1005. [Google Scholar] [CrossRef]
- Jakober, M.J. Autumn and Winter Movement and Habitat Use of Resident Bull Trout and Westslope Cutthroat Trout in Montana. Master’s Thesis, Montana State University, Bozeman, MT, USA, 1995. [Google Scholar]
- Roper, B.B.; Scarnecchia, D.L.; La Marr, T.J. Summer distribution of and habitat use by Chinook salmon and steelhead within a major basin of the South Umpqua River, Oregon. Trans. Am. Fish. Soc. 1994, 123, 298–308. [Google Scholar] [CrossRef]
- Saffel, P.D.; Scarnecchia, D.L. Habitat use by juvenile bull trout in belt-series geology watersheds of northern Idaho. Northw. Sci. 1995, 69, 304–317. [Google Scholar]
- Rosenfeld, J.S.; Boss, S. Fitness consequences of habitat use for juvenile cutthroat trout: Energetic costs and benefits in pools and riffles. Can. J. Fish. Aquat. Sci. 2001, 58, 585–593. [Google Scholar] [CrossRef]
- Hakala, J.P.; Hartman, K.J. Drought effect on stream morphology and brook trout (Salvelinus fontinalis) populations in forested headwater streams. Hydrobiologia 2004, 515, 203–213. [Google Scholar] [CrossRef]
- Elliott, J.M. Pools as refugia for brown trout during two summer droughts: Trout responses to thermal and oxygen stress. J. Fish Biol. 2000, 56, 938–948. [Google Scholar] [CrossRef]
- Muhlfeld, C.C.; Bennett, D.H.; Marotz, B. Fall and winter habitat use and movement by Columbia River redband trout in a small stream in Montana. N. Am. J. Fish. Manag. 2001, 21, 170–177. [Google Scholar] [CrossRef]
- Swales, S.; Lauzier, R.B.; Levings, C.D. Winter habitat preferences of juvenile salmonids in two interior rivers in British Columbia. Can. J. Zool. 1986, 64, 1506–1514. [Google Scholar] [CrossRef]
- Bean, J.R.; Wilcox, A.C.; Woessner, W.W.; Muhlfeld, C.C. Multiscale hydrogeomorphic influences on bull trout (Salvelinus confluentus) spawning habitat. Can. J. Fish. Aq. Sci. 2015, 72, 514–526. [Google Scholar] [CrossRef]
- Muhlfeld, C.C. Spawning characteristics of redband trout in a headwater stream in Montana. N. Am. J. Fish. Manag. 2002, 22, 1314–1320. [Google Scholar] [CrossRef]
- Buffington, J.M.; Lisle, T.E.; Woodsmith, R.D.; Hilton, S. Controls on the size and occurrence of pool in coarse-grained forest rivers. Riv. Res. Appl. 2002, 18, 507–531. [Google Scholar] [CrossRef]
- Lisle, T.E. Effects of woody debris on anadromous salmonid habitat, Prince of Wales Island, southeast Alaska. N. Am. J. Fish. Manag. 1986, 6, 538–550. [Google Scholar] [CrossRef]
- Bisson, P.A.; Bilby, R.E.; Bryant, M.D.; Dolloff, A.C.; Grette, G.B.; House, R.A.; Murphy, M.L.; Koski, K.V.; Sedell, J.R. Large woody debris in forested streams in the Pacific Northwest: Past, present, and future. In Streamside Management: Forestry and Fishery Interactions; University of Washington, Institute of Forest Resources: Seattle, WA, USA, 1987; pp. 143–190. [Google Scholar]
- Murphy, M.L.; Koski, K.V. Input and depletion of woody debris in Alaska streams and implications for streamside management. N. Am. J. Fish. Manag. 1989, 9, 427–436. [Google Scholar] [CrossRef]
- Bilby, R.E.; Ward, J.W. Characteristics and function of large woody debris in streams draining old-growth, clear-cut, and second growth forests in southwestern Washington. Can. J. Fish. Aq. Sci. 1991, 48, 2499–2508. [Google Scholar] [CrossRef]
- Beechie, T.J.; Pess, G.; Kennard, P.; Bilby, R.E.; Bolton, S. Modeling recovery rates and pathways for woody debris recruitment in northwestern Washington streams. N. Am. J. Fish. Mgt. 2000, 20, 436–452. [Google Scholar] [CrossRef]
- Hartman, G.F.; Scrivener, J.C.; Miles, M.J. Impacts of logging in Carnation Creek, a high-energy coastal stream in British Columbia, and their implications for restoring fish habitat. Can. J. Fish. Aquat. Res. 1994, 53, 237–251. [Google Scholar] [CrossRef]
- Flebbe, P.A.; Dolloff, C.A. Trout use of woody debris and habitat in Appalachian wilderness streams of North Carolina. N. Am. J. Fish. Mgt. 1995, 15, 579–590. [Google Scholar] [CrossRef]
- Hedman, C.W.; Lear, D.H.V.; Swank, W.T. In-stream large woody debris loading and riparian forest seral stage associations in the southern Appalachian Mountains. Can. J. For. Manag. 1996, 26, 1218–1227. [Google Scholar] [CrossRef]
- Abbe, T.B. Patterns, Mechanics and Geomorphic Effects of Wood Debris Accumulations in a Forest River System. Ph.D. Thesis, University of Washington, Seattle, WA, USA, 2000. Available online: https://wvu.idm.oclc.org/login?url=https://www.proquest.com/dissertations-theses/patterns-mechanics-geomorphic-effects-wood-debris/docview/304638861/se-2?accountid=2837 (accessed on 24 September 2025).
- Braudrick, C.A.; Grant, G.E. When do logs move in rivers? Water Resour. Res. 2000, 36, 571–584. [Google Scholar] [CrossRef]
- Ralph, S.C.; Poole, G.C.; Conquest, L.L.; Naiman, R.J. Stream channel morphology and woody debris in logged and unlogged basins in western Washington. Can. J. Fish. Aquat. Res. 2011, 51, 37–51. [Google Scholar] [CrossRef]
- Rosenfeld, J.S.; Huato, L. Relationship between large woody debris characteristics and pool formation in small coastal British Columbia streams. N. Am. J. Fish. Manag. 2003, 23, 928–938. [Google Scholar] [CrossRef]
- Martens, K.D.; Devine, W.D. Pool formation and the role of instream wood in small streams in predominantly second-growth forests. Envir. Manag. 2023, 71, 1011–1023. [Google Scholar] [CrossRef]
- McIntosh, B.A. Management History of Eastside Ecosystems: Changes in Fish Habitat over 50 Years 1935 to 1992; General Technical Report PNW 321; U.S. Forest Service, Pacific Northwest Research Station: Corvallis, OR, USA, 1994; p. 55. Available online: https://research.fs.usda.gov/treesearch/6232 (accessed on 22 September 2025).
- McIntosh, B.A. Historical changes in fish habitat for select river basins of eastern Oregon and Washington. Northw. Sci. 1994, 68, 36–53. [Google Scholar]
- McIntosh, B.A.; Sedell, J.R.; Thurow, R.F.; Clarke, S.E.; Chandler, G.L. Historical changes in pool habitats in the Columbia River Basin. Ecol. Appl. 2000, 10, 1478–1496. [Google Scholar] [CrossRef]
- Andrew, R.G.; Hartman, K.J. Uneven inputs of woody debris in Appalachian streams from Superstorm Sandy. Can. J. Fish. Aq. Sci. 2014, 72, 1–6. [Google Scholar] [CrossRef]
- Knox, J.C. Sensitivity of modern and Holocene floods to climate change. Quat. Sci. Rev. 2000, 19, 439–457. [Google Scholar] [CrossRef]
- Andrew, R.G.; Schwinghamer, C.W.; Hartman, K.J.; Briggs, E.E. Climate change influence on brook trout populations in the Central Appalachians. Ecol. Freshw. Fish 2018, 31, 710–725. [Google Scholar] [CrossRef]
- Hankin, D.G.; Reeves, G.H. Estimating total fish abundance and total habitat area in small streams based on visual estimation methods. Can. J. Fish. Aq. Sci. 1988, 45, 834–844. [Google Scholar] [CrossRef]
- Wise, S.M. Effect of differing DEM creation methods on the results from a hydrological model. Comp. Geosci. 2007, 33, 1351–1365. [Google Scholar] [CrossRef]
- Maathius, B.H.P.; Wang, L. Digital elevation model-based hydro-processing. Geocart. Intern. 2006, 21, 21–26. [Google Scholar] [CrossRef]
- Zhang, H.; Huang, G.H.; Wang, D. Establishment of channel networks in a digital elevation model of the prairie region through hydrological correction and geomorphological assessment. Can. Wat. Res. J. 2013, 38, 12–23. [Google Scholar] [CrossRef]
- Vadas, R.L., Jr. Instream-flow needs for anadromous salmonids and lamprey on the Pacific coast, with special reference to the Pacific Southwest. Environ. Monitor. Assess. 2000, 64, 331–358. [Google Scholar] [CrossRef]
- Zambrano-Bigiarini, M. HydroTSM: Time Series Management, Analysis and Interpolation for Hydrological Modelling; R package Version 0.7-0. 2024. Available online: https://cran.r-project.org/web/packages/hydroTSM/index.html (accessed on 24 September 2025).
- Bayard, T.S.; Elpick, C.S. Using spatial point-pattern assessment to understand the social and environmental mechanisms that drive avian habitat selection. AUK 2010, 127, 485–494. [Google Scholar] [CrossRef]
- Wing, M.G.; Keim, R.F.; Skaugset, A.E. Applying geostatistics to qualify distributions of large woody debris in streams. Comp. Geosci. 1999, 25, 801–807. [Google Scholar] [CrossRef]
- Kundzewicz, Z.W.; Radziekewski, M. Methodologies for trend detection. Climate Variability and Change-Hydrological Impacts. In Proceedings of the Fifth FRIEND World Conference, Havana, Cuba, 27 November–1 December 2006. [Google Scholar]
- Pettitt, A.N. A non-parametric approach to the change-point problem. Appl. Stat. 1979, 28, 126–135. [Google Scholar] [CrossRef]
- Blair, S.G.; Gutowsky, L.F.G.; Fox, M.G. Factors affecting seasonal habitat use of native brook trout (Salvelinus fontinalis) in urban headwater streams. Ecol. Freshw. Fish 2021, 30, 490–502. [Google Scholar] [CrossRef]
- Pelletier, C. Brook Trout Habitat Selection and Movement Response to Critically High Temperatures in Fragmented Stream Networks. Master’s Thesis, University of Rhode Island, Kingston, RI, USA, 2023; p. 88. [Google Scholar]
- Davis, J.M.; Baxter, C.V.; Rosi-Marshal, E.J.; Pierce, J.L.; Crosby, B.T. Anticipating stream ecosystem responses to climate change: Toward predications that incorporate effects via land-water linkages. Ecosystems 2013, 16, 909–922. [Google Scholar] [CrossRef]
- Hartman, K.J.; Logan, M.N. Movement and habitat use by transplanted Brook Trout in an Appalachian headwater stream. Northeast. Nat. 2010, 17, 357–372. [Google Scholar] [CrossRef]
- Lonzarich, D.G.; Lonzarich, M.R.; Warren, M.L., Jr. Effects of riffle length on the short-term movement of fishes among stream pools. Can. J. Fish. Aquat. Res. 2000, 57, 1508–1514. [Google Scholar] [CrossRef]
- Elliott, J.M. Periodic habitat loss alters the competitive coexistence between brown trout and bullheads in small stream over 34 years. J. Anim. Ecol. 2006, 75, 54–63. [Google Scholar] [CrossRef]
- Wenger, S.L.; Isaak, D.J.; Luce, C.H.; Nevile, H.M.; Fausch, K.D.; Dunham, J.B.; Dauwalter, D.C.; Young, M.K.; Elsner, M.M.; Reiman, B.E.; et al. Flow regime, temperature, and biotic interactions drive differential declines of trout species under climate change. Proc. Nat. Acad. Sci. USA 2011, 8, 14175–14180. [Google Scholar] [CrossRef] [PubMed]
- Petty, J.T.; Hansbarger, J.L.; Huntsman, B.M.; Mazik, P.M. Brook trout movement in response to temperature, flow and thermal refuge within a complex Appalachian riverscape. Trans. Am. Fish. Soc. 2012, 141, 1060–1073. [Google Scholar] [CrossRef]
- IPCC Climate Change 2007: Working Group 2: Impacts, Adaptation and Vulnerability; Intergovernmental Pan on Climate Change: Geneva, Switzerland, 2007.
- IPCC 2014. Climate Change 2014: Summary for Policymakers. In Climate Change 2014: Impacts, Adaptation, and Vulnerability. Fifth Assessment Report of the Intergovernmental Panel of Climate Change, 2014; Cambridge University Press: Cambridge, UK; New York, NY, USA, 2014. [Google Scholar]
- Comiti, F.; Lucia, A.; Rickenmann, D. Large wood recruitment and transport during large floods: A review. Geomorphology 2016, 269, 23–39. [Google Scholar] [CrossRef]
- Jong, B.-T.; Delworth, T.L.; Cooke, W.F.; Tseng, K.-C.; Murakami, H. Increases in extreme precipitation over the Northeast United States using high-resolution climate model simulations. NPJ Clim. Atmos. Sci. 2023, 6, 18. [Google Scholar] [CrossRef]
- Roghair, C.N.; Dolloff, A.C.; Underwood, M.K. Response of a brook trout population and instream habitat to a catastrophic flood and debris flow. Trans. Am. Fish. Soc. 2002, 131, 718–730. [Google Scholar] [CrossRef]
- Jones, T.A.; Daniels, L.D. Dynamics of large woody debris in small streams disturbed by the 2001 Dogrib fire in the Alberta foothills. For. Ecol. Manag. 2008, 256, 1751–1759. [Google Scholar] [CrossRef]
- Roni, P.; Beechie, T.J.; Bilby, R.E.; Leonetti, F.E.; Pollock, M.M.; Pess, G.R. A review of stream restoration techniques a hierarchical strategy for prioritizing restoration in Pacific Northwest watersheds. N. Am. J. Fish. Manag. 2002, 22, 1–20. [Google Scholar] [CrossRef]
- Spies, T.; Pollock, M.; Reeves, G.; Beechie, T. Effects of Riparian Thinning on Wood Recruitment: A Scientific Synthesis; U.S. Forest Service, Pacific Northwest Region, Science Review Team Wood Recruitment Subgroup: Portland, OR, USA, 2013. [Google Scholar]
- Hudy, M.; Thieling, T.M.; Gillespie, N.; Smith, E.P. Distribution, status, and land use characteristics of subwatersheds within the native range of brook trout in the Eastern United States. N. Am. J. Fish. Manag. 2008, 28, 1069–1085. [Google Scholar] [CrossRef]
- Studinski, J.M.; Hartman, K.J.; Niles, J.M.; Keyser, P. The effects of riparian forest disturbance on stream temperature, sedimentation, and morphology. Hydrobiologia 2012, 686, 107–117. [Google Scholar] [CrossRef]
- Dolloff, C.A.; Flebbe, P.A.; Owen, M.D. Fish habitat and fish populations in a southern Appalachian watershed before and after Hurricane Hugo. Trans. Am. Fish. Soc. 1994, 123, 668–678. [Google Scholar] [CrossRef]
- Virginia Department of Forestry. Virginia’s Forestry Best Management Practices for Water Quality; Technical Manual; Virginia Department of Forestry: Charlottesville, VA, USA, 2011.
- West Virginia Division of Forestry. Best Management Practices for Controlling Soil Erosion and Sedimentation from Logging Operations. Available online: https://wvforestry.com/wp-content/uploads/2024/07/Pub_SiviculturalBMP_DOC_DOF_20240719.pdf (accessed on 24 September 2025).
- Bassar, R.D.; Letcher, B.J.; Nislow, K.H.; Whiteley, A.R. Changes in seasonal climate outpace compensatory density-dependence in eastern brook trout. Glob. Change Biol. 2016, 22, 577–593. [Google Scholar] [CrossRef] [PubMed]
- Kanno, Y.; Pregler, K.C.; Hitt, N.P.; Letcher, B.H.; Hocking, D.J.; Wofford, J.B. Seasonal temperature and precipitation regulate brook trout young-of-the-year abundance and population dynamics. Freshw. Biol. 2016, 61, 88–99. [Google Scholar] [CrossRef]
- Petty, J.T.; Thorne, D.; Huntsman, B.M.; Mazik, P.M. The temperature-productivity squeeze: Constraints on brook trout growth along an Appalachian river continuum. Hydrobiologia 2014, 727, 15–166. [Google Scholar] [CrossRef]
- Santiago, J.M.; Rafeal, M.; Joaquin, S.; Diego, G.; Carlos, A.; Francisco, M.; Javier, P.; Monjo, R.; Ribalaygua, J. Waning habitats due to climate change: The effects of changes in streamflow and temperature at the rear edge of the distribution of a cold-water fish. Hydrol. Earth Syst. Sci. 2017, 21, 4073–4101. [Google Scholar] [CrossRef]
- Stranko, S.A. Brook trout declines with land cover temperature changes in Maryland. N. Am. J. Fish. Manag. 2008, 28, 1223–1232. [Google Scholar] [CrossRef]
- Childress, E.S.; Demarest, E.D.; Wofford, J.E.; Hitt, N.P.; Letcher, B.H. Strong variation in brook trout trends across geology, elevation, and stream size in Shenandoah National Park. Trans. Am. Fish. Soc. 2024, 153, 250–263. [Google Scholar] [CrossRef]
- Rahel, F.J.; Keleher, C.J.; Anderson, J.L. Potential habitat loss and population regimentation for cold water fish in the North Platte drainage of the Rocky Mountains: Response to climate warming. Limnol. Oceanogr. 1996, 41, 1116–1123. [Google Scholar] [CrossRef]
- Flebbe, P.A.; Roghair, L.D.; Bruggink, J.L. Spatial modeling to project southern Appalachian trout distributions in a warmer climate. Trans. Am. Fish. Soc. 2006, 135, 1371–1382. [Google Scholar] [CrossRef]
- Roberts, J.J.; Fausch, K.D.; Peterson, D.P.; Hooten, M.B. Fragmentation and thermal risk from climate change interact to affect persistence of native trout in the Colorado River basin. Glob. Change Biol. 2013, 19, 1383–1398. [Google Scholar] [CrossRef] [PubMed]
- Kovach, R.P.; Muhlfeld, C.C.; Al-Chokhachy, R.; Dunham, J.B.; Letcher, B.H.; Kershner, J.L. Impacts of climatic variation on trout: A global synthesis and path forward. Rev. Fish Biol. Fish. 2016, 26, 135–151. [Google Scholar] [CrossRef]
- Haak, A.L.; Williams, J.E.; Neville, H.M.; Daulwatler, D.C.; Colyer, W.T. Conserving peripheral trout populations: The values and risks of life on the edge. Fisheries 2011, 35, 530–549. [Google Scholar] [CrossRef]
- Robinson, W.A. Climate change and extreme weather: A review focusing on the continental United States. J. Air Waste Manag. Assoc. 2021, 71, 1186–1209. [Google Scholar] [CrossRef]
- Shearer, E.J.; Gorooh, V.A.; Nguyen, P.; Hsu, K.-L.; Sorooshian, S. Unveiling four decades of intensifying precipitation from tropical cyclones using satellite measurements. Sci. Rep. 2022, 12, 13569. [Google Scholar] [CrossRef]
- Wasko, C.; Rory, N.; Stein, L.; O’Shea, D. Evidence of shorter more extreme rainfalls and increased flood variability under climate change. J. Hydrol. 2021, 603B, 126994. [Google Scholar] [CrossRef]


| Stream Name | HUC-10 | Geology | Public/Private | Elevation (m) | Drainage Area (km2) | Mean Bankfull Width (m) |
|---|---|---|---|---|---|---|
| Big Run | NFSBP River | Hampshire | Public (USFS) | 1155 | 3.82 | 3.85 |
| Birch Fork | Middle Fork River | Pottsville-Limed | Private (MWERF) | 865 | 5.07 | 6.6 |
| Block Run | Greenbrier River | Chemung | Public (USFS) | 1023 | 7.34 | 6.24 |
| Brushy Run | NFSBP River | Mauch Chunk | Public (USFS) | 697 | 18.65 | 6.86 |
| Clubhouse Run | Greenbrier River | Chemung | Public (USFS) | 955 | 8.09 | 6.15 |
| Crooked Fork | Upper Elk River | Mauch Chunk | Public (USFS) | 1020 | 8.36 | 6.2 |
| Elklick Run | Dry Fork | Hampshire | Public (USFS) | 613 | 13.65 | 8.88 |
| Elleber Run | Greenbrier River | Chemung | Public (USFS) | 1129 | 5.57 | 6.23 |
| Lick Run | Greenbrier River | Chemung | Public (USFS) | 927 | 2.58 | 4.37 |
| Light Run | Middle Fork River | Pottsville-Unlimed | Private (MWERF) | 757 | 6.13 | 6.8 |
| Little Branch | Cranberry River | Pottsville-Unlimed | Public (USFS) | 1075 | 1.99 | 4.66 |
| Little Low Place | NFSBP River | Hampshire | Public (USFS) | 970 | 5.51 | 5.69 |
| Long Run (MWERF) | Middle Fork River | Pottsville-Limed | Private (MWERF) | 759 | 7.65 | 6.69 |
| Long Run (Seneca) | NFSBP River | Mauch Chunk | Public (USFS) | 695 | 13.54 | 7.25 |
| North Fork Panther Run | Middle Fork River | Pottsville-Unlimed | Private (MWERF) | 760 | 3.6 | 5.72 |
| North Fork Red Run | Dry Fork | Mauch Chunk | Public (USFS) | 942 | 13.89 | 10.3 |
| Panther Run | Middle Fork River | Pottsville-Limed | Private (MWERF) | 755 | 5.51 | 6.28 |
| Poca Run | Greenbrier River | Chemung | Public (USFS) | 1055 | 2.53 | 4.38 |
| Roaring Creek | NFSBP River | Mauch Chunk | Public (USFS) | 765 | 6.32 | 5.71 |
| Rocky Run | Middle Fork River | Pottsville-Limed | Private (MWERF) | 817 | 8.44 | 7.27 |
| Sand/Red Run | Cranberry River | Pottsville-Unlimed | Public (USFS) | 1065 | 4.55 | 6.27 |
| Schoolcraft Run | Middle Fork River | Pottsville-Limed | Private (MWERF) | 736 | 7.94 | 6.87 |
| Seneca Creek | NFSBP River | Hampshire | Public (USFS) | 1144 | 5.28 | 5.19 |
| Sugar Drain | Middle Fork River | Pottsville-Unlimed | Private (MWERF) | 872 | 1.73 | 4.21 |
| Whites Run | NFSBP River | Hampshire | Public (USFS) | 728 | 12.8 | 6.68 |
Disclaimer/Publisher’s Note: The statements, opinions and data contained in all publications are solely those of the individual author(s) and contributor(s) and not of MDPI and/or the editor(s). MDPI and/or the editor(s) disclaim responsibility for any injury to people or property resulting from any ideas, methods, instructions or products referred to in the content. |
© 2025 by the authors. Licensee MDPI, Basel, Switzerland. This article is an open access article distributed under the terms and conditions of the Creative Commons Attribution (CC BY) license (https://creativecommons.org/licenses/by/4.0/).
Share and Cite
Zacavish, Z.; Hartman, K. Long-Term Trends in Brook Trout Habitat in Appalachian Headwater Streams. Fishes 2025, 10, 512. https://doi.org/10.3390/fishes10100512
Zacavish Z, Hartman K. Long-Term Trends in Brook Trout Habitat in Appalachian Headwater Streams. Fishes. 2025; 10(10):512. https://doi.org/10.3390/fishes10100512
Chicago/Turabian StyleZacavish, Zac, and Kyle Hartman. 2025. "Long-Term Trends in Brook Trout Habitat in Appalachian Headwater Streams" Fishes 10, no. 10: 512. https://doi.org/10.3390/fishes10100512
APA StyleZacavish, Z., & Hartman, K. (2025). Long-Term Trends in Brook Trout Habitat in Appalachian Headwater Streams. Fishes, 10(10), 512. https://doi.org/10.3390/fishes10100512