Article

Pulse Frequency and Water Velocity Determine Crossing Probability in Pulsed Direct-Current Fish Barriers

1
China Yangtze Power Co., Ltd., Yichang 443000, China
2
Hubei Technology Innovation Center for Smart Hydropower, Wuhan 430000, China
3
Key Laboratory of Ecological Impacts of Hydraulic-Projects and Restoration of Aquatic Ecosystem of Ministry of Water Resources, Institute of Hydroecology, Ministry of Water Resources and Chinese Academy of Sciences, Wuhan 430079, China
4
Innovation Team of the Changjiang Water Resources Commission for River and Lake Ecosystem Restoration Key Technology, Institute of Hydroecology, Ministry of Water Resources and Chinese Academy of Sciences, Wuhan 430079, China
5
Changjiang Survey, Planning, Design and Research Co., Ltd., Wuhan 430010, China
*
Author to whom correspondence should be addressed.
Fishes 2025, 10(10), 510; https://doi.org/10.3390/fishes10100510
Submission received: 9 September 2025 / Revised: 3 October 2025 / Accepted: 9 October 2025 / Published: 10 October 2025
(This article belongs to the Special Issue Adaptation and Response of Fish to Environmental Changes)

Abstract

Fish barrier technology by pulsed direct current has broad application potential to guide fish to suitable waters. The primary objective of this investigation was to study the effects of electric pulse frequency and water velocity on fish deterrence by pulsed direct current. The test fish were adults of two common carp species, Hypophthalmichthys nobilis (bighead carp, standard length 0.460–0.545 m) and Cyprinus carpio (Eurasian carp, standard length 0.292–0.335 m). Experiments were conducted in the 20 m swimming chamber of a 50 m flume, with a pulsed electric barrier produced by vertical electrodes located in the middle of the swimming chamber. The effectiveness of the electric barrier in deterring fish from swimming upstream past the electrodes was tested. The electric pulse generator produces a square wave pulse, with a voltage of 150 V and width of 2 ms. There were four electric pulse frequency treatments (4 Hz, 6 Hz, 8 Hz, 10 Hz), and two water velocity treatments (0.2 m/s, 0.6 m/s), with 10 replicates of each treatment. There were four primary findings. (1) Of the 160 fish tested, no fish was stunned and only 4 trembled (lost the ability to swim) for more than 2 s after encountering the electric barrier. (2) At a given water velocity, the crossing probability decreased as pulse frequency increased, and the decrease was largest when the frequency increased from 8 to 10 Hz. (3) At a given electric pulse frequency, the crossing probability was higher at the high water velocity, and barrier efficiency was more sensitive to velocity at higher pulse frequencies. (4) H. nobilis, a stronger swimmer, crossed more often than C. carpio. This study can provide ideas for the management of invasive species. However, the study was conducted under controlled laboratory conditions, and field experiments should be carried out before field applications.
Key Contribution: (1) At a given water velocity, the crossing probability decreased as pulse frequency increased, and the decrease was largest when the frequency was increased from 8 to 10 Hz. (2) At a given electric pulse frequency, the crossing probability was higher at the high water velocity, and barrier efficiency was more sensitive to velocity at higher pulse frequencies.

1. Introduction

There are many water conservancy and hydropower projects in rivers around the world. These projects bring enormous economic and social benefits but threaten fishery resources. If no measures are taken to deter fish, large numbers will enter dangerous areas such as turbine penstocks and spillways. It has been observed that without deterrence, fish may enter the tailrace tunnel during turbine maintenance, and be trapped and die after the penstocks are drained and the tailrace gates are closed. Human interventions in river systems may require measures to guide fish migration. Electric barriers, particularly those using pulsed direct current, have been widely adopted to prevent upstream movement of fish [1,2,3,4]. They have also been used to prevent the invasion of foreign fish species [5]. But electric barriers often affect native and non-native species alike. Therefore, we need to study electric barriers extensively and accumulate more data.
A mechanical barrier that was only 62% effective was fitted with electrodes to create a hybrid barrier, and deterrence effectiveness increased to as high as 96% [6]. Electric barriers have been installed to prevent immigration of nonindigenous species into the Gila River, State of Arizona in US [7], and to block immigration of invasive silver carp (H. molitrix) and bighead carp (H. nobilis) into the Great Lakes in central North America [8]. The electric barrier had a deterrence effectiveness of >95% for bighead carp in Rice Creek, Minnesota, in the USA [9] and 98.7% for grass carp (Ctenopharyngodon idella) [10]. In another study, no common carp (Cyprinus carpio) passed the electric barrier despite over 300 attempts by 40 fish [11].
The factors affecting the effectiveness of pulsed direct-current barriers can be divided into two categories: biological and environmental. The primary biological factors are biological differences among fish species, physiological status, size, shape, and skin type [12,13,14]. Different fish species respond differently to electric fields in water; species with longer body lengths are more sensitive than those with shorter body lengths [13]. The primary environmental factors are water temperature, conductivity, and water velocity [15,16,17,18,19]. Water temperature affects fish physiology, which may affect sensitivity to electric fields. Increasing water temperature increases the metabolic rate of fish and may increase sensitivity to electric fields [16]. The pulse voltage, frequency, width, and waveform are the electric barrier parameters that can be varied to optimize fish guidance effectiveness [10,20,21,22].
Two common carp species, Hypophthalmichthys nobilis and Cyprinus carpio, were selected for testing. Both are Asian carps that are widely distributed in China, but are invasive species in many countries, especially the United States and Canada. In China, pulsed direct current can be used to guide the species toward suitable habitat, and in other countries it can be used to limit their movement. Thus, there is theoretical and practical significance for studying pulsed direct-current fish barriers for these two species.
We hypothesize that higher pulse frequency and lower water velocity will decrease crossing probability, and that interspecific differences will be explained by swimming ability. The primary objective of this investigation was to determine the effects of electric pulse frequency (4, 6, 8, and 10 Hz), water velocity (0.2 and 0.6 m/s), and species-specific differences on the probability of fish swimming through an electric barrier. Our results provide basic scientific data on fish deterrence by pulsed direct electric current.

2. Materials and Methods

2.1. Fish

Adult H. nobilis and C. carpio (80 each) were obtained from an aquaculture operation in Wuhan, China. Fish sample sizes and body measurements were similar across all treatments. A pump was used to circulate water in the holding pools and the flume used for testing. Water conductivity and water temperature were measured with a conductivity meter (AZ Instrument AZ8362, Taizhong, China). Dissolved oxygen (DO) was measured with a DO meter (Hach HQ30d, Loveland, CO, USA), and the holding pool DO was maintained at >7.0 mg/L using an air pump.

2.2. Apparatus

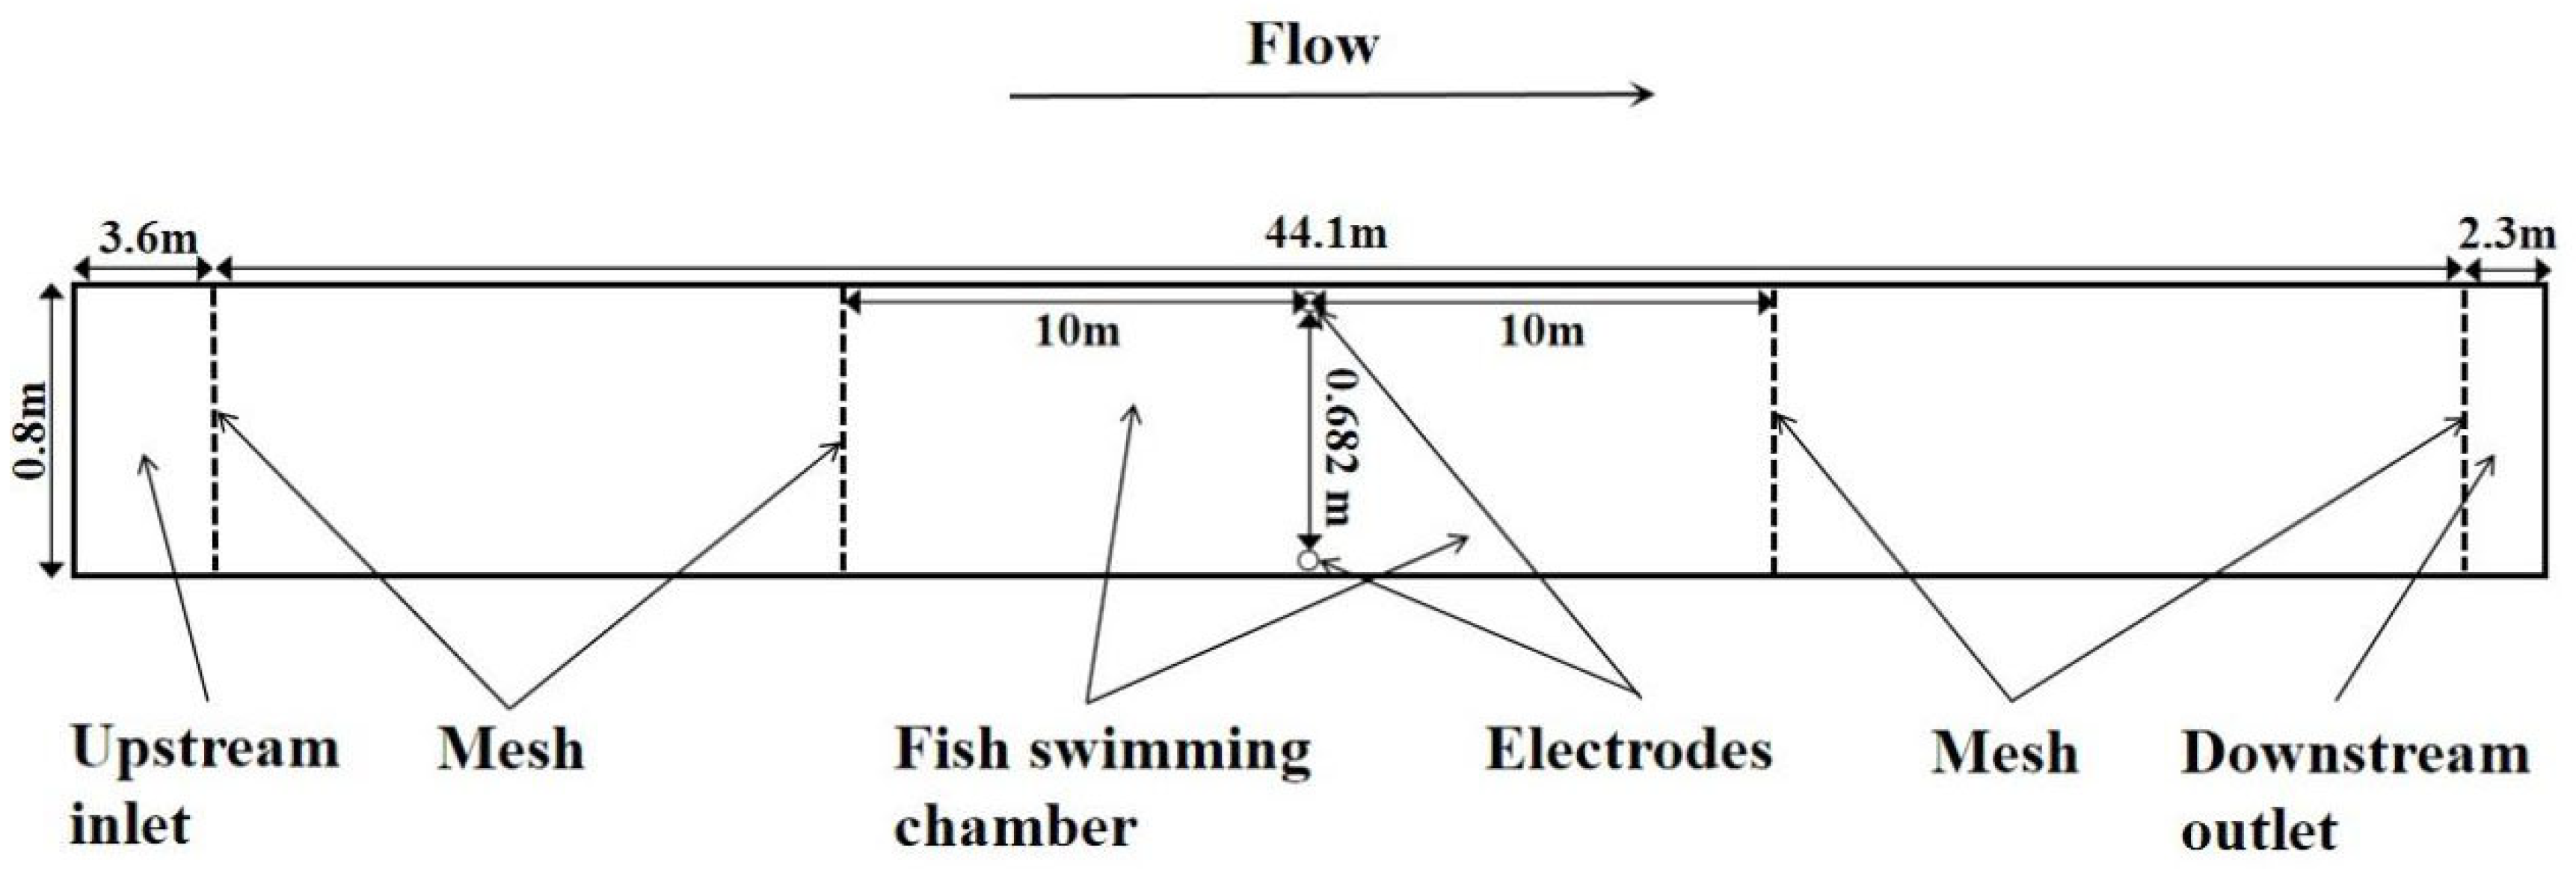
The entire flume is 50 m long, with an inner width of 0.8 m and is constructed of steel and tempered glass (Figure 1). The underground return channel flows into a steel water tank (3.6 m in length) equipped with baffles to give a more uniform flow. The inlet is followed by a 44.1 m section, constructed of tempered glass with steel framing, and the outlet is a second steel tank, 2.3 m in length. Flume water velocity is controlled by the return flow pump and the outlet baffle, hinged at the bottom so the baffle angle can be set from 0° to 90° relative to the bottom of the flume. In this study, water temperature ranged from 17.3 to 18.8 °C, and water conductivity was between 344 and 356 uS/cm.
The main components of the electric pulse generation system include an electrical control system, housed in a cabinet, and two vertical electrodes that include wiring. The electrodes are steel pipes (OD = 0.018 m, L = 0.96 m) fixed at the middle of the flume, separated by 0.682 m, and located 0.041 m from the sides of the flume and 0.010 m from the bottom. Stainless steel mesh positioned 10 m upstream and 10 m downstream from the electrodes (so as not to interfere with the electric field) results in a 20 m swimming chamber (Figure 2).

2.3. Fish Deterrence Testing

Two carp species, H. nobilis and C. carpio, were selected for testing, and 10 replicates were run for each treatment and species. The electrical pulses were direct current, 150 V square wave, with a pulse width of 2 ms. The experimental variables included pulse frequency and water velocity. Previous studies have reported up to 90% deterrence with a pulse frequency of 10 Hz [20,23], but higher frequencies may damage fish health [24]. Based on these reports, four frequencies were selected for this investigation (4 Hz, 6 Hz, 8 Hz, and 10 Hz: 1 Hz = 1 pulse/s, Figure 3), and the water velocity was set at two levels (0.2 m/s, 0.6 m/s). This experimental design resulted in 16 treatment groups (4 pulse levels × 2 flow velocities × 2 fish species) and 160 tests.
Before testing, a test fish selected randomly was placed in the swimming chamber and was acclimated to the chamber for 10 min. The fish was gently guided to the downstream end of the swimming chamber. The water velocity and the electric pulse voltage and frequency were set. The test fish would then naturally swim upstream against the current. Five fish did not spontaneously move upstream within three minutes. In these cases, the fish was slowly approached and gently guided with a stick and, in all cases, the fish moved upstream. The behavior of the fish was observed as it neared the electrodes, either passing the electric pulse barrier or reversing direction to escape the pulse. If the fish passed through the electric barrier, it was recorded as “pass”, but if the test fish reversed direction to escape the electric pulse, it was recorded as “not pass” (Table 1). It was also noted whether the test fish was stunned or trembled (lost the ability to swim) for more than 2 s. After the results were recorded, the electric barrier was turned off, the fish was removed from the flume, and its body (standard) length, total length, weight, water temperature, dissolved oxygen, and water conductivity were recorded.

2.4. Data Analysis

In this study, the experimental variables included fish species, water velocity, and pulse frequency. Based on 10 replicates, the probability (P) of test fish crossing the electric barrier as pulse frequency increased was analyzed using Kaplan–Meier plots (survival curves) [25,26]. The probabilities that the test fish crossed the electric barrier vs. deterred must add up to 1. Significant differences between treatment groups were determined by the hazard ratio (HR) and p-value based on the log-rank test. The censoring value was considered as the fish crossed the electric barrier at a certain pulse frequency (4, 6, 8, and 10 Hz). Thus, each of the Kaplan–Meier plots and estimated crossing probabilities was based on 40 test fish.
The degree to which a change in an experimental variable alters the crossing probability was reported as the sensitivity coefficient (SC)—the larger the change in probability, the higher the sensitivity coefficient. However, the probability of passing the electric barrier decreases with frequency but increases with water velocity. Comparable, logically consistent sensitivity coefficients for the two experimental variables were obtained by defining the pulse frequency sensitivity coefficient (SCpf) by Equation (1) and the water velocity sensitivity coefficient (SCfv) by Equation (2):
SCpf = P1/P2
SCfv = P2/P1
where P1 is the value of P at the lower pulse frequency or water velocity, and P2 is the value of P at the higher pulse frequency or water velocity.
Statistical analysis of morphological and physical parameters was performed using Origin 9.0 software.

3. Results

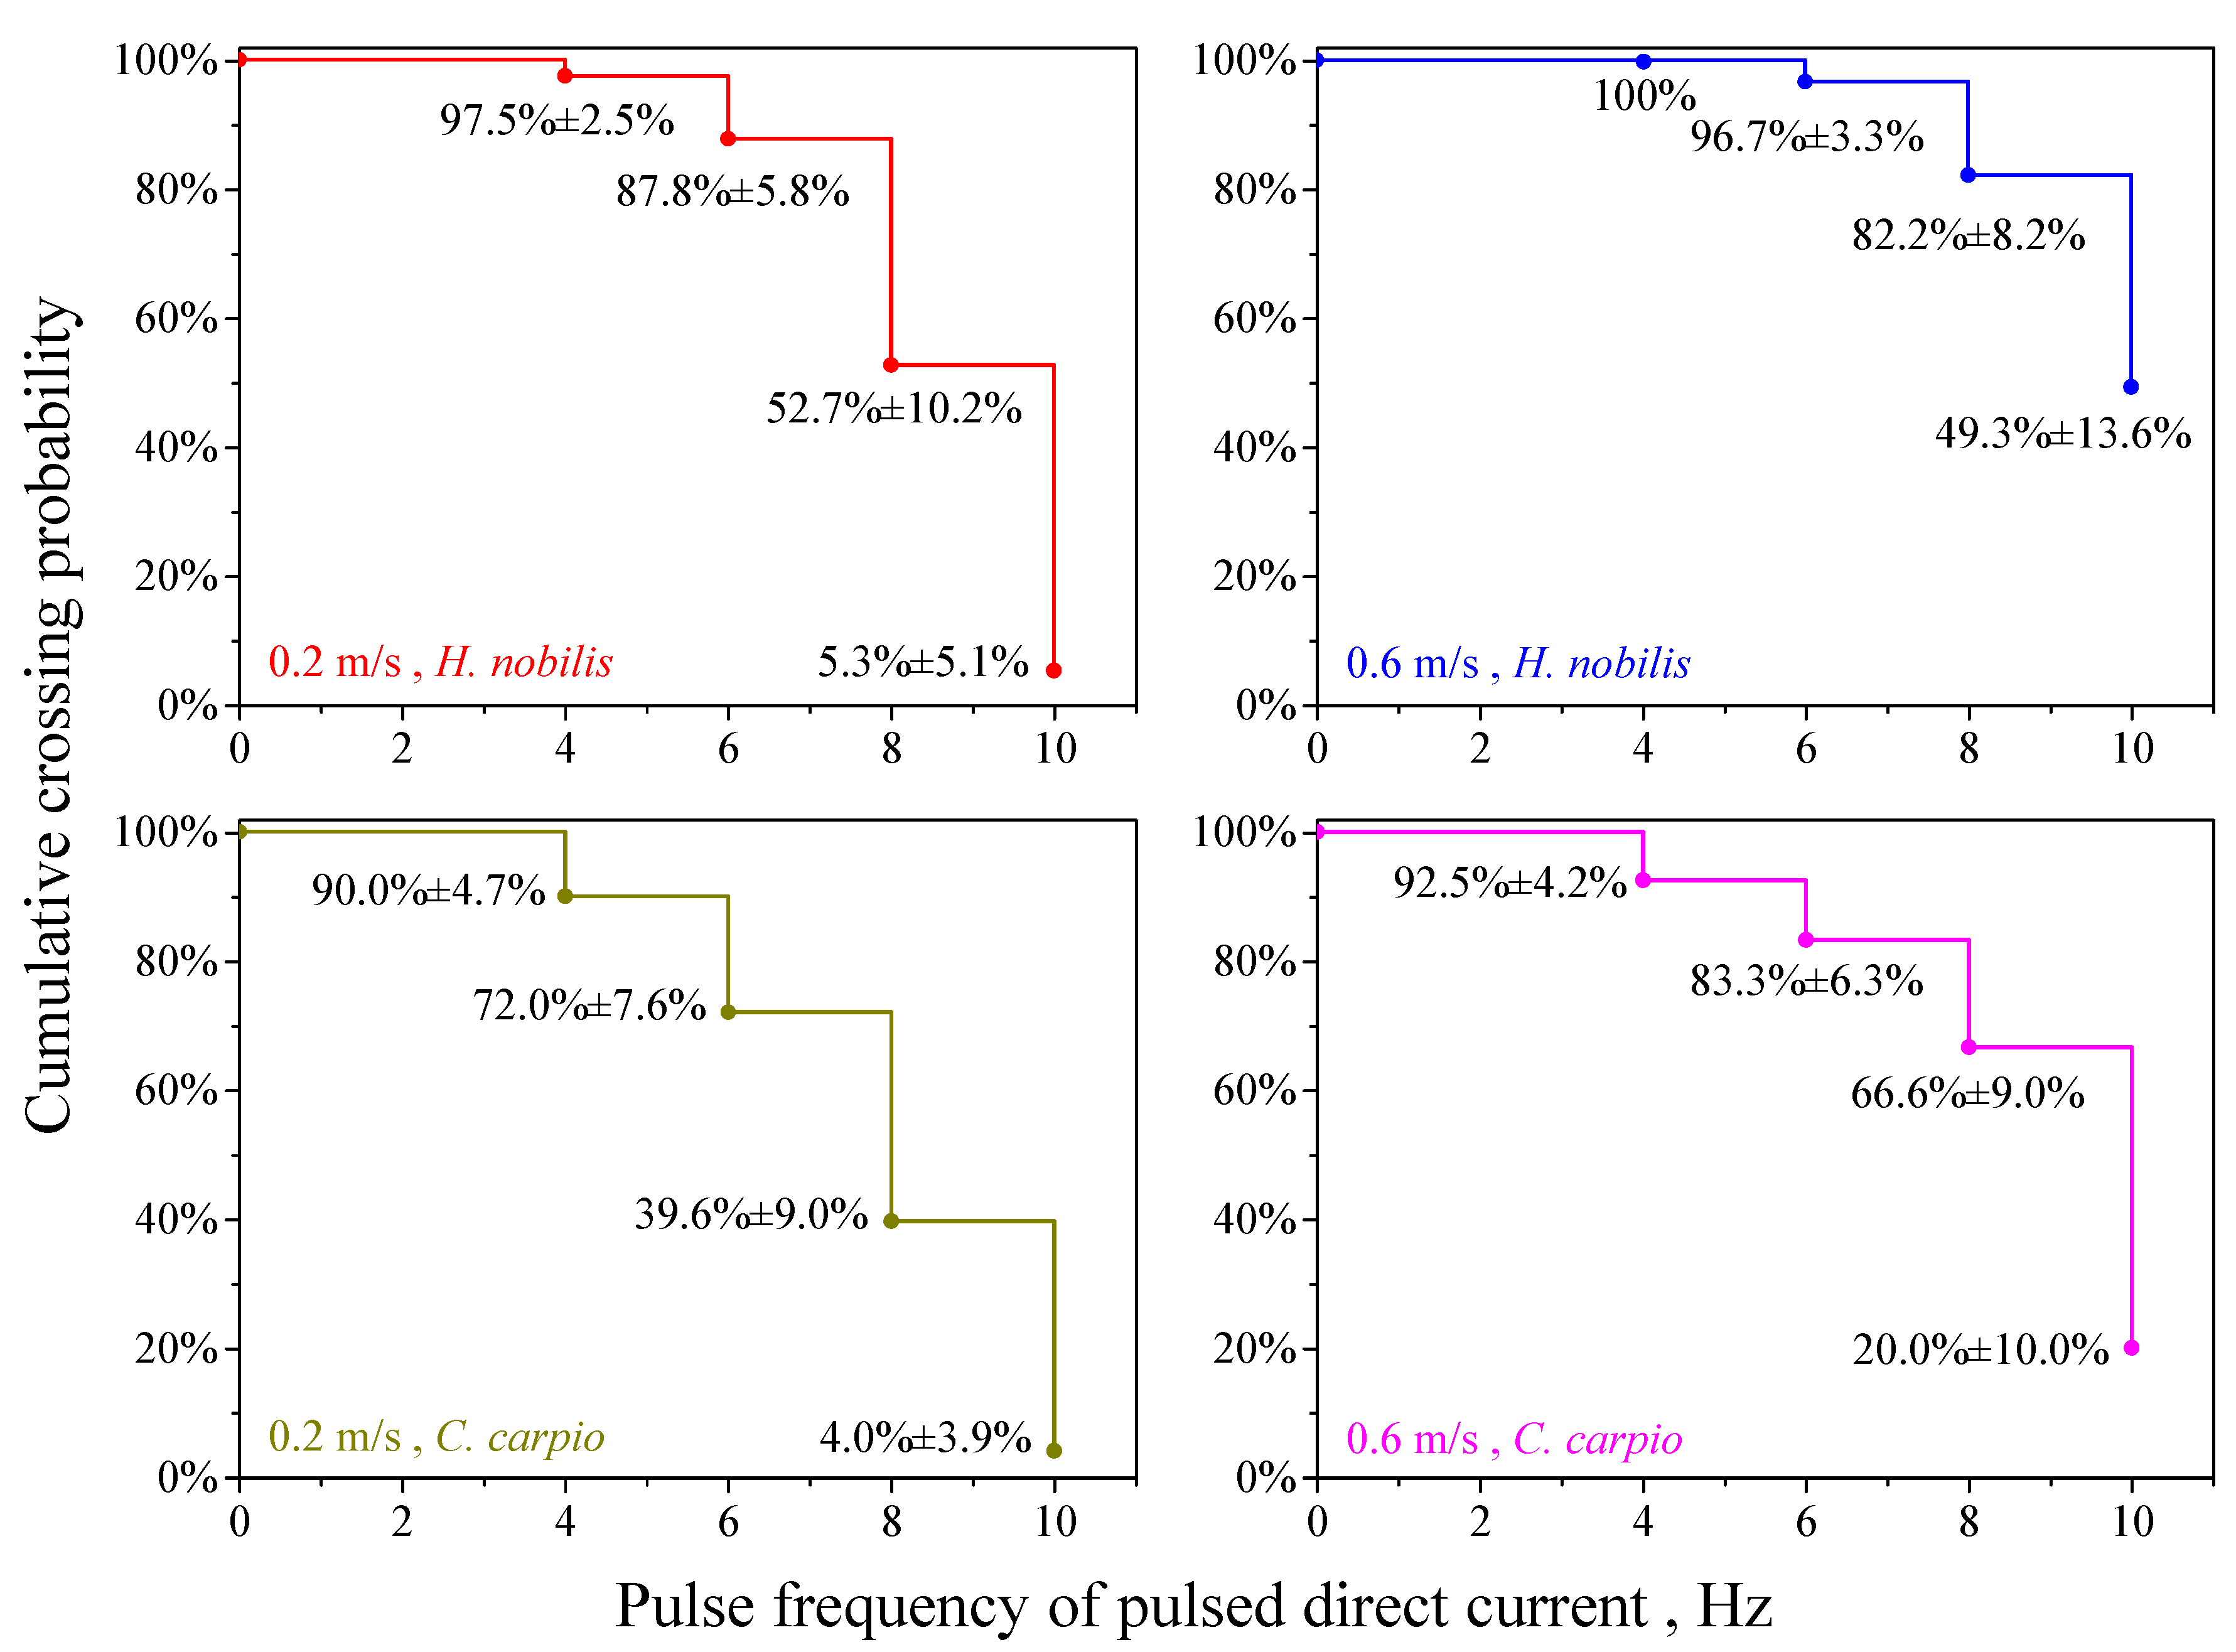
Fish size for each experimental treatment and the percentage of test fish that passed the electric pulse barrier appear in Table 1. Of the 160 test fish exposed to the pulsed direct current (square wave, 150 V, 2 ms pulse width, 4–10 Hz), no fish was stunned (i.e., lost body balance) and four fish trembled for more than 2 s (Table 1). It is important to note that Table 1 displays the raw experimental data as the percentage of test fish that crossed the electric barrier, whereas Figure 4 and Figure 5 display the probabilities of fish crossing the barrier calculated using the Kaplan–Meier Estimator.
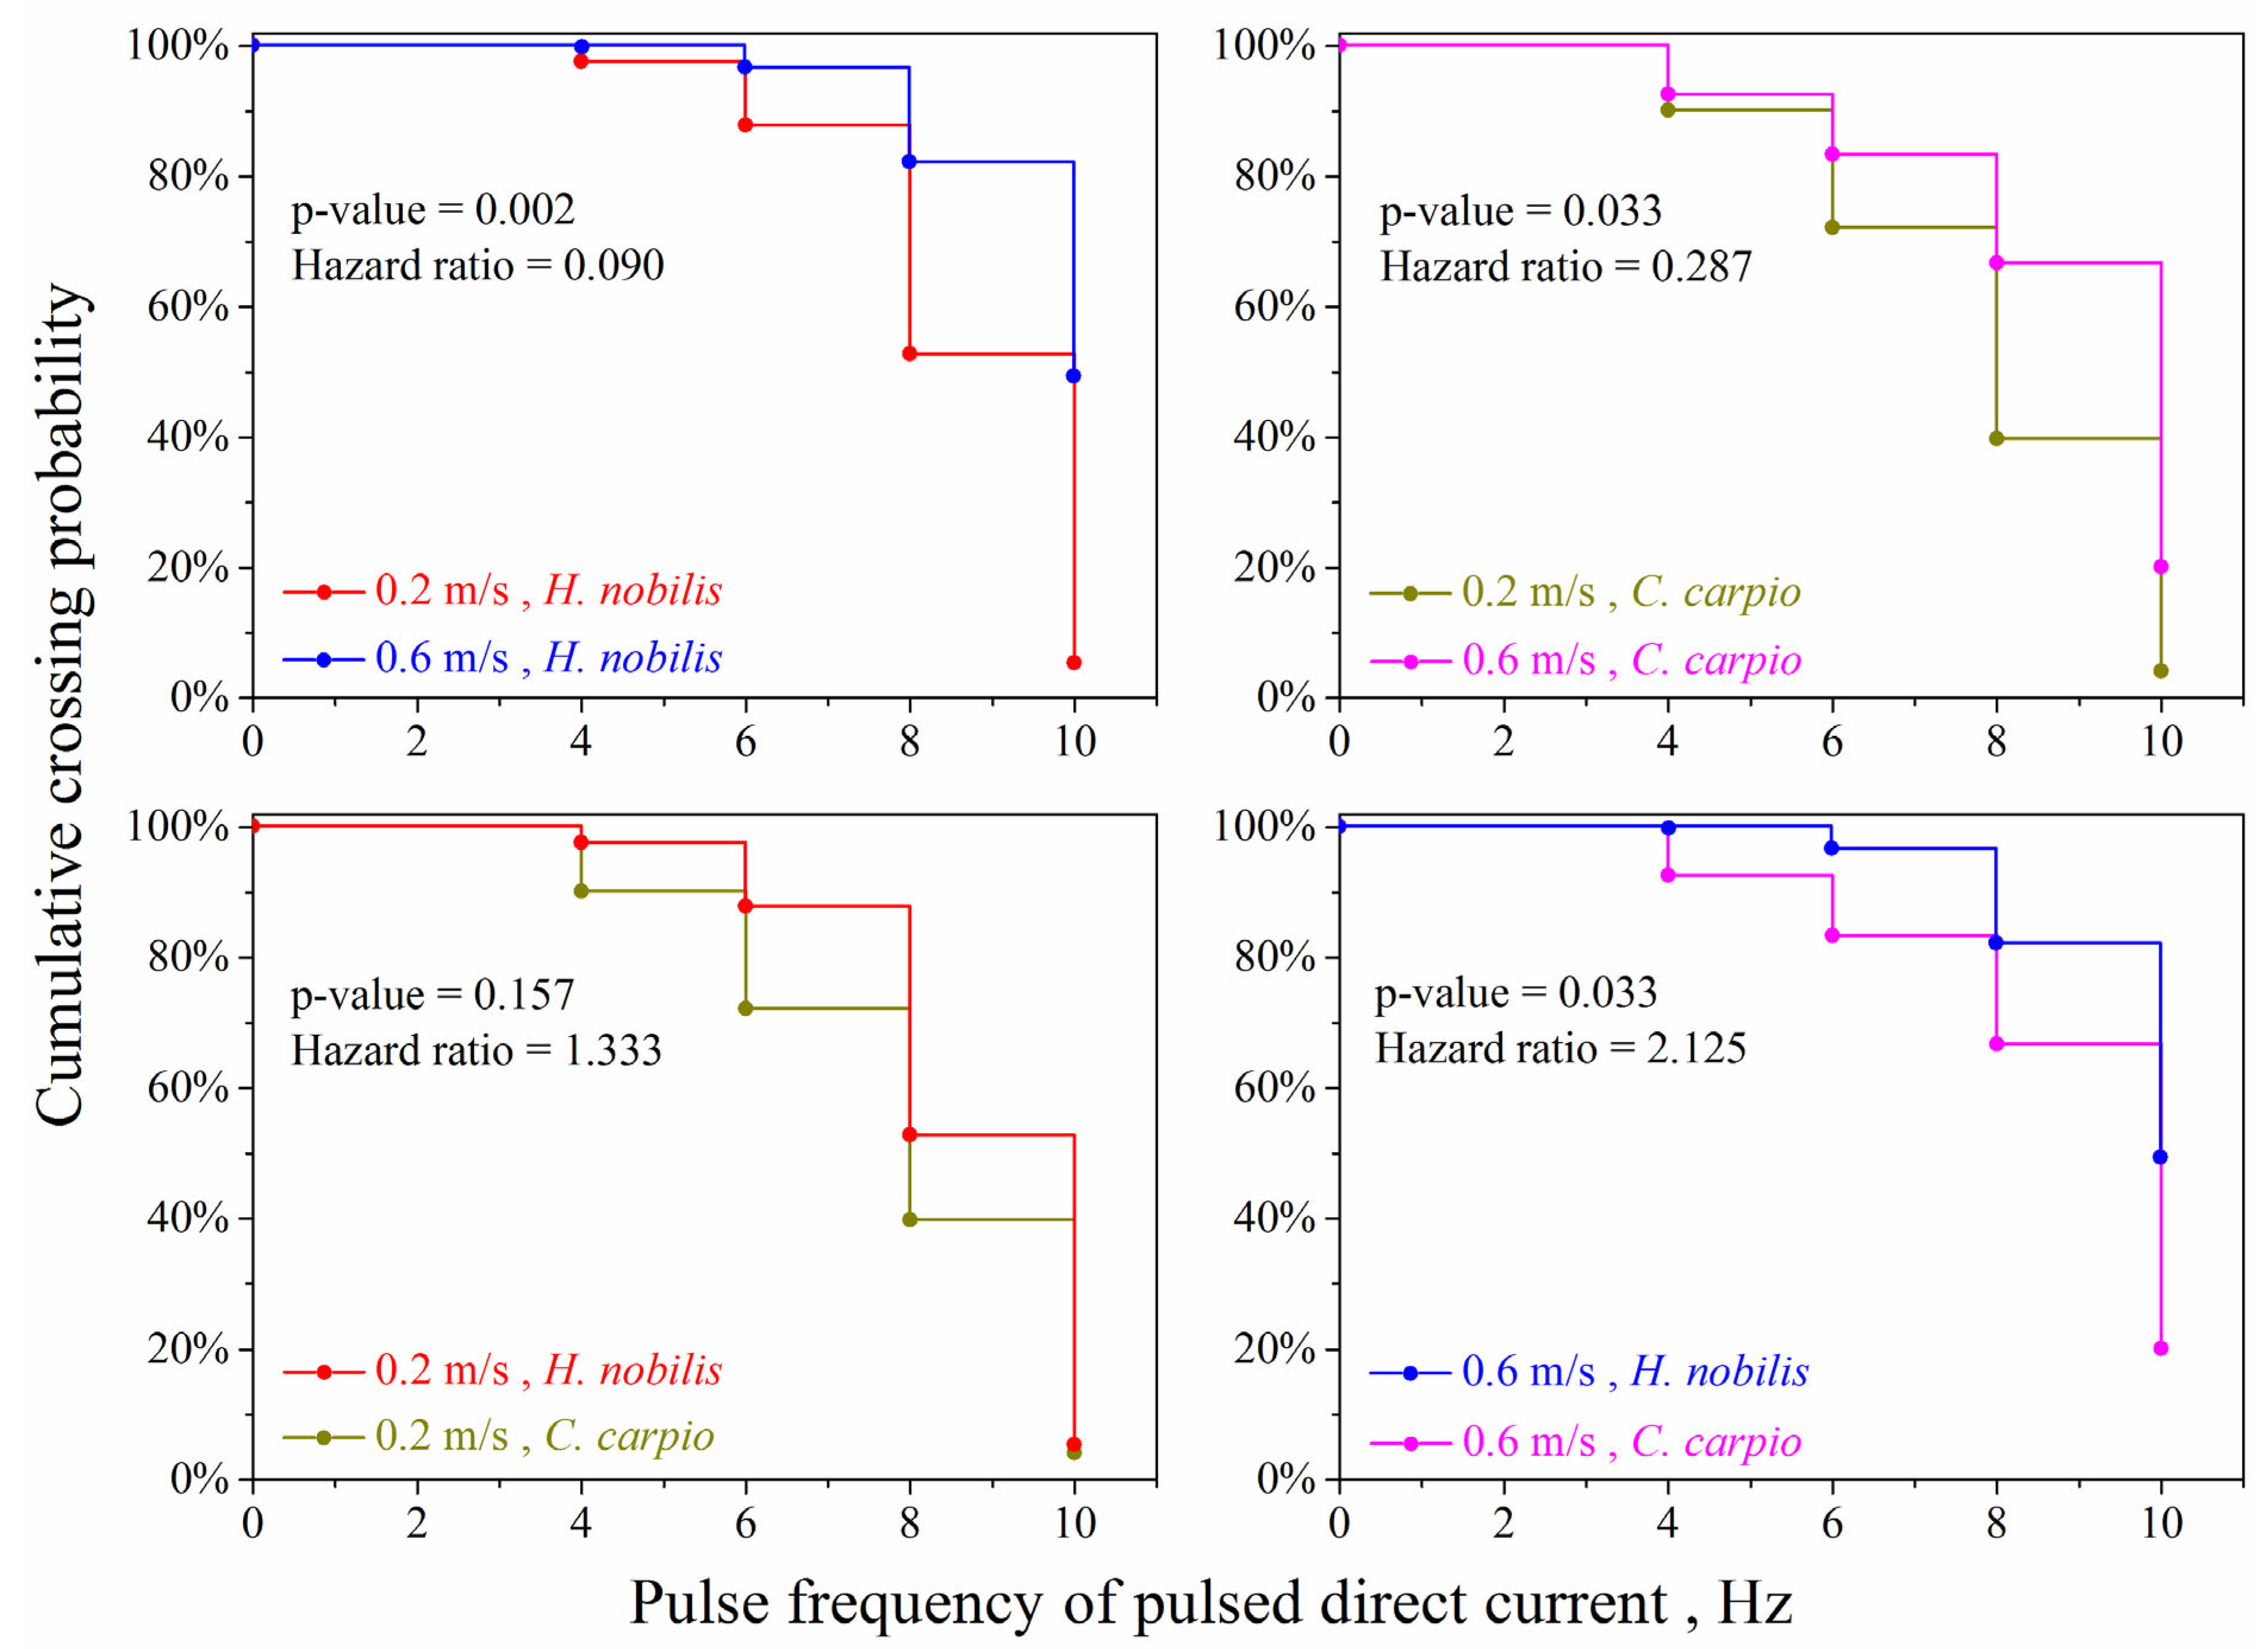
Fish crossing probabilities are shown in Figure 4 and Figure 5, presented as the Kaplan–Meier plots. Cumulative crossing probability decreased as pulse frequency increased. When the pulse frequency increased from 4 to 10 Hz at a given water velocity, the crossing probability decreased from 90–100% to 4–49% (ranges reflect the results for both species) (Figure 4). The pulse frequency sensitivity coefficient (SCpf) increased with each incremental change in pulse frequency (Table 2). Water velocity (0.2 m/s and 0.6 m/s) significantly affected the crossing probability in both H. nobilis (p = 0.002, hazard ratio HR = 0.090) and C. carpio (p = 0.033, HR = 0.287). At the lower water velocity (0.2 m/s), the crossing probabilities were not significantly different between the two species (p = 0.157, HR = 1.333), but at the higher water velocity (0.6 m/s), the crossing probabilities were significantly different between the two species (p = 0.033, HR = 2.125).
The sensitivity coefficients of the pulse frequency (SCpf) are displayed in Table 2, and those of the water velocity (SCfv) are displayed in Table 3.
The highest sensitivity coefficient of pulse frequency for both species (SCpf = 9.94 and 9.90), was when the pulse frequency was increased from 8 to 10 Hz at the low water velocity (Table 2).
At the same pulse frequency, the crossing probability at the low water velocity (0.2 m/s), was lower than at high velocity (0.6 m/s), for both H. nobilis and C. carpio. The sensitivity coefficient of water velocity (SCfv) for crossing probability increased with pulse frequency (Table 3). For the two species, SCfv ranged from 1.03 to 1.69 with pulse frequency increasing from 4 to 8 Hz, but increased to 9.30 (H. nobilis) and 5.00 (C. carpio) when the pulse frequency was increased from 8 to 10 Hz.

4. Discussion

4.1. The Effect of Electric Pulse Frequency

The frequency of the electric pulse affects the probability of fish passing the electric barrier as they swim upstream (Figure 4). The crossing probability of H. nobilis and C. carpio decreased when the pulse frequency was increased at the same water velocity. We attribute the decreased crossing probability to stronger avoidance behavior produced by more frequent transient electric stimulation [20,23]. In this study, deterrence effectiveness was as high as 90%. Although deterrence could potentially be improved by further adjusting pulse parameters, this was not the focus of our study. Our purpose was to determine the effects of electric pulse frequency and water velocity on the electric barrier’s effectiveness.
Our results are consistent with those reported in other studies. Utz et al. (2017) reported that an electrical barrier with a 10 Hz pulse frequency deters adult fathead minnows (Pimephales promelas) and crayfish (Procambarus clarkii) in water with a conductivity range of 13–800 uS/cm [20]. For juvenile Anguilla anguilla migrating upstream, avoidance was positively related to field strength (pulsed direct current: 10 Hz) [27]. In our study, the electric barrier pulsed at 10 Hz resulted in a deterrence rate of ~95% at a water velocity of 0.2 m/s and 50–80% at the higher water velocity of 0.6 m/s.
In this study, at a given pulse width (2 ms), increasing the frequency also increases the duty cycle and thus the energy transferred to the fish. At the lower electric pulse frequencies (4, 6, and 8 Hz), no fish were stunned, and none stopped swimming. However, at the highest pulse frequency (10 Hz), while no fish were stunned, four of the 160 test fish temporarily lost swimming ability. These results indicate mild harm to fish caused by the most effective pulse frequency tested and suggest an upper limit on pulse frequency (i.e., power of the electric barrier). When fish were exposed to pulsed direct current (pulse frequencies > 30 Hz), powerful convulsions of body musculature occurred that sometimes lead to spinal injuries and associated hemorrhages (not externally obvious or fatal) [24]. However, significantly fewer spinal injuries were reported at pulse frequencies ≤ 30 Hz [24]. The maximum frequency of pulsed direct current in this study was 10 Hz, so the harm to fish may be slight, but future experiments should be conducted to more thoroughly assess the harm.

4.2. Effect of Water Velocity

Our results clearly show that water velocity affects electric barrier performance (Figure 5). The crossing probability of both H. nobilis and C. carpio increased at the higher water velocity (0.6 m/s). Electric barriers in low water velocity reaches are generally more effective because fish have more time to respond to the pulsed direct current and escape [23].
Our results are again consistent with the findings of other investigators. Pugh et al. (1970) reported that the electric barrier in the Yakima River (United States) deterred 60–90% of fish at a water velocity of 0.2, but deterrence decreased to 10-60% at a water velocity of 0.5 m/s and to 10–30% at 0.8 m/s [15]. As noted above, this is attributed to the difficulty fish have in quickly stopping and reversing direction in a high-velocity water environment. Forward momentum may carry a fish through the barrier even if they sense the electric pulses. This also explains why swimming ability influences how effectively electric barriers deter fish.
At the lower water velocity (0.2 m/s), the crossing probability was not significantly different between the two species (p = 0.157, HR = 1.333), but at the higher water velocity (0.6 m/s), the difference was significant (p = 0.033, HR = 2.125). Further, H. nobilis consistently displayed a higher crossing probability than C. carpio (Figure 5), which we attribute to the stronger swimming ability of H. nobilis. The literature search conducted in preparation for this investigation revealed that H. nobilis (standard length ~0.5 m) can swim up to ~1.5 m/s [28], whereas C. carpio (standard length ~0.3 m) can swim up to ~0.9 m/s [29]. The maximum water velocity in this study (0.6 m/s) allowed both test fish species to swim upstream, so it was the electric barrier that deterred test fish, and the stronger swimming species was more likely to cross the barrier.

5. Conclusions

Fish were deterred from swimming upstream by an electric barrier, a barrier that can help fish avoid hazardous areas, guide fish along migration routes, and prevent the invasion of foreign fish species. At a given water velocity, the crossing probability decreased as pulse frequency increased, and the decrease was largest when the frequency was increased from 8 Hz to 10 Hz. At a given electric pulse frequency, the crossing probability was higher at the high water velocity, and barrier efficiency was more sensitive to velocity at higher pulse frequencies. Crossing probability increases with fish swimming ability.
Although our experimental results demonstrated effective fish deterrence, we understand that results observed under controlled laboratory conditions may differ from those observed in natural settings. For example, fish size influences the response to electric current [12,13], and only adult individuals with similar biometrics were considered in this study. The uniform flow conditions in the experimental flume are different from the natural variations in the water depth and flow field (turbulence and velocity gradients) of rivers, and the differences will affect crossing probability. Observation of fish behavior under experimental conditions also needs further refinement. Eventually, because deterrence using electric barriers depends on the unique biological characteristics of fish and ever changing environmental conditions, there is motivation and potential to develop smart electrical barrier technology that can provide the optimal combination of deterrence effectiveness, fish health, and cost efficiency.
Although the pulsed direct current was less harmful to the tested fish under certain conditions, the possible effects of pulsed direct current on humans and other faunal groups (e.g., amphibians, aquatic birds, invertebrates) should be evaluated, and some measures to eliminate these effects should be established before using this technique in the field in the future.

Author Contributions

Methodology, S.Z.; Formal analysis, J.L. and L.X.; Investigation, Y.T. and L.L.; Data curation, B.X.; Writing—original draft, W.Y. and L.C.; Writing—review and editing, D.J. and G.Y. All authors have read and agreed to the published version of the manuscript.

Funding

This work was supported by National Key Research and Development Program of China (Grant number: 2022YFE0117400), National Nature Science Foundation of China (Grant number: U2340218), and China Yangtze Power Co., Ltd. (Grant number: Z152202018).

Institutional Review Board Statement

The care and use of experimental animals in this study complied with institutional guidelines and policies of the Institutional Animal Care and Use Committee in Institute of Hydroecology, Ministry of Water Resources and Chinese Academy of Sciences (IHE) (protocol code: 20230047 and approval date: 10 April 2023). And the Institutional Animal Care and Use Committee of IHE approved the testing method in this study.

Informed Consent Statement

Not applicable.

Data Availability Statement

The data supporting the findings of this study are available upon reasonable request. Interested parties can obtain the data by contacting the corresponding author.

Acknowledgments

The authors wish to thank Theodore Castro-Santos (USGS-Leetown Science Center, S.O. Conte Anadromous Fish Research Center), Robert Louis Vadas, Jr. (Washington Department of Fish and Wildlife (WDFW), Habitat Program), and two anonymous reviewers for their comments and suggestions in this paper.

Conflicts of Interest

Authors Wanshuang Yi, Yun Tan, Bo Xu, Jun Li, Lianwei Liu, and Lanlan Xuand were employed by the company China Yangtze Power. Author Shihong Zhu was employed by the company Changjiang Survey, Planning, Design and Research company involved in this research. The remaining authors declare that the research was conducted in the absence of any commercial or financial relationships that could be construed as a potential conflict of interest. The funders had no role in the design of the study; in the collection, analyses, or interpretation of data; in the writing of the manuscript; or in the decision to publish the results.

References

  1. Swink, W.D. Effectiveness of an electrical barrier in blocking a sea lamprey spawning migration on the Jordan River, Michigan. N. Am. J. Fish. Manag. 1999, 19, 397–405. [Google Scholar] [CrossRef]
  2. Kim, J.; Mandrak, N.E. Effects of a vertical electric barrier on the behaviour of rainbow trout. Aquat. Ecosys. Health Manag. 2019, 22, 183–192. [Google Scholar] [CrossRef]
  3. Miehls, S.; Sullivan, P.; Twohey, M.; Barber, J.; McDonald, R. The future of barriers and trapping methods in the sea lamprey (Petromyzon marinus) control program in the Laurentian Great lakes. Rev. Fish Biol. Fish. 2020, 30, 1–24. [Google Scholar] [CrossRef]
  4. Stolbunov, I.A.; Salienko, S.N.; Barkhalov, R.M.; Rabazanov, N.I.; Mammaev, M.A.; Salienko, I.S.; Kuptsov, A.A.; Kulikova, Y.A.; Zabotkina, E.A. Influence of electric fields of a fish protection device on fish of the Dagestan coast of the Caspian Sea. Arid Ecosys. 2024, 14, 540–546. [Google Scholar] [CrossRef]
  5. Johnson, N.S.; Thompson, H.T.; Holbrook, C.; Tix, J.A. Blocking and guiding adult sea lamprey with pulsed direct current from vertical electrodes. Fish. Res. 2014, 150, 38–48. [Google Scholar] [CrossRef]
  6. Haug, J.; Auer, S.; Frees, C.; Brinkmeier, B.; Tutzer, R.; Hayes, D.S.; Aufleger, M. Retrofitting of existing bar racks with electrodes for fish protection—An experimental study assessing the effectiveness for a pilot site. Water 2022, 14, 850. [Google Scholar] [CrossRef]
  7. Clarkson, R.W. Effectiveness of electrical fish barriers associated with the Central Arizona Project. N. Am. J. Fish. Manag. 2004, 24, 94–105. [Google Scholar] [CrossRef]
  8. Conover, G.; Simmonds, R.; Whalen, M. Management and Control Plan for Bighead, Black, Grass, and Silver Carps in the United States; Asian Carp Working Group, Aquatic Nuisance Species Task Force: Washington, DC, USA, 2007; 223p.
  9. Bajer, P.G.; Hundt, P.J.; Kukulski, E.; Kocian, M. Field test of an electric deterrence and guidance system during a natural spawning migration of invasive common carp. Manag. Biol. Invas. 2022, 13, 204–219. [Google Scholar] [CrossRef]
  10. Bullen, C.R.; Carlson, T.J. Non-physical fish barrier systems: Their development and potential applications to marine ranching. Rev. Fish Biol. Fish. 2003, 13, 201–212. [Google Scholar] [CrossRef]
  11. Bajer, P.; Claus, A.; Wein, J.; Kukulski, E. Field test of a low voltage, portable electric barrier to guide invasive common carp into a mock trap during seasonal migrations. Manag. Biol. Inva. 2018, 9, 291–297. [Google Scholar] [CrossRef]
  12. Dolan, C.R.; Miranda, L.E. Immobilization thresholds of electrofishing relative to fish size. Trans. Am. Fish. Soc. 2003, 132, 969–976. [Google Scholar] [CrossRef]
  13. Noatch, M.R.; Suski, C.D. Non-physical barriers to deter fish movements. Environ. Rev. 2012, 20, 71–82. [Google Scholar] [CrossRef]
  14. Layhee, M.J.; Sepulveda, A.J.; Shaw, A.; Smuckall, M.; Kapperman, K.; Reyes, A. Effects of electric barrier on passage and physical condition of juvenile and adult rainbow trout. J. Fish Wildl. Manag. 2016, 7, 28–35. [Google Scholar] [CrossRef]
  15. Pugh, J.R.; Monan, G.E.; Smith, J.R. Effect of water velocity on the fish guiding efficiency of an electrical guiding system. Fish. Bull. 1970, 68, 307–324. [Google Scholar]
  16. Borkholder, B.D.; Parsons, B.G. Relationship between electrofishing catch rates of age-0 walleyes and water temperature in Minnesota lakes. N. Am. J. Fish. Manag. 2001, 21, 318–325. [Google Scholar] [CrossRef]
  17. Johnson, N.S.; Miehls, S. Guiding out-migrating juvenile sea lamprey (Petromyzon Marinus) with pulsed direct current. River Res. Appl. 2014, 30, 1146–1156. [Google Scholar] [CrossRef]
  18. Parasiewicz, P.; Wisniewolski, W.; Mokwa, M.; Ziola, S.; Prus, P.; Godlewska, M. A low-voltage electric fish guidance system-NEPTUN. Fish. Res. 2016, 181, 25–33. [Google Scholar]
  19. Parker, A.D.; Glover, D.C.; Finney, S.T.; Rogers, P.B.; Stewart, J.G.; Simmonds, R.L. Fish distribution, abundance, and behavioral interactions within a large electric dispersal barrier designed to prevent Asian carp movement. Can. J. Fish. Aquat. Sci. 2016, 73, 1060–1071. [Google Scholar] [CrossRef]
  20. Utz, R.M.; Cooper, S.D.; Gido, K.B.; Stewart, J.R. Exclusion of fish and invertebrates from benthic patches of artificial aquatic environments across water conductivity levels using high-frequency (10 Hz) pulses and adjustable electrical settings. Freshw. Sci. 2017, 36, 151–161. [Google Scholar] [CrossRef]
  21. Soetaert, M.; Boute, P.G.; Beaumont, W.R.C. Guidelines for defining the use of electricity in marine electrotrawling. ICES J. Mar. Sci. 2019, 76, 1994–2007. [Google Scholar] [CrossRef]
  22. Moldenhauer-Roth, A.; Selz, O.M.; Albayrak, I.; Boes, R.M. Behavioural response of chub, barbel and brown trout to pulsed direct current electric fields. J. Ecohydraul. 2025, 10, 249–264. [Google Scholar] [CrossRef]
  23. Bai, Y.; Huang, X.; Xie, L.; Liu, G.; Hou, Y.; Li, W.; Zhang, Z.; Shi, X. Experimentally determined effectiveness of different electric barrier arrangements on the behavioural deterrent of silver carp (Hypophthalmichthys molitrix). Appl. Anim. Behav. Sc. 2024, 271, 106172. [Google Scholar] [CrossRef]
  24. Snyder, D.E. Invited overview: Conclusions from a review of electrofishing and its harmful effects on fish. Rev. Fish Biol. Fish. 2003, 13, 445–453. [Google Scholar] [CrossRef]
  25. Castro-Santos, T.; Shi, X.; Haro, A. Migratory behavior of adult sea lamprey and cumulative passage performance through four fishways. Can. J. Fish. Aquat. Sci. 2017, 74, 790–800. [Google Scholar] [CrossRef]
  26. Cai, L.; Chen, J.; Johnson, D.; Tu, Z.; Huang, Y. Effect of body length on swimming capability and vertical slot fishway design. Glob. Ecol. Conserv. 2020, 22, e00990. [Google Scholar] [CrossRef]
  27. Miller, M.; Sharkh, S.M.; Kemp, P.S. Response of upstream migrating juvenile European eel (Anguilla anguilla) to electric fields: Application of the marginal gains concept to fish screening. PLoS ONE 2022, 17, e0270573. [Google Scholar] [CrossRef]
  28. Hoover, J.J.; Zielinski, D.P.; Sorensen, P.W. Swimming performance of adult bighead carp Hypophthalmichthys nobilis (Richardson, 1845) and silver carp H. molitrix (Valenciennes, 1844). J. Appl. Ichthyol. 2017, 33, 54–62. [Google Scholar] [CrossRef]
  29. Tudorache, C.; Viaenen, P.; Blust, R.; DeBoeck, G. Longer flumes increase critical swimming speeds by increasing burst-glide swimming duration in carp Cyprinus carpio, L.J. Fish Biol. 2007, 71, 1630–1638. [Google Scholar] [CrossRef]
Figure 1. Experimental flume apparatus.
Fishes 10 00510 g001
Figure 2. Swimming chamber with vertical electrodes (top view).
Fishes 10 00510 g002
Figure 3. Schematic representation of pulsed square wave direct-current treatments. The indicated waveform parameters are pulse width (PW), break time (PB), and period time (T).
Fishes 10 00510 g003
Figure 4. The relationship between cumulative crossing probability and pulse frequency for both species at low and high flow velocities. The probabilities (P) used in Equations (1) and (2) are indicated in the figure.
Fishes 10 00510 g004
Figure 5. The relationship between cumulative crossing probability and pulse frequency for both species at low and high flow velocities. The pulsed direct-current output from the electric pulse generator to the swimming flume is square wave, 150 V with a pulse width of 2 ms.
Fishes 10 00510 g005
Table 1. The average fish size (all fish are adults) in each treatment (n = 10), percentage of fish that were stunned, percentage of those that trembled for more than 2 s, and the percentage of those that crossed the barrier.
Test NumberElectric Pulse FrequencyWater VelocitySpeciesStandard Length, mTotal Length, mWeight, kgPercentage (Total Sample = 10)
StunnedTrembled >2 sCrossed the Barrier
14 Hz0.2 m/sH. nobilis0.498 ± 0.0240.588 ± 0.0292.160 ± 0.2880090%
26 Hz0.2 m/sH. nobilis0.512 ± 0.0150.610 ± 0.0232.385 ± 0.1990070%
38 Hz0.2 m/sH. nobilis0.494 ± 0.0200.583 ± 0.0282.085 ± 0.1940020%
410 Hz0.2 m/sH. nobilis0.505 ± 0.0190.596 ± 0.0222.100 ± 0.227020%10%
54 Hz0.6 m/sH. nobilis0.500 ± 0.0190.603 ± 0.0272.180 ± 0.25500100%
66 Hz0.6 m/sH. nobilis0.498 ± 0.0190.594 ± 0.0272.065 ± 0.1830090%
78 Hz0.6 m/sH. nobilis0.487 ± 0.0180.575 ± 0.0262.070 ± 0.2300070%
810 Hz0.6 m/sH. nobilis0.494 ± 0.0210.582 ± 0.0282.090 ± 0.2020060%
94 Hz0.2 m/sC. carpio0.315 ± 0.0120.381 ± 0.0150.653 ± 0.0630060%
106 Hz0.2 m/sC. carpio0.309 ± 0.0140.369 ± 0.0140.624 ± 0.0670040%
118 Hz0.2 m/sC. carpio0.317 ± 0.0090.380 ± 0.0060.653 ± 0.0580010%
1210 Hz0.2 m/sC. carpio0.324 ± 0.0090.395 ± 0.0110.682 ± 0.051010%10%
134 Hz0.6 m/sC. carpio0.319 ± 0.0090.389 ± 0.0140.643 ± 0.0620070%
146 Hz0.6 m/sC. carpio0.320 ± 0.0100.392 ± 0.0240.673 ± 0.0470070%
158 Hz0.6 m/sC. carpio0.319 ± 0.0110.397 ± 0.0170.666 ± 0.0520060%
1610 Hz0.6 m/sC. carpio0.322 ± 0.0070.400 ± 0.0210.671 ± 0.028010%30%
Table 2. Sensitivity coefficient of pulse frequency (SCpf) for crossing probability.
SpeciesWater VelocitySCpf
Frequency Increase from 4 Hz to 6 HzFrequency Increase from 6 Hz to 8 HzFrequency Increase from 8 Hz to 10 Hz
H. nobilis0.2 m/s1.111.679.94
H. nobilis0.6 m/s1.031.181.67
C. carpio0.2 m/s1.251.829.90
C. carpio0.6 m/s1.111.253.33
Table 3. Sensitivity coefficient of water velocity (SCfv) for crossing probability.
SpeciesElectric Stimulation FrequencySCfv
(Velocity Increased from 0.2 m/s to 0.6 m/s)
H. nobilis4 Hz1.03
H. nobilis6 Hz1.10
H. nobilis8 Hz1.56
H. nobilis10 Hz9.30
C. carpio4 Hz1.03
C. carpio6 Hz1.16
C. carpio8 Hz1.68
C. carpio10 Hz5.00
Disclaimer/Publisher’s Note: The statements, opinions and data contained in all publications are solely those of the individual author(s) and contributor(s) and not of MDPI and/or the editor(s). MDPI and/or the editor(s) disclaim responsibility for any injury to people or property resulting from any ideas, methods, instructions or products referred to in the content.