Article

Aspects of Biology and Machine Learning for Age Prediction in the Large-Eye Dentex Dentex macrophthalmus (Bloch, 1791)

by
Dimitris Klaoudatos
1,*,
Alexandros Theocharis
1,2,
Chrysoula Vardaki
1,
Elpida Pachi
1,
Dimitris Politikos
3 and
Alexis Conides
4
1
Department of Ichthyology and Aquatic Environment (DIAE), School of Agricultural Sciences, University of Thessaly (UTh), Fytokou Street, 38446 Volos, Greece
2
National Institute of Aquatic Resources, Technical University of Denmark, North Sea Science Park, 9850 Hirtshals, Denmark
3
Department of Informatics and Telematics, Harokopio University of Athens, Omirou 9, Tavros, 17778 Athens, Greece
4
Institute of Marine Biological Resources & Inland Waters, Hellenic Centre for Marine Research, 19013 Attika, Greece
*
Author to whom correspondence should be addressed.
Fishes 2025, 10(10), 500; https://doi.org/10.3390/fishes10100500
Submission received: 1 September 2025 / Revised: 30 September 2025 / Accepted: 3 October 2025 / Published: 6 October 2025
(This article belongs to the Section Biology and Ecology)

Abstract

The large-eye dentex (Dentex macrophthalmus) is a relatively small sparid fish with increasing potential as a supplementary fishery resource in the Mediterranean Sea, particularly as traditional stocks face overexploitation. Despite its widespread distribution, biological data on this species, especially from Greek waters, remain scarce. This study presents the first comprehensive biological assessment of D. macrophthalmus in the Pagasitikos Gulf, focusing on population structure, growth, mortality, and the application of machine learning (ML) for age prediction. A total of 305 individuals were collected, revealing a female-biased sex ratio and negative allometric growth in both somatic and otolith dimensions. The von Bertalanffy growth parameters indicated a slow growth rate (k = 0.16 year−1), with an estimated asymptotic length (L∞) of 25.97 cm. The population was found to be underexploited (E = 0.41), suggesting resilience to current fishing pressure. Stepwise regression and ML models were employed to predict age from otolith morphometrics. A linear model identified otolith weight and aspect ratio as the most significant predictors of age (R2 = 0.8). Among the ML algorithms tested, the Neural Network model achieved the highest performance (R2 = 0.764, MAPE = 14.10%), demonstrating its potential for accurate and efficient age estimation. These findings provide crucial baseline data for the sustainable management of D. macrophthalmus and highlight the value of integrating advanced ML techniques into fisheries biology.
Key Contribution: This study provides the first detailed biological assessment of D. macrophthalmus in Greek waters, filling a significant knowledge gap for this underutilized species in a core part of its Mediterranean habitat. The key contribution is twofold: (1) It establishes comprehensive baseline data on the population structure, growth, and exploitation status of D. macrophthalmus in the Pagasitikos Gulf, revealing an underexploited population with slow growth, which supports its potential as a sustainable supplementary fishery resource. (2) It successfully develops and validates a highly accurate machine learning framework, with a Neural Network model outperforming other algorithms, for predicting fish age from otolith morphometric characteristics, offering a powerful, objective, and efficient tool for future stock assessments.

1. Introduction

Global fisheries are facing unprecedented pressure, with the proportion of assessed fish stocks classified as overfished rising from just 10% in 1974 to 37.7% in 2021 [1]. This accelerating trend threatens both biodiversity and ecosystem functioning, as overfishing exerts profound impacts across benthic and pelagic environments [2,3]. While certain artisanal gears are designed to selectively target specific species [4,5,6], many industrial practices, such as bottom trawling, are inherently destructive, indiscriminately capturing non-target organisms and causing extensive mechanical damage to benthic habitats [7,8,9]. These cumulative pressures have driven widespread declines in benthic teleost populations, particularly among invertivores and apex predators, resulting in significant reductions in both species abundance and mean body size [10,11]. Such shifts not only disrupt trophic dynamics but also compromise the resilience and productivity of marine ecosystems, such as the Mediterranean Sea [12,13,14].
The Mediterranean Sea is widely recognized as a hotspot of marine biodiversity, harboring at least 17,000 distinct taxa, which underscores its ecological significance and the complexity of its marine ecosystems [15]. Fisheries in the region are notably diverse, both in terms of target species and fishing techniques [16,17]. Most fleets operate close to their home ports, employing a variety of gears that allow for the simultaneous exploitation of multiple species; however, certain vessels, particularly trawlers, purse seiners, and surface longliners, focus on single target species and often travel to more distant fishing grounds to maximize their catch efficiency [18,19,20,21]. Historically, total fish landings in the Mediterranean peaked at approximately 1,100,000 tons in 1994, followed by a steady decline to around 790,000 tons in 2018. This downward trend has been particularly marked in EU waters, whereas some non-EU countries have experienced continued increases in their landings [22].
In this context, Mediterranean fisheries face persistent challenges, including high levels of fishing effort relative to available resources, frequent capture of undersized individuals, and significant rates of discarding non-commercial or low-value catches [23]. Between 1970 and 2010, the composition of exploited stocks shifted noticeably: the proportion of developing or fully exploited stocks declined by 18–24% per decade, while the prevalence of overexploited and collapsed stocks increased by 14–18% per decade [20]. Given this combination of exceptional biodiversity and intense fishing pressure, there is growing scientific interest in exploring underutilized and non-commercial species as potential supplementary resources. Evaluating such species could provide opportunities to diversify catches, reduce pressure on overexploited stocks, and support the sustainable development of Mediterranean fisheries [24,25,26,27,28,29,30]. Research in this area highlights not only the potential economic benefits but also the ecological advantages of integrating alternative species into fisheries management strategies, offering a promising pathway toward balancing exploitation with conservation.
The family Sparidae, commonly known as porgies or seabreams, comprises many species distributed across tropical and temperate waters worldwide, with high diversity and ecological importance in the Mediterranean Sea and adjacent Atlantic waters [31,32]. Sparids exhibit remarkable variability in life-history strategies, feeding ecology, and habitat preferences, occupying niches ranging from shallow coastal areas to deep offshore environments [33]. Many species are demersal, displaying strong associations with sandy or rocky substrates, and are characterized by their powerful jaws and molariform teeth, which enable them to exploit a wide variety of prey including mollusks, crustaceans, and small fish [34,35,36]. Due to their high commercial value and widespread exploitation, several sparid stocks have experienced notable declines, raising concerns about population sustainability and ecosystem impacts [37,38,39,40,41].
Among the Sparidae, one species of particular interest is D. macrophthalmus, which is a relatively small-sized sparid with a widespread distribution in the eastern Atlantic Ocean, from Portugal to Angola, and throughout the Mediterranean Sea [42,43,44]. Despite being historically considered of limited commercial interest in Greek waters, D. macrophthalmus has gained increasing attention in recent years due to the depletion of traditionally targeted species and the rising demand for underutilized fish resources [45,46,47]. However, biological knowledge of the species remains limited, particularly regarding its growth patterns, longevity, and population dynamics, information that is essential for effective management. Only a handful of studies have investigated this species across the entire Mediterranean, and, to date, no study has focused on populations in Greek waters, leaving a significant knowledge gap in one of its core habitats. Given its ecological role as a mid-trophic predator and its close phylogenetic and ecological relationships with other commercially important Sparidae, D. macrophthalmus represents a promising candidate for future exploitation [42,43,48,49,50]. Detailed investigations on age estimation and growth parameters are therefore crucial, both for understanding its population structure and for informing sustainable exploitation strategies that could complement existing fisheries targeting related species.

2. Materials and Methods

2.1. Study Area and Sampling Methodology

A total of 305 specimens of Dentex macrophthalmus were collected in the Pagasitikos Gulf, Central Aegean Sea (Eastern Mediterranean), using a commercial trawl fitted with a 28 mm (bar length) stretched square mesh. Sampling was carried out through three independent surveys over two consecutive days in May 2024, employing a commercial bottom otter trawl at depths between 62 and 97 m. The vessel maintained a trawling speed of about 3 knots, and 18 hauls of 20 min each were performed across the eastern, western, and central sections of the gulf (Figure 1).
For each fish, measurements of total length (cm) and total weight (g, to the nearest 0.01 g) were taken. Sampling followed a stratified random design, with the gulf divided into three zones: west, center, and east. Within each zone, specimens were randomly selected to guarantee equal sampling probability across all locations, thereby reducing bias and enhancing the representativeness of the dataset.

2.2. Otolith Extraction Morphometry and Age Classification

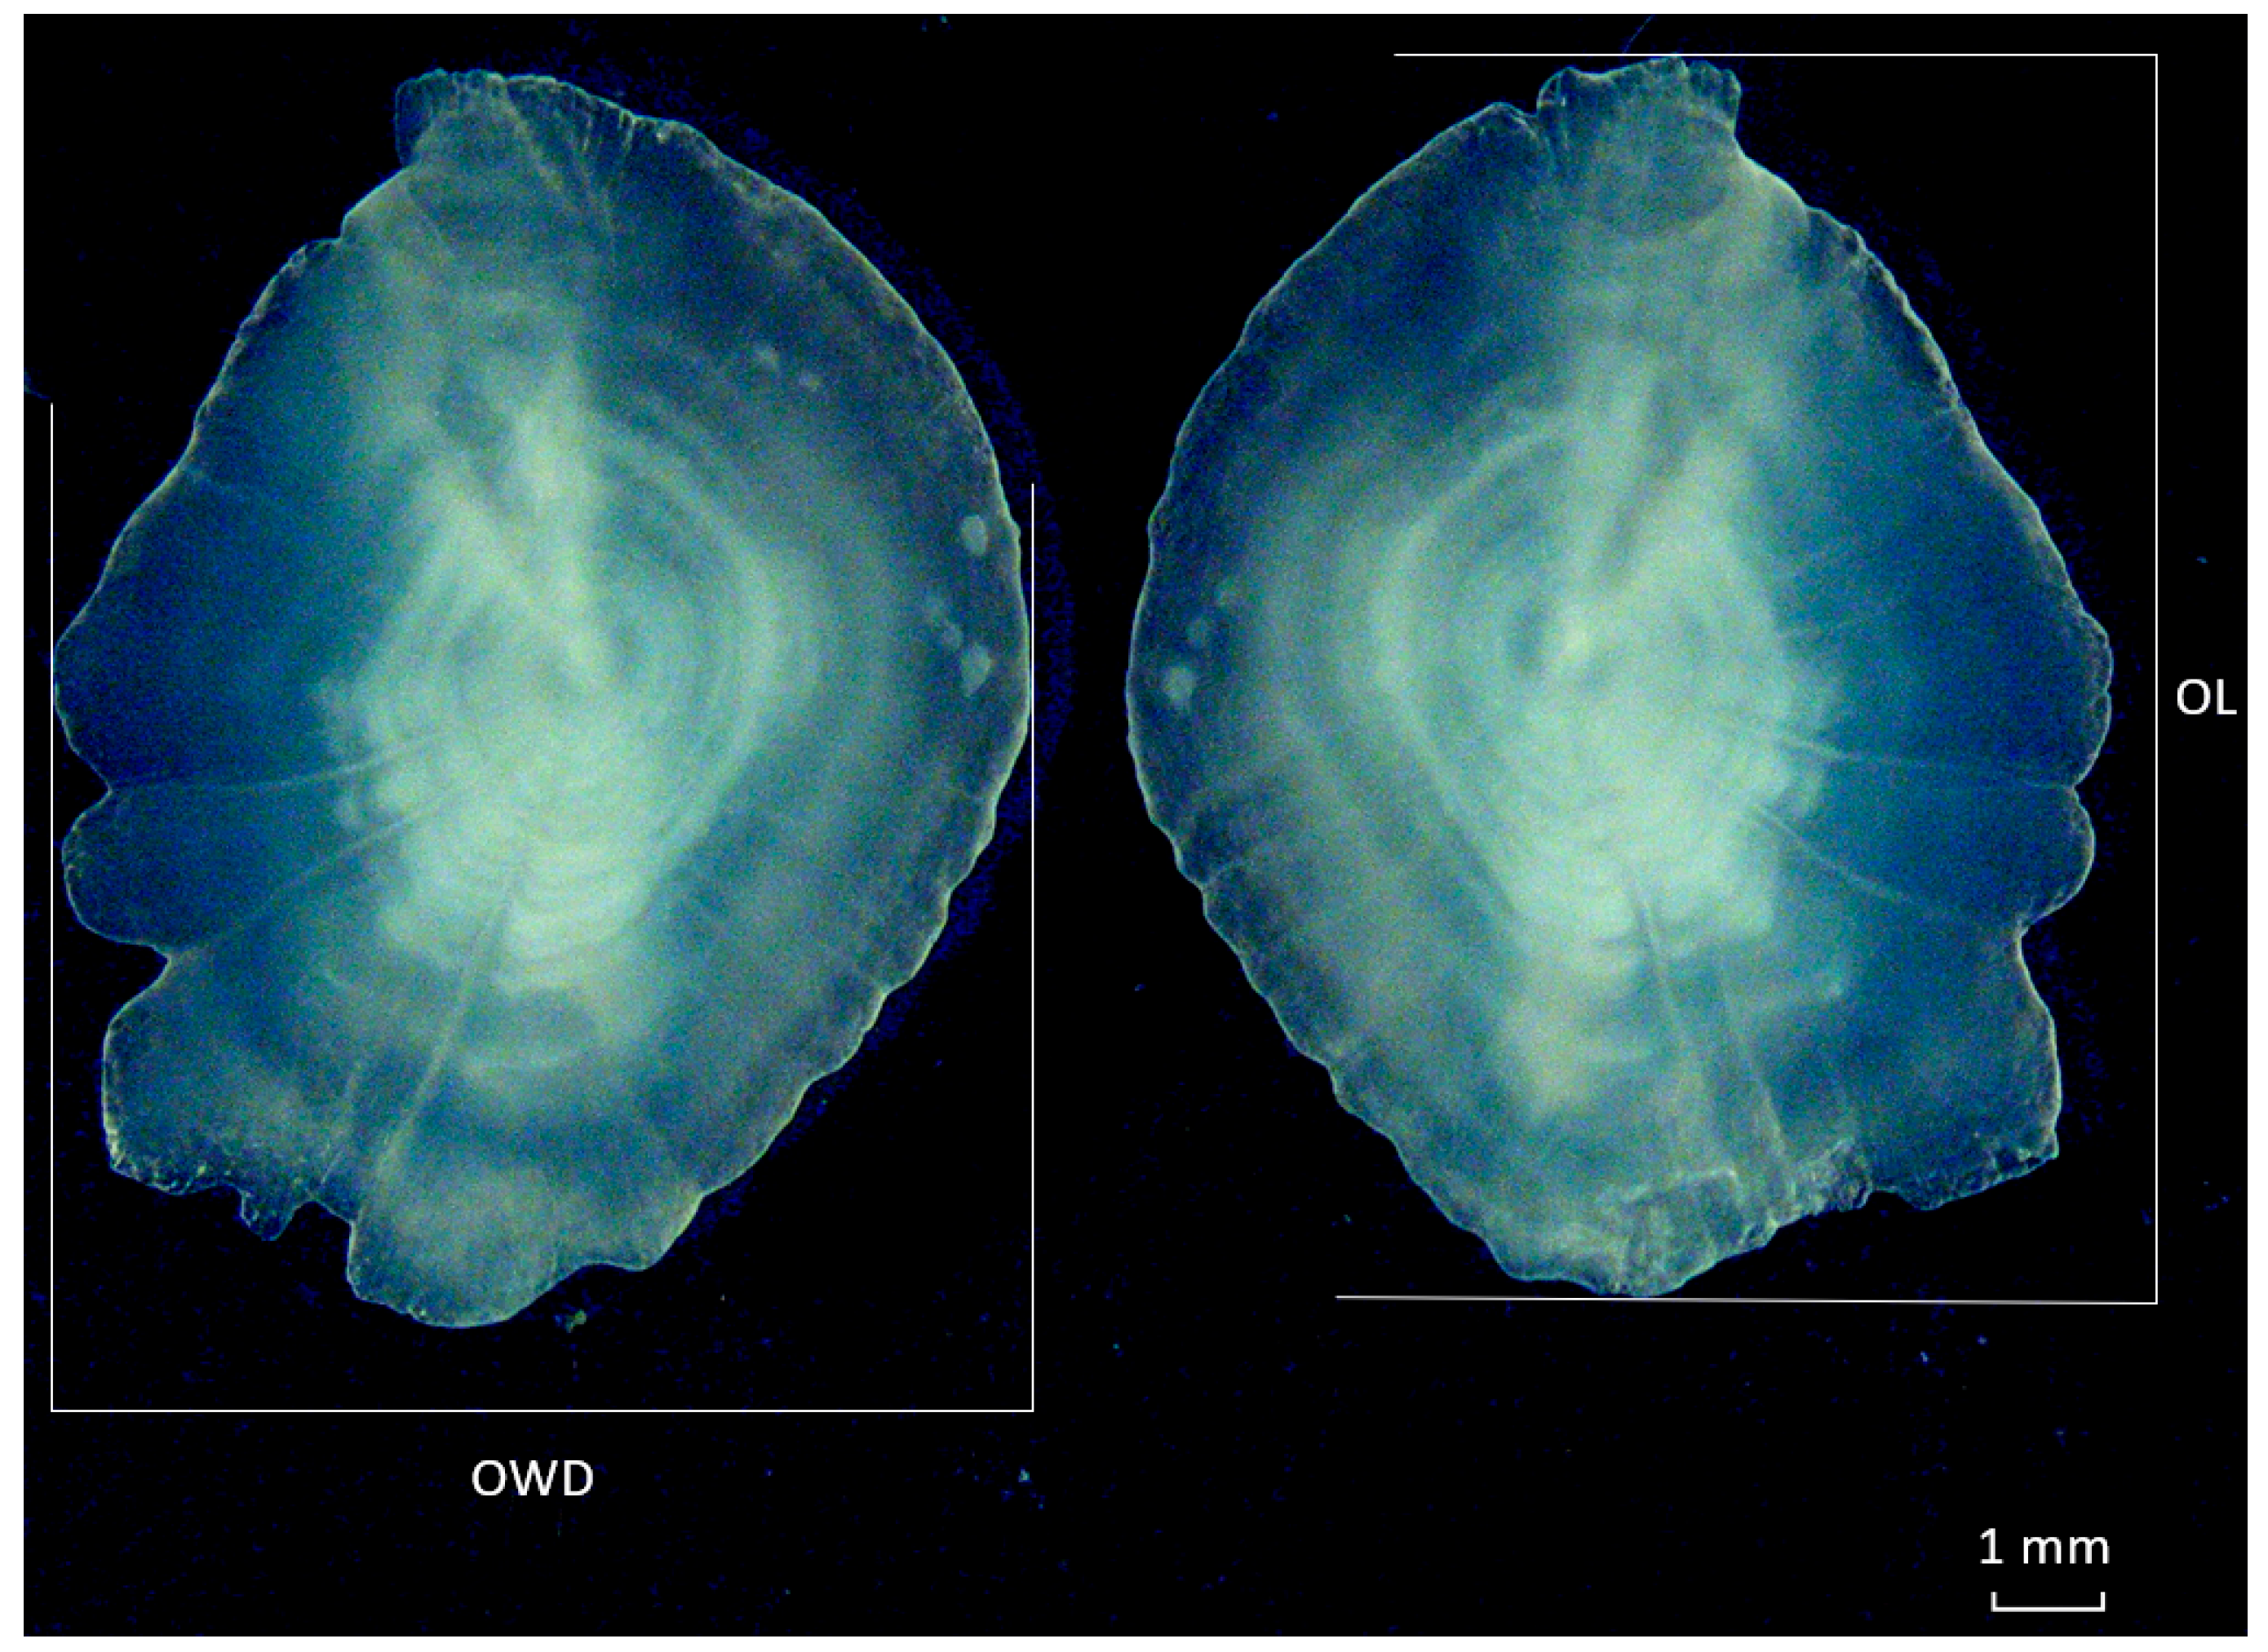
Altogether, 305 pairs of sagittal otoliths were extracted by locating the otic capsule in the retroventral section of the neurocranium. A small incision was made in the middle of the capsule, which was then carefully opened to expose the otoliths. Once removed, the otoliths were rinsed with distilled water to remove any tissue residue. Morphometric analyses were carried out on all samples. Otolith weight (OW) was measured with a Shimadzu ATX124R digital balance (Kyoto, Japan) with an accuracy of 0.0001 g. Each otolith was observed under a stereomicroscope (OLYMPUS, U-TV0.5XC-3, 7H01028, Tokyo, Japan), and digital images were used to measure additional features, including otolith length (OL), otolith width (OWD), otolith perimeter (OP), and otolith area (OA) with ImageJ software, version 1.54 (Philadelphia, PA, USA) (Figure 2).
For age determination, only the left sagittal otoliths were analyzed, since no significant morphometric differences were detected between left and right sides. To improve the visibility and contrast of growth increments, the otoliths were placed in a glass Petri dish with a thin film of glycerol and examined under a stereomicroscope using transmitted light against a dark background. Under these conditions, the annual growth zones were identified as follows: the opaque zone appeared as a white or light-colored band due to the scattering of light, while the translucent zone appeared as a dark or hyaline band. The intersection between the outermost opaque zone and the subsequent translucent zone was defined as the annulus, marking the completion of an annual growth cycle. Most otoliths exhibited hyaline (translucent) edges, consistent with the expected post-winter growth pattern in temperate sparids, where translucent zones typically form during periods of reduced somatic growth in colder months [42,43]. It should be noted that the assumption of annual deposition of opaque–translucent band pairs was not directly validated in this study through methods such as chemical marking, tag-recapture, or year-round marginal increment analysis. Instead, our interpretation relied on indirect evidence from the timing of sampling and the observed edge-type composition. While this monthly edge-type pattern supports but does not prove annual periodicity, it aligns with established otolith deposition dynamics for congeneric species in the Mediterranean.
Three readers independently performed the age readings. Digital images were captured using ImageJ (Ver. 1.54; Philadelphia, PA, USA) for measurement, and no additional enhancement programs or filters were applied to alter the original contrast. A further seven dimension indices were also calculated: rectangularity (R), squareness (S), ellipticity (E), roundness (RO), aspect ratio (AR), form factor (F), and circularity (C) (Table 1).
The age reading was performed according to the methodology by Carbonara et al. [55]. The age used for model estimation was the mean value from all three readers [56]. To quantify the consistency and reliability of age estimates from the three readers, percent agreement, Index of Average Percentage Error (IAPE) (Equation (1)) was employed [56,57,58].
I A P E = 100 N   i = 1 N X i X ¯ X ¯
where
N = Number of samples
X i = Age estimate from an individual reader
X ¯ = Mean age from all readers for that sample
Chang’s coefficient of variation (CV) (Equation (2)) was further employed to test the reproducibility of the age determination [57]:
C V =   i = 1 N ( X i X ¯ ) 2 N 1   ×   1 X ¯   × 100
where
X i = Age estimate from an individual reader
X ¯ = Mean age from all readers for that sample
N = Number of readers
The presence of systematic bias between reader pairs was assessed using Bowker’s test of symmetry [59], which can detect directional discrepancies in age classification using a chi-squared statistic.
Inter-reader agreement was assessed using percentage agreement and Cohen’s kappa statistic [60]. Kappa values were interpreted according to the benchmarks proposed by Landis and Koch [61], where <0.20 indicates poor agreement, 0.21–0.40 fair, 0.41–0.60 moderate, 0.61–0.80 substantial, and 0.81–1.00 near-perfect agreement.

2.3. Statistical Analysis

Exploratory data analysis (EDA) was conducted to characterize the length distribution of large-eye dentex, following established methods [62]. Additionally, statistical analysis was conducted to compare length and weight between male and female individuals, as well as to examine morphometric differences between left and right sagittal otoliths and between sexes. Depending on data characteristics, Student’s t-test and Welch’s test [63,64] were used for parametric comparisons, while the Mann–Whitney U test [63] was applied when non-parametric analysis was required. All analysis was performed using Jamovi software (Ver. 2.7.5, Sydney, Australia) [65], with a significance threshold set at 0.05. Prior to testing, normality was assessed using the Shapiro–Wilk test, and homogeneity of variances was verified with Levene’s and Variance ratio tests to confirm that the assumptions for each statistical test were satisfied. The Pearson correlation coefficient (PCC) was employed to measure the strength of the association between all biometric characters measured [63]. The chi-square goodness-of-fit test was used to evaluate the null hypothesis of equal proportions in the male-to-female ratio and to compare our results with the published literature [66].
The length vs. weight and otolith length vs. otolith weight relationships were determined independently for males and females, and for the total population (sex-combined) by fitting the exponential curve to the data according to Munro & Pauly [67] (Equation (3)).
W = a × L b
where L is total length (cm), W is total weight (g), “a” is the intercept (growth factor), and “b” is the slope of the relationship (allometry coefficient).
To statistically compare relationships between sexes, an ANCOVA was performed on log-transformed data, testing for differences in slopes (exponent b) and intercepts (coefficient a) [68]. Allometric growth (significant deviation from isometry, (H0 > b = 3) was assessed via t-tests. The exponential curve was further employed to identify otolith morphometric relationships and their allometric status.
Key factors influencing age estimation were identified by performing a second-degree stepwise regression analysis, with the procedure guided by the minimum Bayesian Information Criterion (BIC) as the selection criterion and implementing a forward selection approach. Variables were deemed significant if p < 0.05. To assess multicollinearity among predictors, the Variance Inflation Factor (VIF) was calculated, considering values below five (5) as acceptable [69]. In addition, Pearson correlation coefficients were used to evaluate potential correlations between different measured variables.
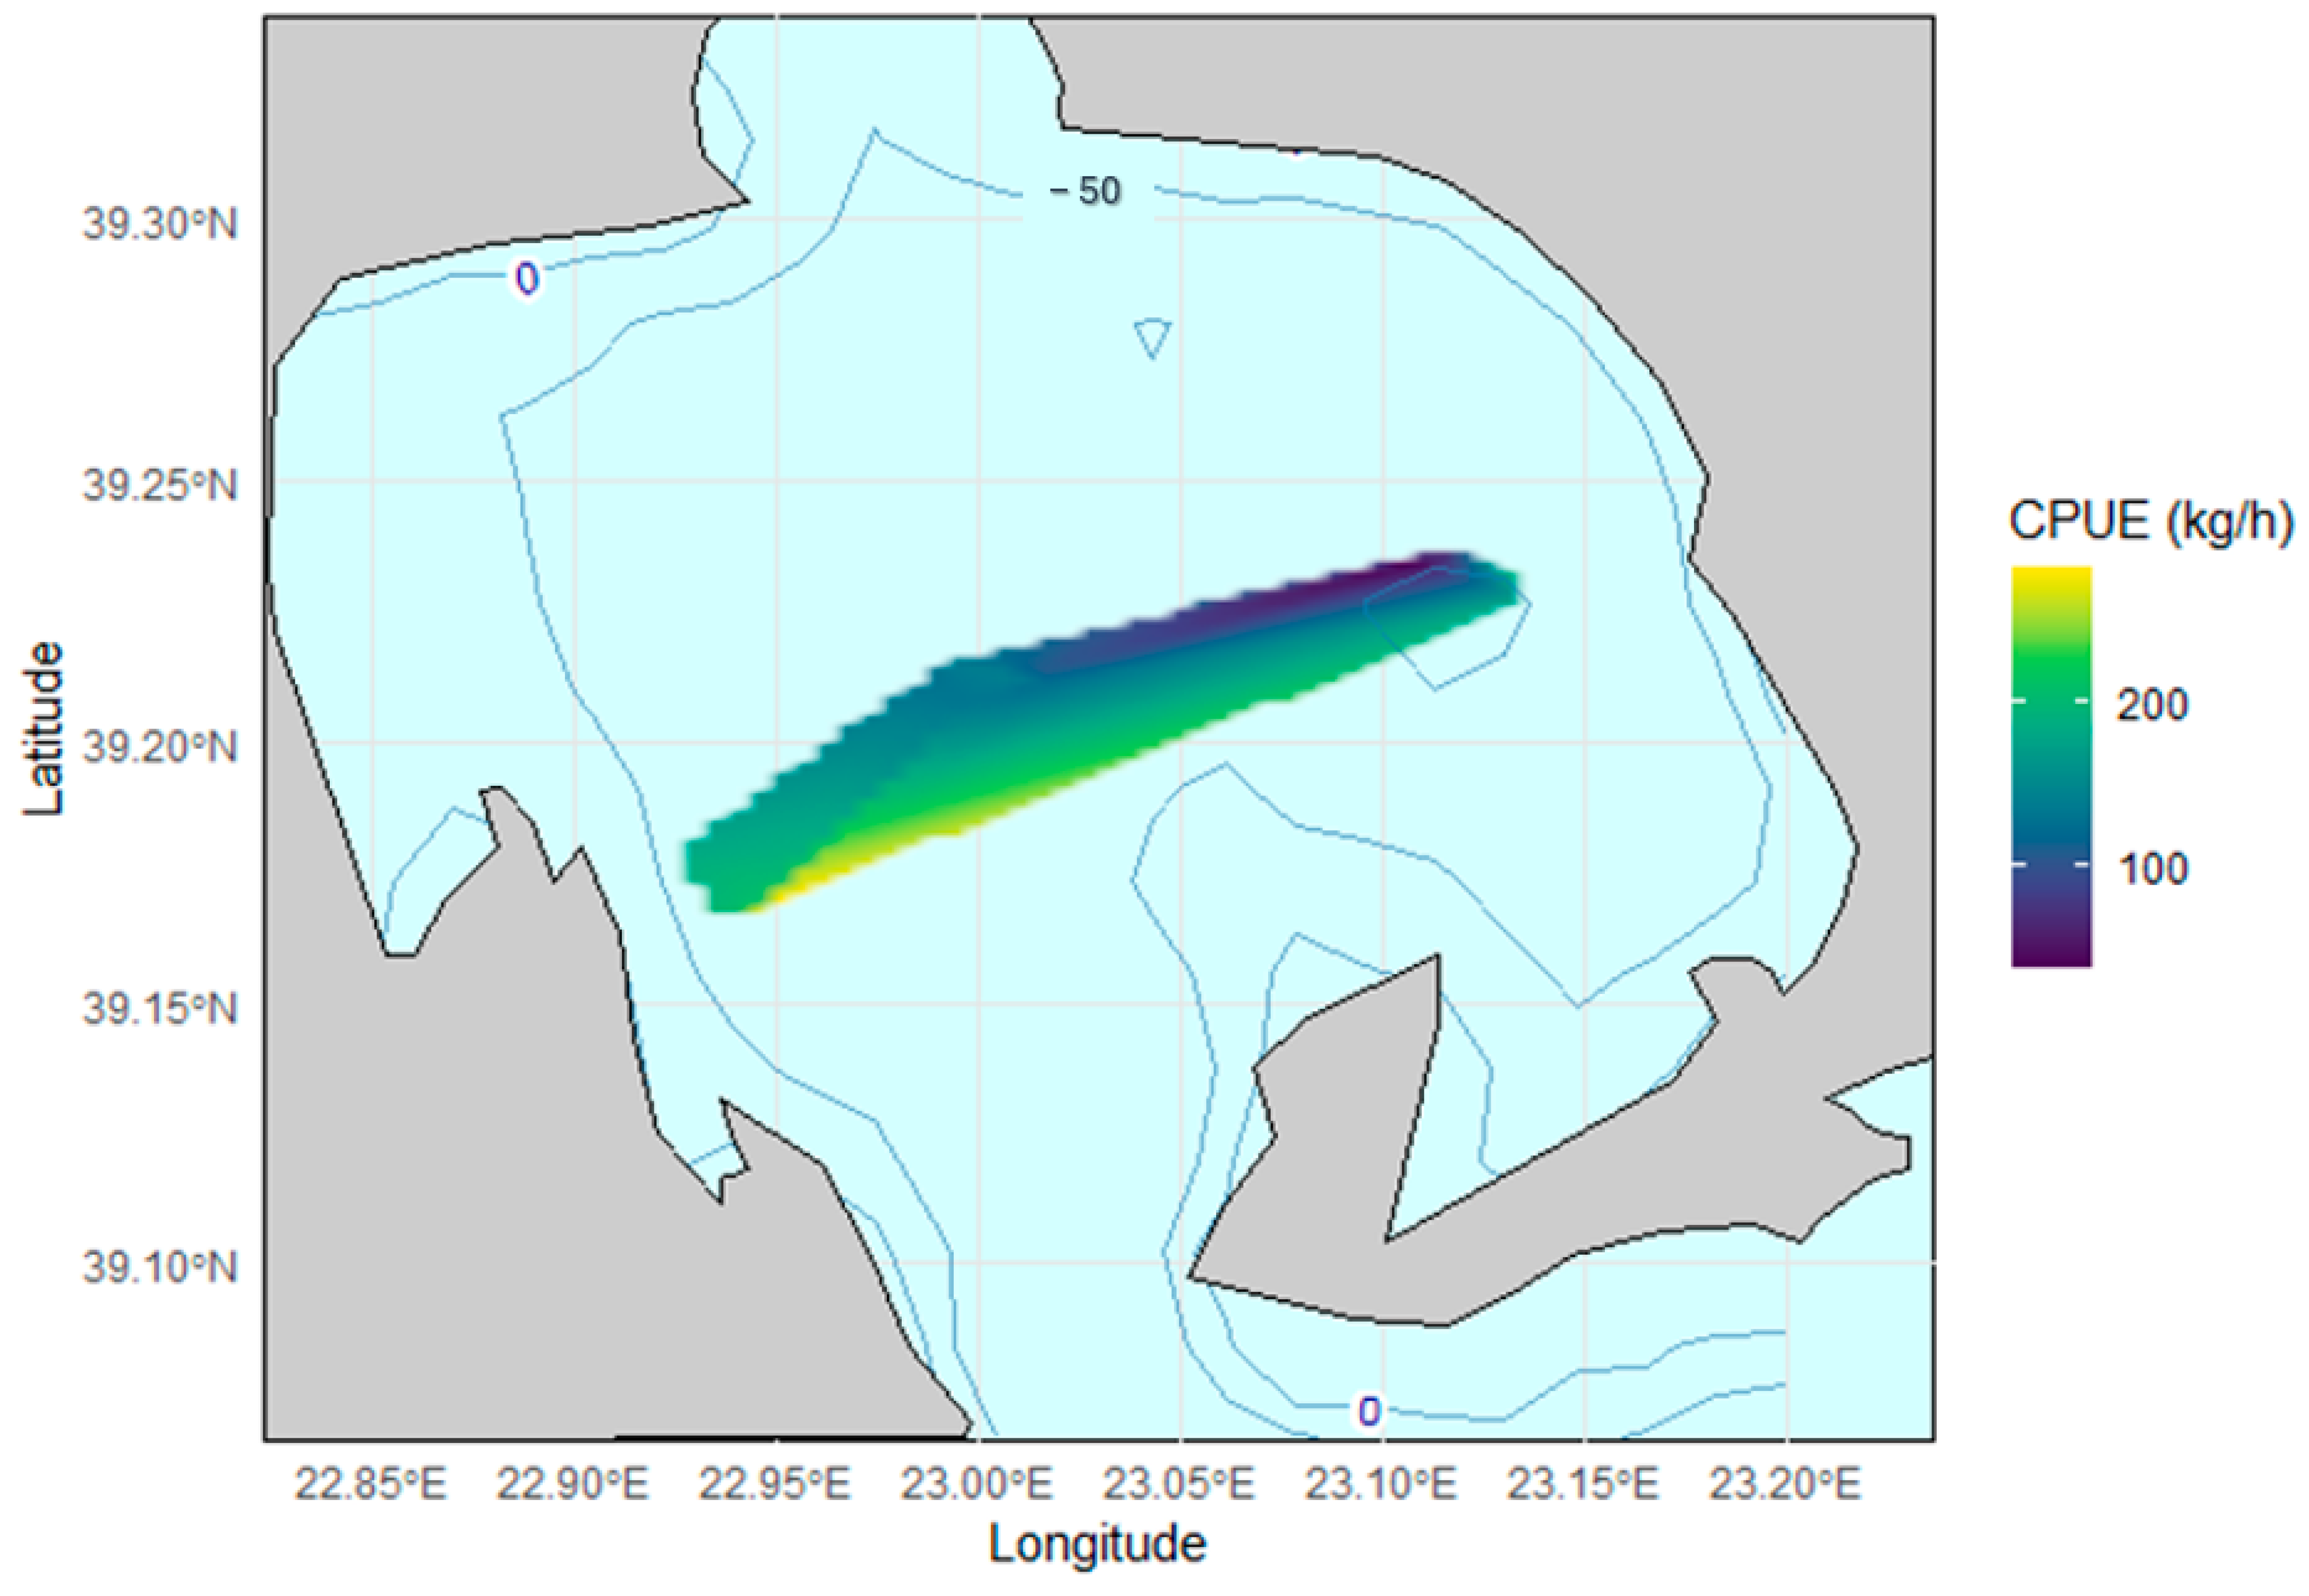
Spatial analysis was conducted in R (Ver. 4.5.1; R Core Team, 2023) utilizing well-known geostatistical visualization packages [70,71]. Bathymetric data were obtained from NOAA’s ETOPO1 global model [72], with coastline vectors sourced from Natural Earth [73]. CPUE interpolation was conducted using Akima’s spline method [74], with contour labeling facilitated with the metR package [75]. The interpolated data were transformed into a data frame for visualization using the ggplot2 package [76]. A high-resolution heatmap was created to display spatial gradients in CPUE, adhering to established fishery data visualization methods [77].

2.4. Age Composition, Growth, Mortality and Exploitation Rate

Growth parameters were calculated using the von Bertalanffy growth equation [78] (Equation (4)), which models fish length as a function of age.
L t = L × 1 e k × t t 0
where L∞ is the asymptotic length, k is the growth rate, and t0 is the theoretical age at zero length.
To determine whether significant differences exist in growth patterns between sexes and identify sexual dimorphism in growth, we employed a likelihood ratio test to compare overall model fit between separate and common parameter models, and Wald tests to examine differences in individual von Bertalanffy parameters (L∞, k, t0) [79,80].
The growth performance index (φ′) (in length) was estimated using the von Bertalanffy parameters [67] (Equation (5)).
φ = l o g k + 2 × l o g L
The length converted catch curve [81] was employed to estimate Total mortality (Z).
Natural mortality (M) was calculated using and Paulynls-T estimator (Equation (6)) according to Then et al. [82].
M = 4.118 K 0.73 × L i n f 0.33
The annual fishing mortality rate (F) was obtained by subtracting Μ from Z, according to Sparre et al. [83] (Equation (7)).
F = Z M
The exploitation rate (E), a measure of the number of fish that are caught from a population each year, was calculated as the ratio of F to Z [81] (Equation (8)).
E = F / Z  
The length class with the highest biomass (Le) (eumetric length) was calculated according to Froese & Bonhlan; Hoggarth [84,85] (Equation (9)).
L e = 3 × L 3 + M K
The length of first capture (Lc) for the Large-Eye Dentex was defined as the smallest individual captured. The probability of capture at 25% (L25), 50% (L50), and 75% (L75) was estimated from the selectivity curve, constructed from length–frequency data of captured fish [86].

2.5. Description of ML Algorithms

After the data were collected, they underwent cleaning, coding, and error correction. The dataset was then split into a training set (70%) and a testing set (30%). Model training and parameter optimization were conducted to improve the accuracy of each approach. No preprocessing steps were applied prior to analysis. Model performance was evaluated and compared using stratified 10-fold cross-validation and appropriate metrics. The machine learning models utilized were Neural Network, Stochastic Gradient Descent (SGD), Support Vector Machine (SVM), Gradient Boosting, and Random Forest (RF).
A predictive analysis was performed using supervised machine learning algorithms to identify the key factors influencing the age estimation of D. macrophthalmus based on otolith morphometric characteristics, using the visual programming software Orange (version 3.39.0) (Ljubljana, Slovenia) [87] (Figure 3). The adequacy of the dataset for addressing the research question (age estimation) was evaluated using the Sample-size to Feature-size Ratio (SFR) [88].

2.5.1. Neural Network

Neural networks, inspired by the human brain, are computational models made up of interconnected units that process inputs using weighted connections and transfer functions to produce outputs [89]. Often called artificial neural networks, these abstract structures are designed to detect complex patterns and relationships in data [89]. In machine learning, they excel at tasks like classification, regression, and pattern recognition, learning from data without needing explicit programming [90]. Unsupervised neural networks, such as competitive learning and Hopfield networks, identify statistical patterns in data, supporting applications like clustering and content-addressable memory [89]. In fisheries research, for example, deep learning neural networks, such as convolutional neural networks (CNNs), enable automated age estimation of fish from otolith images, achieving high accuracy in classification tasks [90,91].
The neural network model employed was a feedforward architecture with a single hidden layer consisting of 100 neurons, utilizing the hyperbolic tangent activation function for non-linearity. Training was conducted using the Adam optimizer, which adapts learning rates for each parameter to improve convergence. Key hyperparameters included a regularization strength (α) of 0.0001 to prevent overfitting by penalizing large weights, a maximum of 200 iterations for training, and replicable training enabled through a fixed seed to ensure reproducibility across runs.

2.5.2. Stochastic Gradient Descent

Stochastic Gradient Descent (SGD) is a widely used optimization method in machine learning that updates a model’s parameters by processing one randomly selected data point or a small subset of the dataset at each step, rather than the entire dataset. This approach speeds up training and helps models efficiently handle large datasets [92]. This random selection introduces noise into parameter updates, promoting faster convergence and improved generalization. By adjusting parameters to minimize the loss function, SGD efficiently trains complex models. However, its stochastic nature necessitates careful tuning of learning rates and other hyperparameters to achieve optimal convergence [93].
The SGD optimizer was applied to linear models, with hinge loss used for classification tasks and squared loss for regression tasks, both incorporating an epsilon (ε) value of 0.10 for the insensitive loss region. Regularization was implemented via an elastic net penalty with a mixing parameter of 0.15 (balancing L1 and L2 norms) and a strength (α) of 0.00001. The learning rate followed an inverse scaling schedule with an initial rate (η0) of 0.0100 and an exponent (t) of 0.2500, running for 1500 iterations until a tolerance of 0.0010 was met as the stopping criterion; data shuffling after each iteration was enabled with a fixed seed of 0 for reproducibility.

2.5.3. Support Vector Machine (SVM)

Support Vector Machine (SVM) is a supervised machine learning algorithm primarily used for classification, mapping input data to output labels by learning patterns from training examples [94,95]. Support vectors, the data points closest to the decision boundary, define the separating hyperplane [95]. For complex medical data, SVM uses kernel functions to project features into higher-dimensional spaces, allowing linear separation of non-linear patterns [96]. Its advantage lies in delivering high accuracy and strong generalization, especially with complex, high-dimensional datasets like those commonly seen in medical research, by effectively balancing the trade-off between model complexity and training errors [95]. Techniques such as soft margins, which permit controlled misclassification, and regularization help prevent overfitting, making SVM well-suited for cases with limited samples but many features, like neuroimaging [94,95].
The SVM model was configured for both classification and regression, with a regression cost parameter (C) set to 1.00 to control the trade-off between training error and margin maximization, and a complexity bound (ν) of 0.50 for ν-SVM formulations. The kernel selected was the radial basis function (RBF) with a gamma (g) value automatically determined (auto), enabling non-linear decision boundaries. Optimization parameters included a numerical tolerance of 0.0010 to determine convergence during the quadratic programming solution process.

2.5.4. Random Forest

Random Forest is a commonly used ensemble learning technique that builds multiple decision trees during the training process. For classification problems, it determines the final output by selecting the most frequently predicted class across all trees, while for regression tasks, it calculates the average prediction from the individual trees [97]. By combining the simplicity of Decision Trees with the robustness of ensemble learning, Random Forest provides an effective solution for both classification and regression tasks [98]. Its ability to manage high-dimensional data, non-linear relationships, and missing values while reducing overfitting has led to its widespread use across various fields. In response to growing threats to marine habitats and biodiversity, ecologists and fisheries scientists increasingly employ Random Forest (RF) models as a powerful machine learning tool for species distribution modeling (SDM) in their research [99].
The Random Forest ensemble model consisted of 11 decision trees, with each split considering 5 attributes to promote diversity and reduce correlation among trees. Basic properties included replicable training for consistency and balanced class distribution to handle imbalanced datasets effectively. Growth control was enforced by limiting the depth of individual trees to 3 levels and preventing splits on subsets smaller than 5 samples, which helps mitigate overfitting while maintaining computational efficiency.

2.6. Assessment of Model Performance

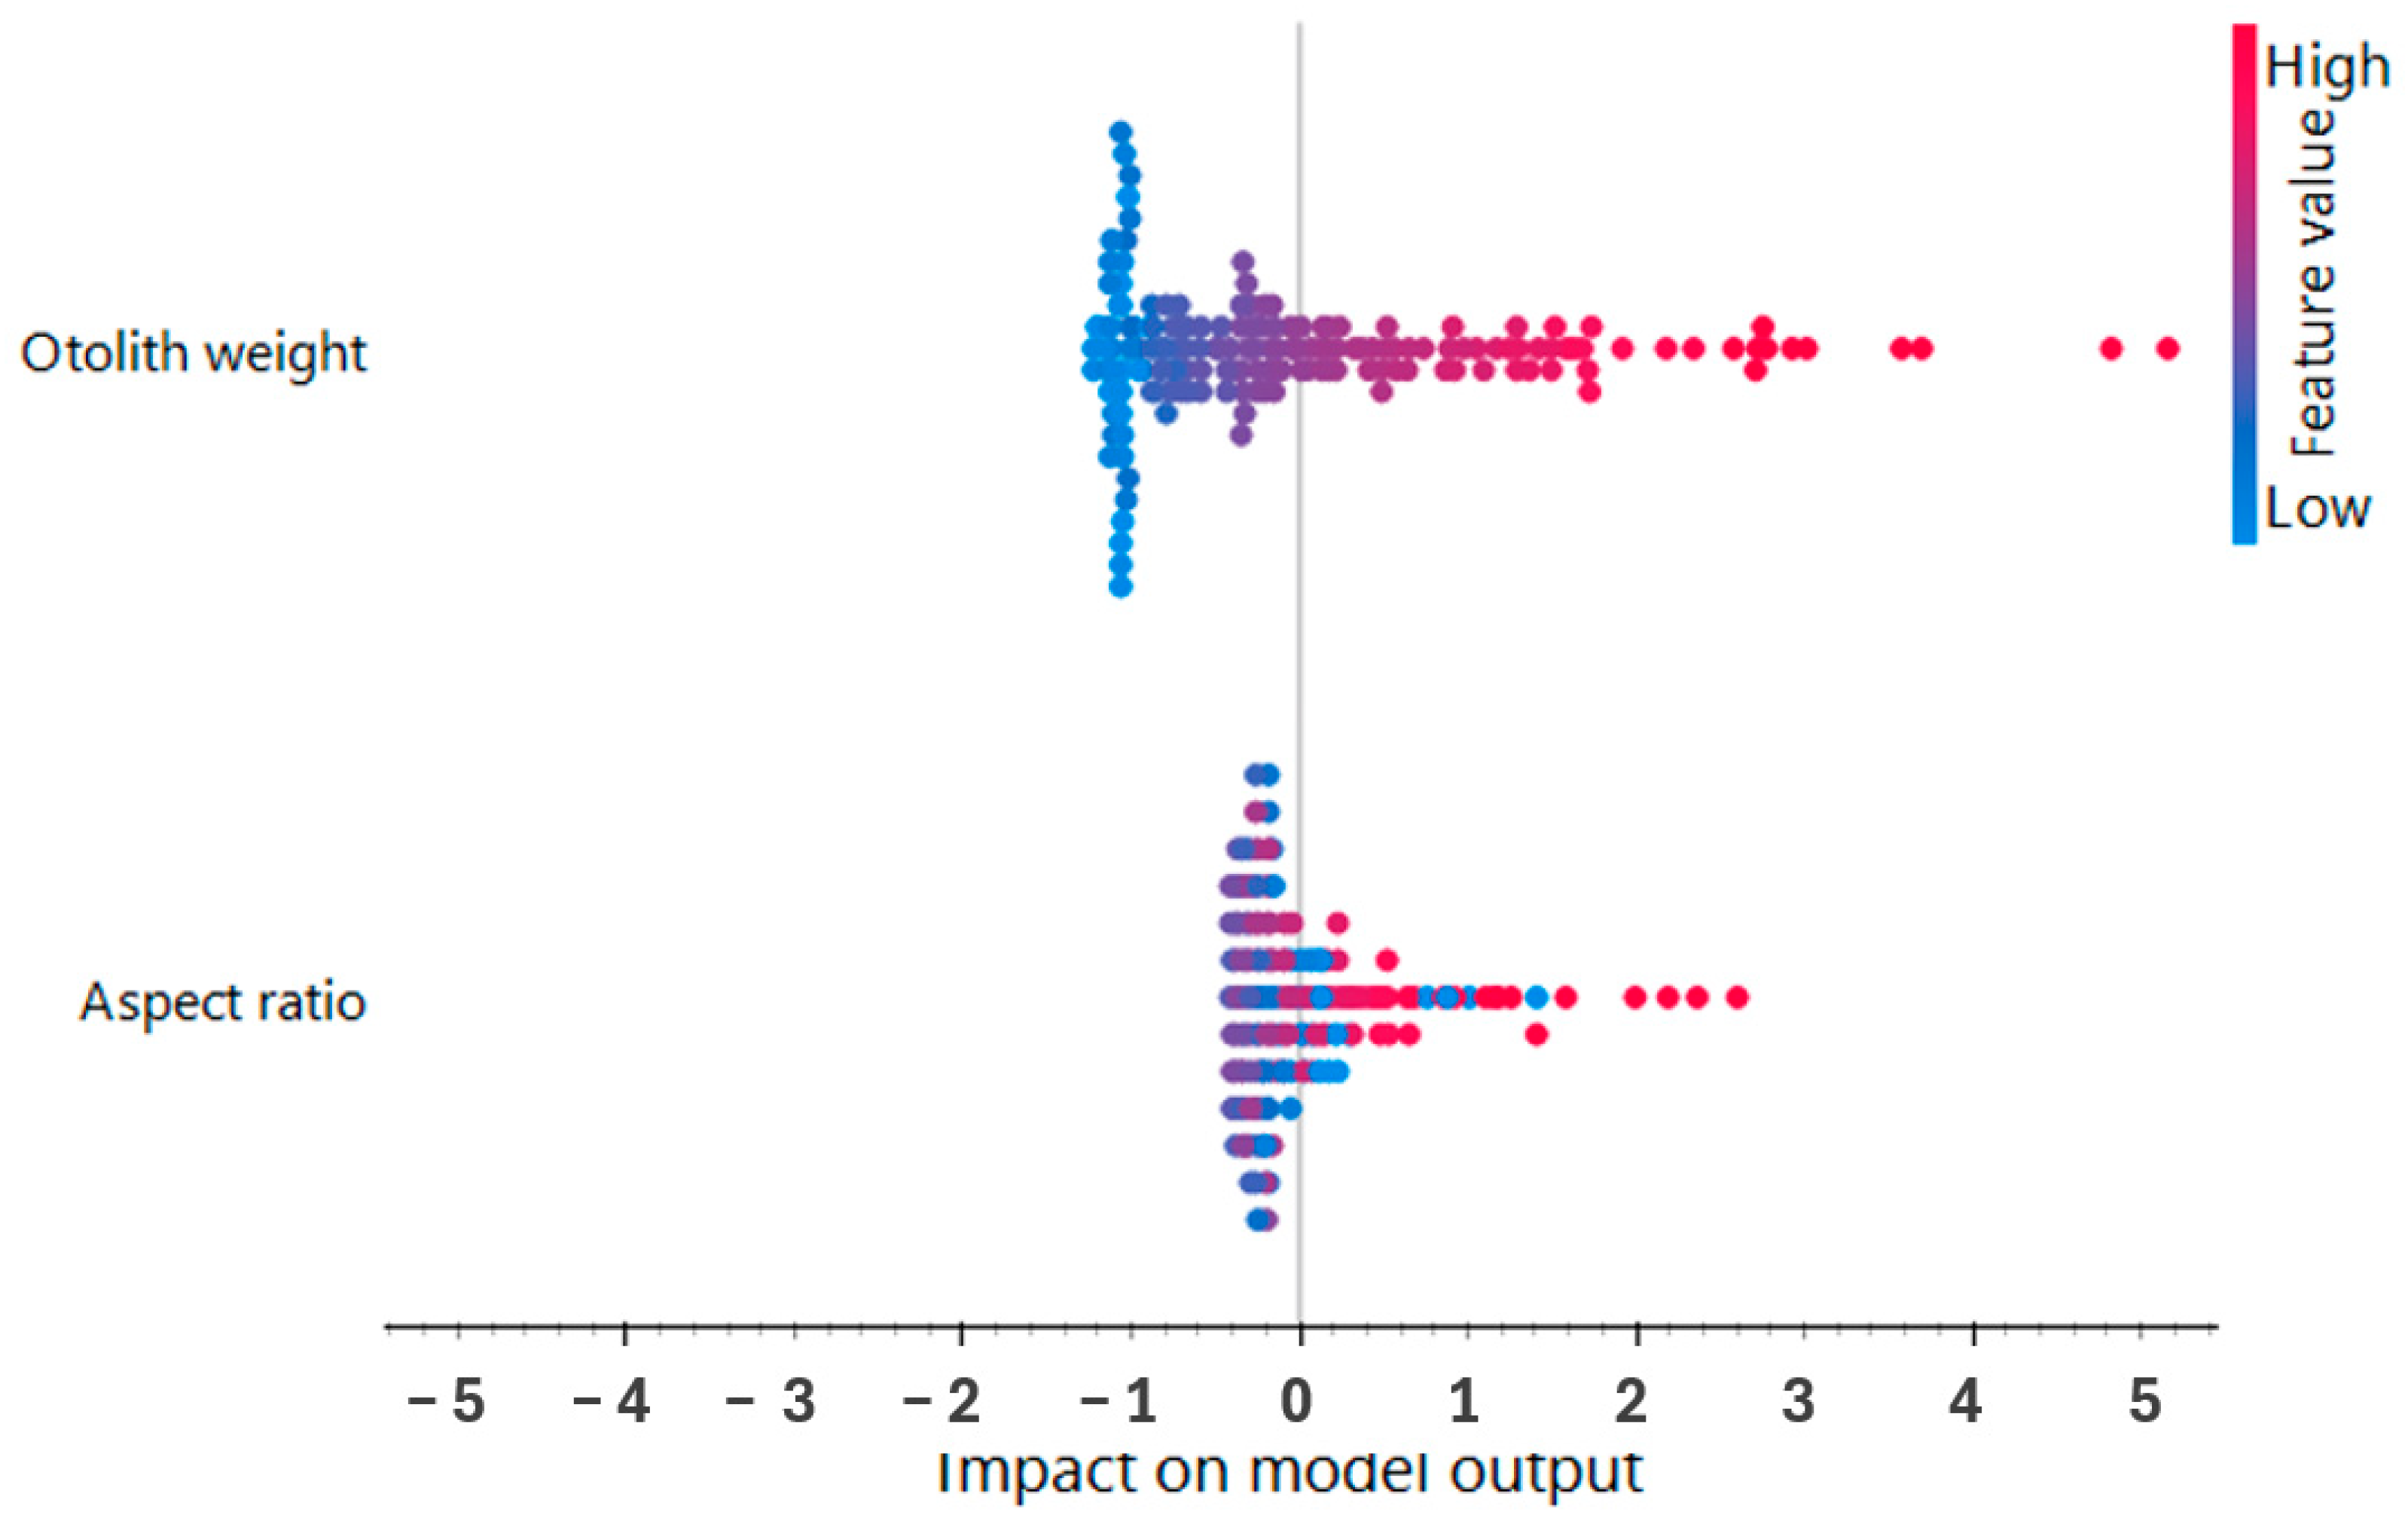
The impact of each feature of the top-performing model was visualized using the SHAP (SHapley Additive exPlanations) approach [100]. SHAP values quantify each feature’s contribution to the model’s output. Positive SHAP values, located to the right of the center, show that a feature positively affects the prediction for the selected class, while negative SHAP values, to the left, indicate a negative effect on the classification. Feature values are represented by colors, with red denoting higher values and blue indicating lower values. The color range for each feature is based on the full range of values in the dataset.
Model performance was measured using five metrics: Mean Squared Error (MSE), which calculates the average squared difference between predicted and actual values [101]; Root Mean Squared Error (RMSE), which provides the square root of the average squared errors to reflect prediction accuracy [101,102]; Mean Absolute Error (MAE), representing the average absolute difference between predictions and observations to indicate error magnitude [102,103]; Mean Absolute Percentage Error (MAPE), expressing average errors as a percentage of actual values [104]; and the Coefficient of Determination (R2), which shows the proportion of variance in the dependent variable explained by the model [105].

2.6.1. Mean Square Error (MSE)

Mean Square Error (MSE) is a metric used to assess a model’s accuracy, calculated as the average of the squared differences between actual observed values and the model’s predicted values. It is mathematically represented as follows (Equation (10)):
M S E = 1 n i = 1 n ( y i y i ^ ) 2
where n is the number of observations, yi represents the actual values, and y i ^ represents the predicted values.
Lower MSE values reflect a better model fit to the data, indicating that the predictions are closer to the actual observed values [106].

2.6.2. Root Mean Square Error (RMSE)

Root Mean Square Error (RMSE) is a metric for assessing model accuracy, akin to MSE, but it expresses the error in the same units as the data. It is calculated as the square root of the average of the squared differences between actual observed values and the model’s predicted values. It is mathematically expressed as follows (Equation (11)):
R M S E = 1 n i = 1 n ( y i y i ^ ) 2
where n is the number of observations, yi represents the actual values, and y i ^ represents the predicted values.
RMSE is commonly used as it offers a clear interpretation of the model’s error magnitude in the same units as the data, facilitating easier comparison of different models’ performance. Lower RMSE values signify a better model fit to the data [107].

2.6.3. Mean Absolute Error (MAE)

Mean Absolute Error (MAE) is a metric for assessing model accuracy, calculated by averaging the absolute differences between actual observed values and predicted values. Unlike MSE and RMSE, MAE does not square the differences, making it less sensitive to outliers. It is mathematically expressed as follows (Equation (12)):
M A E = 1 n i = 1 n y i y i ^
where n is the number of observations, yi represents the actual values, and y i ^ represents the predicted values.
MAE offers a clear measure of the average error magnitude, helping to understand the typical deviation of predictions from actual values. Lower MAE values signify a better model fit to the data [107].

2.6.4. Mean Absolute Percentage Error (MAPE)

Mean Absolute Percentage Error (MAPE) is a metric for assessing model accuracy, calculated by averaging the absolute percentage errors between actual observed values and predicted values. Expressed as a percentage, MAPE facilitates interpretation of error magnitude relative to the actual values. It is mathematically represented as follows (Equation (13)):
M A P E = 1 n i = 1 n y i y i ^ y i × 100
where n is the number of observations, yi represents the actual values, and y i ^ represents the predicted values.
MAPE is valuable for comparing forecast accuracy across diverse datasets due to its percentage-based error metric. Lower MAPE values reflect a better model fit to the data, with values closer to 0% indicating greater accuracy [107].

2.6.5. Coefficient of Determination (R2)

The Coefficient of Determination, often denoted as R2, is a widely used statistical metric to evaluate a regression model’s goodness of fit. It represents the proportion of variance in the dependent variable explained by the independent variables, with values ranging from 0 to 1. Higher R2 values indicate a better model fit to the data. It is mathematically expressed as follows (Equation (14)):
R 2 = 1 i = 1 n ( y i y i ^ ) 2 i = 1 n ( y i y ¯ ) 2
where n is the number of observations, yi represents the actual values, y i ^ represents the predicted values, and y ¯ is the mean of the actual values.
An R2 value of 1 signifies that the regression model perfectly predicts the dependent variable, while an R2 value of 0 indicates that the model fails to explain any of the variance in the dependent variable [101].

3. Results

3.1. Population Structure

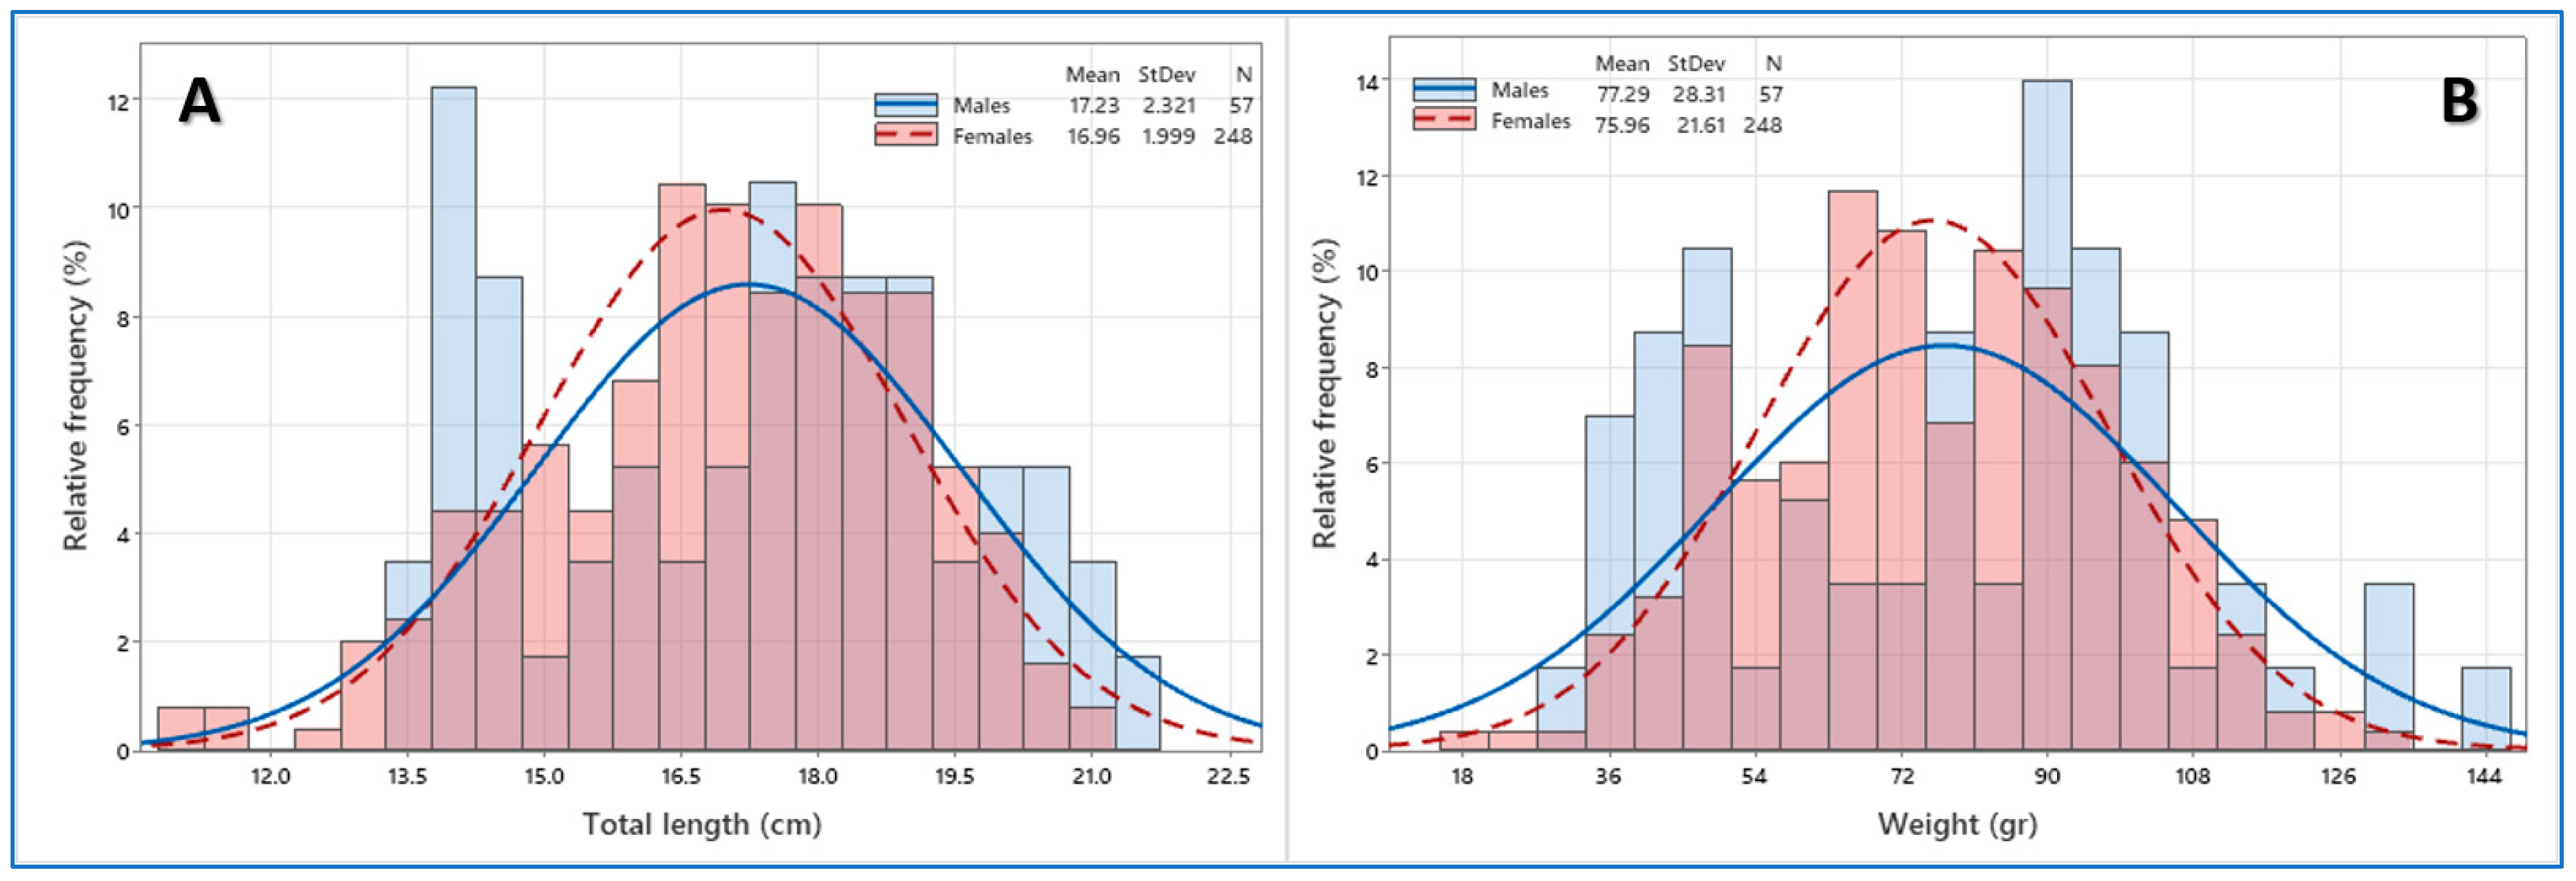
Mean total length was 16.86 ± 2.16 cm and mean total weight was 75.09 ± 23.90 gr, with males exhibiting a larger length and weight compared to females (Figure 4), but this was not statistically significant. A significant difference was observed in the female to male ratio (4.1:1), with females being significantly more abundant than males (X2 = 86.0, p < 0.001).
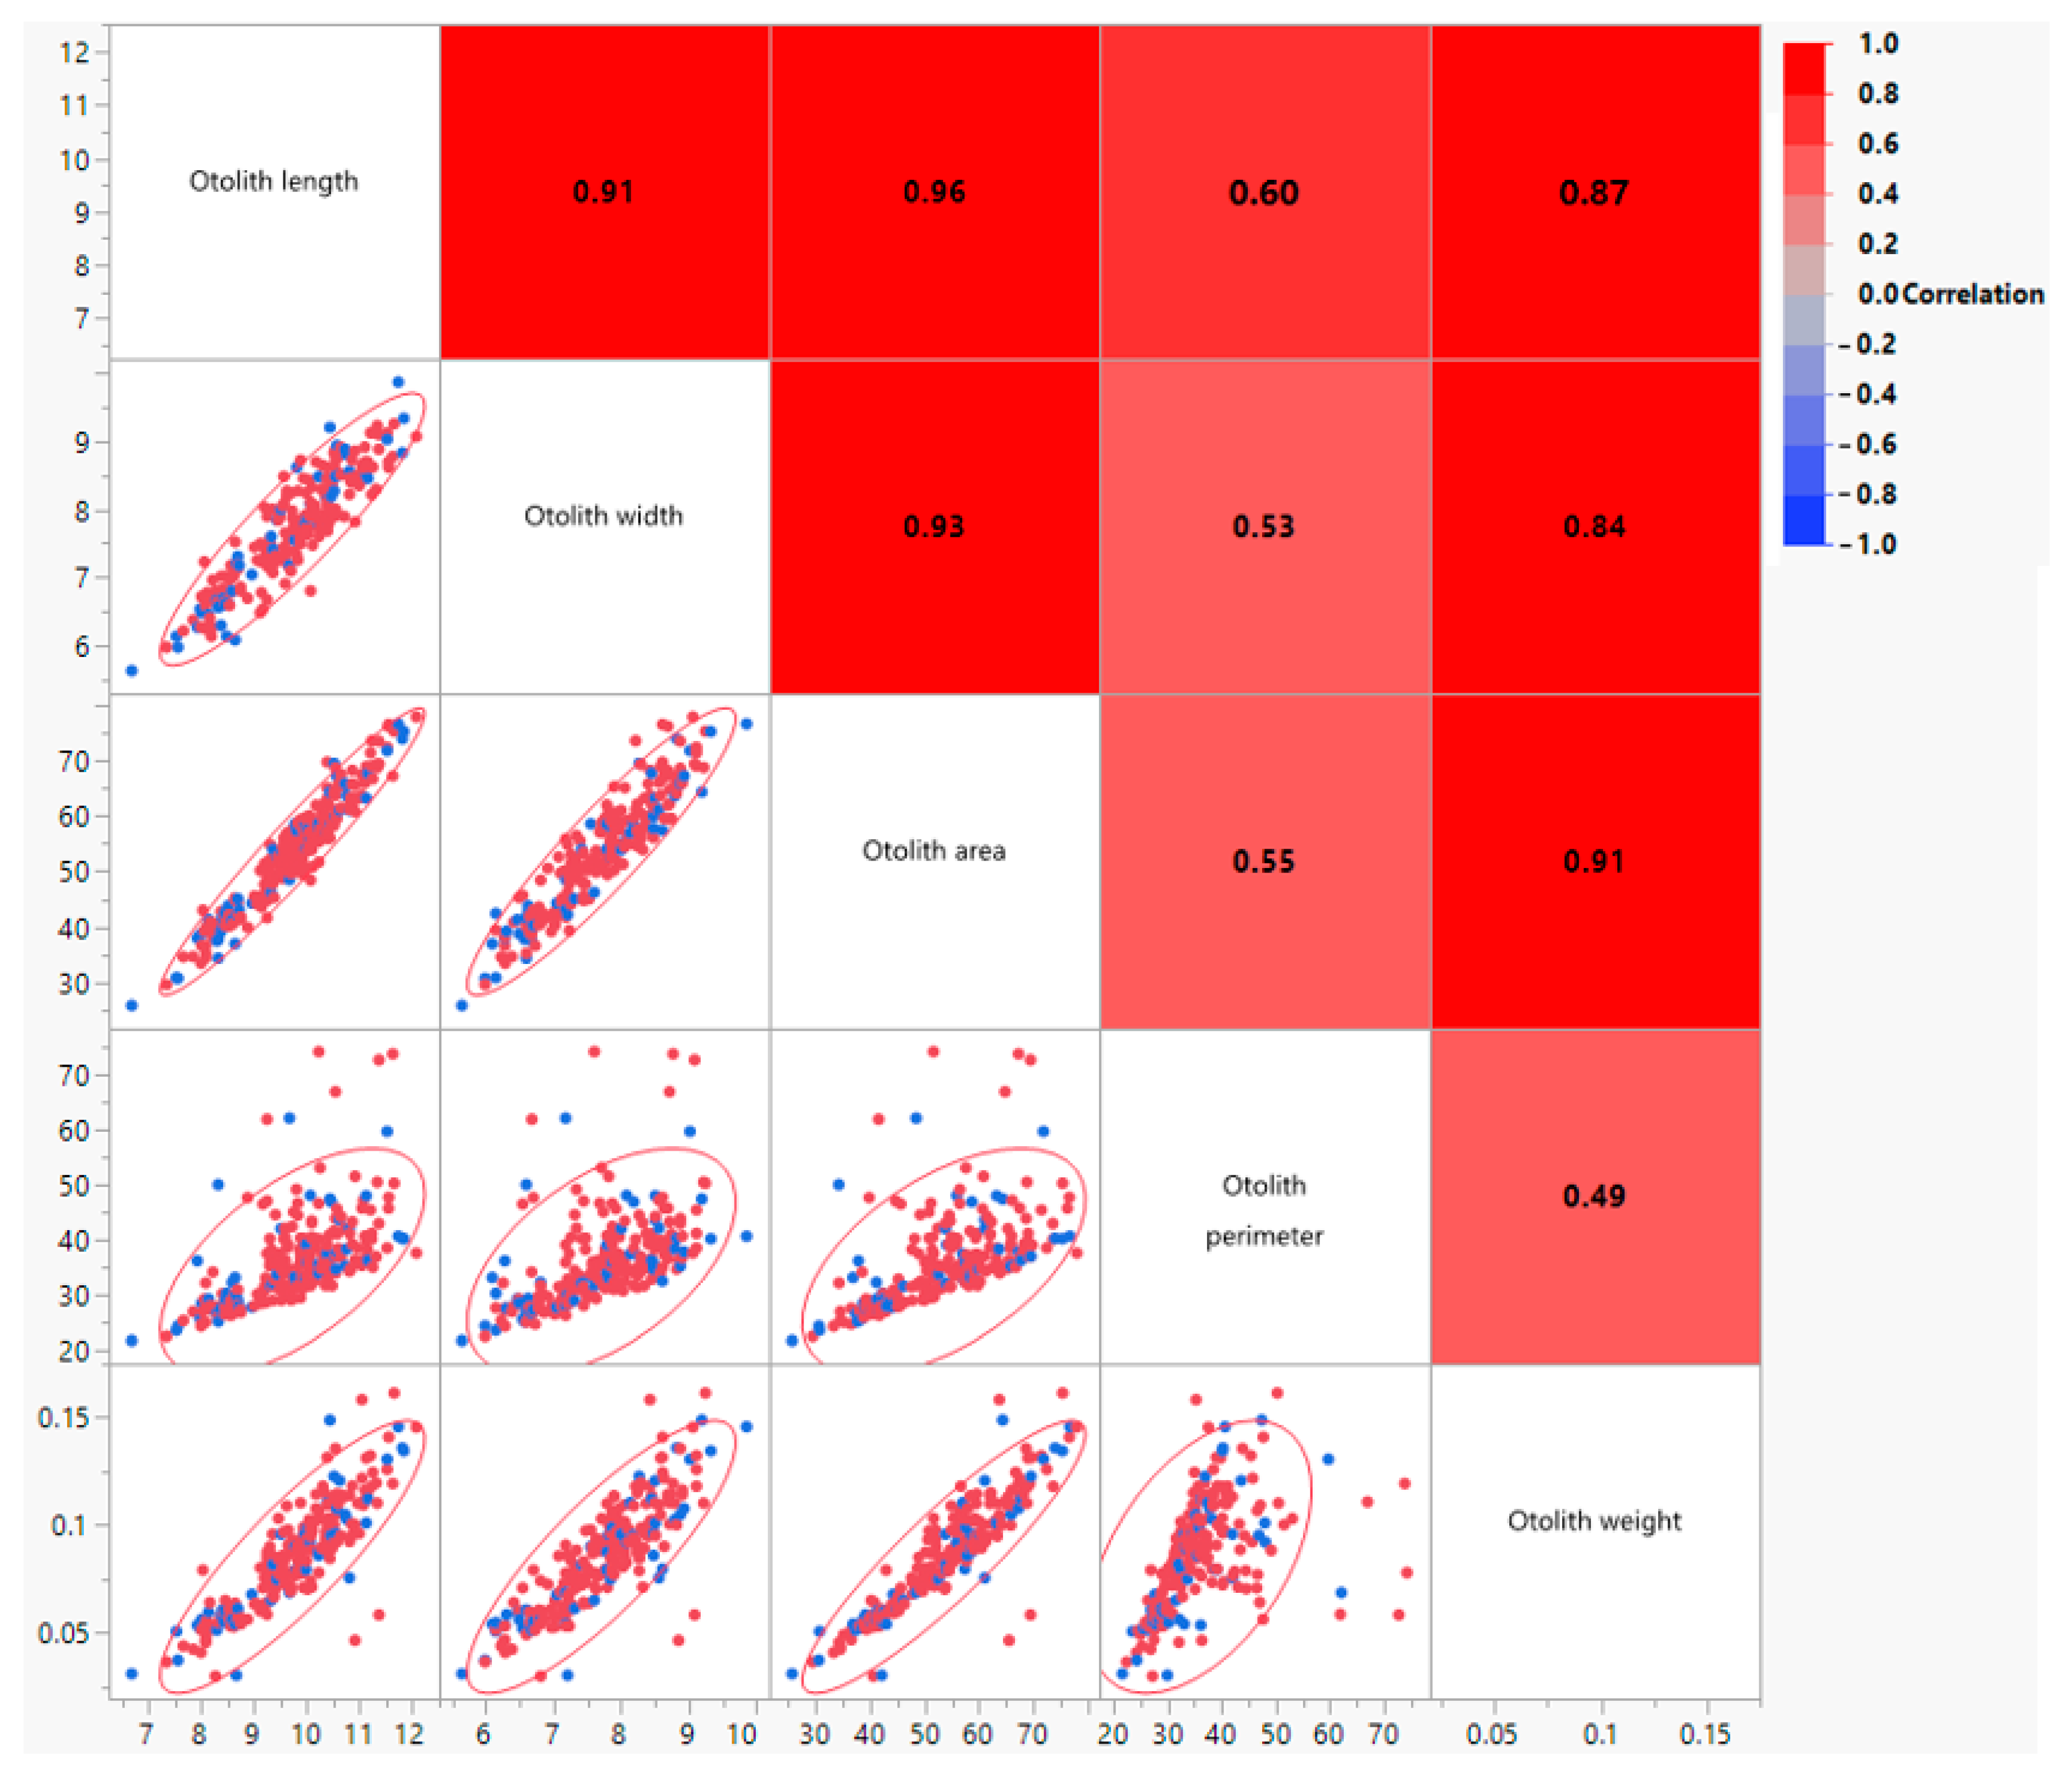
No significant morphometric difference was observed among left and right sagittal otoliths or among sexes. A significant positive correlation was shown among all otolith biometric characters measured (Figure 5).
The analysis of the D. macrophthalmus length–weight relationship (Figure 6) revealed a strong and significant allometric growth pattern that differs notably between sexes. The overall model explained a high proportion of the variance in weight (R2 = 0.86, p < 0.001), confirming total length as an excellent predictor of body weight.
The analysis of covariance indicated that separate regression models are required for males and females as they exhibit statistically different slopes (b) and intercepts (a). Both sexes displayed negative allometric growth (b < 3), with females showing a significantly lower slope (b = 2.337, t = −9.87, p < 0.001) compared to males (b = 2.542, t = −3.04, p = 0.0036). This indicates that weight increases at a slower rate than the cube of length for both sexes, but the rate of increase is more pronounced in males. The lower intercept value for males (a = 0.0538) compared to females (a = 0.0995) suggests that males are generally lighter than females at equivalent lengths, a pattern that is consistent across the size range examined.
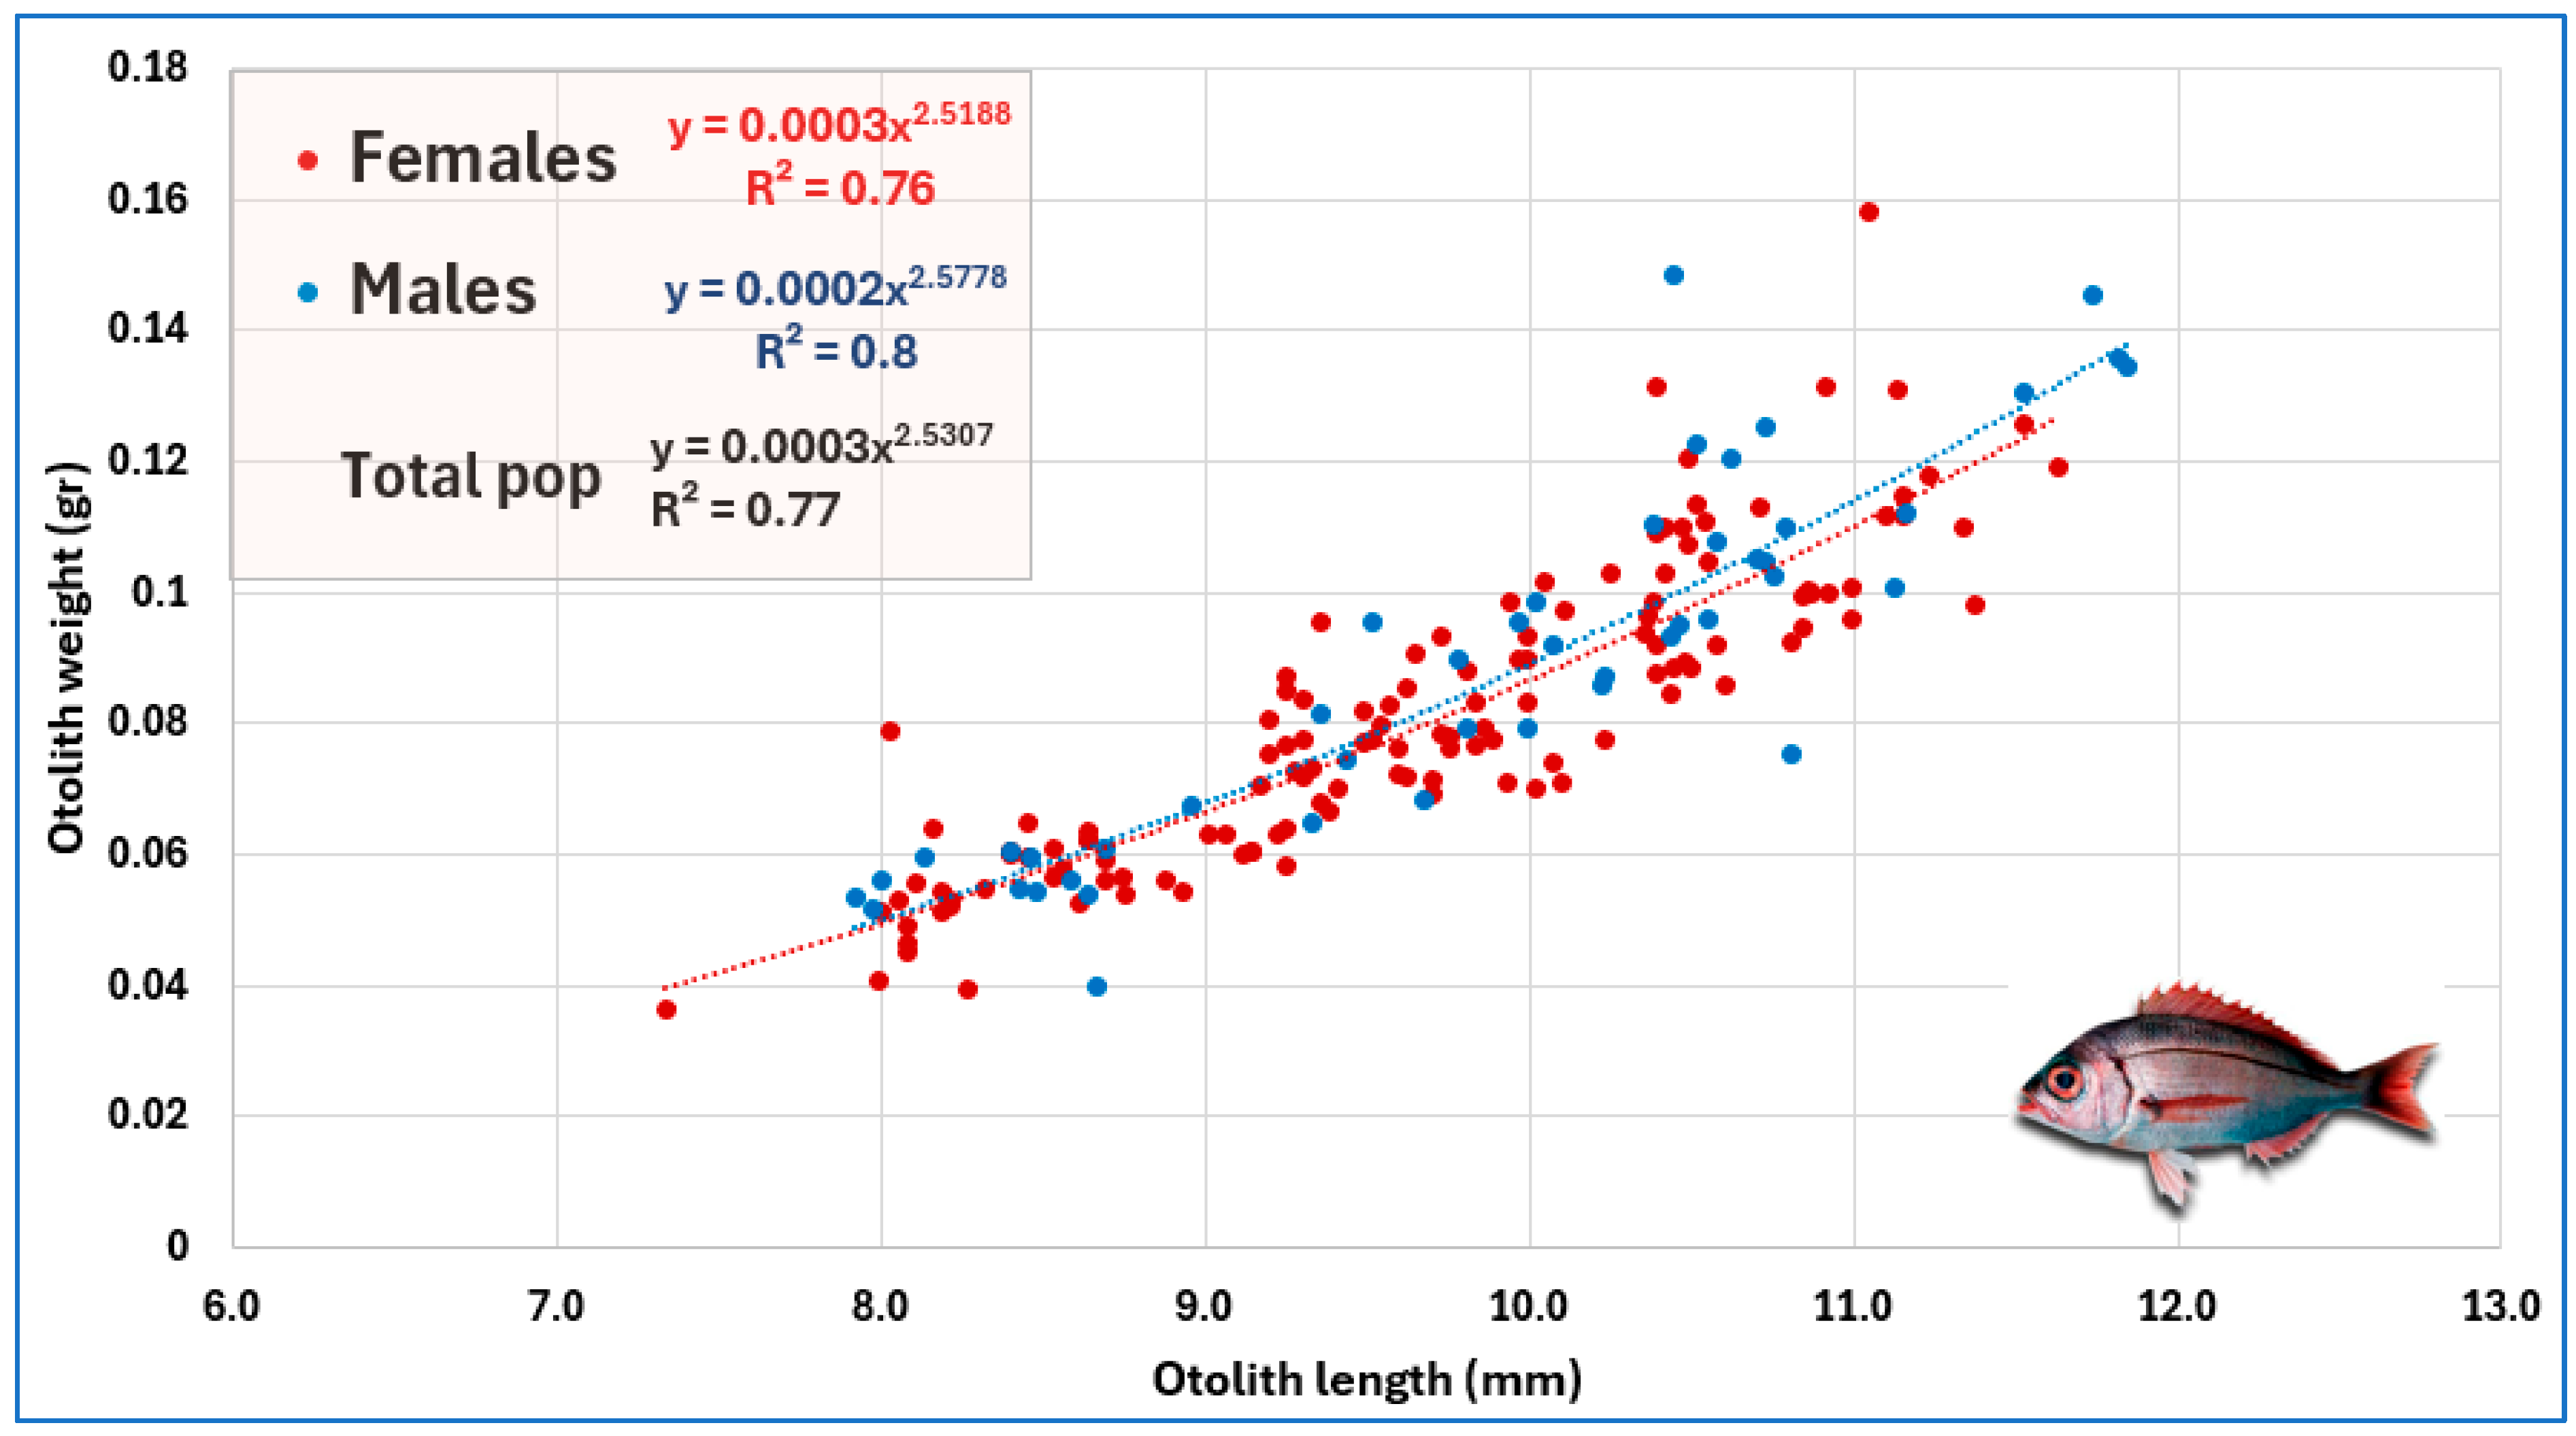
The analysis of the D. macrophthalmus otolith length–weight relationship (Figure 7) revealed a strong and significant allometric relationship, with no statistically significant differences found between sexes. The analysis of covariance (ANCOVA) showed that a single common regression line is appropriate for both males and females. Testing against the null hypothesis of isometric scaling (b = 3) revealed a significant deviation, indicating that otolith weight increases at a slower rate than the cube of otolith length. This pattern reflects a change in body form rather than true ontogenetic growth, consistent with [108]. While the allometric scaling was consistent for females (b = 2.52, p < 0.001), the growth type for males did not significantly deviate from isometry (b = 2.58, p = 0.051), though the near-significant result and similar coefficient suggest a consistent biological trend across sexes. This negative allometric scaling indicates that larger otoliths become relatively more elongated rather than denser or thicker as they increase in size.
The exponential curve was further employed to identify morphometric relationships between fish Length (L), weight (W), and otolith dimensions.
The otolith morphometric relationships examined for D. macrophthalmus demonstrated highly significant (p < 0.001) negative allometric scaling patterns (Table 2). The negative allometric scaling indicates that as the size of the otolith increases, its dimensions (weight, width, area) increase at a slower rate than its length.

3.2. Spatial Distribution

The spatial distribution of CPUE (kg/h trawl) for D. macrophthalmus across the Pagasitikos Gulf was highly heterogeneous (Figure 8). The highest concentrations were found in a discrete area within the central–western region of the gulf. This suggests the presence of a primary aggregation or hotspot for this species. The surrounding areas, particularly to the east and south, showed significantly lower CPUE values, with large portions of the eastern and central basins exhibiting low catches. The distribution indicates a patchy population structure, with most of the biomass heavily concentrated in a specific central–western zone rather than being evenly dispersed throughout the surveyed areas of the gulf.

3.3. Age Composition, Growth, Mortality and Exploitation Rate

The population structure of D. macrophthalmus displayed a unimodal distribution across 8 age groups identified, characterized by low representation in the extremes and peaking in the mid-range ages (Figure 9). All age estimates assumed annual deposition of growth zones, an assumption supported by seasonal edge-type patterns but not formally validated.
The dominant cohort was the fourth-year class, comprising 25.08% of the population, followed by the fifth (21.00% of the population) and the third (18.81% of the population) year classes, respectively (Figure 9). The mean total length exhibited a linear increase with age, commencing at roughly 12 cm for age group 1 and progressing steadily to about 22 cm for age group 8, indicative of an average annual growth increment of 1.3 cm. Standard deviations around these mean lengths remained consistently narrow throughout all age groups, suggesting consistent growth patterns and minimal intraspecific variability in size-at-age within cohorts.
The asymptotic length (L∞) for the total population was estimated at 25.97 cm with a confidence interval (CI) ranging from 24.23 to 27.83 cm, while the growth coefficient (k) was 0.16 year−1 (CI: 0.13–0.19). The theoretical age at which the fish’s length would be zero (t0) was calculated as −2.69 years (CI: −3.12 to −2.26). The von Bertalanffy growth model (Figure 10) fitted the data well, explaining about 95% of the variance in length-at-age. The growth performance index (φ’) was 2.076.
For females, L∞ was 26.4 cm (CI: 24.2–28.6), k was 0.15 year−1 (CI: 0.12–0.18), and t0 was −2.84 years (CI: −3.35 to −2.33). For males, L∞ was estimated at 30.9 cm (CI: 22.5–39.3), k at 0.097 year−1 (CI: 0.037–0.156), and t0 at −4.16 years (CI: −5.74 to −2.59). No statistically significant differences in growth patterns were observed between sexes.
Natural mortality (M) was estimated at 0.37 and total mortality (Z) was estimated at 0.63. Fishing mortality (F) was estimated at 0.26. The exploitation rate (E), calculated as 0.41, indicates an underexploited population. The length class with the highest biomass (Le) was estimated at 14.7 cm. The probability of capture was estimated at 25% (LC25), 50% (LC50), and 75% (LC75) levels as 15.57, 16.12, and 16.48 cm, respectively. The age at which there is a 50% probability of capture (t50) was estimated at 3.5 years.

3.4. Inter-Reder Precision and Agreement

The Index of Average Percentage Error (IAPE) was estimated at 7.01% and Chang’s Coefficient of Variation (CV) at 9.52%. Based on the Bowker’s test of symmetry results, the analysis revealed statistically significant asymmetry in the paired comparison matrices between all reader pairs (p < 0.001 for all comparisons), indicating systematic differences in age estimation patterns rather than random disagreement. This significant departure from symmetry suggests that readers demonstrated consistent directional biases when assigning age classes, with certain readers tending to systematically over-age or under-age specific year classes relative to their counterparts. The nature of these asymmetries can be partially elucidated by the detailed bias statistics, which showed that while mean biases were generally small (−0.097 to 0.088 years), the direction and magnitude of disagreement varied across specific age classes.
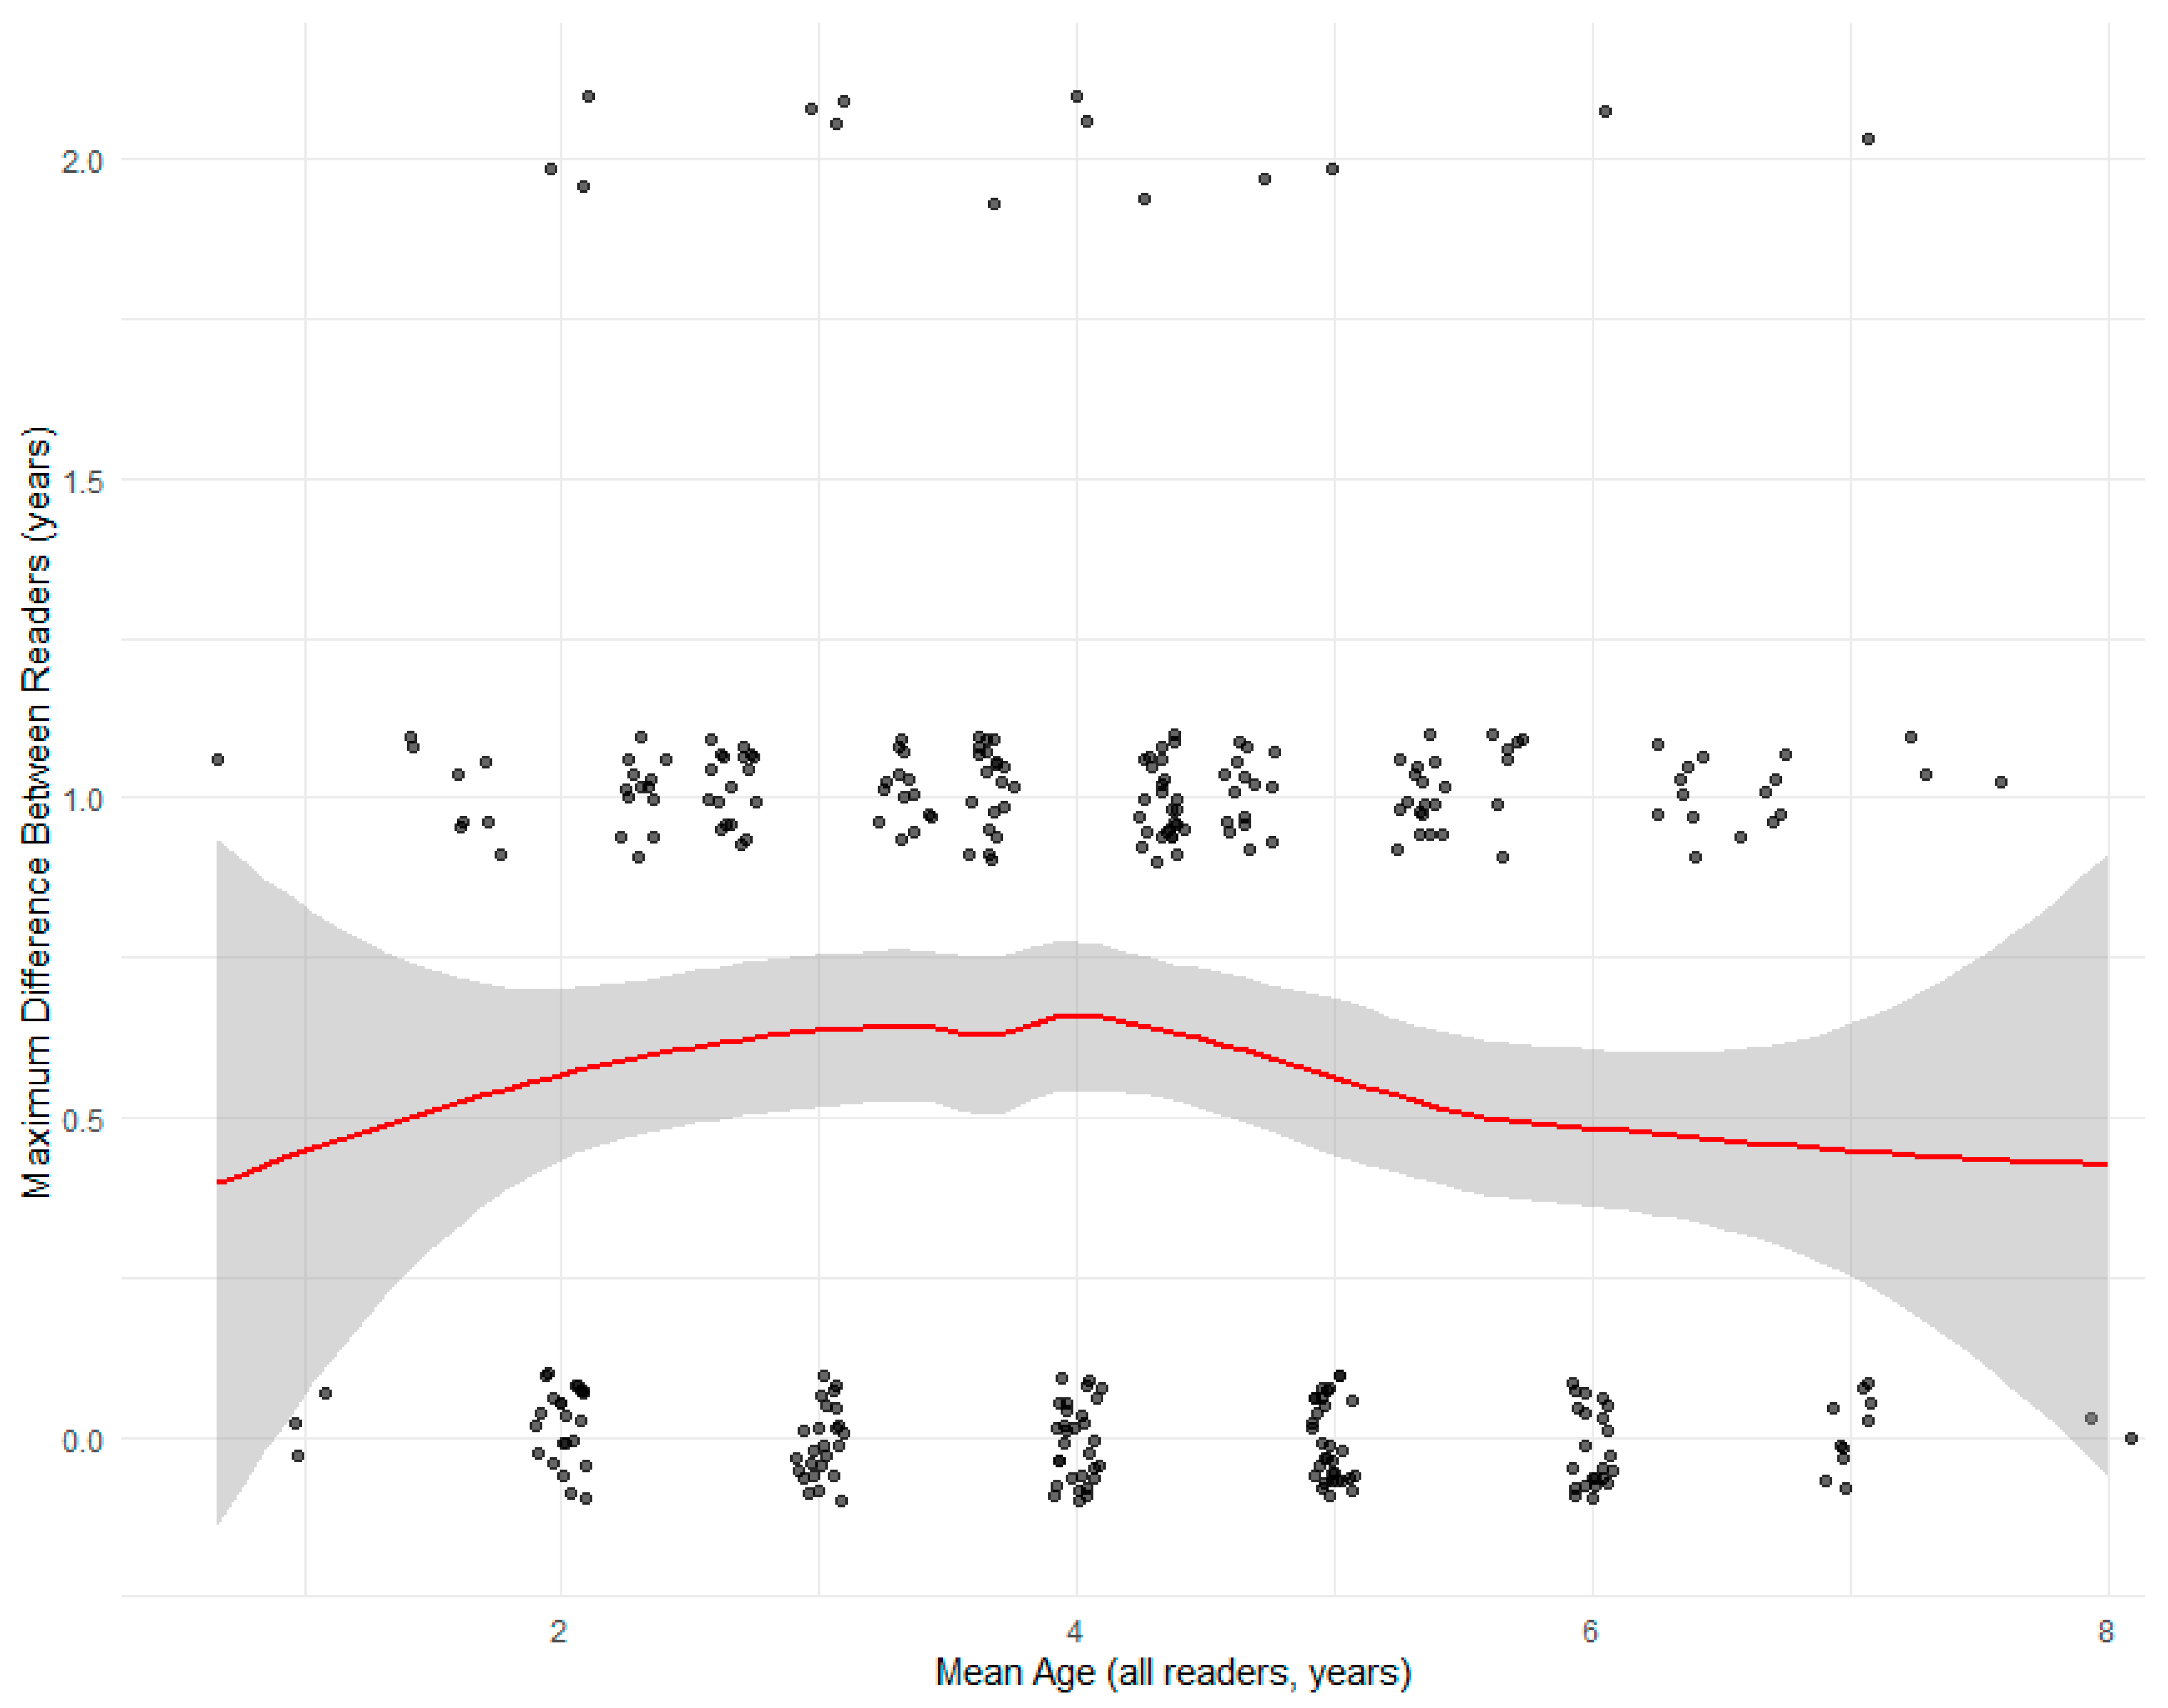
Based on the comprehensive inter-reader agreement analysis of age estimates, the three readers demonstrated moderate to substantial agreement with generally minimal systematic bias. Reader 1 and Reader 3 showed the strongest agreement with a Cohen’s kappa of 0.668 and 72.73% exact agreement, indicating substantial concordance. In contrast, the agreements between Reader 1–Reader 2 (κ = 0.503, 58.93% exact agreement) and Reader 2–Reader 3 (κ = 0.489, 57.68% exact agreement) were more moderate. The mean biases between readers were minimal, ranging from −0.097 to 0.088 years, with Reader 1–Reader 3 showing good calibration (mean bias: −0.009 years). Importantly, all reader comparisons demonstrated excellent agreement, with 97.8–98.7% of estimates falling within ±1 year of each other. Age-specific analysis revealed that agreement patterns were generally consistent across age classes, though some age-dependent variation in bias was observed, particularly at the extremes of the age distribution where sample sizes were smaller (Figure 11).
The scatter plot (Figure 11) demonstrated the precision of age estimation across different age classes. The distribution showed that most age estimates exhibited high consistency among readers, with most points clustered at the bottom of the graph, indicating maximum differences of 0–1 year. The red loess curve indicated a trend of increasing disagreement in older fish. The dense clustering of points at a maximum difference of 0 or 1 year demonstrated high practical agreement across most of the age range, consistent with the high percentage of estimates within ±1 year (>97%). This pattern suggested that age estimation becomes somewhat more challenging for older fish, though the overall consistency remained strong throughout the age spectrum. The dense clustering of points at lower age values reflected the larger sample sizes in younger age classes, which is consistent with the expected age distribution in many fish populations.

3.5. Machine Learning

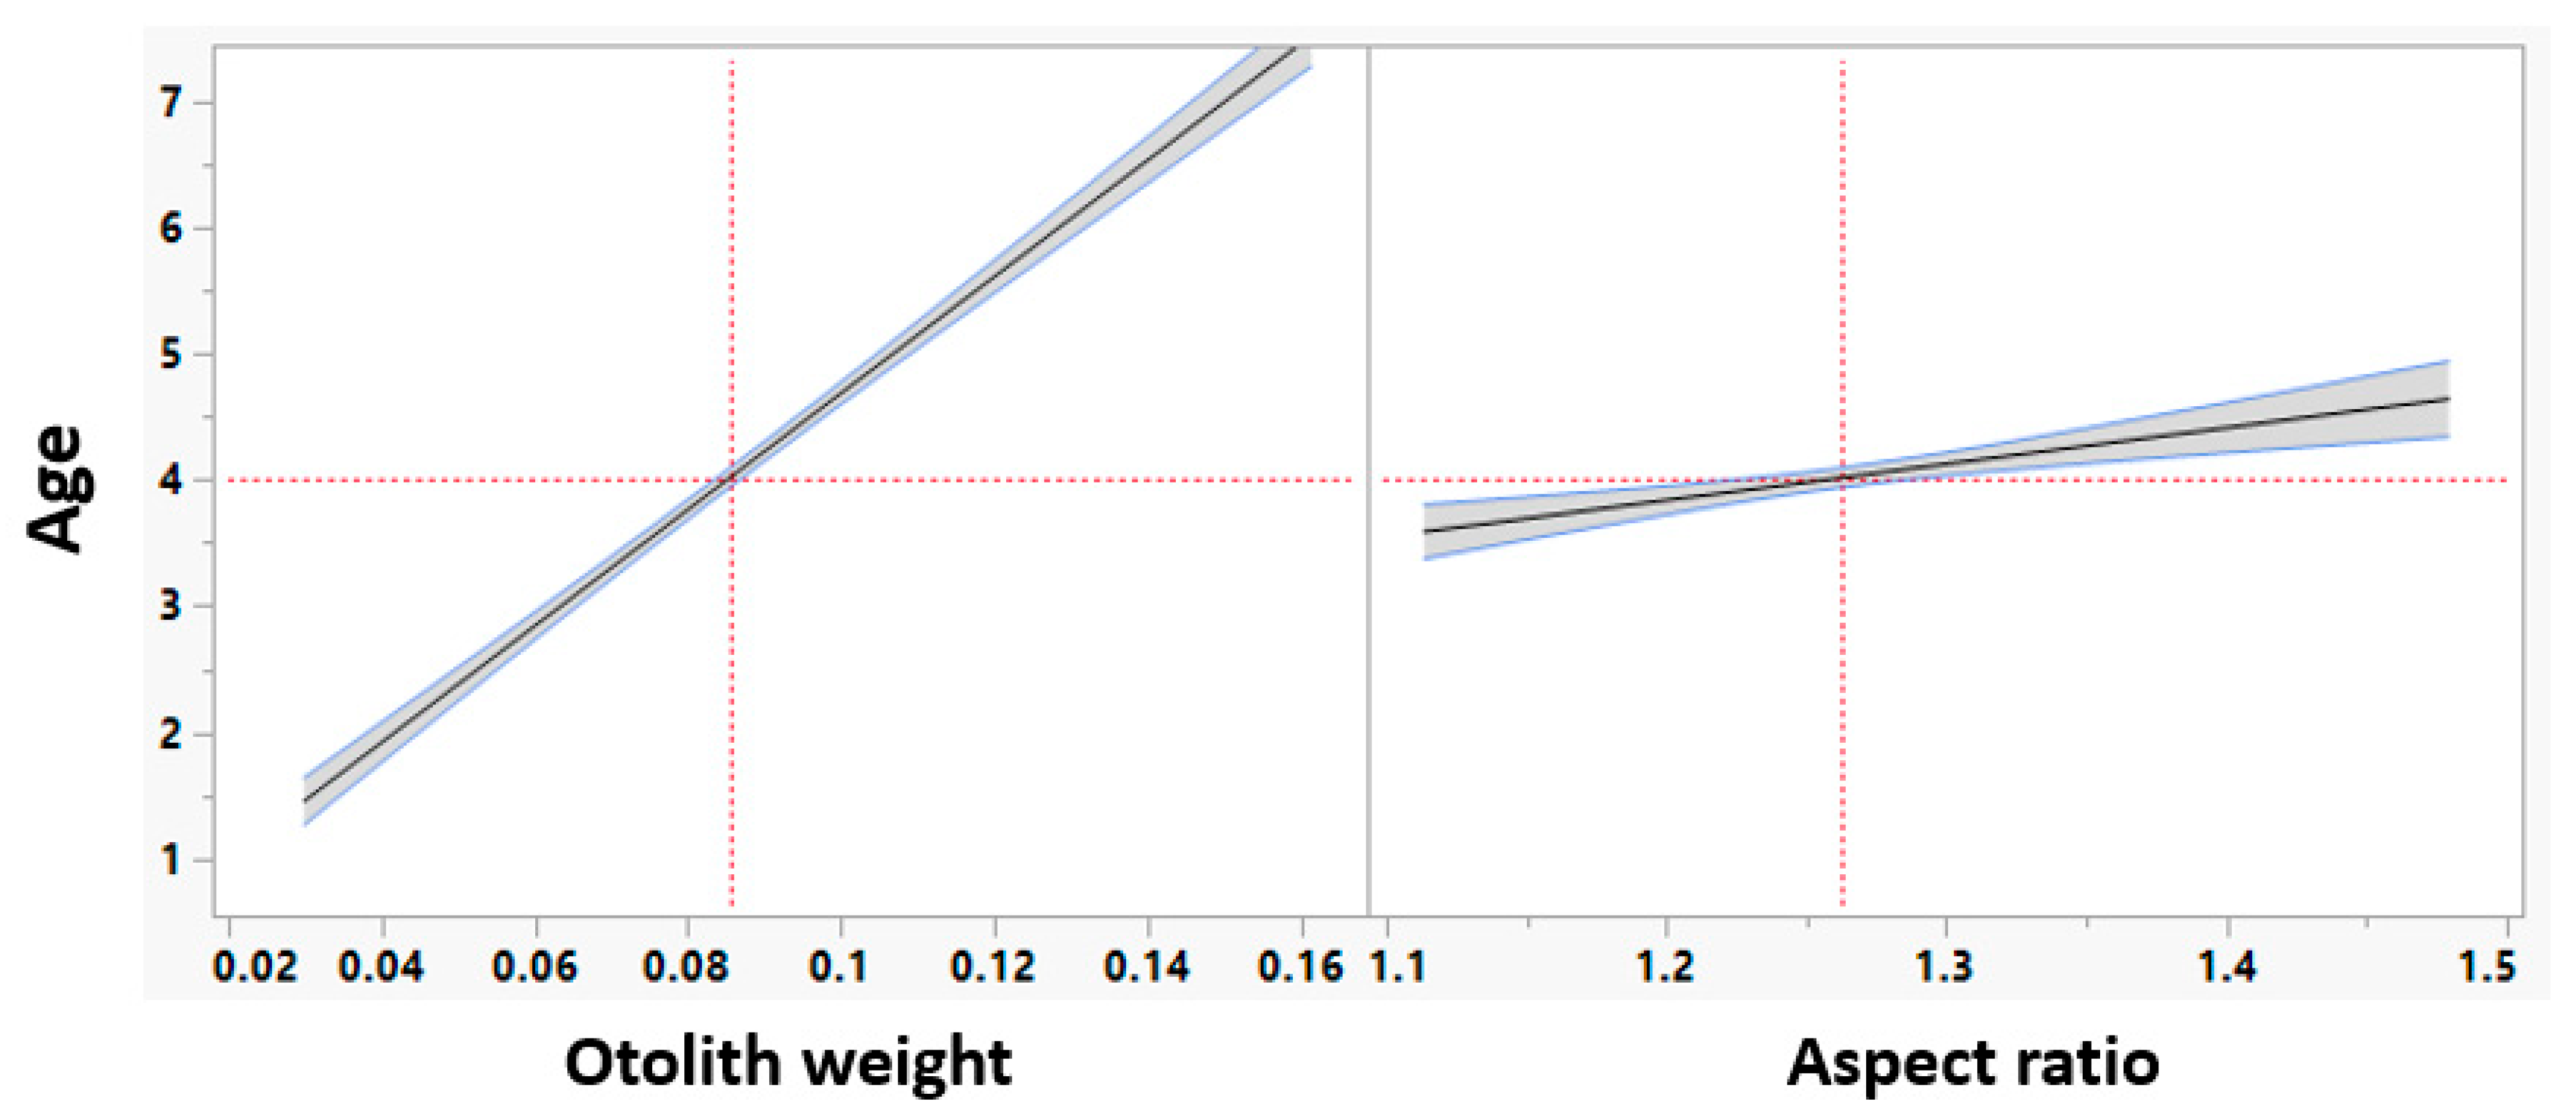
Based on the stepwise regression analysis using the minimum Bayesian Information Criterion (BIC) for model selection, two morphometric variables were identified as the major factors significantly affecting age estimation in D. macrophthalmus: otolith weight and aspect ratio. The final model, which included these two predictors, explained a substantial proportion of the variance in age, with an R2 value of 0.8. The overall model was highly significant (F Ratio = 454.90, p < 0.001), indicating a strong relationship between the predictors and the response variable. The influence of individual factors and their interaction effects on the total population was quantified and visualized using a prediction profiler (Figure 12).
Parameter estimates revealed that both otolith weight and aspect ratio had a significant positive effect on estimated age. Otolith weight was the dominant predictive factor (Estimate = 46.12, t Ratio = 29.56, p < 0.001), as confirmed by its high Logworth value (79.23) and the largest sum of squares in the effect tests (F Ratio = 873.97, p < 0.001). This indicates that otolith weight is by far the most important variable for age prediction. The aspect ratio, while contributing less to the model, was also a statistically significant predictor (Estimate = 2.88, t Ratio = 4.22, p < 0.001; Logworth = 4.45). The model provided a robust tool for age estimation, with a root mean square error of 0.602, suggesting predictions are made with a reasonable degree of precision around the mean response of 4.02 years.
The equation that derived from the stepwise regression analysis and quantified the relationship between the significant otolith morphometric predictors and fish age in D. macrophthalmus was defined by the following linear equation (Equation (15)):
Age = −3.560 + (46.121 × Otolith weight) + (2.877 × Aspect ratio) (R2 = 0.8)
VIFs for both otolith weight and aspect ratio were 1, indicating a complete absence of multicollinearity between these two predictors in the final model. Furthermore, no significant correlation was shown among otolith weight and otolith aspect ratio (Figure 13).

3.6. Machine Learning Model Performance Assessment

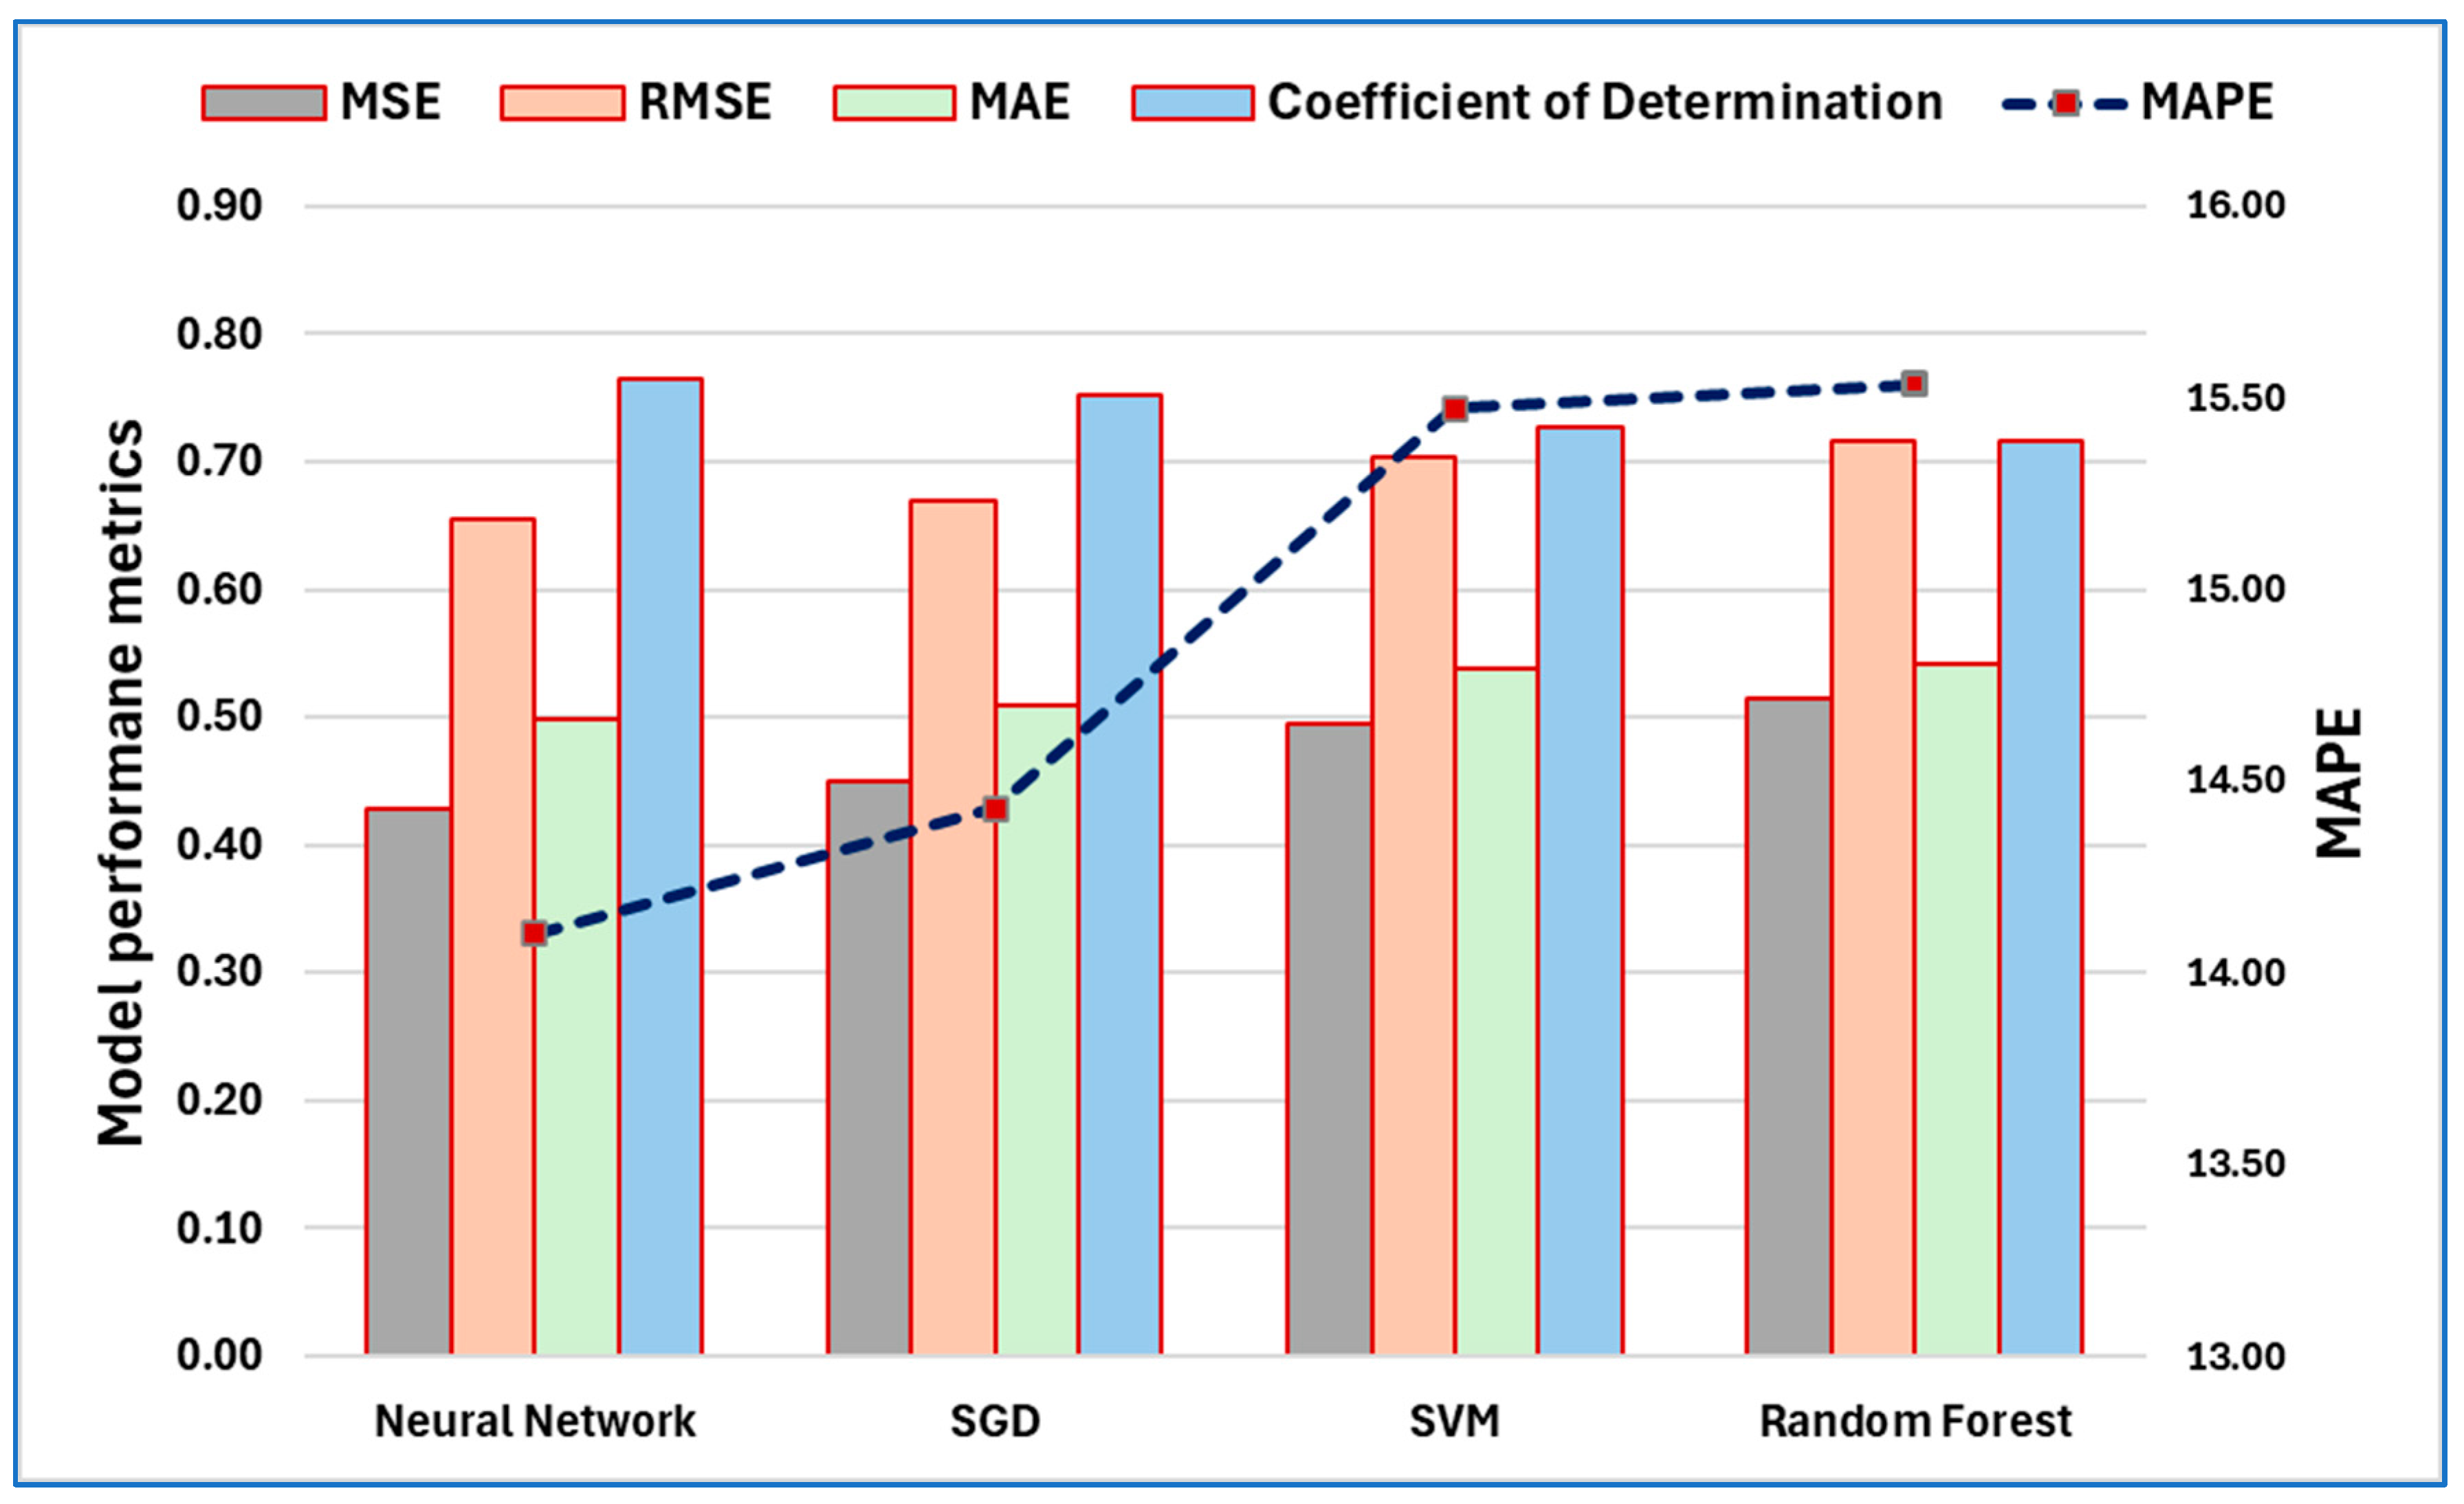
Model performance was evaluated using five metrics: Mean Squared Error (MSE), Root Mean Squared Error (RMSE), Mean Absolute Error (MAE), Mean Absolute Percentage Error (MAPE), and the coefficient of determination (R2). Better model performance is indicated by lower values in MSE, RMSE, MAE, and MAPE, and a higher value in R2.
Based on metric results for the total population, the Neural Network achieves the best overall performance (Figure 14), with the lowest errors (MSE = 0.429, MAPE = 14.10%) and highest explanatory power (R2 = 0.764). SGD is a close second, offering a simpler alternative with marginally higher errors. Random Forest and SVM lag, suggesting tree-based and kernel methods may be less suited to this dataset without further tuning.
The SHAP summary plot (Figure 15) from the Neural Network algorithm compared the influence of otolith weight and aspect ratio on the age prediction model for D. macrophthalmus. The plot confirmed that otolith weight is the dominant feature, as shown by its wide range of SHAP values. High otolith weight (red) correlates with a higher predicted age (positive SHAP values), while low weight (blue) correlates with a lower predicted age. In contrast, the aspect ratio has a much more limited range of SHAP values, indicating a significantly weaker impact on the model’s predictions.

4. Discussion

The large-eye dentex emerges as a potentially valuable resource for Mediterranean fisheries, particularly in regions like the Aegean Sea where traditional sparid stocks are under pressure from overexploitation [37,109,110,111,112]. Our findings reveal a population characterized by slow growth (k ≈ 0.16 yr−1), a dominance of middle-aged individuals (3–5 years), and an underexploited status (E = 0.41), indicating resilience to current low-level fishing pressure and also a life-history strategy that balances moderate longevity with steady recruitment [113,114,115]. These traits suggest that D. macrophthalmus could serve as a supplementary species to diversify catches and reduce reliance on overfished stocks, provided management measures are implemented preemptively. The observed sexual dimorphism in growth parameters, with males attaining larger asymptotic lengths (L∞ ≈ 30.9 cm) but slower growth rates than females (L∞ ≈ 26.4 cm), underscores the need for sex-specific models in stock assessments.
Collectively, the biological characteristics of this population, particularly its underexploited status (E = 0.41), slow growth, and age structure dominated by mature individuals, suggest that D. macrophthalmus could be a potential candidate for sustainable supplementary exploitation in the Mediterranean, provided that precautionary management measures are implemented. The high accuracy of the neural network model (R2 = 0.764) further supports the feasibility of integrating automated, objective age estimation into future monitoring frameworks.

4.1. Length Distributions and Length–Weight Relationships

The length distribution of D. macrophthalmus in Pagasitikos Gulf was centered around 15–20 cm, with a mean total length of 16.86 ± 2.16 cm, reflecting a population dominated by larger, likely mature individuals. In contrast, observations from the east–central Aegean Sea by [42] reported a total length range of 3.9–21.3 cm and a mean length of 9.6 ± 0.1 cm, heavily influenced by a high proportion of juveniles (469 out of 716 individuals), indicating a smaller size structure possibly driven by strong juvenile recruitment, limited prey availability, and moderate fishing pressure in oligotrophic Aegean environments [116,117]. It is important to note that differences in fishing gear may influence the observed size composition of catches. In the present study, specimens were collected using a commercial bottom otter trawl with a codend mesh size (bar length) of 28 mm. In contrast, Soykan et al. [42] used a demersal trawl with a 40 mm mesh size (knotted polyethylene netting). Although finer mesh generally retains smaller individuals more effectively, our sample was still dominated by larger, mature fish (mean TL = 16.86 cm), whereas Soykan et al. [42] reported a much smaller mean size (9.6 cm) and a high proportion of juveniles. This suggests that the contrasting size structures are unlikely to be driven primarily by gear selectivity but rather reflect genuine ecological or demographic differences between the two areas, such as variations in recruitment intensity, local productivity, habitat use, or fishing pressure.
Populations off Angola in the eastern Atlantic exhibited a larger size structure, with a mean total length of 26.69 cm (22.7 cm fork length) and a range of 18.85–37.91 cm (15.6–33.1 cm fork length) [43], likely due to higher productivity in upwelling systems [118,119].
The length–weight relationships demonstrated negative allometric growth (b < 3), with scaling exponents significantly below the isometric expectation (b = 3). This indicates that individuals become relatively less heavy for their length as they grow, a pattern that reflects changes in body form or energy allocation rather than ontogenetic allometry and is often associated with energy allocation trade-offs in nutrient-poor habitats [120]. This negative allometry contrasts with the positive allometric growth (b = 3.03) reported by Soykan et al. [42] for a combined population, a difference that may stem from their juvenile-dominated sampling or distinct environmental conditions [121,122]. Furthermore, sexual dimorphism was evident, as males exhibited a slightly higher b value than females, suggesting divergent growth strategies where females may prioritize reproductive investment while males allocate more energy to somatic growth [123,124].

4.2. Age and Growth

Age composition revealed eight classes, predominantly 3–5 years, consistent with [42], who identified ages from 1 to 5 years in Aegean D. macrophthalmus indicating a population with limited observed longevity. This contrasts sharply with the maximum ages reported for Atlantic D. macrophthalmus (36–38 years) [43]. Critically, this discrepancy is likely attributable to methodological disparity, rather than solely to environmental or genetic factors. Our study used whole otoliths, whereas Potts et al. [43] employed transverse otolith sections, the latter being far more reliable for aging older fish. Whole otoliths are prone to underestimating age, especially beyond 10 years, as inner annuli become compressed and indistinct. Thus, the true longevity of Aegean D. macrophthalmus may be greater than observed. That said, genuine ecological differences such as the oligotrophic conditions of the Aegean Sea versus the highly productive upwelling systems off Angola, may also constrain growth and reduce lifespan. Additionally, higher fishing pressure in the Mediterranean could increase mortality and selectively remove older individuals, truncating the age distribution.
A key assumption underlying our age estimates is the annual formation of opaque–translucent band pairs in sagittal otoliths. While this is a widely accepted convention for sparids in temperate regions, it requires empirical validation. In the absence of direct validation methods, we used the monthly proportion of hyaline versus opaque otolith edges as circumstantial evidence. The dominance of hyaline edges in May, coinciding with the transition from winter (low growth) to spring (onset of rapid growth), is consistent with annual band formation. However, this approach cannot confirm periodicity and may be confounded by environmental variability or individual growth histories. Future studies should implement robust validation protocols to confirm the annual nature of growth increments in D. macrophthalmus, particularly as this species gains relevance in Mediterranean fisheries.
Several mechanisms may explain the observed differences in age structure and longevity between Aegean and Atlantic populations. Environmental conditions are likely a major factor: the Aegean Sea is characterized by oligotrophic waters with lower primary productivity, which may limit food availability and growth rates, leading to shorter lifespans, while in contrast, the Atlantic Ocean provides more productive ecosystems, supporting larger and longer-lived individuals [117,125,126,127,128]. Anthropogenic pressures, particularly fishing, may further influence population structure [129]. Intensive fishing in the Aegean Sea could increase mortality rates and selectively remove older individuals, thereby truncating age distributions [37]. Atlantic populations, often subject to more regulated fisheries, may retain a wider range of age classes, contributing to observed differences in maximum lifespan [130]. Genetic factors and life-history strategies may also contribute. Populations may differ genetically in growth rates, reproductive timing, and longevity, reflecting adaptations to local environmental conditions [131]. For example, earlier maturation observed in the Aegean population may represent an adaptive response to higher mortality risk, resulting in shorter lifespans.
Although Bowker’s test indicated significant systematic bias and Cohen’s kappa showed moderate agreement, the visualization of maximum difference versus mean age demonstrated that these discrepancies were predominantly confined to a single year. The finding that over 97% of estimates fell within ±1 year across all age classes suggested that the precision is sufficient for use in age-structured stock assessment models, where misclassification by one year may have minimal impact on mortality estimates. These systematic discrepancies, though relatively small in magnitude, highlight the importance of reader calibration and standardized aging criteria, particularly for boundary age classes where consistent application of aging rules becomes most challenging. The significant Bowker test results underscored that reader disagreement followed predictable patterns that could potentially be addressed through targeted training focused on specific age transitions where systematic biases are most pronounced.
The growth performance index provides a standardized metric for comparing growth across populations and studies. For the Pagasitikos Gulf population, φ′ was estimated at 2.076 (95% CI: 2.018–2.135). When calculated separately by sex using the reported von Bertalanffy parameters, females exhibited φ′ = 2.074 (CI: 2.006–2.142) and males φ′ = 2.035 (CI: 1.880–2.190). These values align closely with those reported by Soykan [42] for the east–central Aegean Sea, which yields φ′ = 2.244, suggesting comparable overall growth performance despite methodological and demographic differences. In contrast, Potts et al. [43] reported substantially higher L∞ (39.90 cm TL) and lower k (0.12 yr−1) for Angolan D. macrophthalmus, resulting in φ′ = 2.280. The slightly lower φ′ in our study may reflect the oligotrophic conditions of the Pagasitikos Gulf, which can constrain somatic growth compared to the highly productive upwelling system off Angola. The observed sexual dimorphism, males attaining larger L∞ but slower k, results in similar φ′ between sexes, underscoring that both strategies achieve comparable lifetime growth performance, with potential implications for differential vulnerability to size-selective fishing.

4.3. Mortality, Exploitation Rates, and Length at First Capture

Natural mortality (M = 0.37 yr−1), total mortality (Z = 0.63 yr−1), and fishing mortality (F = 0.26 yr−1) estimated for D. macrophthalmus in Pagasitikos Gulf indicate moderate population turnover compared to other small-bodied sparids (e.g., [37]). These values are lower than those reported in the east–central Aegean Sea (M = 0.734 yr−1, Z = 1.598 yr−1, F = 0.863 yr−1) for D. macrophthalmus [42], reflecting less intensive fishing pressure in Pagasitikos Gulf. The exploitation rate (E = 0.41) confirms an underexploited population, contrasting with the higher E = 0.540 in the Aegean [42] and the widespread overexploitation observed in many Mediterranean demersal fisheries, where 70% of targeted stocks and 44% of non-targeted stocks experience fishing mortality above sustainable levels (F > Fmsy) [47]. Unlike heavily exploited sparids, D. macrophthalmus presents a unique opportunity for proactive management to sustainably integrate this resource into regional fisheries without risking overexploitation. The length at maximum biomass (Le = 14.7 cm) and probability of capture (Lc25 = 15.57 cm, Lc50 = 16.12 cm, Lc75 = 16.48 cm), corresponding to an age at 50% capture probability (t50 = 3.5 years), align with the population’s dominant 3–5-year cohorts. These values exceed the length-at-first-maturity (Lm = 10.83 cm for females, 11.77 cm for males) in the Aegean [42] but are below Lm50 ≈ 19.45 cm TL in Angola [43], suggesting fishing practices primarily target mature individuals, minimizing juvenile mortality. However, given the species’ slow growth (k = 0.153–0.191 yr−1), compliance with minimum landing sizes and monitoring juvenile catch rates are critical.
Currently, no formal minimum commercial reference landing size (MCRS) exists for D. macrophthalmus in Greek waters, leaving the population vulnerable to potential overharvesting of immature individuals if fishing pressure increases. Establishing an evidence-based MCRS, ideally above the length at first maturity (Lm), would provide a regulatory mechanism to ensure that most individuals can reproduce before being captured. Implementing such a size limit, combined with monitoring of size–frequency distributions in catches, would support sustainable exploitation, protect the dominant reproductive cohorts, and contribute to long-term population resilience. Additionally, periodic reassessment of MCRS in relation to growth parameters and environmental conditions would help adapt management measures to potential shifts in population dynamics.

4.4. Machine Learning Models for Age Prediction

The integration of machine learning (ML) models for age prediction in D. macrophthalmus represents a significant advancement in fisheries research, particularly for automating age estimation from otolith morphometrics, as also demonstrated by [132]. The Neural Network model achieved the highest performance (R2 = 0.764, MSE = 0.429, MAPE = 14.10%), outperforming Stochastic Gradient Descent (SGD), Random Forest (RF), and Support Vector Machine (SVM) models. This superior performance can be attributed to the Neural Network’s ability to capture complex, non-linear relationships between otolith features (e.g., otolith weight and aspect ratio) and age, which are often challenging to model using traditional statistical methods [90]. The SHAP analysis further highlighted otolith weight as the dominant predictor, with a high positive contribution to age estimation, consistent with its strong correlation with fish size and age [51]. The aspect ratio, while less influential, provided complementary information, enhancing model precision. The Random Forest model, while robust in handling high-dimensional data and non-linear relationships [97], showed lower performance likely due to overfitting on the relatively small dataset (n = 305) or limited feature diversity. Similarly, the SVM model’s performance was constrained by its sensitivity to kernel choice and hyperparameter tuning, which may not have been fully optimized for this dataset [94]. SGD, as a simpler optimization approach, performed comparably to the Neural Network in terms of error metrics (MSE ≈ 0.45), offering a computationally efficient alternative for larger datasets where training time is a concern [92]. However, its stochastic nature requires careful tuning to avoid convergence issues, which may explain its slightly lower R2 compared to the Neural Network.
The application of ML models in this study aligns with emerging trends in fisheries science, where deep learning and automated otolith analysis are reducing reliance on labor-intensive manual readings [91]. The Neural Network’s high accuracy and low error rates suggest it could be scaled to other sparid species or integrated into real-time monitoring systems, improving the efficiency of stock assessments. Nonetheless, model performance could be further enhanced by incorporating additional features, such as otolith shape descriptors or environmental variables, and by expanding the dataset to include a broader range of age classes and geographic regions.

4.5. Study Limitations

Despite the robust findings, this study has several limitations that warrant consideration. First, the sample size (n = 305) and geographic scope were limited to Pagasitikos Gulf, which may not fully represent the broader population dynamics of D. macrophthalmus across the Aegean Sea or Mediterranean. Spatial heterogeneity in environmental conditions, such as temperature, salinity, or prey availability, could influence growth and age structure, potentially limiting the generalizability of the von Bertalanffy parameters and mortality estimates [117]. Second, the reliance on otolith morphometrics for age prediction, while effective, may overlook other biological or ecological factors (e.g., genetic variability, diet) that influence age and growth.
Third, the machine learning models, particularly the Neural Network, may be sensitive to dataset size and feature selection. While the use of a 70/30 train–test split combined with stratified 10-fold cross-validation provides a robust internal validation framework, the relatively limited sample size (n = 305) inherently carries a risk of overfitting [88]. The performance metrics reported are therefore best interpreted as representing the model’s predictive capability within the Pagasitikos Gulf population under the studied conditions.
Fourth, the periodicity of otolith growth zones was not directly validated. Our age estimates were based on the assumption of annual band deposition, supported indirectly by edge-type composition and regional seasonality, but not confirmed through experimental or longitudinal methods. This introduces uncertainty in absolute age estimates, though relative age structure and growth trends were likely robust given the high inter-reader agreement (>97% within ±1 year) and biological plausibility of the results.
To truly demonstrate the generalizability of the developed age prediction model, validation on a fully independent, external dataset collected from a different geographic location or a subsequent period is essential. Such external validation would be the gold standard for confirming that the model has learned the underlying biological relationship between otolith morphometrics and age, rather than idiosyncratic patterns specific to our sample. Future research priorities should include applying this model to D. macrophthalmus populations from other areas of the Aegean and Mediterranean Seas. Furthermore, alternative strategies such as nested cross-validation or bootstrapping could be employed in future studies with similar sample sizes to obtain even more stable performance estimates. Finally, expanding the dataset to include a broader range of age classes and environmental conditions will be crucial for enhancing model robustness and ensuring its utility as a reliable tool for fisheries stock assessment across the species’ distribution [23].
A key limitation of our machine learning analysis is that the models were evaluated exclusively through cross-validation on a single dataset collected during a specific sampling period. This approach can lead to optimistically biased performance estimates and does not adequately assess the model’s robustness or generalizability to new, independent data. True validation requires testing on externally sourced data from different hauls, time periods, or geographic regions, which was not possible within the scope of this initial study due to the lack of an available independent dataset for D. macrophthalmus. Beyond validation, future research should also focus on expanding sampling efforts and incorporating multi-omics data to enhance model performance and generalizability across the species’ diverse habitats and population structures.

5. Conclusions

This study into the biology and age prediction of D. macrophthalmus in the Pagasitikos Gulf fills a critical knowledge gap for this understudied sparid in Greek waters, highlighting its potential as a supplementary fishery resource amid declining traditional stocks. Traditional analyses revealed a population dominated by mid-age cohorts (3–5 years), with sexually dimorphic growth patterns characterized by negative allometry, slow growth rates (k ≈ 0.19 yr−1), and an exploitation rate of 0.41, suggesting the stock is currently underexploited and resilient to moderate fishing pressure. Machine learning integration, especially the Neural Network model (R2 = 0.764), outperformed other algorithms in predicting age from otolith features, reducing errors compared to manual readings and enabling efficient, non-destructive assessments. These findings collectively underscore the biological suitability of D. macrophthalmus for sustainable integration into local fisheries, particularly as part of a broader strategy to diversify catches and reduce dependency on overexploited species. Establishing a minimum landing size (MLS) that ensures individuals reach maturity and spawn at least once, ideally above the L50 of 16.12 cm (corresponding to ~3.5 years of age), would safeguard reproductive potential and support long-term stock resilience. Furthermore, spatial management could be informed by the observed CPUE hotspot in the central–western gulf, which may represent a key aggregation or spawning area warranting protection or seasonal regulation.

Author Contributions

Conceptualization, D.K. and A.T.; methodology, D.K., A.T., D.P. and A.C.; software, D.K. and A.T.; validation, D.K., C.V., E.P., D.P., A.C., D.K. and A.T.; investigation, D.K., C.V., E.P., D.P. and A.C.; resources, D.K., C.V. and E.P.; data curation, C.V. and E.P.; writing—original draft preparation, D.K., A.T., C.V., E.P., D.P. and A.C.; writing—review and editing, D.K., A.T., C.V., E.P., D.P. and A.C.; visualization, D.K. and A.T.; supervision, D.K., D.P. and A.C.; project administration, D.K. funding acquisition, D.K. All authors have read and agreed to the published version of the manuscript.

Funding

This research received no external funding.

Institutional Review Board Statement

The specimens used in this study were collected from a commercial fishing vessel. All samples were obtained post-mortem from the commercial catch; no live specimens were handled or subjected to experimental procedures for the purposes of this study. Our research involved the standard biological analysis of already-deceased specimens (length/weight measurement, otolith extraction, and morphometric analysis), which falls outside the scope of activities requiring ethical approval for animal experimentation under national and institutional guidelines.

Informed Consent Statement

Not applicable.

Data Availability Statement

The raw data supporting the conclusions of this article will be made available by the authors on request.

Conflicts of Interest

The authors declare no conflicts of interest.

References

  1. FAO. The State of World Fisheries and Aquaculture 2024—Blue Transformation in Action; FAO: Rome, Italy, 2024. [Google Scholar] [CrossRef]
  2. Lloret, J.; Muñoz, M.; Casadevall, M. Threats Posed by Artisanal Fisheries to the Reproduction of Coastal Fish Species in a Mediterranean Marine Protected Area. Estuar. Coast. Shelf Sci. 2012, 113, 133–140. [Google Scholar] [CrossRef]
  3. Christensen, V.; Coll, M.; Piroddi, C.; Steenbeek, J.; Buszowski, J.; Pauly, D. A Century of Fish Biomass Decline in the Ocean. Mar. Ecol. Prog. Ser. 2014, 512, 155–166. [Google Scholar] [CrossRef]
  4. Leleu, K.; Pelletier, D.; Charbonnel, E.; Letourneur, Y.; Alban, F.; Bachet, F.; Boudouresque, C.F. Métiers, Effort and Catches of a Mediterranean Small-Scale Coastal Fishery: The Case of the Côte Bleue Marine Park. Fish. Res. 2014, 154, 93–101. [Google Scholar] [CrossRef]
  5. McClanahan, T.R.; Mangi, S.C. Gear—Based Management of a Tropical Artisanal Fishery Based on Species Selectivity and Capture Size. Fish. Manag. Ecol. 2004, 11, 51–60. [Google Scholar] [CrossRef]
  6. Humphries, A.T.; Gorospe, K.D.; Carvalho, P.G.; Yulianto, I.; Kartawijaya, T.; Campbell, S.J. Catch Composition and Selectivity of Fishing Gears in a Multi-Species Indonesian Coral Reef Fishery. Front. Mar. Sci. 2019, 6, 378. [Google Scholar] [CrossRef]
  7. Hiddink, J.G.; Jennings, S.; Sciberras, M.; Szostek, C.L.; Hughes, K.M.; Ellis, N.; Rijnsdorp, A.D.; McConnaughey, R.A.; Mazor, T.; Hilborn, R.; et al. Global Analysis of Depletion and Recovery of Seabed Biota after Bottom Trawling Disturbance. Proc. Natl. Acad. Sci. USA 2017, 114, 8301–8306. [Google Scholar] [CrossRef]
  8. Pusceddu, A.; Bianchelli, S.; Martín, J.; Puig, P.; Palanques, A.; Masqué, P.; Danovaro, R. Chronic and Intensive Bottom Trawling Impairs Deep-Sea Biodiversity and Ecosystem Functioning. Proc. Natl. Acad. Sci. USA 2014, 111, 8861–8866. [Google Scholar] [CrossRef]
  9. Hinz, H.; Prieto, V.; Kaiser, M.J. Trawl Disturbance on Benthic Communities: Chronic Effects and Experimental Predictions. Ecol. Appl. 2009, 19, 761–773. [Google Scholar] [CrossRef]
  10. Bănaru, D.; Harmelin-Vivien, M.; Boudouresque, C.F. Man Induced Change in Community Control in the North-Western Black Sea: The Top-down Bottom-up Balance. Mar. Environ. Res. 2010, 69, 262–275. [Google Scholar] [CrossRef]
  11. Myers, R.A.; Worm, B. Rapid Worldwide Depletion of Predatory Fish Communities. Nature 2003, 423, 280–283. [Google Scholar] [CrossRef]
  12. Touloumis, K.; Tsikliras, A.C.; Dimarchopoulou, D. The Cascading Effect of Fishing down Marine Top Predators in the Northeastern Mediterranean Sea. Discov. Ocean. 2025, 2, 22. [Google Scholar] [CrossRef]
  13. Piroddi, C.; Coll, M.; Liquete, C.; Macias, D.; Greer, K.; Buszowski, J.; Steenbeek, J.; Danovaro, R.; Christensen, V. Historical Changes of the Mediterranean Sea Ecosystem: Modelling the Role and Impact of Primary Productivity and Fisheries Changes over Time. Sci. Rep. 2017, 7, 44491. [Google Scholar] [CrossRef]
  14. Boudouresque, C.F. Marine Biodiversity—Warming vs. Biological Invasions and Overfishing in the Mediterranean Sea: Take Care, ‘One Train Can Hide Another’. MOJ Ecol. Environ. Sci. 2017, 2, 172–183. [Google Scholar] [CrossRef]
  15. Coll, M.; Piroddi, C.; Steenbeek, J.; Kaschner, K.; Ben Rais Lasram, F.; Aguzzi, J.; Ballesteros, E.; Bianchi, C.N.; Corbera, J.; Dailianis, T. The Biodiversity of the Mediterranean Sea: Estimates, Patterns, and Threats. PLoS ONE 2010, 5, e11842. [Google Scholar] [CrossRef] [PubMed]
  16. Nauen, C.E. When Mediterranean Artisanal Fishers Protect Coastal Ecosystems. Fishes 2024, 9, 472. [Google Scholar] [CrossRef]
  17. Cömert, N.; Deniz, T.; Göktürk, D. Sustainable Fisheries and Non-Target Species Management: A Seasonal and Depth-Based Study in the Deep-Sea Fisheries of Antalya Bay. Sustainability 2025, 17, 5040. [Google Scholar] [CrossRef]
  18. Caddy, J.F. Options for the Regulation of Mediterranean Demersal Fisheries. Nat. Resour. Model. 1990, 4, 427–475. [Google Scholar] [CrossRef]
  19. Papaconstantinou, C.; Farrugio, H. Fisheries in the Mediterranean. Mediterr. Mar. Sci. 2000, 1, 5–18. [Google Scholar] [CrossRef]
  20. Stergiou, K.I.; Somarakis, S.; Triantafyllou, G.; Tsiaras, K.P.; Giannoulaki, M.; Petihakis, G.; Machias, A.; Tsikliras, A.C. Trends in Productivity and Biomass Yields in the Mediterranean Sea Large Marine Ecosystem during Climate Change. Environ. Dev. 2016, 17, 57–74. [Google Scholar] [CrossRef]
  21. Fiorentino, F.; Vitale, S. How Can We Reduce the Overexploitation of the Mediterranean Resources? Front. Mar. Sci. 2021, 8, 674633. [Google Scholar] [CrossRef]
  22. FAO. The State of World Fisheries and Aquaculture 2020; Sustainability in Action; General Fisheries Commission for the Mediterranean: Rome, Italy, 2020. [Google Scholar] [CrossRef]
  23. Colloca, F.; Cardinale, M.; Maynou, F.; Giannoulaki, M.; Scarcella, G.; Jenko, K.; Bellido, J.M.; Fiorentino, F. Rebuilding Mediterranean Fisheries: A New Paradigm for Ecological Sustainability. Fish Fish. 2013, 14, 89–109. [Google Scholar] [CrossRef]
  24. Sumaila, U.R.; Bellmann, C.; Tipping, A. Fishing for the Future: An Overview of Challenges and Opportunities. Mar. Policy 2016, 69, 173–180. [Google Scholar] [CrossRef]
  25. Kondylatos, G.; Theocharis, A.; Mandalakis, M.; Avgoustinaki, M.; Karagyaurova, T.; Koulocheri, Z.; Vardali, S.; Klaoudatos, D. The Devil Firefish Pterois miles (Bennett, 1828): Life History Traits of a Potential Fishing Resource in Rhodes (Eastern Mediterranean). Hydrobiology 2024, 3, 31–50. [Google Scholar] [CrossRef]
  26. Blanco, M.; Sotelo, C.G.; Chapela, M.J.; Pérez-Martín, R.I. Towards Sustainable and Efficient Use of Fishery Resources: Present and Future Trends. Trends Food Sci. Technol. 2007, 18, 29–36. [Google Scholar] [CrossRef]
  27. Gracia, A.; Vázquez-Bader, A.R.; Lozano-Alvarez, E.; Briones-Fourzán, P. Deep-Water Shrimp (Crustacea: Penaeoidea) Off the Yucatan Peninsula (Southern Gulf of Mexico): A Potential Fishing Resource? J. Shellfish Res. 2010, 29, 37–43. [Google Scholar] [CrossRef]
  28. Paramo, J.; Saint-Paul, U. Deep-Sea Shrimps Aristaeomorpha foliacea and Pleoticus robustus (Crustacea: Penaeoidea) in the Colombian Caribbean Sea as a New Potential Fishing Resource. J. Mar. Biol. Assoc. United Kingdom 2012, 92, 811–818. [Google Scholar] [CrossRef]
  29. Harrington, J.M.; Myers, R.A.; Rosenberg, A.A. Wasted Fishery Resources: Discarded by-Catch in the USA. Fish Fish. 2005, 6, 350–361. [Google Scholar] [CrossRef]
  30. Corrales, X.; Coll, M.; Ofir, E.; Heymans, J.J.; Steenbeek, J.; Goren, M.; Edelist, D.; Gal, G. Future Scenarios of Marine Resources and Ecosystem Conditions in the Eastern Mediterranean under the Impacts of Fishing, Alien Species and Sea Warming. Sci. Rep. 2018, 8, 14284. [Google Scholar] [CrossRef]
  31. Parenti, P. An Annotated Checklist of the Fishes of the Family Sparidae. FishTaxa 2019, 4, 47–98. [Google Scholar]
  32. Bargelloni, L.; Alarcon, J.A.; Alvarez, M.C.; Penzo, E.; Magoulas, A.; Reis, C.; Patarnello, T. Discord in the Family Sparidae (Teleostei): Divergent Phylogeographical Patterns across the Atlantic–Mediterranean Divide. J. Evol. Biol. 2003, 16, 1149–1158. [Google Scholar] [CrossRef]
  33. Hanel, R.; Tsigenopoulos, C.S. Phylogeny, Evolution and Taxonomy of Sparids with Some Notes on Their Ecology and Biology. In Sparidae; Pavlidis, M.A., Mylonas, C.C., Eds.; Wiley: Hoboken, NJ, USA, 2011; pp. 51–73. ISBN 978-1-4051-9772-4 978-1-4443-9221-0. [Google Scholar]
  34. Vandewalle, P.; Parmentier, É.; Chardon, M. The Branchial Basket in Teleost Feeding. Cybium 2000, 24, 319–342. [Google Scholar]
  35. Antonucci, F.; Costa, C.; Aguzzi, J.; Cataudella, S. Ecomorphology of Morpho—Functional Relationships in the Family of Sparidae: A Quantitative Statistic Approach. J. Morphol. 2009, 270, 843–855. [Google Scholar] [CrossRef]
  36. De Azevedo, A.M.; Fontanillas, R.; Owen, M.A.G.; Busti, S.; Parma, L.; Bonaldo, A.; Witten, P.E.; Huysseune, A. A Quantitative Analysis of Gilthead Seabream (Sparus aurata) Juvenile Dentition as a Tool to Assess the Effect of Diet. Can. J. Zool. 2021, 99, 548–556. [Google Scholar] [CrossRef]
  37. Theocharis, A.; Vardali, S.; Klaoudatos, D. Age, Growth, and Mortality of the Common Pandora (Pagellus erythrinus, L. 1758) in the Central Aegean Sea: Insights into Population Dynamics. Fishes 2025, 10, 160. [Google Scholar] [CrossRef]
  38. Marguin, A.; Bussotti, S.; Guidetti, P.; Rossi, F. A Systematic Review of Fishing Impacts on the Trophic Level of Fish Populations and Assemblages in the Mediterranean Sea. Front. Mar. Sci. 2025, 12, 1489965. [Google Scholar] [CrossRef]
  39. Clottey, M.N.K.; Aggrey-Fynn, J.; Blay, J.; Kwasi Arizi, E. Stock Assessment and Reproductive Biology of Bluespotted Seabream Pagrus caeruleostictus (Family: Sparidae). Aquac. Fish Fish. 2024, 4, e163. [Google Scholar] [CrossRef]
  40. Parker, D.; Winker, H.; Attwood, C.; Kerwath, S. Dark Times for Dageraad Chrysoblephus cristiceps: Evidence for Stock Collapse. African J. Mar. Sci. 2016, 38, 341–349. [Google Scholar] [CrossRef]
  41. Oosthuizen, C.; Mann, B.; Bloomer, P.; Hoareau, T. Genetic Consequences in the Southern African Endemic Seabream Polysteganus undulosus (Sparidae) after Eight Decades of Overfishing. African J. Mar. Sci. 2024, 46, 205–216. [Google Scholar] [CrossRef]
  42. Soykan, O.; Ilkyaz, A.; Metin, G.; Kınacıgil, H.T. Growth and Reproduction of Boops boops, Dentex macrophthalmus, Diplodus vulgaris, and Pagellus acarne (Actinopterygii: Perciformes: Sparidae) from East-Central Aegean Sea, Turkey. Acta Ichthyol. Piscat. 2015, 45, 39–55. [Google Scholar] [CrossRef]
  43. Potts, W.M.; Inácio, L.A.; Santos, C.V.; Richardson, T.J.; Sauer, W.H. Aspects of the Biology and Fisheries of an Economically Important Sparid Dentex macrophthalmus (Bloch 1791) in the Namibe Province, Angola. African J. Mar. Sci. 2010, 32, 601–611. [Google Scholar] [CrossRef]
  44. FishBase Dentex Macrophthalmus (Bloch, 1791) Large-Eye Dentex. Available online: https://www.fishbase.se/FieldGuide/FieldGuideSummary.php?GenusName=Dentex&SpeciesName=macrophthalmus&pda=1&sps= (accessed on 26 August 2025).
  45. Ulman, A.; Zengin, M.; Demirel, N.; Pauly, D. The Lost Fish of Turkey: A Recent History of Disappeared Species and Commercial Fishery Extinctions for the Turkish Marmara and Black Seas. Front. Mar. Sci. 2020, 7, 650. [Google Scholar] [CrossRef]
  46. Roussos, E.; Triantaphyllidis, G.; Ilia, V.; Tsagarakis, K.; Machias, A.; Tziveleka, L.-A.; Roussis, V.; Ioannou, E.; Kotzamanis, Y. Status of Fishery Discards and By-Products in Greece and Potential Valorization Scenarios towards a National Exploitation Master Plan. Mar. Drugs 2024, 22, 264. [Google Scholar] [CrossRef] [PubMed]
  47. Tsikliras, A.C.; Touloumis, K.; Pardalou, A.; Adamidou, A.; Keramidas, I.; Orfanidis, G.A.; Dimarchopoulou, D.; Koutrakis, M. Status and Exploitation of 74 Un-Assessed Demersal Fish and Invertebrate Stocks in the Aegean Sea (Greece) Using Abundance and Resilience. Front. Mar. Sci. 2021, 7, 578601. [Google Scholar] [CrossRef]
  48. Kilongo, K.; Barros, P.; Diehdiou, M. Diet of Large-Eye Dentex Dentex macrophthalmus (Pisces: Sparidae) off Angola and Namibia. African J. Mar. Sci. 2007, 29, 49–54. [Google Scholar] [CrossRef]
  49. Fernández-Corredor, E.; Fuster-Alonso, A.; Ramírez, F.; Giménez, J.; García-Barcelona, S.; Macías, D.; Coll, M.; Navarro, J. Environmental and Human Factors Shape the Trophic Ecology of a Widespread Marine Predator. J. Anim. Ecol. 2025, 94, 1784–1799. [Google Scholar] [CrossRef]
  50. Bizzarro, J.J.; Field, J.C.; Santora, J.A.; Curtis, K.A.; Wells, B.K. Trophic Guilds of Marine Predators in the California Current Large Marine Ecosystem. Front. Mar. Sci. 2023, 10, 1195000. [Google Scholar] [CrossRef]
  51. Tuset, V.M.; Lozano, I.J.; González, J.A.; Pertusa, J.F.; García-Díaz, M.M. Shape Indices to Identify Regional Differences in Otolith Morphology of Comber, Serranus cabrilla (L., 1758). J. Appl. Ichthyol. 2003, 19, 88–93. [Google Scholar] [CrossRef]
  52. Moore, B.R.; Parker, S.J.; Pinkerton, M.H. Otolith Shape as a Tool for Species Identification of the Grenadiers Macrourus caml and M. whitsoni. Fish. Res. 2022, 253, 106370. [Google Scholar] [CrossRef]
  53. Tuset, V.M.; Lombarte, A.; González, J.A.; Pertusa, J.F.; Lorente, M.A.J. Comparative Morphology of the Sagittal Otolith in Serranus spp. J. Fish Biol. 2003, 63, 1491–1504. [Google Scholar] [CrossRef]
  54. Russ, J.C. Computer-Assisted Microscopy: The Measurement and Analysis of Images; Springer Science & Business Media: Berlin/Heidelberg, Germany, 2012; ISBN 1461305632. [Google Scholar]
  55. Carbonara, P.; Follesa, M.C. Handbook on Fish Age Determination: A Mediterranean Experience. Gen. Fish. Comm. Mediterr. Stud. Rev. 2019, 98, 1–179. [Google Scholar]
  56. Campana, S. Accuracy, Precision and Quality Control in Age Determination, Including a Review of the Use and Abuse of Age Validation Methods. J. Fish Biol. 2001, 59, 197–242. [Google Scholar] [CrossRef]
  57. Chang, W.Y.B. A Statistical Method for Evaluating the Reproducibility of Age Determination. Can. J. Fish. Aquat. Sci. 1982, 39, 1208–1210. [Google Scholar] [CrossRef]
  58. Kimura, D.K. Between-Reader Bias and Variability in the Age-Determination Process. Fish. Bull. 1991, 89, 53–61. [Google Scholar]
  59. Bowker, A.H. A Test for Symmetry in Contingency Tables. J. Am. Stat. Assoc. 1948, 43, 572–574. [Google Scholar] [CrossRef] [PubMed]
  60. Cohen, J. A Coefficient of Agreement for Nominal Scales. Educ. Psychol. Meas. 1960, 20, 37–46. [Google Scholar] [CrossRef]
  61. Landis, J.R.; Koch, G.G. The Measurement of Observer Agreement for Categorical Data. Biometrics 1977, 33, 159–174. [Google Scholar] [CrossRef] [PubMed]
  62. Morgenthaler, S. Exploratory Data Analysis. Wiley Interdiscip. Rev. Comput. Stat. 2009, 1, 33–44. [Google Scholar] [CrossRef]
  63. Hampton, R.E.; Havel, J.E. Introductory Biological Statistics; Waveland Press: Long Grove, IL, USA, 2006; ISBN 1577663802. [Google Scholar]
  64. Krishnamoorthy, K.; Lu, F.; Mathew, T. A Parametric Bootstrap Approach for ANOVA with Unequal Variances: Fixed and Random Models. Comput. Stat. Data Anal. 2007, 51, 5731–5742. [Google Scholar] [CrossRef]
  65. Şahin, M.; Aybek, E. Jamovi: An Easy to Use Statistical Software for the Social Scientists. Int. J. Assess. Tools Educ. 2019, 6, 670–692. [Google Scholar] [CrossRef]
  66. Rolke, W.; Gongora, C.G. A Chi-Square Goodness-of-Fit Test for Continuous Distributions against a Known Alternative. Comput. Stat. 2021, 36, 1885–1900. [Google Scholar] [CrossRef]
  67. Munro, J.L.; Pauly, D. A Simple Method for Comparing the Growth of Fishes and Invertebrates. Fishbyte 1983, 1, 5–6. [Google Scholar]
  68. Zar, J.H. Biostatistical Analysis, 5th ed.; Pearson Education: Chennai, India, 2014; ISBN 1-292-02404-6. [Google Scholar]
  69. Sall, J.; Stephens, M.L.; Lehman, A.; Loring, S. JMP Start Statistics: A Guide to Statistics and Data Analysis Using JMP; Sas Institute: Cary, NC, USA, 2017; ISBN 1629608785. [Google Scholar]
  70. Pebesma, E. Simple Features for R: Standardized Support for Spatial Vector Data. R. J. 2018, 10, 439–446. [Google Scholar] [CrossRef]
  71. Wickham, H. Data Analysis. In ggplot2: Elegant Graphics for Data Analysis; Springer: Berlin/Heidelberg, Germany, 2016; pp. 189–201. [Google Scholar]
  72. Amante, C.; Eakins, B.W. ETOPO1 Arc-Minute Global Relief Model: Procedures, Data Sources and Analysis. 2009. Available online: https://www.ncei.noaa.gov/access/metadata/landing-page/bin/iso?id=gov.noaa.ngdc.mgg.dem:316 (accessed on 1 September 2025).
  73. Patterson, T.; Kelso, N.V. Natural Earth. Available online: https://www.naturalearthdata.com/ (accessed on 17 July 2025).
  74. Akima, H. A Method of Bivariate Interpolation and Smooth Surface Fitting for Irregularly Distributed Data Points. ACM Trans. Math. Softw. 1978, 4, 148–159. [Google Scholar] [CrossRef]
  75. Campitelli, E. MetR: Tools for Easier Analysis of Meteorological Fields. R Package. 2021. Available online: https://eliocamp.github.io/metR/reference/metR.html (accessed on 1 September 2025).
  76. Wickham, H. Ggplot2: Elegant Graphics for Data Analysis; Springer: New York, NY, USA, 2016; ISBN 978-3-319-24277-4. Available online: https://ggplot2.tidyverse.org (accessed on 1 September 2025).
  77. Petitgas, P. Geostatistics for Fish Stock Assessments: A Review and an Acoustic Application. ICES J. Mar. Sci. 1993, 50, 285–298. [Google Scholar] [CrossRef]
  78. Von Bertalanffy, L. A Quantitative Theory of Organic Growth (Inquiries on Growth Laws. II). Hum. Biol. 1938, 10, 181–213. [Google Scholar]
  79. Haddon, M. Modelling and Quantitative Methods in Fisheries, 2nd ed.; Chapman and Hall/CRC: New York, NY, USA, 2011; ISBN 0429109490. [Google Scholar]
  80. Cerrato, R.M. Interpretable Statistical Tests for Growth Comparisons Using Parameters in the von Bertalanffy Equation. Can. J. Fish. Aquat. Sci. 1990, 47, 1416–1426. [Google Scholar] [CrossRef]
  81. Pauly, D. Some Simple Methods for the Assessment of Tropical Fish Stocks; FAO: Rome, Italy, 1983; ISBN 9251013330. [Google Scholar]
  82. Then, A.Y.; Hoenig, J.M.; Hall, N.G.; Hewitt, D.A. Evaluating the Predictive Performance of Empirical Estimators of Natural Mortality Rate Using Information on over 200 Fish Species. ICES J. Mar. Sci. 2015, 72, 82–92. [Google Scholar] [CrossRef]
  83. Sparre, P.; Ursin, A.; Venema, S.C. Introduction to Tropical Fish Stock Assessment, Manual. Part 1; FAO Fish. Technical Paper 306; FAO: Rome, Italy, 1989; p. 218. [Google Scholar]
  84. Froese, R.; Binohlan, C. Empirical Relationships to Estimate Asymptotic Length, Length at First Maturity and Length at Maximum Yield per Recruit in Fishes, with a Simple Method to Evaluate Length Frequency Data. J. Fish Biol. 2000, 56, 758–773. [Google Scholar] [CrossRef]
  85. Hoggarth, D. Stock Assessment for Fishery Management: A Framework Guide to the Stock Assessment Tools of the Fisheries Management and Science Programme; Food and Agriculture Organization: Rome, Italy, 2006; ISBN 9251055033. [Google Scholar]
  86. Pauly, D. Theory and Management of Tropical Multispecies Stocks: A Review, with Emphasis on the Southeast Asian Demersal Fisheries. 1979. Available online: https://digitalarchive.worldfishcenter.org/server/api/core/bitstreams/928bc397-ff93-4572-aac0-af3cf5ccd34d/content (accessed on 30 September 2025).
  87. Demšar, J.; Curk, T.; Erjavec, A.; Gorup, Č.; Hočevar, T.; Milutinovič, M.; Možina, M.; Polajnar, M.; Toplak, M.; Starič, A.; et al. Orange: Data Mining Toolbox in Python. J. Mach. Learn. Res. 2013, 14, 2349–2353. [Google Scholar]
  88. Zhu, J.-J.; Yang, M.; Ren, Z.J. Machine Learning in Environmental Research: Common Pitfalls and Best Practices. Environ. Sci. Technol. 2023, 57, 17671–17689. [Google Scholar] [CrossRef]
  89. Wallisch, P.; Lusignan, M.E.; Benayoun, M.D.; Baker, T.I.; Dickey, A.S.; Hatsopoulos, N.G. Chapter 36—Neural Networks Part I: Unsupervised Learning, 2nd ed.; Wallisch, P., Lusignan, M.E., Benayoun, M.D., Baker, T.I., Dickey, A.S., Hatsopoulos, N.G.B.T.-M., Eds.; Academic Press: San Diego, CA, USA, 2014; pp. 489–500. ISBN 978-0-12-383836-0. [Google Scholar]
  90. Politikos, D.V.; Petasis, G.; Chatzispyrou, A.; Mytilineou, C.; Anastasopoulou, A. Automating Fish Age Estimation Combining Otolith Images and Deep Learning: The Role of Multitask Learning. Fish. Res. 2021, 242, 106033. [Google Scholar] [CrossRef]
  91. Politikos, D.V.; Sykiniotis, N.; Petasis, G.; Dedousis, P.; Ordoñez, A.; Vabø, R.; Anastasopoulou, A.; Moen, E.; Mytilineou, C.; Salberg, A.-B. DeepOtolith v1. 0: An Open-Source AI Platform for Automating Fish Age Reading from Otolith or Scale Images. Fishes 2022, 7, 121. [Google Scholar] [CrossRef]
  92. Ruder, S. An Overview of Gradient Descent Optimization Algorithms. arXiv 2016, arXiv:1609.04747. [Google Scholar]
  93. Bottou, L. Stochastic Gradient Descent Tricks. In Neural Networks: Tricks of the Trade: Second Edition; Springer: Berlin/Heidelberg, Germany, 2012; pp. 421–436. [Google Scholar]
  94. Noble, W.S. What Is a Support Vector Machine? Nat. Biotechnol. 2006, 24, 1565–1567. [Google Scholar] [CrossRef] [PubMed]
  95. Pisner, D.A.; Schnyer, D.M. Chapter 6—Support Vector Machine; Mechelli, A., Vieira, S.B.T.-M.L., Eds.; Academic Press: San Diego, CA, USA, 2020; pp. 101–121. ISBN 978-0-12-815739-8. [Google Scholar]
  96. Ben-Hur, A.; Weston, J. A User’s Guide to Support Vector Machines. In Data Mining Techniques for the Life Sciences; Springer: Berlin/Heidelberg, Germany, 2009; pp. 223–239. [Google Scholar]
  97. Breiman, L. Random Forests. Mach. Learn. 2001, 45, 5–32. [Google Scholar] [CrossRef]
  98. Hastie, T.; Tibshirani, R.; Friedman, J.H.; Friedman, J.H. The Elements of Statistical Learning: Data Mining, Inference, and Prediction, 2nd ed.; Springer: Berlin/Heidelberg, Germany, 2017; Volume 2. [Google Scholar]
  99. Luan, J.; Zhang, C.; Xu, B.; Xue, Y.; Ren, Y. The Predictive Performances of Random Forest Models with Limited Sample Size and Different Species Traits. Fish. Res. 2020, 227, 105534. [Google Scholar] [CrossRef]
  100. Sun, Y.; Zhao, Y.; Wu, J.; Liu, N.; Kang, X.; Wang, S.; Zhou, D. An Explainable Machine Learning Model for Identifying Geographical Origins of Sea Cucumber Apostichopus Japonicus Based on Multi-Element Profile. Food Control 2022, 134, 108753. [Google Scholar] [CrossRef]
  101. James, G.; Witten, D.; Hastie, T.; Tibshirani, R. An Introduction to Statistical Learning: With Applications in R; Springer: Berlin/Heidelberg, Germany, 2013; Volume 103. [Google Scholar]
  102. Hyndman, R.J.; Koehler, A.B. Another Look at Measures of Forecast Accuracy. Int. J. Forecast. 2006, 22, 679–688. [Google Scholar] [CrossRef]
  103. Willmott, C.J.; Matsuura, K. Advantages of the Mean Absolute Error (MAE) over the Root Mean Square Error (RMSE) in Assessing Average Model Performance. Clim. Res. 2005, 30, 79–82. [Google Scholar] [CrossRef]
  104. De Myttenaere, A.; Golden, B.; Le Grand, B.; Rossi, F. Mean Absolute Percentage Error for Regression Models. Neurocomputing 2016, 192, 38–48. [Google Scholar] [CrossRef]
  105. Draper, N.R. Applied Regression Analysis; McGraw-Hill. Inc.: Columbus, OH, USA, 1998. [Google Scholar]
  106. Hastie, T.; Tibshirani, R.; Friedman, J.; Franklin, J. The Elements of Statistical Learning: Data Mining, Inference and Prediction. Math. Intell. 2005, 27, 83–85. [Google Scholar] [CrossRef]
  107. Hyndman, R.J.; Athanasopoulos, G. Forecasting: Principles and Practice. Available online: https://otexts.com/fpp3 (accessed on 1 September 2025).
  108. Froese, R. Cube Law, Condition Factor and Weight–Length Relationships: History, Meta-analysis and Recommendations. J. Appl. Ichthyol. 2006, 22, 241–253. [Google Scholar] [CrossRef]
  109. Akyol, O.; Gamsiz, K. Age and Growth of Adult Gilthead Seabream (Sparus aurata L.) in the Aegean Sea. J. Mar. Biol. Assoc. United Kingd. 2011, 91, 1255–1259. [Google Scholar] [CrossRef]
  110. Marengo, M.; Durieux, E.D.H.; Marchand, B.; Francour, P. A Review of Biology, Fisheries and Population Structure of Dentex dentex (Sparidae). Rev. Fish Biol. Fish. 2014, 24, 1065–1088. [Google Scholar] [CrossRef]
  111. Vasilakopoulos, P.; Maravelias, C.D.; Tserpes, G. The Alarming Decline of Mediterranean Fish Stocks. Curr. Biol. 2014, 24, 1643–1648. [Google Scholar] [CrossRef]
  112. Desouky, M.G.; Azab, A.M.; Maaty, M.M. Length-Weight Relationship and Population Parameters of the Sea Bream, Sparus aurata (Linnaeus, 1758) in Abu Qir Bay, Mediterranean Sea, Egypt. Egypt. J. Aquat. Biol. Fish. 2021, 25, 97. [Google Scholar] [CrossRef]
  113. Moore, J.W.; Yeakel, J.D.; Peard, D.; Lough, J.; Beere, M. Life-history Diversity and Its Importance to Population Stability and Persistence of a Migratory Fish: Steelhead in Two Large N Orth A Merican Watersheds. J. Anim. Ecol. 2014, 83, 1035–1046. [Google Scholar] [CrossRef]
  114. King, J.R.; McFarlane, G.A. Marine Fish Life History Strategies: Applications to Fishery Management. Fish. Manag. Ecol. 2003, 10, 249–264. [Google Scholar] [CrossRef]
  115. Neubauer, P.; Jensen, O.P.; Hutchings, J.A.; Baum, J.K. Resilience and Recovery of Overexploited Marine Populations. Science 2013, 340, 347–349. [Google Scholar] [CrossRef]
  116. Legaki, A.; Chatzispyrou, A.; Damalas, D.; Sgardeli, V.; Lefkaditou, E.; Anastasopoulou, A.; Dogrammatzi, A.; Charalampous, K.; Stamouli, C.; Vassilopoulou, V.; et al. Decline in Size-at-Maturity of European Hake in Relation to Environmental Regimes: A Case in the Eastern Ionian Sea. Animals 2023, 14, 61. [Google Scholar] [CrossRef]
  117. Tsagarakis, K.; Coll, M.; Giannoulaki, M.; Somarakis, S.; Papaconstantinou, C.; Machias, A. Food-Web Traits of the North Aegean Sea Ecosystem (Eastern Mediterranean) and Comparison with Other Mediterranean Ecosystems. Estuar. Coast. Shelf Sci. 2010, 88, 233–248. [Google Scholar] [CrossRef]
  118. Körner, M.; Brandt, P.; Dengler, M. Strength and Timing of Austral Winter Angolan Coastal Upwelling. Sci. Rep. 2024, 14, 27400. [Google Scholar] [CrossRef] [PubMed]
  119. Imbol Koungue, R.A.; Brandt, P.; Prigent, A.; Aroucha, L.C.; Lübbecke, J.; Imbol Nkwinkwa, A.S.N.; Dengler, M.; Keenlyside, N. Drivers and Impact of the 2021 Extreme Warm Event in the Tropical Angolan Upwelling System. Sci. Rep. 2024, 14, 16824. [Google Scholar] [CrossRef] [PubMed]
  120. Busch, S.; Mehner, T. Size-Dependent Patterns of Diel Vertical Migration: Smaller Fish May Benefit from Faster Ascent. Behav. Ecol. 2012, 23, 210–217. [Google Scholar] [CrossRef]
  121. Wang, J.-Y.; Kuo, T.-C.; Hsieh, C. Causal Effects of Population Dynamics and Environmental Changes on Spatial Variability of Marine Fishes. Nat. Commun. 2020, 11, 2635. [Google Scholar] [CrossRef]
  122. Hussein, A.-S.R.; Younes, G.O.; El-Dakdouki, M.H. Impact of Environmental Conditions on Allometric and Morphometric Traits of Fish in Jiyeh, Lebanon: A Multivariate Analysis. Egypt. J. Aquat. Res. 2025, in press. [CrossRef]
  123. Mahamat, M.; De León, L.F.; Martínez, M.L. Reproductive Investment in the Knifefish Brachyhypopomus occidentalis. Zoology 2025, 172, 126293. [Google Scholar] [CrossRef]
  124. Chen, H.; Jiang, D.; Li, Z.; Wang, Y.; Yang, X.; Li, S.; Li, S.; Yang, W.; Li, G. Comparative Physiological and Transcriptomic Profiling Offers Insight into the Sexual Dimorphism of Hepatic Metabolism in Size-Dimorphic Spotted Scat (Scatophagus argus). Life 2021, 11, 589. [Google Scholar] [CrossRef]
  125. Reich, T.; Ben-Ezra, T.; Belkin, N.; Tsemel, A.; Aharonovich, D.; Roth-Rosenberg, D.; Givati, S.; Bialik, M.; Herut, B.; Berman-Frank, I.; et al. A Year in the Life of the Eastern Mediterranean: Monthly Dynamics of Phytoplankton and Bacterioplankton in an Ultra-Oligotrophic Sea. Deep Sea Res. Part I Oceanogr. Res. Pap. 2022, 182, 103720. [Google Scholar] [CrossRef]
  126. Keramidas, I.; Dimarchopoulou, D.; Tsikliras, A.C. Modelling and Assessing the Ecosystem of the Aegean Sea, a Major Hub of the Eastern Mediterranean at the Intersection of Europe and Asia. Reg. Stud. Mar. Sci. 2022, 56, 102704. [Google Scholar] [CrossRef]
  127. Ducklow, H.; Cimino, M.; Dunton, K.H.; Fraser, W.R.; Hopcroft, R.R.; Ji, R.; Miller, A.J.; Ohman, M.D.; Sosik, H.M. Marine Pelagic Ecosystem Responses to Climate Variability and Change. Bioscience 2022, 72, 827–850. [Google Scholar] [CrossRef]
  128. Fox, J.; Behrenfeld, M.J.; Haëntjens, N.; Chase, A.; Kramer, S.J.; Boss, E.; Karp-Boss, L.; Fisher, N.L.; Penta, W.B.; Westberry, T.K.; et al. Phytoplankton Growth and Productivity in the Western North Atlantic: Observations of Regional Variability From the NAAMES Field Campaigns. Front. Mar. Sci. 2020, 7, 24. [Google Scholar] [CrossRef]
  129. Hatmar, W.S.M.; Aiman, U. Overfishing and Marine Ecosystem Collapse: A Global Perspective. J. Soc. 2024, 1, 273–289. [Google Scholar]
  130. Ohlberger, J.; Langangen, Ø.; Stige, L.C. Age Structure Affects Population Productivity in an Exploited Fish Species. Ecol. Appl. 2022, 32, e2614. [Google Scholar] [CrossRef]
  131. Winemiller, K.O. Life History Strategies, Population Regulation, and Implications for Fisheries Management. Can. J. Fish. Aquat. Sci. 2005, 62, 872–885. [Google Scholar] [CrossRef]
  132. Klaoudatos, D.; Vlachou, M.; Theocharis, A. From Data to Insight: Machine Learning Approaches for Fish Age Prediction in European Hake. J. Mar. Sci. Eng. 2024, 12, 1466. [Google Scholar] [CrossRef]
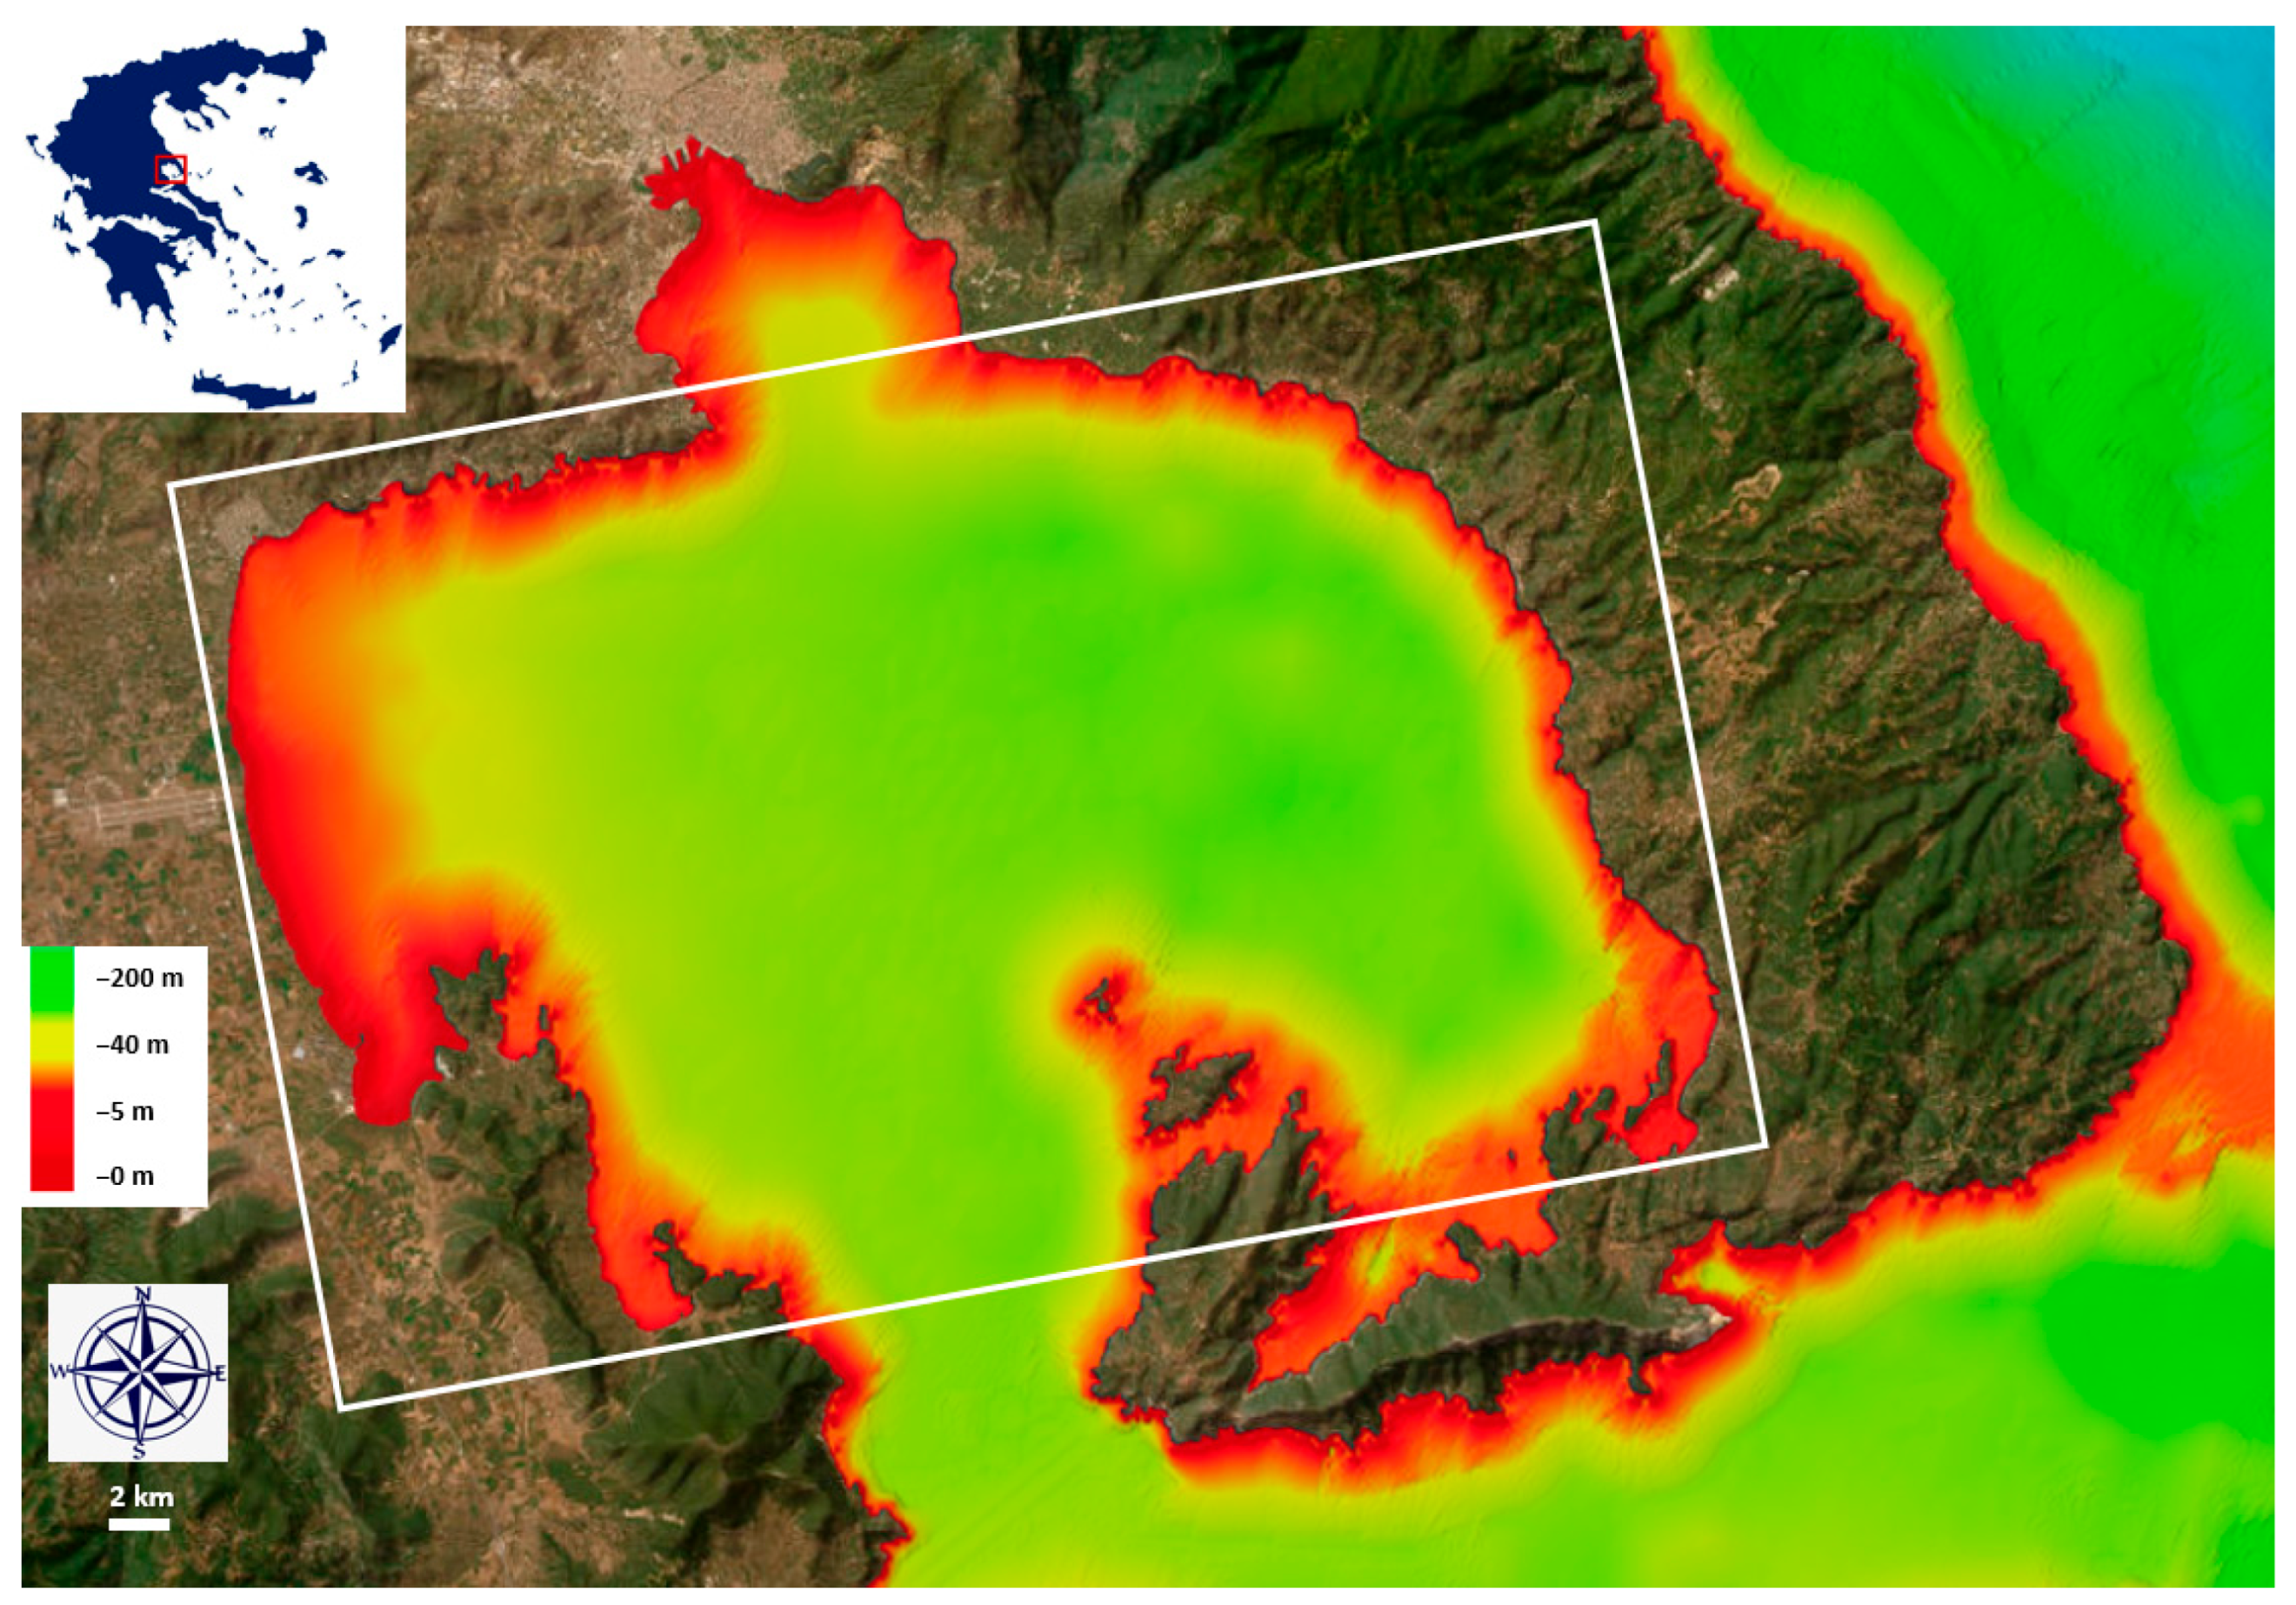
Figure 1. Map of the study area (red outline) and location of sampling area (white outline) (color variation indicates depth).
Fishes 10 00500 g001
Figure 2. Image of a D. macrophthalmus otolith pair. The measurements of otolith width (OW) and otolith length (OL) are indicated.
Fishes 10 00500 g002
Figure 3. The workflow of the process used for the predictive analysis-supervised ML algorithms. (The shapes represent the following: rectangles, data processing steps; ovals, start points; diamonds, decisions; and parallelograms, input and output. The colors represent the following: blue, data-related processes; green, model training and development; yellow, evaluation and testing; and purple, deployment and monitoring).
Fishes 10 00500 g003
Figure 4. (A,B) Length and weight frequency distributions with overlayed fitted normal distribution of male and female D. macrophthalmus captured over 10 trawls in May 2024, in Pagasitikos gulf.
Fishes 10 00500 g004
Figure 5. Scatterplot matrix (lower left triangle of the scatterplot matrix) and heat map with Pearson correlation values (upper-right triangle of the scatterplot matrix) of D. macrophthalmus sagittal otolith biometric characters from individuals captured from Pagasitikos gulf (Greece). Colors represent correlation strength.
Fishes 10 00500 g005
Figure 6. Length-weight relationship and coefficient of determination of (A) each sex separately and (B) total population of D. macrophthalmus individuals captured in Pagasitikos gulf.
Fishes 10 00500 g006
Figure 7. Otolith length–weight relationship of D. macrophthalmus for male, female, and the combined population captured from Pagasitikos Gulf.
Fishes 10 00500 g007
Figure 8. Heatmap of the CPUE of D. macrophthalmus (kg/h trawl) over 18 experimental hauls of 20 min duration in Pagasitikos gulf conducted in the eastern, western, and central parts of the gulf during May 2024 (Depth contours at 50 m intervals are indicated).
Fishes 10 00500 g008
Figure 9. Age groups identified for D. macrophthalmus (confidence intervals indicate the standard deviation).
Fishes 10 00500 g009
Figure 10. The von Bertalanffy growth curve and parameters for D. macrophthalmus from Pagasitikos Gulf. Data points represent distinct age classes determined by otolith growth ring counts, used to estimate age. Each point shows an individual’s length at a given age. The red-shaded region represents the confidence interval around the growth curve, indicating uncertainty in the growth parameter estimates.
Fishes 10 00500 g010
Figure 11. Relationship between maximum age difference among readers and mean estimated age. Each point represents an individual fish, showing the maximum difference in age estimates between any two readers plotted against the mean age from all three readers. The red line represents a loess smoothing curve with 95% confidence interval (shaded area), indicating trends in estimation variability across age classes. The vertical clustering of points at integer values reflects the discrete nature of age classification.
Fishes 10 00500 g011
Figure 12. Prediction profiler of the importance (slope) and interaction effect of each factor on the age prediction of D. macrophthalmus. Vertical slices of each factor, holding other factors at current values, are indicated (4 years old estimated age).
Fishes 10 00500 g012
Figure 13. Scatterplot matrix with fitted line plots, 95% confidence intervals (shaded blue ellipses), and histograms (diagonal) for morphometric variables significantly affecting age estimation of D. macrophthalmus from Pagasitikos Gulf, Greece. The upper-right triangle displays a heatmap of Pearson correlation coefficients, with colors indicating correlation strength.
Fishes 10 00500 g013
Figure 14. Performance metrics used to compare model performance (mean square error (MSE), root mean square error (RMSE), mean absolute error (MAE), coefficient of determination (R2) and mean absolute percentage error (MAPE)), acquired from stratified 10-fold cross validation for the prediction of age of the total population of D. macrophthalmus.
Fishes 10 00500 g014
Figure 15. Explanation of the Neural Network algorithm on which features contribute the most and their relative contribution towards D. macrophthalmus age prediction.
Fishes 10 00500 g015
Table 1. The formulas of the otolith dimension indices that were calculated and their associated sources (otolith weight (OW), otolith length (OL), otolith width (OWD), otolith perimeter (OP), and otolith area (OA)).
Otolith Morphometric CharactersFormulaReference
rectangularity (R) O A / ( O L     O W D ) [51]
squareness (S) O A / ( O L     O W D ) [52]
ellipticity (E) ( O L O W D ) / ( O L + O W D ) [53]
roundness (RO) 4 O A / π × O L 2[53]
aspect ratio (AR) O L / O W D [54]
form factor (F) 4 π × O A / O P 2[53]
circularity (C)   O P / O A 2[51]
Table 2. Allometric scaling equations between otolith length (OL), otolith weight (OW), otolith width (ODW) and otolith area (OA) of D. macrophthalmus captured from Pagasitikos gulf (Greece). R2: coefficient of determination, t-test: statistical significance of the allometric relationship, type of allometry (*** p < 0.001).
RelationshipEquationR2t-TestAllometry
OL vs. OWOW = 0.0008 × OL2.544175.1%***Negative
OL vs. OWDOWD = 0.9893 × OL0.902480.3%***Negative
OL vs. OAOA = 0.8540 × OL1.815791.7%***Negative
OWD vs. OWOW = 0.0006 × OWD2.434371.3%***Negative
OA vs. OWOW = 0.0003 × OA1.428382.7%***Negative
Disclaimer/Publisher’s Note: The statements, opinions and data contained in all publications are solely those of the individual author(s) and contributor(s) and not of MDPI and/or the editor(s). MDPI and/or the editor(s) disclaim responsibility for any injury to people or property resulting from any ideas, methods, instructions or products referred to in the content.