Abstract
Detecting, tracking, and preventing cryptocurrency money laundering within blockchain systems is a major challenge for governments worldwide. This paper presents an anomaly detection model based on blockchain technology and machine learning to identify cryptocurrency money-laundering accounts within Ethereum blockchain networks. The proposed model employs Particle Swarm Optimization (PSO) to select optimal feature subsets. Additionally, three machine learning algorithms—XGBoost, Isolation Forest (IF), and Support Vector Machine (SVM)—are employed to detect suspicious accounts. A Genetic Algorithm (GA) is further applied to determine the optimal hyperparameters for each machine learning model. The evaluations demonstrate the superiority of the XGBoost algorithm over SVM and IF, particularly when enhanced with GA. It achieved accuracy, precision, recall, and F1-score values of 0.98, 0.97, 0.98, and 0.97, respectively. After applying GA, XGBoost’s performance metrics improved to 0.99 across all categories.
1. Introduction
The rise of cryptocurrency applications and their underlying technology, blockchain, has transformed the financial sector, introducing new opportunities for innovation and investment. This shift challenges conventional banking systems and establishes the foundation for a decentralized digital economy [1]. Cryptocurrency represents only one part of blockchain applications, where the technology ensures secure transaction processing and record-keeping. This technology extends to various industries, including the Internet of Things (IoT), government operations, and healthcare [2]. The anonymity and decentralization of cryptocurrencies have attracted criminal misuse, including illicit activities such as fraud, money laundering, and terrorist financing. Data reveals that around $33 billion in cryptocurrency was laundered from 2017 to 2021, with $8.7 billion explicitly earmarked for money laundering through cryptocurrency in 2021 [3]. Cryptocurrency money laundering is illegal and involves obscuring the source of funds, making it difficult to trace the illicit origins of the funds. Various methods can be employed, such as transferring funds through multiple intermediary accounts [4,5]. Traditional anti-money laundering models face challenges in detecting cryptocurrency money laundering due to the inherent anonymity of these transactions. Cryptocurrency money laundering often employs techniques such as money mixing, smurfing, and fiat exchanges, which significantly hinder the tracking of laundered funds [6,7].
Therefore, creating a robust detection model is essential in the fight against cryptocurrency money laundering. The integration of artificial intelligence (AI) and blockchain technology within the crypto-system has facilitated the implementation of anomaly detection to pinpoint suspicious or irregular activities, especially those linked to money laundering schemes [8].
This study contributes by integrating Genetic Algorithm (GA) with XGBoost within a layered anomaly detection framework for suspicious Ethereum accounts. While prior works have applied Particle Swarm Optimization (PSO) for feature selection or relied on single machine learning models, our framework uniquely combines PSO-driven feature selection with GA-based hyperparameter tuning. This dual optimization strategy enables the system to both select the most discriminative features and refine model parameters adaptively, resulting in consistently higher detection performance.
Unlike earlier approaches that primarily evaluated small or synthetic blockchain datasets, this work is validated on a large-scale Ethereum transaction dataset with real-world labeling of suspicious and benign accounts. This ensures that the model addresses practical challenges such as class imbalance, noise, and high-dimensional features, which are often overlooked in the literature.
The contribution of this work can be summarized as follows:
- Hybrid Optimization Framework: We present the first integrated framework that applies PSO for feature selection and GA for hyperparameter tuning across three state-of-the-art classifiers (XGBoost, SVM, Isolation Forest).
- Performance Gains on Real Data: Experimental results show that the GA-tuned XGBoost consistently outperforms existing methods, achieving up to 99% accuracy and recall, which surpasses reported benchmarks in recent studies.
- Scalability and Robustness: The proposed approach demonstrates strong scalability to large Ethereum datasets and maintains robustness even in the presence of noise and incomplete features.
- Comparative Validation: A thorough baseline comparison with established methods such as Local Outlier Factor (LOF) and Classification and Regression Trees (CART) illustrates clear improvements, reinforcing the originality and practical utility of the proposed framework.
2. Literature Review
Anomaly detection for suspicious accounts in blockchain can typically be divided into two primary methodologies. First, regarding machine learning methods, Wu et al. [9] have presented XBlockFlow, a framework designed to identify money laundering involving crypto-assets. Initially, the framework identifies the source accounts of scammers, Decentralized Finance (DeFi) exploiters, and exchange hackers. It then monitors downstream transactions and addresses through taint analysis. In the final stage, the framework classifies service providers by utilizing advanced machine learning techniques, including token swapping and the creation of counterfeit tokens not found in the Bitcoin ecosystem. The framework has demonstrated an accuracy of 90% and a recall of 96.2% [9].
Fu et al. [10] proposed a framework for assessing the risk of Ethereum accounts using a suspiciousness metric. This framework detects illicit transactions and accounts through graph-based fraud ratings, achieving a reliability of 86.8% for suspicious accounts and 71.8% for benign accounts with a trustworthiness of 99% [10]. In 2024, Lin et al. [11] developed the DensFlow framework to detect and track accounts involved in money laundering. It utilizes graph-based anomaly detection, incorporating dense subgraphs and the maximum flow concept. This framework was evaluated on four datasets and achieved a precision of 99% [11]. Fangfang et al. [12] have presented an anomaly detection system on the exchange blockchain network to detect suspicious account behavior. Their method uses the Suspicious Money Laundering Account Detection (SMLAD) algorithm. It utilizes the Local Outlier Factor (LOF) and clustering algorithms to identify anomalous transaction behaviors and values. This approach has yielded a 95% accuracy rate in identifying suspicious accounts [12]. Wei et al. [13] have proposed a model using heuristic algorithms to address money laundering in the Ethereum platform, achieving an accuracy of 43.6% [13].
Saxena et al. [14] developed a model using supervised learning to classify malicious and non-malicious transactions, achieving its highest accuracy of 60.9% with Classification and Regression Trees (CART) [14]. Alarab et al. [15] have suggested a way to find fake accounts or transactions on Bitcoin or Ethereum datasets using XGBoost and Random Forest. They achieved 99% accuracy with the edited nearest-neighbor method [16]. Elmougy et al. [16] have proposed an anomaly detection system for identifying suspicious transactions and accounts (money laundering accounts) within the Bitcoin and Ethereum networks. Using Support Vector Machine (SVM), Random Forest, and Logistic Regression, the system has achieved an accuracy of 93% for the Bitcoin network and 82% for the Ethereum network [16]. Farrugia et al. [17] have proposed a model for detecting suspicious accounts using the XGBoost technique. The model has identified the top three features that have the most significant impact on the final output, which are the ‘Time difference between first and last (minutes),’ ‘Total Ether balance,’ and ‘Minimum value received.’ These features have achieved an average accuracy of 96% [17].
Second, regarding deep learning methods, Yang et al. [18] have developed an anomaly detection system to identify unusual money laundering patterns in various transaction datasets. The system utilizes Long Short-Term Memory (LSTM) and Graph Convolutional Neural Network (GCN) for labeled data and Histogram-Based Outlier (HBOS) and Isolation Forest (IF) for unlabeled data. It achieved 85.42% accuracy [18]. Badawi et al. [19] have introduced an anti-money laundering system that analyzes cryptocurrency transactions to identify both suspicious and benign transactions. This system has utilized shallow neural networks and decision trees to construct classification models, achieving classification accuracies of 89.9% and 93.4%, respectively [19]. In Appendix A, Table A1 presents a summary of the related work mentioned.
Despite the constraints of prior research, which often relied on small datasets to construct anomaly detection models, our study aims to enhance performance and precision by utilizing a more robust dataset and advanced techniques. In this study, the proposed model aims to detect suspicious accounts and prevent cryptocurrency money laundering on the Ethereum network. It utilizes the Particle Swarm Optimization algorithm, an intelligent optimization algorithm, to select the best subset of features from the dataset. The genetic algorithm (GA) is used to automate the process of hyperparameter tuning.
3. The Proposed Ethereum System Model
The proposed model in this study is built on the Ethereum blockchain network, which is a decentralized, peer-to-peer computer network based on blockchain technology [15]. In 2013, Vitalik Buterin proposed the Ethereum network as a public, permissionless, transparent, immutable, anonymous, and distributed public ledger that verifies and records all transactions [20,21]. Figure 1 displays the structure of the Ethereum blockchain network, which consists of two types of nodes: miner nodes and Ethereum Virtual Machine (EVM) nodes. The miner nodes are responsible for several key activities, including:
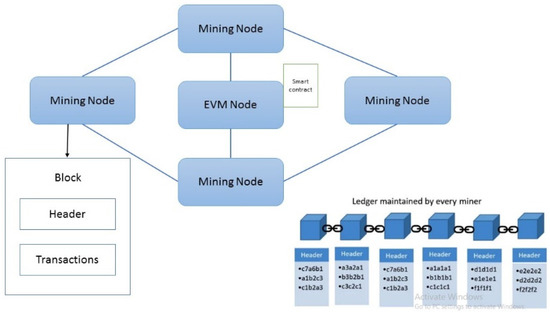
Figure 1.
Ethereum blockchain network.
- Incorporating mined transactions into fresh blocks and uploading these blocks to the Ethereum ledger.
- Notifying other miners about newly mined blocks.
- Accepting newly discovered blocks from other miners and keeping their ledger instances up to date.
On the other hand, the EVM nodes are responsible for executing smart contracts and transactions. All nodes in the network are connected via a peer-to-peer protocol [22].
From an application perspective, each node acquires one of two types of accounts: externally owned accounts or contract accounts. The former is used to store transactions, while the latter stores the details of smart contracts. Each account is associated with a pair of public and private keys, where the public key is used for identification, and the private key is kept secret. Generally, the public key consists of 256 bits, but Ethereum only utilizes the first 160 to identify an account [23].
In the Ethereum Network, blocks are linked together and secured using cryptographic tools. To link different blocks, each block contains a cryptographic hash of the previous block to ensure data immutability [24,25]. A block of transactions consists of two components: the block header and the block body. The block header contains metadata of the block, such as the previous block hash, timestamp, nonce, and Merkle root. In contrast, the block body contains a list of transactions that are explicitly transmitted to an application, such as those related to cryptocurrency or smart contracts [26,27]. As illustrated in Figure 2, every transaction applies a hash function to create and store a hash value. The hash values of every two transactions are further hashed to generate another hash value. This process ultimately generates a single hash value from all transactions within the block, referred to as the transaction Merkle root hash value, and stores it in a block header. A change in any transaction will result in a change in its hash value and, consequently, a change in the root transaction hash value, thereby ensuring the immutability of transactions. Additionally, nodes in Ethereum networks utilize consensus protocols to verify transactions and reach a consensus about the current state of the distributed ledger [28].
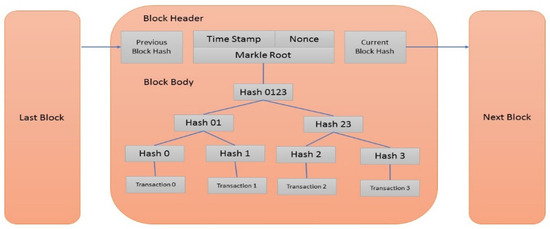
Figure 2.
Ethereum block structure.
Money Laundering Threats in Ethereum Networks
Within Ethereum networks, several types of money laundering attacks exist. This study characterizes money laundering attacks involving suspicious accounts and categorizes them into Money-Mixing, Pump and Dump, Wash-Trading, and Whale Wall Spoofing [29,30,31,32,33,34,35]:
- Money-Mixing attack: In this scheme, a dishonest node leverages a service to blend potentially traceable cryptocurrency funds, masking their origins and rendering them untraceable.
- Pump and Dump attack: A dishonest node artificially inflates the value of an asset or cryptocurrency by creating a false impression of interest.
- Wash-trading attack: A dishonest node rapidly buys and sells a cryptocurrency or asset to create the illusion of market activity.
- Whale Wall Spoofing attack: Similar to wash trading, a large entity (a ‘whale’) places significant buy or sell orders to manipulate the market.
In this paper, the proposed detection model categorizes these attacks as suspicious accounts and recognizes them as variants of money laundering. The utilized dataset comprises 9841 unique accounts, each represented by a node in the Ethereum network [36]. On average each account sends about 5000 transactions and receives about 5081. The network employs Proof of Stack (PoS) to verify transactions [28].
4. The Proposed Detection Model
The proposed detection model, based on blockchain technology and machine learning, aims to identify cryptocurrency money laundering within the Ethereum network. This model utilizes the Particle Swarm Optimization (PSO) to extract an initial optimal subset of features automatically. Furthermore, it introduces a hybrid approach that combines the Genetic Algorithm (GA) with XGBoost, SVM, and Isolation Forest (IF) for hyperparameter optimization, achieving an effective configuration for identifying suspicious accounts on the Ethereum network. The model includes four key stages: data collection, data preprocessing, development of the classification model, and implementation of the learning model. Figure 3 illustrates the proposed detection framework.
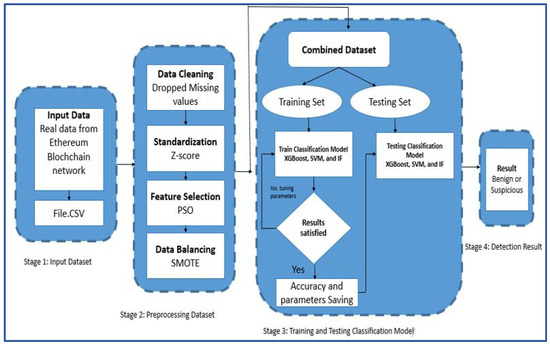
Figure 3.
The proposed detection framework.
4.1. Data Collection Stage
Data collection is essential for detecting suspicious activity, as it captures the characteristics of the Ethereum blockchain network. The experimental evaluation in this study uses transaction data from the Ethereum blockchain network. The dataset is composed of raw Ethereum transactions that include details such as sender and receiver addresses, transaction values, timestamps, and associated smart contract interactions. This dataset was chosen due to Ethereum’s growing use in financial transactions, where illicit activities such as money laundering are frequently reported [36].
The dataset was collected through Ethereum public ledger extractions and cross-referenced with open-source intelligence platforms, including Etherscan reports, community-driven blacklists, and prior studies documenting accounts involved in fraudulent or suspicious activities. These external repositories provide reliable ground truth for labeling accounts and transactions. The dataset comprises 50 million transactions and 9841 unique accounts: 7663 benign and 2178 suspicious, all from the Ethereum blockchain network. Suspicious labels were assigned to accounts flagged by monitoring services, law enforcement reports, and crowdsourced verification lists. Benign accounts were randomly sampled from Ethereum users with no record of fraudulent activity. This binary labeling ensures that supervised learning models can differentiate between normal and illicit activities. To ensure the reliability of labels, suspicious account lists were validated through cross-checking across multiple sources. Only accounts flagged by at least two independent sources were included in the suspicious category.
Furthermore, duplicate addresses and contradictory labels were removed to ensure consistency. This validation step increases the credibility of the experimental results and reduces labeling noise. In total, the dataset includes 49 distinct features that represent transactional, structural, and behavioral properties of Ethereum accounts. These features are described in detail in Appendix A (Table A2).
4.2. Data Preprocessing Stage
Preprocessing data is a crucial stage in data analysis, as it enhances the consistency, accuracy, and performance of the algorithm. This stage involves five phases: data cleaning, standardization, feature selection using the PSO algorithm, data balancing, and data splitting.
4.2.1. Data Cleaning
Data cleaning aims to identify and correct errors and inconsistencies in the dataset. The dataset, comprising 9841 accounts, contains duplicate, inaccurate, incomplete, and null values. This study identified 851 instances of missing data across 25 features. To address this, missing data was dropped, resulting in a dataset of 8990 accounts.
4.2.2. Standardization
To mitigate biases and inconsistencies from varying values, data scaling is applied as a vital preprocessing step in machine learning. This involves transforming numerical features to a standard scale. Two common feature scaling techniques are normalization and standardization. This model applies z-score normalization, which transforms features to have a mean of 0 and a standard deviation of 1. Z-score normalization involves subtracting the mean of the feature and dividing it by the standard deviation. This technique is preferred when the data is normally distributed or when the distribution is unknown. Standardization preserves the data distribution and does not constrain features to a fixed range. Equation (1) illustrates the standardization formula [37].
where X represents the feature value after standardization.
4.2.3. Feature Selection Using Particle Swarm Optimization (PSO)
For feature selection, PSO was adopted instead of alternative approaches such as Genetic Algorithm (GA), Ant Colony Optimization (ACO), or random feature search. PSO is particularly well-suited for high-dimensional data spaces such as the Ethereum transaction dataset, where feature interactions are complex and nonlinear. Unlike GA, which relies heavily on crossover and mutation operators that may introduce instability in the selection process, PSO employs a velocity and position updating mechanism that converges more smoothly toward optimal solutions. Similarly, ACO is computationally more expensive in large search spaces, and random search fails to exploit dependencies between features. Through iterative optimization, PSO consistently identified subsets of features that retained high discriminative power while discarding redundant or noisy attributes. The final feature set included financial indicators such as transaction values, temporal features such as inter-transaction time intervals, and graph-based features such as in-degree and out-degree connectivity measures. This combination provided a balanced representation of account behavior across transactional, temporal, and structural dimensions, enhancing the robustness of the downstream classifiers. The PSO technique was introduced by Kennedy and Eberhart in 1995 [38]. PSO combines social and cognitive models, enabling particles to learn from local and global exploration [39]. This optimization method involves particles representing individuals in a population, searching through candidate solutions to the optimization problem. Particles adjust their positions by exploring in a multi-dimensional space until a relatively stable position is reached or until the maximum number of iterations, determined by computational limits, is achieved.
In this initial step, each particle is initialized as a candidate solution with -dimension representing the number of optimization parameters. At iteration or generation j, the ith particle can be represented as:
The jth population consists of a set of particles, represented as:
The PSO has a population of moving particles that collectively move while each particle swarms in a random direction. The velocity of each moving particle is initialized as:
The particle velocity is constrained by a maximum value Let:
where i = 1, 2…,.
The maximum velocity is calculated by:
Here, SEG is an assumed number, is the maximum value for parameter a, and is the minimum value for parameter a in particles r = 1, 2, … ,.
The weight w(t) controls the influence of previous velocities on the current velocity, impacting the trade-off between global and local exploration of the particles. It is initialized with a large value, and its reduction is defined by
where < 1 is a decrement constant close to, but smaller than, 1 (.
In the subsequent step, the search is conducted for the best fitness value (individual best) that denotes X*, followed by the search for the minimum objective function value for each i = 1, 2, …,. The weight and velocity are updated, and velocity limits are checked as displayed in Equations (9) and (10):
where c1, c2 are positive constants (cognitive and social coefficients), r1, r2 are random numbers uniformly distributed in the interval [0, 1], W(j) is the updated weight, is the velocity of particle i at the previous iteration, is the individual best, is current position of particle i at iteration j − 1, and is the global best.
The next step involves updating the positions of the particles. Subsequently, the limits of each particle are checked, and both the individual best and global best are updated accordingly, as displayed in Equation (11).
Finally, the process stops when the number of generations reaches the maximum allowable number. The PSO algorithm, along with the corresponding pseudocode, is illustrated in Figure 4 and Algorithm 1.
| Algorithm 1: PSO algorithm | |
| 1: | Initialization parameter: , W, |
| 2: | Population Initialization: Initialize the population with particles having random positions and velocities. |
| 3: | For j = 1 to maximum generation |
| 4: | For i = 1 to the number of particles, |
| 5: | if fitness() > fitness() then |
| 6: | update |
| 7: | |
| 8: | End if |
| 9: | For d = 1 to iteration |
| 10: | Update Velocity: |
| 11: | |
| 12: | |
| 13: | Return new Velocity |
| 14: | If then |
| 15: | Else If then |
| 16: | End If |
| 17: | Update Positions: |
| 18: | if then |
| 19: | Else If then |
| 20: | End IF |
| 21: | End For |
| 22: | End For |
| 23: | End |
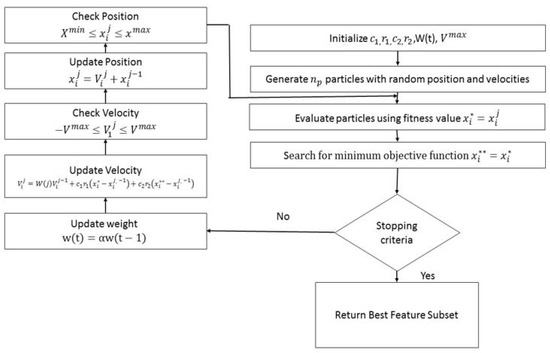
Figure 4.
Flow chart for PSO algorithm.
4.2.4. Data Balancing
As depicted in Figure 5, the dataset comprises 7662 benign and 1328 suspicious accounts, revealing an imbalance. The Synthetic Minority Oversampling Technique (SMOTE) is employed to address this issue [40]. Figure 6 illustrates the dataset after applying SMOTE, resulting in a total of 15,324 accounts, evenly split between 7662 benign and 7662 suspicious accounts.
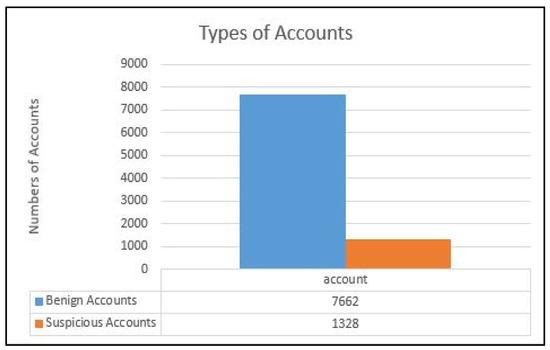
Figure 5.
Number of Original Accounts.
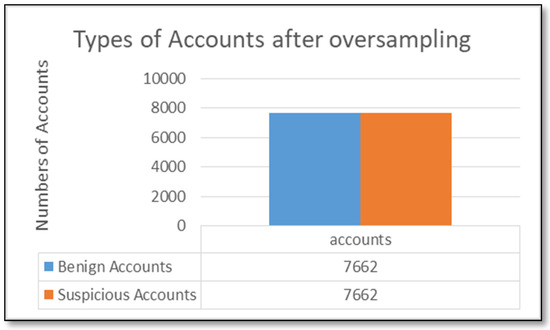
Figure 6.
Types of Accounts after Oversampling.
4.2.5. Data Splitting
It is essential to divide the available data into distinct sets for training and evaluation while working with machine learning models. This phase involves dividing the dataset into 20% testing data and 80% training data. Subsequently, there are 3065 accounts in the testing data and 12,259 accounts in the training data.
4.3. Classification Stage
XGBoost, Isolation Forest (IF), and Support Vector Machine (SVM) are used in this stage to identify and classify accounts on the Ethereum blockchain network. Hyperparameters control the learning process and determine the optimal values for achieving the best model performance. For hyperparameter optimization, a GA-based search strategy was used to tune the parameters of XGBoost, Support Vector Machine (SVM), and Isolation Forest (IF) [41,42]. The search space for XGBoost included learning rate, maximum tree depth, number of estimators, and subsampling ratio; for SVM, kernel type and regularization parameters were considered; for IF, the number of estimators and contamination factor were optimized. GA was selected over conventional grid search and random search due to its superior ability to navigate large, nonlinear parameter spaces without being constrained by exhaustive enumeration or random sampling inefficiencies. Grid search becomes computationally prohibitive when dealing with multiple interacting parameters, while random search may miss promising regions of the search space altogether. GA, by leveraging evolutionary operators, adaptively refined candidate solutions, and achieved higher convergence efficiency. Empirically, GA-tuned models consistently outperformed baseline methods, with XGBoost showing significant gains in accuracy and recall after GA-based optimization [43].
In GA, a random set of hyperparameters, known as chromosomes, is initialized during the initial population phase. Each chromosome consists of a sequence of genes, each representing a decision variable. In the evaluation phase, each population member is assessed using a fitness function that assigns a value based on specified criteria. The selection phase employs the Roulette Wheel method to randomly pick individuals based on fitness values, with higher values increasing the likelihood of selection. In the crossover phase, new individuals or solutions are generated by combining two selected individuals to create offspring. Finally, in the mutation phase, one or more genes within a chromosome are altered [44,45]. The overall process flow of the Genetic Algorithm is depicted in Figure 7 and Algorithm 2.
| Algorithm 2: Genetic algorithm for hyper-tuning parameters | |
| 1: | Def genetic_algorithm(hyperparameter_bounds, number of generations, number of parents, offspring_size, mutation_rate) |
| 2: | population = initialize_population (number of parents, hyperparameter_bounds) |
| 3: | Def Fitness Function() |
| 4: | While the current generation < J (maximum number of generations) |
| 5: | fitness_scores = calculate_fitness (population) |
| 6: | parents = selection (population, fitness, number of parents) |
| 7: | offspring = Crossover (parents, offspring_size) |
| 8: | Population = parents + Mutation (offspring, mutation rate, hyperparameter_bounds) |
| 9: | best_hyper-parameters = max (population, key = objective_function) |
| 10: | End While |
| 11: | Return the best hyperparameter. |
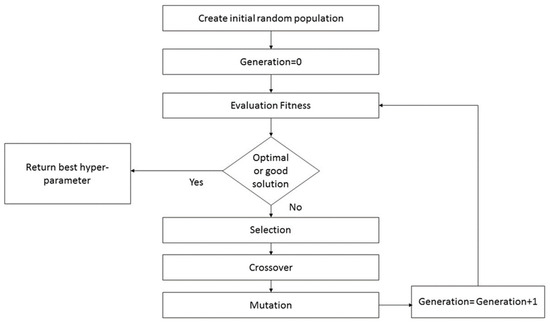
Figure 7.
Genetic algorithm (GA) workflow.
Extreme Gradient Boosting, or XGBoost for short, is a robust boosting technique based on the gradient-boosted decision trees algorithm. It creates a strong, accurate forecast by combining the predictions of several weak models. Due to its ability to manage large datasets and achieve cutting-edge results in various tasks, such as regression and classification, XGBoost has emerged as one of the most popular and widely applied machine learning algorithms [41]. XGBoost is illustrated in Algorithm 3.
| Algorithm 3: XGBoost algorithm | |
| 1: | Initialize parameters: learning rate (η), number of trees (n_trees), maximum depth of trees (max_depth), and regularization parameters (λ, γ). |
| 2: | Initialize the model predictions to a constant value, typically the mean of the target values. |
| 3 | For each tree t in range (1, n_trees + 1) |
| 4: | Calculate the gradient: |
| 5: | Calculate the hessian: |
| 6: | Construct a new decision tree (gradient, hessian) |
| 7: | Apply the regularization parameters (λ, γ) to control the complexity of the tree. |
| 8: | Return new_tree. |
| 9: | Update the model predictions: |
| 10: | Return new_model. |
| 11: | End For |
The Support Vector Machine (SVM) is an efficient machine learning technique widely employed for linear and nonlinear classification, regression, and outlier detection problems. Its function is to discover the best hyperplane that separates data into distinct classes, hence maximizing the margin between them. The dimension of this hyperplane is contingent upon the number of features present. Known as the maximum-margin hyperplane or hard margin, it is chosen to maximize the distance from the hyperplane to the closest data points on either side. Hence, the selection focuses on the hyperplane that maximizes the distance to the nearest data points on each side. In cases where the data includes outliers or is not perfectly separable, SVM adopts the soft margin technique. This strategy introduces a slack variable for each data point, permitting some misclassifications while striking a balance between maximizing the margin and minimizing violations [46]. SVM is illustrated in Algorithm 4.
| Algorithm 4: Support vector machine algorithm | |
| 1: | Initialize parameters: C, γ, max_iter. |
| 2: | Initialize parameters: Weight (w), Bias (b) → small random values. |
| 3: | For iteration k = 1 to max_iter |
| 4: | For each data point (,) |
| margin = | |
| 5: | If margin ≥ 1 Then |
| wnew = w* γ *w | |
| 6: | End If |
| If margin < 1 | |
| 7: | wnew = w − γ *(w − c* *) |
| 8: | End |
| 9: | b = b+ γ *c* |
| 10: | End For |
| 11: | End For |
The Isolation Forest is a simple yet effective algorithm for quickly identifying outliers or anomalies in a dataset. It introduces binary trees that recursively divide the data by randomly selecting a feature and splitting the data points based on the feature’s value until all data points are isolated from other samples. The max depth of the decision tree is one, and the base estimator of an Isolation Forest is a highly random decision tree (Extra Trees) on various data subsets [46]. Isolation Forest is illustrated in Algorithm 5.
| Algorithm 5: Isolation forest algorithm | |
| 1: | Initialize parameters: n_estimators, max_samples, Contamination, max_depth, threshold (θ) |
| 2: | Initialize an empty list to store all isolation trees. |
| 3: | For t = 1 to n_estimators + 1 |
| 4: | max_samples → randomly selected from the dataset without replacement. |
| 5: | Build an isolation tree(data, depth) |
| 6: | If depth ≥ max_depth |
| 7: | Return a leaf node with the current depth |
| 8: | Else |
| 9: | Randomly select a feature f from the data features |
| 10: | Randomly select a split value s within the range of feature f for the current data points. |
| 11: | Partition the data into two subsets: |
| 12: | Left subset = {x|< s} |
| 13: | Right subset = {x|≥ s} |
| 14: | Left child = BuildTree(Left subset, depth + 1) |
| 15: | Right child = BuildTree(Right subset, depth + 1) |
| 16: | Return a node with the selected feature f, split s, left child, and right child. |
| 17: | End If |
| 18: | Add the root of the built isolation tree to the list of trees. |
| 19: | End for |
| 20: | Calculate path length (data point x) |
| 21: | Path_length = 0 |
| 22: | For t = 1 to n_estimators |
| 23: | Increment path_length by one at Contamination |
| 24: | If x moves to a leaf node, add the final path length and stop |
| 25: | End for |
| 26: | Return path_length |
| 27: | Calculate the expected path length for each data point x |
| 28: | |
| 29: | Return expected path length |
| 30: | Def an anomaly score function s(x) for x |
| s | |
| 31: | Classify each data point x based on its anomaly score s(x): |
| 32: | If s(x) > θ: classify x as an anomaly. |
| 33: | Else: classify x as usual. |
| 34: | End If |
Table 1 outlines an overview of key hyperparameters for XGBoost, Support Vector Machines (SVM), and Isolation Forest (IF). Hyperparameters are settings that determine the behavior of a machine learning algorithm during training.

Table 1.
Hyperparameters for the utilized machine learning algorithms.
The proposed detection framework is illustrated in Algorithm 6. It uses the Particle Swarm Optimization (PSO) algorithm to extract the optimal subset of features automatically. It combines the Genetic Algorithm (GA) with XGBoost, SVM, and Isolation Forest (IF) for hyperparameter optimization, achieving an effective configuration for identifying suspicious accounts on the Ethereum network.
| Algorithm 6: Proposed detection model | |
| 1: | Load the dataset |
| 2: | Call the PSO algorithm on the whole dataset |
| 3: | Return the best feature subset |
| 4: | Call XGBoost: |
| 5: | Apply GA for Hyperparameter tuning |
| 6: | Train the XGBoost model using the optimal hyperparameters obtained from GA. |
| 7: | Return accuracy rate and confusion matrix |
| 8: | Call SVM: |
| 9: | Apply GA for Hyperparameter tuning |
| 10: | Train the SVM model using the optimal hyperparameters obtained from GA. |
| 11: | Return accuracy rate and confusion matrix |
| 12: | Call Isolation Forest: |
| 13: | Apply GA for Hyperparameter tuning |
| 14: | Train the Isolation Forest model using the optimal hyperparameters obtained from GA. |
| 15: | Return accuracy rate and confusion matrix |
| 16: | End |
A critical aspect of any anomaly detection framework is its ability to remain robust under varying conditions and to scale effectively as the data grows. Our proposed model demonstrates robustness through its ensemble nature, where the integration of PSO-driven feature selection and GA-based hyperparameter tuning reduces sensitivity to noise and improves stability across different runs. Cross-validation experiments confirmed that the framework maintained consistent accuracy and recall even when subsets of the dataset were varied, indicating that the performance is not overly dependent on a specific partition of the data.
Regarding scalability, the framework was designed to handle the high-dimensional and large-volume nature of blockchain transaction data. XGBoost, in particular, is well-suited for distributed training and parallelization, which makes it adaptable to much larger datasets. The incorporation of PSO reduces the feature space without losing important discriminatory power, which further enhances computational efficiency. Similarly, GA optimization is flexible and can adapt its search to larger hyperparameter spaces when applied to extended datasets.
5. Results and Discussion
The dataset in this study shows a clear imbalance, with more benign accounts than suspicious ones. Consequently, classification models often exhibit bias toward the majority class (benign accounts). To address this imbalance, the Synthetic Minority Over-Sampling Technique (SMOTE) was applied only on the training folds during stratified 5-fold cross-validation. The external test set was kept untouched to avoid data leakage. After applying SMOTE to the training data, the total number of accounts used for training increased to 12,259, while the separate test set consisted of 3065 accounts (1544 benign and 1521 suspicious). This protocol ensures that the reported results reflect the true generalization performance of the models.
To improve the efficacy of the proposed detection model, the PSO algorithm has been applied as a feature selection technique to identify the most significant features within the dataset. The optimization process yielded a feature set of 14 from the original 49 features, achieving a Root Mean Square Error (RMSE) of 0.3443 after 50 iterations. Figure 8 displays the PSO fitness values along these iterations. Table 2 outlines the features after applying the PSO.
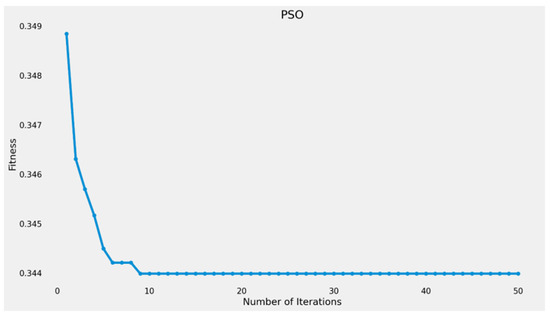
Figure 8.
Convergence of the PSO fitness function.
Table 2.
The features of Post-PSO application.
Table 2 outlines the most significant features affecting the identification of cryptocurrency money laundering activities. Substantial variations in the volume of outgoing and incoming transactions may indicate efforts to conceal illicit activities. Moreover, significant inflows from multiple sources, particularly when amounts are similar, may indicate structuring or aggregation of funds, both common strategies in money laundering. Money laundering often involves the rapid circulation of funds.
To automatically determine the optimal values for each parameter, the proposed detection model utilized a Genetic Algorithm (GA). Table 3 provides an overview of the essential statistics for each generation. Table 4 shows the progress of the genetic algorithm, illustrating how population fitness changes across generations. The output presented reflects the development and outcomes of the genetic algorithm over 20 generations.
Table 3.
Statistics key for GA.
Table 4.
Genetic algorithm’s progress.
Three machine learning algorithms—XGBoost, SVM, and IF—were optimized by Genetic Algorithm (GA) to fine-tune their parameters. Table 5, Table 6 and Table 7 illustrate the tuning parameters for XGBoost, SVM, and Isolating Forest, respectively.
Table 5.
Hyperparameter tuning for XGBoost.
Table 6.
Hyperparameter tuning for SVM.
Table 7.
Hyperparameter tuning for IF.
XGBoost, Support Vector Machine (SVM), and Isolation Forest (IF) were employed to detect cryptocurrency laundering accounts within the Ethereum blockchain network. The performance metrics used to evaluate the effectiveness of identifying suspicious accounts included accuracy, mean absolute error, precision, recall, F1 score, and AUC-ROC. The calculation formulas for the fourth metric are presented in Equations (12)–(15) [47].
Applying the optimizers (i.e., PSO and GA) to the proposed anomaly detection model has significantly improved the detection of benign and suspicious accounts within the Ethereum network. The confusion matrix values (i.e., True Positives, False Positives, True Negatives, and False Negatives) before and after the application of the optimizers for the three utilized machine learning models are displayed in Figure 9, Figure 10, Figure 11, Figure 12, Figure 13 and Figure 14 and discussed in more detail in Table 8 and Table 9.
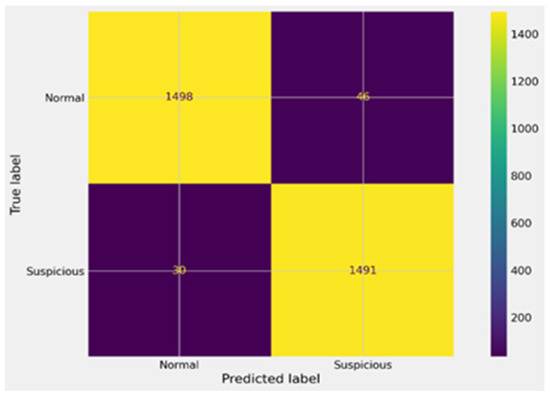
Figure 9.
Confusion matrix for XGBoost before GA.

Figure 10.
Confusion matrix for XGBoost after GA.
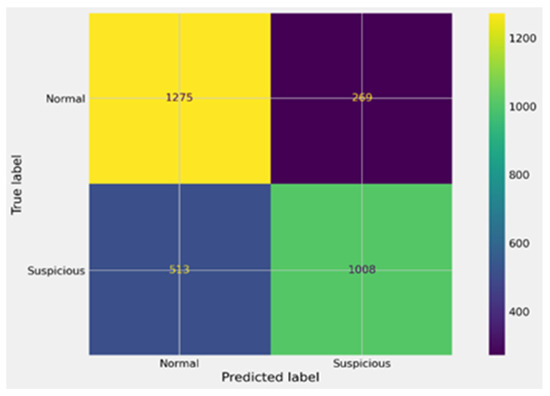
Figure 11.
Confusion matrix for SVM before GA.

Figure 12.
Confusion matrix for SVM after GA.
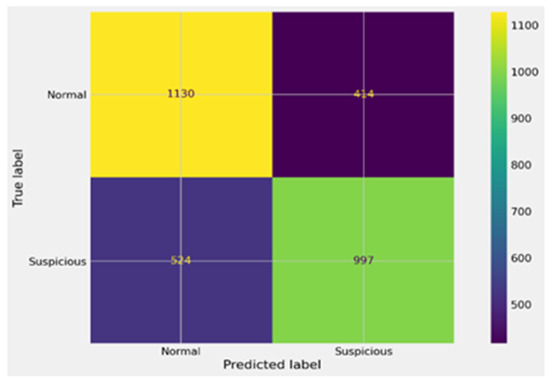
Figure 13.
Confusion matrix for IF before GA.

Figure 14.
Confusion matrix for IF after GA.
Table 8.
Comparison between the machine learning algorithms before applying GA.
Table 9.
Comparison between the machine learning algorithms after applying GA.
In Figure 9, the confusion matrix of the XGBoost model before GA optimization highlights moderate performance. The model correctly identified 1498 suspicious accounts (TP) and 1491 benign accounts (TN), but it also produced 46 false positives (FP) and 30 false negatives (FN). These errors indicate that while the model achieved high accuracy overall, misclassification of a subset of suspicious accounts remained a challenge. In Figure 10, the impact of GA optimization on XGBoost is evident. The confusion matrix shows a marked improvement, with true positives rising to 1531 and true negatives to 1510, while false positives and false negatives dropped significantly to 13 and 11, respectively. This demonstrates that GA-driven hyperparameter tuning not only improved detection accuracy but also reduced both types of errors, making the model far more reliable in identifying money laundering accounts.
As shown in Figure 11, the SVM model prior to GA tuning performed less effectively, achieving 1275 true positives and 1008 true negatives, but producing a large number of false negatives (513) and false positives (269). This imbalance reflects the difficulty of SVM in handling high-dimensional blockchain data without optimization. In Figure 12, the optimized SVM model shows substantial gains after GA tuning. True positives increased to 1341 and true negatives to 1325, while false positives and false negatives decreased to 203 and 196, respectively. Although the performance still trails behind XGBoost, the improvements confirm that GA tuning enhanced SVM’s classification power and reduced its error rates.
Finally, in Figure 13, the Isolation Forest model after GA optimization still shows limited effectiveness compared to XGBoost and SVM. While it achieved 1130 true positives and 997 true negatives, the high number of false positives (414) and false negatives (524) indicates difficulty in achieving a stable decision boundary. This suggests that IF, even when optimized, is less suited for this anomaly detection problem. In Figure 14, the confusion matrix of IF before GA tuning further illustrates its limitations. Although it correctly classified 1273 true positives and 1254 true negatives, the error rates remained relatively high, with 271 false positives and 267 false negatives. Comparing Figure 13 and Figure 14 confirms that GA provided some improvements, but the model still lags significantly behind XGBoost and SVM in terms of precision and recall.
In addition, as indicated in Table 8 and Table 9, a noticeable improvement in the performance metrics has been observed. The enhanced XGBoost achieved outstanding performance with an accuracy of 0.992, a mean absolute error (MAE) of 0.01, and near-perfect precision, recall, and F1-score values of 0.992, 0.993, and 0.992, respectively. The AUC-ROC of 0.99 further confirms its robustness in differentiating between benign and suspicious accounts. These results highlight the efficacy of the enhanced XGBoost in providing accurate and reliable detection.
Also, the enhanced SVM showed a considerable improvement with an accuracy of 0.87 and an MAE of 0.13. Precision, recall, and F1-score values stand at 0.869, 0.872, and 0.87, respectively. The AUC-ROC of 0.86 indicates good overall performance. The enhancements in SVM post-GA demonstrate its capability to achieve a balanced detection of suspicious accounts.
Despite the enhanced Isolation Forest having the lowest performance among the three models, it still recorded an accuracy of 0.824, an MAE of 0.18, and precision, recall, and F1-score values of 0.824, 0.827, and 0.825, respectively. The AUC-ROC of 0.79 suggested moderate effectiveness in detecting suspicious accounts.
Figure 15 and Figure 16 present the comparison charts of XGBoost, SVM, and IF algorithms in terms of accuracy, precision, and recall.
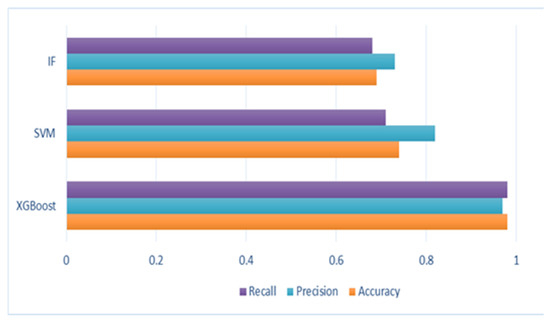
Figure 15.
Comparative Analysis of the ML Models.
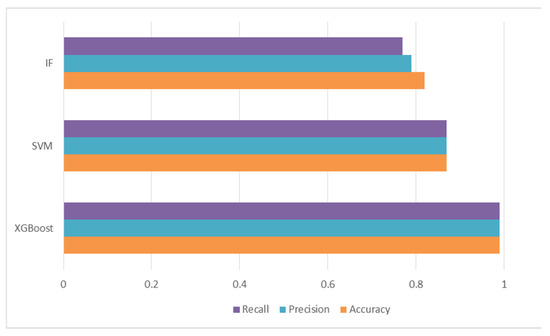
Figure 16.
Comparative analysis of the optimized ML models.
These metrics highlight XGBoost’s capability to distinguish values almost perfectly, coupled with the highest accuracy and lowest MAE among the models, demonstrating its robustness and reliability. Additionally, the AUC-ROC score of 0.99 confirms its excellent performance in differentiating between classes. The minimal false positives and false negatives further illustrate its efficiency and accuracy in detecting suspicious activity.
To provide a more rigorous evaluation, we include a baseline performance comparison against widely used anomaly detection methods in blockchain analysis. Table 10 presents the results of our proposed framework compared with existing approaches on the Ethereum dataset. The table demonstrates that the integration of Genetic Algorithm (GA) with XGBoost consistently achieves superior performance across all evaluation metrics, with accuracy, precision, and recall exceeding those of prior methods such as LOF, CART, and standalone XGBoost. This comparison highlights the effectiveness of the proposed framework and supports the novelty of combining GA-driven hyperparameter optimization with feature selection for large-scale blockchain datasets.
Table 10.
Comparison of the proposed framework with existing methods on the Ethereum dataset.
Table 10 and Figure 17 provide a direct comparison between our proposed XGBoost + GA framework and existing approaches (LOF, CART, and standard XGBoost). Figure 17 illustrates the superiority of our method across all key metrics, particularly accuracy (0.992), recall (0.993), and F1-score (0.992). The smaller error margin (MAE = 0.01) indicates its stability relative to baselines, where CART and LOF exhibit higher variability. Notably, the bar chart shows that even state-of-the-art XGBoost models without GA integration lag in precision and recall, underscoring the effectiveness of our hybrid approach.
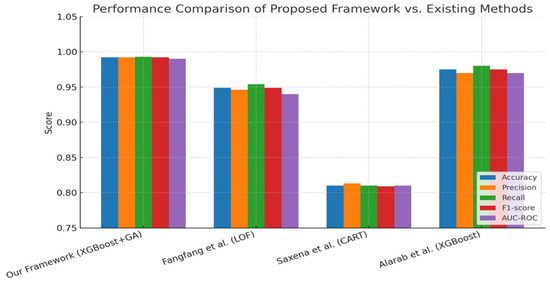
Figure 17.
Comparative performance of the proposed XGBoost + GA framework against existing methods on Ethereum anomaly detection [12,14,16].
While the proposed framework demonstrates strong performance, it also has limitations. When the input dataset contains high noise, adversarial manipulation, or many missing features, both precision and recall degrade measurably. The framework may also struggle to detect novel money laundering strategies that differ significantly from historical patterns. These scenarios emphasize the need for adaptive feature selection and dynamic model updating.
The computational complexity of the proposed framework was analyzed by considering the cost of the Genetic Algorithm (GA) used for hyperparameter optimization. With a population size of 50 and 20 generations, the GA requires 1000 model evaluations for each classifier. This yields a total time complexity of O(P × J × C), where P is the population size, J is the number of generations, and C is the training cost of the classifier. Although this makes the framework computationally intensive, the integration of the Particle Swarm Optimization (PSO) feature selection step significantly reduces the effective dimensionality and helps to lower the overall runtime. Empirical runtime measurements on our workstation confirmed that the approach remains feasible on modern hardware.
6. Conclusions and Future Work
This study examines an anomaly detection model designed to identify cryptocurrency money laundering accounts on the Ethereum blockchain network. The proposed model uses Particle Swarm Optimization (PSO) to select the optimal subset of features and combines the Genetic Algorithm (GA) with three machine learning algorithms to fine-tune hyperparameters and detect suspicious accounts. The dataset consists of 50 million transactions involving 9841 unique accounts on the Ethereum network.
The results indicate that the XGBoost algorithm yields the highest performance on the Ethereum dataset, achieving an accuracy of 98% and a recall of 0.98. Further enhancement with GA optimization improved the XGBoost algorithm’s accuracy to 99% and recall to 0.99, underscoring its robustness and reliability. In comparison, while Support Vector Machine (SVM) and Isolation Forest (IF) also showed improvements post-GA tuning, their performance did not match the outstanding results of XGBoost. Consequently, XGBoost emerges as the most effective and reliable algorithm for this application.
Although the proposed framework demonstrates superior performance, it is not without limitations. In scenarios where the input Ethereum data contains a high degree of noise, incomplete records, or mislabeled transactions, the framework shows a noticeable decline in both precision and recall. This indicates that the robustness of the model depends heavily on the quality and reliability of the input data. Another limitation lies in scalability under extreme transaction volumes, where the computational cost of GA-driven hyperparameter tuning may become significant. Furthermore, the framework’s reliance on feature engineering makes it sensitive to domain-specific feature definitions, which may limit direct transferability to other blockchain environments beyond Ethereum. Future research will address these limitations by exploring advanced data augmentation methods, adaptive feature selection strategies that can dynamically adjust to noisy or incomplete features, and computational optimizations to reduce runtime. We plan to extend the evaluation to additional blockchain platforms, including Bitcoin and Quorum, in order to further assess the generalizability and robustness of the proposed framework across different environments.
Author Contributions
Conceptualization, N.E.E.-A., M.H.S., M.A. and S.T.; methodology, N.E.E.-A., M.H.S., M.A. and S.T.; software, N.E.E.-A., M.H.S., M.A. and S.T.; validation, N.E.E.-A., M.H.S., M.A. and S.T.; formal analysis, N.E.E.-A., M.H.S., M.A. and S.T.; investigation, N.E.E.-A., M.H.S., M.A. and S.T.; re-sources, N.E.E.-A., M.H.S., M.A. and S.T.; data curation, N.E.E.-A., M.H.S., M.A. and S.T.; writing—original draft preparation, N.E.E.-A., M.H.S., M.A. and S.T.; writing—review and editing, N.E.E.-A., M.H.S., M.A. and S.T.; visualization, N.E.E.-A., M.H.S., M.A. and S.T.; supervision, N.E.E.-A., M.H.S., M.A. and S.T.; project administration, N.E.E.-A., M.H.S., M.A. and S.T.; funding acquisition, N.E.E.-A., M.H.S., M.A. and S.T. All authors have read and agreed to the published version of the manuscript.
Funding
This research received no external funding.
Data Availability Statement
The data presented in this study are openly available in [kaggle] at [URL: https://www.kaggle.com/code/chiticariucristian/fraud-detection-ethereum-transactions/input, (accessed on 1 January 2025)].
Conflicts of Interest
The authors declare no conflict of interest.
Appendix A
Table A1.
Summary of related works on money laundering detection on the Ethereum network.
Table A1.
Summary of related works on money laundering detection on the Ethereum network.
| Ref. | Year | Contribution | Dataset Name | Class Balance | Data Type | Label | Evaluation Metrics Used | Limitation |
| [9] | 2024 | Proposed XBlockFlow framework for detecting crypto-asset money laundering |
| Benign = 95% Suspicious = 5% | Structured | Accounts | Precision = 90% Recall = 96.2% | This framework is not suitable for all cryptocurrency Ethereum datasets. |
| [10] | 2024 | Proposed framework for the account risk rating and detection of illicit transactions and accounts using graph-based fraud rating. |
| Benign = 69% Suspicious = 31% | Structured | Accounts | Trustworthiness = 99% Reliability for abnormal = 86.8% Reliability for benign = 71.8% | This model needs to improve preprocessing and enhance results. |
| [11] | 2024 | Proposed Densflow framework to detect and trace money laundering accounts using graph-based anomaly detection. |
| Benign = 95% Suspicious = 5% | Structured | Accounts | Precision = 99% Precision = 55.7% Precision = 60.4% Precision = 69.9% | This framework is not suitable for all cryptocurrency Ethereum datasets. This framework needs to improve preprocessing. |
| [12] | 2024 | Proposed anomaly detection for suspicious transactions and accounts using a combination of Local Outlier Factor and cluster algorithms. |
| Benign = 92% Suspicious = 8% | Structured | Accounts and transactions | Accuracy = 95% Recall = 63.16% Precision = 2.40% | The preprocessing steps are not clear. |
| [13] | 2023 | Proposed detection model for money laundering using heuristic algorithms. |
| Benign = 79% Suspicious = 21% | Structured | Accounts | Accuracy = 43.6% | The proposed system needs to increase the number of accounts. Additionally, it needs to enhance the accuracy and efficiency of money laundering detection. |
| [14] | 2023 | Proposed model using supervised learning, including linear, nonlinear, and ensemble models, for classifying and detecting malicious and non-malicious transactions. The model used linear regression (LR), classification and regression trees (CART), and random forest (RF). |
| Benign = 95% Suspicious = 5% | Structured | Accounts and transactions | Accuracy: LR = 60% CART = 60.9% RF = 56.14% | This model needs to improve preprocessing and enhance results. |
| [18] | 2023 | Proposed anomaly detection system to detect money laundering using Long Short-Term Memory (LSTM) and Graph Convolutional Network (GCN). |
| Benign = 95% Suspicious = 5% | Structured | Transactions | Precision = 85.42% Recall = 71.2% F1 = 77% | The dataset is unclear regarding the number of transactions and accounts. |
| [15] | 2022 | Proposed model for detecting illicit transactions or accounts using XGBoost and Random Forest, applying various resampling techniques such as SMOTE, K-means SMOTE, ENN, and OSCCD. |
| Benign = 95% Suspicious = 5% | Structured | Accounts and transactions | In the Bitcoin dataset, Random Forest Accuracy = 99.42% F1-score = 93.93% AUC-score = 91.90% In the Ethereum dataset, XGBoost Accuracy = 99.38%, F1-score = 98.34% AUC-score = 99.70% | The dataset is unclear regarding the number of transactions and accounts. |
| [19] | 2021 | Proposed anti-money laundering system using shallow neural networks and decision trees. Shallow neural networks (SNN) used Scaled Conjugate Gradient Backpropagation, and decision trees (DT) used Bayesian Gradient Optimization to optimize performance. |
Number of transactions = 200,000. | Benign = 95% Suspicious = 5% | Structured | Transactions | SNN = 89.9% DT = 93.4 | This system classifies transactions only; it does not determine the suspicious accounts. The system can classify transactions as unknown. |
| [16] | 2021 | Proposed anomaly detection system for suspicious transactions and accounts using GPU-accelerated machine learning methods: Support Vector Machine (SVM), Random Forest (RF), and Logistic Regression (LR). | Ethereum Database and Bitcoin Database Used 100,000 benign accounts and 988 suspicious accounts | Benign = 99% Suspicious = 1% | Structured | Accounts and transactions | Ethereum dataset Accuracy for SVM = 82.6% RF = 83.4% LR = 81.8% Bitcoin dataset SVM = 98.7% RF = 93% LR = 89.7% |
|
| [17] | 2020 | A proposed system for detecting suspicious accounts using the XGBoost classifier. The model identified the top three features with the most considerable impact on the final model output as ‘Time difference between first and last (Minutes),’ ‘Total Ether balance,’ and ‘Minimum value received.’ | Ethereum Database Number of malicious accounts = 2179 Number of benign = 2502 | Benign = 55% Suspicious = 45% | Structured | Accounts | Accuracy = 96.3% | The proposed system needs to increase the number of accounts. |
Table A2.
The features of the utilized dataset.
Table A2.
The features of the utilized dataset.
| Feature | Description |
|---|---|
| Index | The index number of a row. |
| Address | The address of the Ethereum account. |
| Flag | The transaction is Suspicious or Benign. |
| Avg Min Between Sent Transaction | Average time (in minutes) between sent transactions for the account. |
| Avg Min Between Received Transactions. | Average time (in minutes) between received transactions for the account. |
| Time Difference Between First and Last (Mins) | Time difference (in minutes) between the first and last transaction |
| Sent Transaction. | Total number of benign transactions sent. |
| Received Transaction. | Total number of benign transactions received. |
| Number of Created Contracts | Total number of created contract transactions |
| Unique Received From Addresses | Total number of unique addresses to which the account received transactions. |
| Unique Sent To Addresses | Total number of unique addresses to which the account sent transactions |
| Min Value Received | Minimum value in Ether ever received |
| Max Value Received | Maximum value in Ether ever received |
| Avg Value Received | The average value in Ether ever received |
| Min Value Sent | Minimum value of Ether ever sent |
| Max Value Sent | Maximum value of Ether ever sent |
| Avg Value Sent | The average value of Ether ever sent from the account |
| Min Value Sent to Contract | Minimum value of Ether sent to a contract |
| Max Value Sent to Contract | Maximum value of Ether sent to a contract |
| Avg Value Sent to Contract | The average value of Ether sent to contracts |
| Total Transactions (including contract creation) | Total number of transactions, including those to create contracts. |
| Total Ether Sent | Total Ether sent to the account address |
| Total Ether Received | Total Ether received for the account address |
| Total Ether Sent Contracts | Total Ether sent to contract addresses |
| Total Ether Balance | Total Ether balance following enacted transactions |
| Total ERC20 Transactions | Total number of ERC20 token transfer transactions. |
| Total ERC20 Received (in Ether) | Total ERC20 token received transactions in Ether |
| Total ERC20 Sent (in Ether) | The total value of the ERC20 token sent in Ether |
| Total ERC20 Sent Contract (in Ether) | Total ERC20 token transfer to other contracts in Ether |
| Unique ERC20 Sent Address | Number of unique addresses that received ERC20 token transactions. |
| Unique ERC20 Received Address | Number of ERC20 token transactions received from Unique addresses |
| Unique ERC20 Received Contract Address | Number of ERC20 token transactions received from Unique contract addresses |
| Avg Time Between Sent Transaction (ERC20) | Average time (in minutes) between ERC20 token sent transactions |
| Avg Time Between Received Transaction (ERC20) | Average time (in minutes) between ERC20 token received transactions |
| Avg Time Between Contract Transaction (ERC20) | Average time (in minutes) ERC20 token between sent token transactions |
| Min Value Received (ERC20) | Minimum value (in Ether) received from ERC20 token transactions for the account. |
| Max Value Received (ERC20) | Maximum value (in Ether) received from ERC20 token transactions for the account. |
| Avg Value Received (ERC20) | Average value (in Ether) received from ERC20 token transactions for the account. |
| Minimum Value Sent (ERC20) | The minimum value (in Ether) sent from ERC20 token transactions for the account. |
| Maximum Value Sent (ERC20) | The maximum value (in Ether) sent from ERC20 token transactions for the account. |
| Average Value Sent (ERC20) | Average value (in Ether) sent from ERC20 token transactions for the account. |
| Min Value Sent Contract (ERC20) | The minimum value (in Ether) sent from ERC20 token transactions for the contract. |
| Max Value Sent Contract(ERC20) | The maximum value (in Ether) sent from ERC20 token transactions for the contract. |
| Avg Value Sent Contract (ERC20) | Average value (in Ether) sent from ERC20 token transactions for the contract. |
| Unique Sent Token Name (ERC20) | Number of Unique ERC20 tokens transferred |
| Unique Received Token Name (ERC20) | Number of Unique ERC20 tokens received |
| Most Sent Token Type (ERC20) | Most sent tokens for the account via an ERC20 transaction |
| Most Received Token Type (ERC20) | Most received tokens for the account via ERC20 transactions |
References
- Kumar, S.; Lim, W.M.; Sivarajah, U.; Kaur, J. Artificial intelligence and blockchain integration in business: Trends from a bibliometric-content analysis. Inf. Syst. Front. 2023, 25, 871–896. [Google Scholar] [CrossRef] [PubMed]
- Duy, P.T.; Hien, D.T.T.; Hien, D.H.; Pham, V.H. A survey on opportunities and challenges of Blockchain technology adoption for revolutionary innovation. In Proceedings of the 9th International Symposium on Information and Communication Technology, Da Nang City, Viet Nam, 6–7 December 2018. [Google Scholar]
- Global Blockchain Market Overview 2024–2028. PR Newswire. 2024. Available online: https://www.reportlinker.com/p04226790/?utm_source=PRN (accessed on 29 June 2024).
- Samanta, S.; Mohanta, B.K.; Pati, S.P.; Jena, D. A framework to build user profile on cryptocurrency data for detection of money laundering activities. In Proceedings of the 2019 International Conference on Information Technology (ICIT), Saratov, Russia, 7–8 February 2019; pp. 425–429. [Google Scholar]
- Lorenz, J.; Silva, M.I.; Aparício, D.; Ascensão, J.T.; Bizarro, P. Machine learning methods to detect money laundering in the bitcoin blockchain in the presence of label scarcity. In Proceedings of the First ACM International Conference on AI in Finance, New York, NY, USA, 15–16 October 2020; pp. 1–8. [Google Scholar]
- Calafos, M.W.; Dimitoglou, G. Cyber laundering: Money laundering from fiat money to cryptocurrency. In Principles and Practice of Blockchains; Springer: Cham, Switzerland, 2022; pp. 271–300. [Google Scholar]
- Sayadi, S.; Rejeb, S.B.; Choukair, Z. Anomaly detection model over blockchain electronic transactions. In Proceedings of the 2019 15th International Wireless Communications & Mobile Computing Conference (IWCMC), Tangier, Morocco, 24–28 June 2019; pp. 895–900. [Google Scholar]
- Ashfaq, T.; Khalid, R.; Yahaya, A.S.; Aslam, S.; Azar, A.T.; Alsafari, S.; Hameed, I.A. A machine learning and blockchain-based efficient fraud detection mechanism. Sensors 2022, 22, 7162. [Google Scholar] [CrossRef] [PubMed]
- Wu, J.; Lin, D.; Fu, Q.; Yang, S.; Chen, T.; Zheng, Z.; Song, B. Towards understanding asset flows in crypto money laundering through the lenses of Ethereum heists. IEEE Trans. Inf. Forensics Secur. 2023, 19, 1994–2009. [Google Scholar] [CrossRef]
- Fu, Q.; Lin, D.; Wu, J.; Zheng, Z. A general framework for the account risk rating on Ethereum: Toward safer blockchain technology. IEEE Trans. Comput. Soc. Syst. 2024, 11, 1865–1875. [Google Scholar] [CrossRef]
- Lin, D.; Wu, J.; Yu, Y.; Fu, Q.; Zheng, Z.; Yang, C. DenseFlow: Spotting cryptocurrency money laundering in Ethereum transaction graphs. In Proceedings of the ACM on Web Conference, Singapore, 13–17 May 2024; pp. 4429–4438. [Google Scholar]
- Zhou, F.; Chen, Y.; Zhu, C.; Jiang, L.; Liao, X.; Zhong, Z.; Chen, X.; Chen, Y.; Zhao, Y. Visual analysis of money laundering in cryptocurrency exchange. IEEE Trans. Comput. Soc. Syst. 2024, 11, 731–745. [Google Scholar] [CrossRef]
- Lv, W.; Liu, J.; Zhou, L. Detection of money laundering address over the Ethereum blockchain. In Proceedings of the 2023 5th International Conference on Frontiers Technology of Information and Computer (ICFTIC), Qiangdao, China, 17–19 November 2023; pp. 866–869. [Google Scholar]
- Saxena, R.; Arora, D.; Nagar, V. Classifying transactional addresses using supervised learning approaches over Ethereum blockchain. Procedia Comput. Sci. 2023, 218, 2018–2025. [Google Scholar] [CrossRef]
- Alarab, I.; Prakoonwit, S. Effect of data resampling on feature importance in imbalanced blockchain data: Comparison studies of resampling techniques. Data Sci. Manag. 2022, 5, 66–76. [Google Scholar] [CrossRef]
- Elmougy, Y.; Manzi, O. Anomaly detection on Bitcoin and Ethereum networks using GPU-accelerated machine learning methods. In Proceedings of the 2021 31st International Conference on Computer Theory and Applications (ICCTA), Alexandria, Egypt, 11–13 December 2021; pp. 166–171. [Google Scholar]
- Farrugia, S.; Ellul, J.; Azzopardi, G. Detection of illicit accounts over the Ethereum blockchain. Expert Syst. Appl. 2020, 150, 113318. [Google Scholar] [CrossRef]
- Yang, G.; Liu, X.; Li, B. Anti-money laundering supervision by intelligent algorithm. Comput. Secur. 2023, 132, 103344. [Google Scholar] [CrossRef]
- Badawi, A.A.; Al-Haija, Q.A. Detection of money laundering in bitcoin transactions. In Proceedings of the 4th Smart Cities Symposium, Online, 21–23 November 2021; pp. 458–464. [Google Scholar]
- Arigela, S.S.D.; Voola, P. Blockchain open source tools: Ethereum and Hyperledger Fabric. In Proceedings of the 2023 International Conference on Artificial Intelligence and Knowledge Discovery in Concurrent Engineering (ICECONF), Chennai, India, 5–7 January 2023; pp. 1–8. [Google Scholar]
- Sarathchandra, T.; Jayawikrama, D. A decentralized social network architecture. In Proceedings of the 2021 International Research Conference on Smart Computing and Systems Engineering (SCSE), Colombo, Sri Lanka, 16 September 2021; pp. 251–257. [Google Scholar]
- Maleh, Y.; Shojafar, M.; Alazab, M.; Romdhani, I. Blockchain for Cybersecurity and Privacy: Architectures, Challenges, and Applications; CRC Press: Boca Raton, FL, USA, 2020. [Google Scholar]
- Wen, B.; Wang, Y.; Ding, Y.; Zheng, H.; Qin, B.; Yang, C. Security and privacy protection technologies in securing blockchain applications. Inf. Sci. 2023, 645, 119322. [Google Scholar] [CrossRef]
- Sanka, A.I.; Irfan, M.; Huang, I.; Cheung, R.C. A survey of breakthrough in blockchain technology: Adoptions, applications, challenges and future research. Comput. Commun. 2021, 169, 179–201. [Google Scholar] [CrossRef]
- Raj, P.; Saini, K.; Surianarayanan, C. Edge/Fog Computing Paradigm: The Concept, Platforms and Applications; Academic Press: Cambridge, MA, USA; Elsevier Inc.: Amsterdam, The Netherlands, 2022. [Google Scholar]
- Aggarwal, S.; Kumar, N. Architecture of blockchain. In The Blockchain Technology for Secure and Smart Applications Across Industry Verticals; Advances in Computers; Academic Press: Cambridge, MA, USA, 2021; Volume 121, pp. 171–192. [Google Scholar]
- Mohanta, B.K.; Jena, D.; Panda, S.S.; Sobhanayak, S. Blockchain technology: A survey on applications and security privacy challenges. Internet Things 2019, 8, 100107. [Google Scholar] [CrossRef]
- Reyna, A.; Martín, C.; Chen, J.; Soler, E.; Díaz, M. On blockchain and its integration with IoT: Challenges and opportunities. Future Gener. Comput. Syst. 2018, 88, 173–190. [Google Scholar] [CrossRef]
- Chithanuru, V.; Ramaiah, M. An anomaly detection on blockchain infrastructure using artificial intelligence techniques: Challenges and future directions—A review. Concurr. Comput. Pract. Exp. 2023, 35, e7724. [Google Scholar] [CrossRef]
- Huynh, T.T.; Nguyen, T.D.; Tan, H. A survey on security and privacy issues of blockchain technology. In Proceedings of the 2019 International Conference on System Science and Engineering (ICSSE), Dong Hoi, Vietnam, 20–21 July 2019; pp. 362–367. [Google Scholar]
- Joshi, A.P.; Han, M.; Wang, Y. A survey on security and privacy issues of blockchain technology. Math. Found. Comput. 2018, 1, 121–147. [Google Scholar] [CrossRef]
- Singh, S.; Hosen, A.S.M.S.; Yoon, B. Blockchain security attacks, challenges, and solutions for the future distributed IoT network. IEEE Access 2021, 9, 13938–13959. [Google Scholar] [CrossRef]
- Homoliak, I.; Venugopalan, S.; Hum, Q.; Szalachowski, P. A security reference architecture for blockchains. In Proceedings of the 2019 IEEE International Conference on Blockchain (Blockchain), Atlanta, GA, USA, 14–17 July 2019; pp. 390–397. [Google Scholar]
- Jain, V.K.; Tripathi, M. Multi-objective approach for detecting vulnerabilities in Ethereum smart contracts. In Proceedings of the 2023 International Conference on Emerging Trends in Networks and Computer Communications (ETNCC), Windhoek, Namibia, 16–18 August 2023; pp. 1–6. [Google Scholar]
- Chen, T.; Zhu, Y.; Li, Z.; Chen, J.; Li, X.; Luo, X.; Lin, X.; Zhange, X. Understanding Ethereum via graph analysis. ACM Trans. Internet Technol. (TOIT) 2020, 20, 1–32. [Google Scholar] [CrossRef]
- Etherscan. Available online: https://etherscan.io (accessed on 20 February 2024).
- Cabello-Solorzano, K.; de Araujo, I.O.; Peña, M.; Correia, L.; Tallón-Ballesteros, A.J. The impact of data normalization on the accuracy of machine learning algorithms: A comparative analysis. In Proceedings of the International Conference on Soft Computing Models in Industrial and Environmental Applications, Salamanca, Spain, 5–7 September 2023; pp. 344–353. [Google Scholar]
- Kennedy, J.; Eberhart, R. Particle swarm optimization. In Proceedings of the ICNN’95-International Conference on Neural Networks, Perth, WA, Australia, 27 November–1 December 1995; Volume 4, pp. 1942–1948. [Google Scholar] [CrossRef]
- Yang, X.-S. Nature-Inspired Optimization Algorithms; Academic Press: Cambridge, MA, USA, 2020. [Google Scholar]
- Chawla, N.V.; Bowyer, K.W.; Hall, L.O.; Kegelmeyer, W.P. SMOTE: Synthetic minority over-sampling technique. J. Artif. Intell. Res. 2002, 16, 321–357. [Google Scholar] [CrossRef]
- Nguyen, Q.M.; Le, N.K.; Nguyen, L.M. Scalable and secure federated xgboost. In Proceedings of the 2023 IEEE International Conference on Acoustics, Speech and Signal Processing (ICASSP), Rhodes Island, Greece, 4–10 June 2023; pp. 1–5. [Google Scholar]
- Liu, F.T.; Ting, K.M.; Zhou, Z.H. Isolation forest. In Proceedings of the 2008 8th IEEE International Conference on Data Mining, Pisa, Italy, 15–19 December 2008; pp. 413–422. [Google Scholar]
- Shanthi, D.L.; Chethan, N. Genetic algorithm-based hyper-parameter tuning to improve the performance of machine learning models. SN Comput. Sci. 2022, 4, 119. [Google Scholar] [CrossRef]
- Alibrahim, A.; Ludwig, S.A. Hyperparameter optimization: Comparing genetic algorithm against grid search and Bayesian optimization. In Proceedings of the IEEE Congress on Evolutionary Computation, Kraków, Poland, 28 June–1 July 2021; pp. 1551–1559. [Google Scholar]
- Gen, M.; Lin, L. Genetic algorithms and their applications. In Springer Handbook of Engineering Statistics; Springer: London, UK, 2023; pp. 635–674. [Google Scholar]
- Li, H. Support vector machine. In Machine Learning Methods; Springer Nature: Singapore, 2023; pp. 127–177. [Google Scholar]
- Susmaga, R. Confusion matrix visualization. In Intelligent Information Processing and Web Mining, Proceedings of the International IIS: IIPWM ‘04 Conference, Zakopane, Poland, 17–20 May 2004; Springer: Berlin/Heidelberg, Germany, 2004; pp. 107–116. [Google Scholar]
Disclaimer/Publisher’s Note: The statements, opinions and data contained in all publications are solely those of the individual author(s) and contributor(s) and not of MDPI and/or the editor(s). MDPI and/or the editor(s) disclaim responsibility for any injury to people or property resulting from any ideas, methods, instructions or products referred to in the content. |
© 2025 by the authors. Licensee MDPI, Basel, Switzerland. This article is an open access article distributed under the terms and conditions of the Creative Commons Attribution (CC BY) license (https://creativecommons.org/licenses/by/4.0/).