1. Introduction
The evolution of digital communications has marked an epochal shift from centralized and predictable TCP/IP architectures toward the vast and fragmented ecosystem of the Internet of Things (IoT). This transition is not merely quantitative, linked to the number of devices, but qualitative, requiring a profound specialization of network modeling techniques. Today’s IoT infrastructures, characterized by massive node density and protocol heterogeneity, generate data flows where the boundary between signal and noise becomes extremely blurred. Standard linear and stochastic models are increasingly inadequate for capturing the ‘deterministic noise’ and transient phenomena that define modern traffic, failing to predict sudden saturations or system micro-instabilities. In this scenario, a specialized application of Chaos Theory offers a superior analytical lens capable of treating network fluctuations not as simple random errors to be filtered out but as structured patterns endowed with their own dynamic signature. Within this theoretical framework, the paradigm of Vibe Coding emerges: an approach that utilizes artificial intelligence to decode the ‘vibe’ (the dynamic vibration) of network telemetry, transforming raw data into a semantic understanding of system health. This research delves into how such specialization enables the mapping of the phase space of IoT interactions, allowing AI to distinguish with surgical precision between natural perturbations—due to physical interference or congestion—and anomalies induced by sophisticated cyber-attacks such as jamming or injection. By integrating chaos mathematics with Vibe Coding, the objective is to redefine security and stability parameters, moving from reactive defense to a native and predictive resilience, which is indispensable for next-generation critical infrastructures.
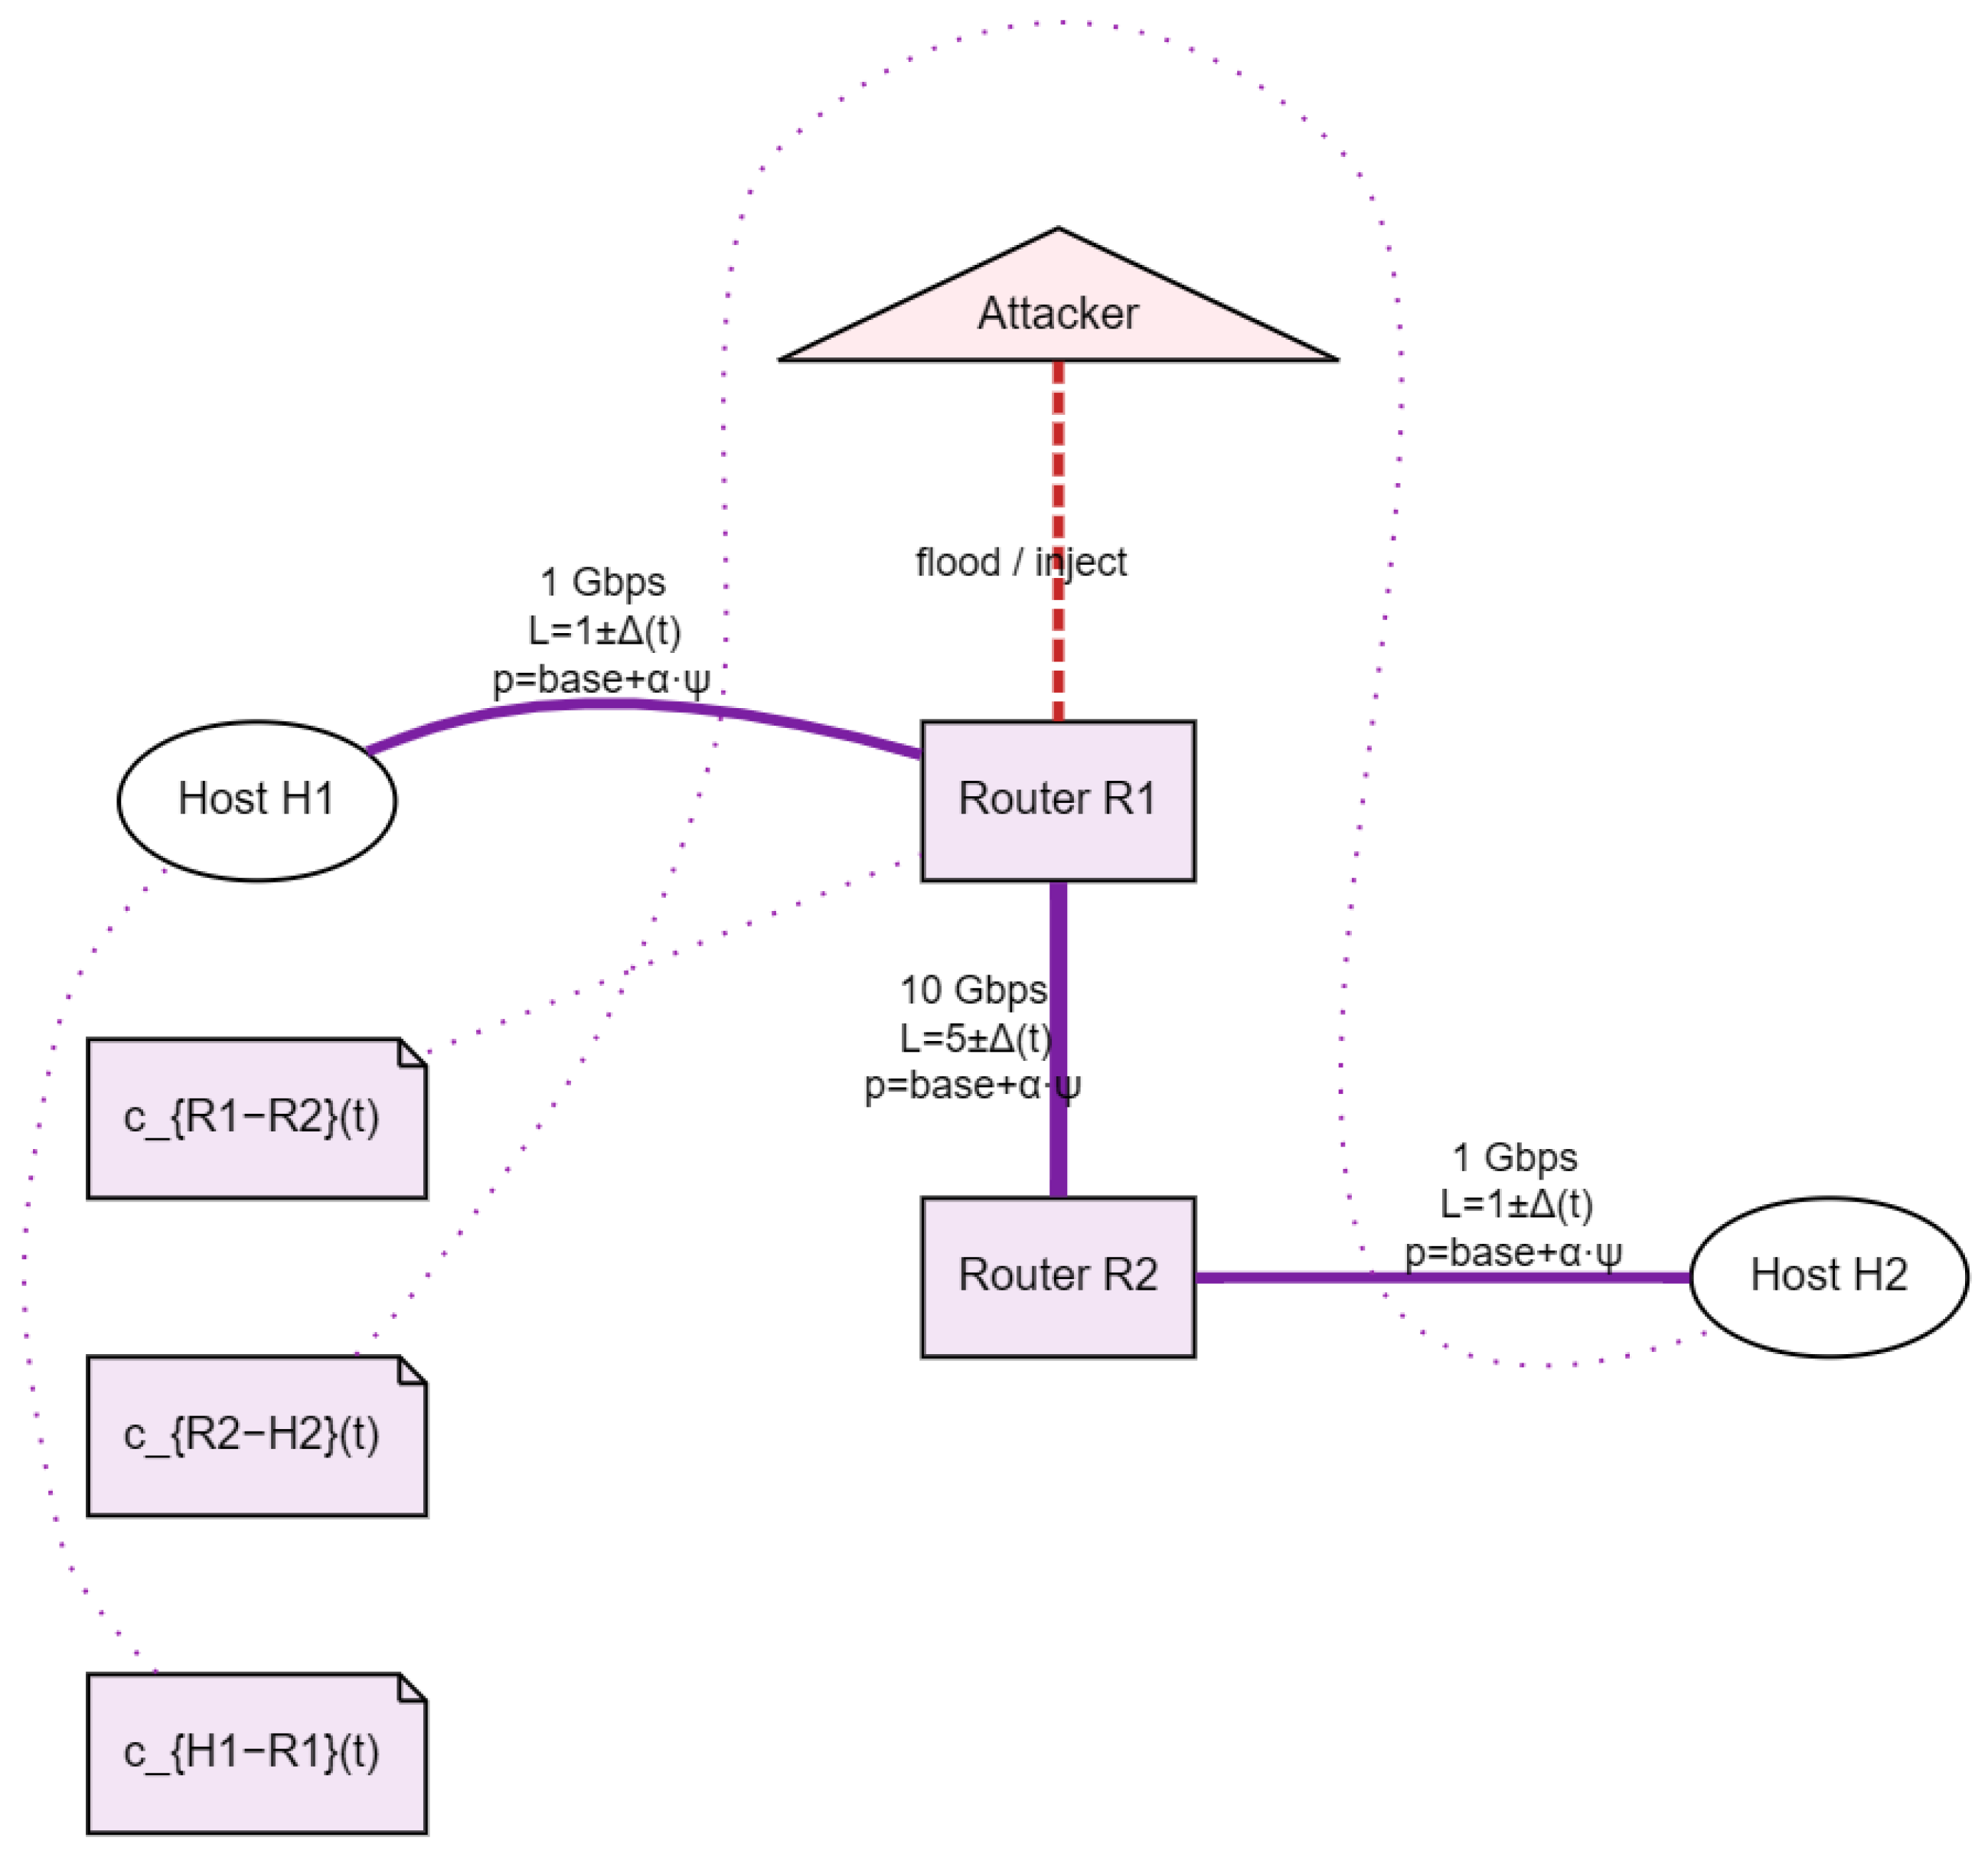
The structural evolution of the network under different operational conditions is visualized through a series of topological snapshots. In
Figure 1, the
Quiescent Topology is presented. This figure illustrates the baseline state of the network where traffic flows are regular and predictable, characterized by stable connections between the IoT edge nodes and the gateway without external interference. When environmental noise or network jitter is introduced, the system transitions to the state shown in
Figure 2. The
Perturbed Topology demonstrates how chaotic fluctuations begin to affect the communication links, creating non-linear patterns in packet arrival times, although no malicious intent is present. The introduction of an active threat is depicted in
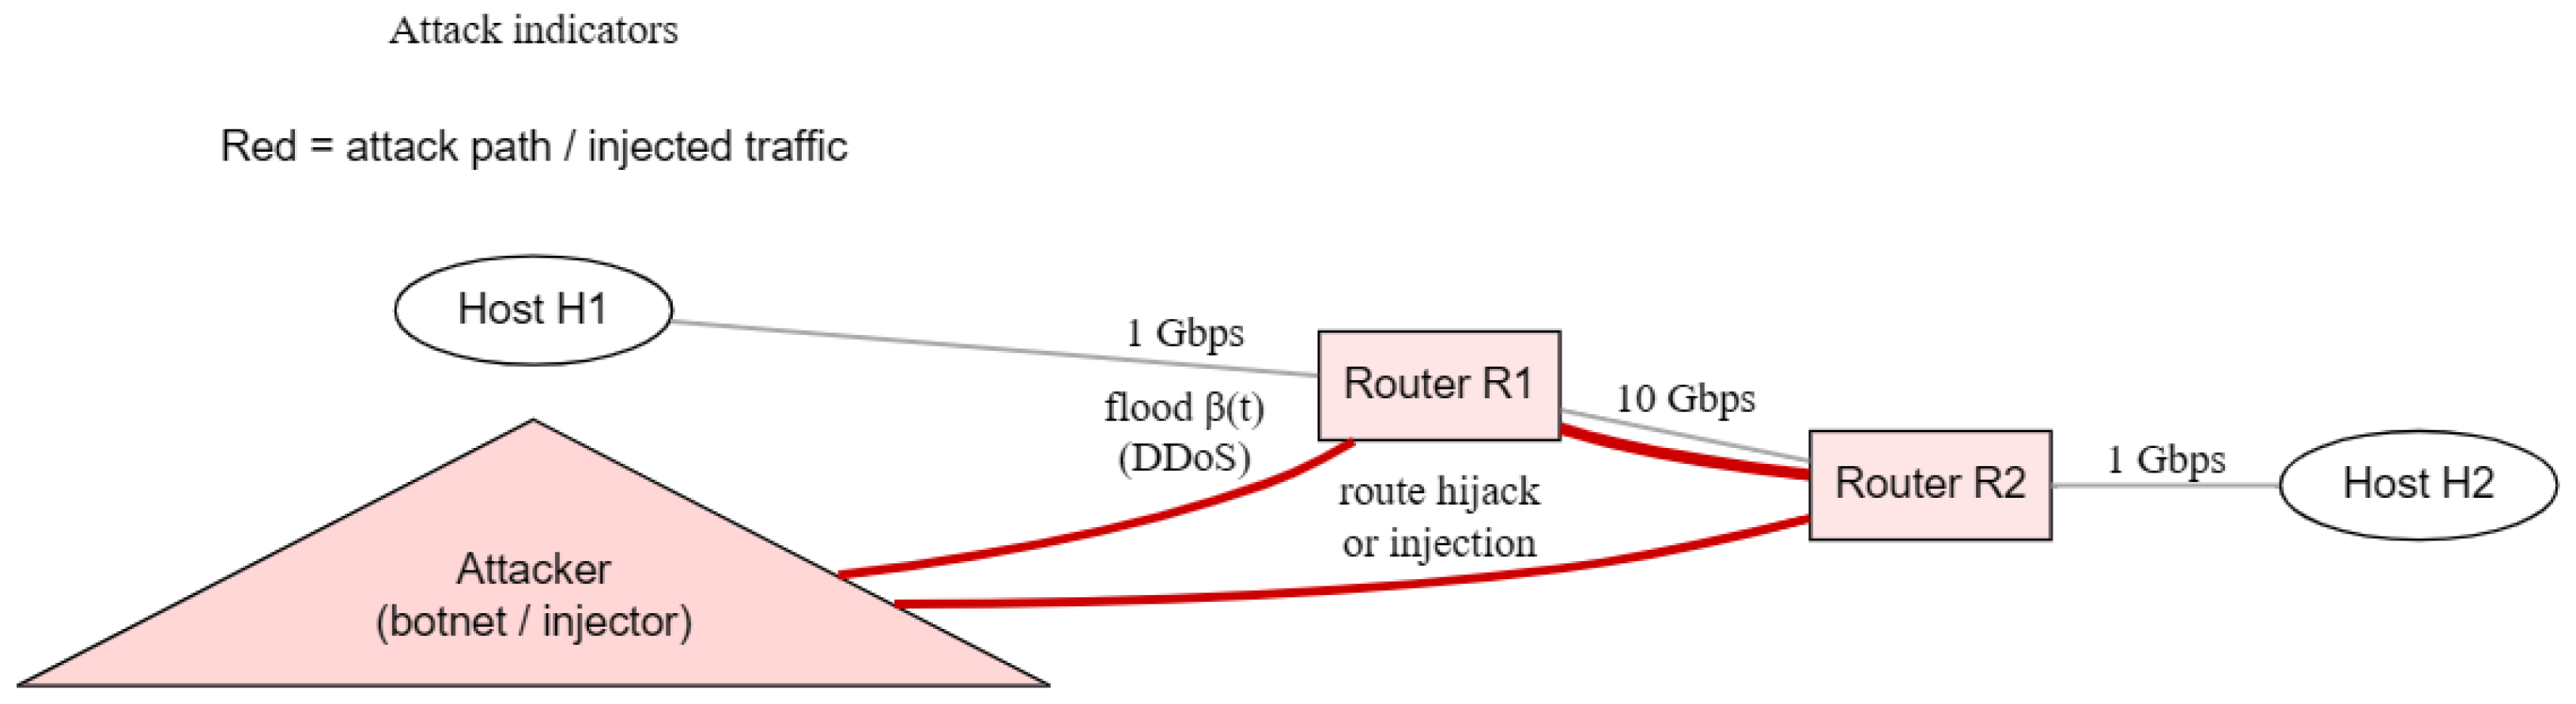
Figure 3. This
Attacked Topology highlights the structural deviation caused by a cyber-attack (such as a DDoS or Brute Force). Unlike simple noise,
Figure 3 shows targeted traffic spikes and connection anomalies that override standard operational signatures. Finally,
Figure 4 shows the most complex scenario: the
Perturbed–Attacked Topology. This figure visualizes the intersection of environmental chaos and malicious activity. As demonstrated in
Figure 4, the superposition of these two factors creates a high degree of entropy, making it the most challenging state for traditional anomaly detection systems to interpret without the use of Vibe Coding.
2. Related Works
In [
1], predictive models for next-cell coverage errors in 5G/6G networks are investigated, highlighting how variations in cellular coverage range influence mobility prediction accuracy under highly dynamic conditions. These theoretical insights on coverage-induced dynamics provide a useful foundation for AI-driven adaptive mechanisms in complex IoT scenarios, particularly in rural cellular networks, where connectivity fluctuations may exhibit chaotic behavior.
The integration of artificial intelligence and advanced mathematical modeling has become pivotal in addressing modern cybersecurity and software engineering challenges. Gentile and Cilione [
2] established a foundation for this by combining Chaos Theory with AI to model unpredictable perturbations and adversarial threats in TCP/IP networks. Similarly, Alabdulkreem et al. [
3] explored intelligent classification through Chaos Game Optimization and deep learning, while Wang et al. [
4] applied multimodal semantic fusion networks to enhance signal recognition in UAV-assisted systems.
In the domain of the Internet of Things (IoT), Aleisa [
5] introduced a blockchain-enabled Zero Trust Architecture to ensure privacy preservation. Saeed [
6] further improved IoT security by integrating LSTM-based anomaly detection with post-quantum encryption, and Zahid and Bharati [
7] proposed hybrid deep learning models for real-time attack identification. Compliance and architectural concerns were addressed by Oranekwu et al. [
8] through ontology-driven reasoning and by Abdelwahed et al. [
9] in their survey of multi-protocol gateways. Human-centric security was also highlighted by Jaigirdar et al. [
10], focusing on situational awareness in medical IoT.
Advancements in Intrusion Detection Systems (IDS) have also gained traction, with Alanezi et al. [
11] utilizing generative AI for edge-based detection. Researchers such as Shankar et al. [
12] and Chliah et al. [
13] developed hybrid architectures to specifically manage imbalanced datasets in network security. Automotive security also saw progress through the work of Guerra et al. [
14], who analyzed AI-driven IDS for Controller Area Networks.
Finally, a paradigm shift in development is evidenced by the emergence of ‘Vibe Coding,’ with Meske et al. [
15] defining it as a reconfiguration of intent mediation in software creation. Borg et al. [
16] characterized it as a new prototyping playbook, while Fortes-Ferreira et al. [
17] and Sarkar and Drosos [
18] demonstrated its practical efficacy in programming through AI-led conversation. For secure data transmission, Alalwan et al. [
19] contributed a hybrid cryptosystem leveraging DNA sequences and Mandelbrot keys. Recent advancements in IoT security have explored the transformation of network traffic into visual or dynamic signatures to enhance anomaly detection in IP-based sensor networks. For instance, Gentile et al. [
20] demonstrated the effectiveness of encoding MQTT protocol behaviors into images for Convolutional Neural Networks (CNNs). This work establishes a significant precedent for real-time analysis in smart city environments, proving that non-linear traffic encoding is foundational for identifying critical system failures and malicious patterns in constrained IoT infrastructures.
3. Mathematical Problem Formulation
The Intrusion Detection System (IDS) for IoT networks can be modeled as an anomaly detection task within a non-linear dynamical system. Let
S represent the IoT network system, defined within a state space
. The temporal evolution of network traffic is governed by the mapping:
where
denotes the feature vector (e.g., packet rate, byte count, inter-arrival times) at time
t,
represents the protocol-specific parameters, and
accounts for stochastic environmental noise. Under an adversarial condition, the system is subjected to an exogenous perturbation
A, modifying the dynamics to
. The objective is to formulate a decision function
that minimizes the classification error between benign and malicious traffic. This is achieved by evaluating the Lyapunov exponents
, which quantify the sensitivity to initial conditions and distinguish between inherent deterministic chaos and instability induced by external attacks.
4. Scenario Specification: IDS, IoT, and Chaos with Vibe Coding
In this framework, the IoT network is conceptualized not as a discrete sequence of packets but as a continuous flow of signals characterized by a unique ‘vibrational signature’ (Vibe Coding).
IoT Environment: Defined by low-resource devices generating bursty, highly correlated traffic patterns.
Chaos Analysis: Utilizing Time Delay Embedding (TDE) to reconstruct the system’s attractor. In a ‘healthy’ state, the attractor exhibits a stable fractal structure; an attack (e.g., Mirai botnet or DDoS) collapses this structure, significantly increasing the system’s entropic dimension.
Vibe Coding Logic: An AI-assisted paradigm that interprets the ‘rhythm’ or ‘vibe’ of network fluctuations. By mapping raw latency and jitter into the phase space, the AI identifies subtle shifts in the network’s dynamic signature before a total failure occurs.
5. Categorization of Network Scenarios
We formally categorize the network state into four distinct scenarios based on the system’s dynamic response:
- 1.
Quiescent (): Equilibrium state. The Lyapunov exponent . Traffic is regular and follows nominal protocol behavior.
- 2.
Perturbed (): Congestion or interference. but bounded. The system exhibits deterministic chaotic behavior without malicious intent.
- 3.
Attacked (): Presence of an active threat (e.g., Brute Force). This causes a drastic alteration of the attractor topology and rapid saturation of network nodes.
- 4.
Perturbed–Attacked (): The most critical scenario where an attack is masked by background noise or heavy congestion. This requires Deep Learning to decouple natural chaotic variance from malicious perturbations.
5.1. Methodological Rationale and Dataset Validity
Unlike conventional feature engineering, which often relies on static statistical aggregations,
Vibe Coding focuses on the stochastic evolution of network signals by treating chaotic noise (
) and perturbation frequency (
) as intrinsic features rather than outliers. This approach allows the model to learn the dynamic ‘vibration’ of the network state, providing inherent robustness against the jitter typical of IoT environments. While public benchmarks like UNSW-NB15 serve as standards for static attack detection, they lack the raw temporal granularity required to model such chaotic perturbations. Consequently, we utilize a custom laboratory dataset, captured following the methodology established in [
20], which preserves the micro-fluctuations necessary for our analysis. To ensure generalizability and reproducibility, all reported results are the product of 10-fold statistical validation across multiple chaotic seeds, demonstrating the model’s stability under non-deterministic conditions.
5.2. Security Implications and Pre-Cryptographic Defense
While the primary focus of this study is the application of Chaos Theory to anomaly detection, the proposed Vibe Coding framework serves as a critical infrastructure for cryptographic resilience in IoT networks. In resource-constrained environments, traditional encryption layers are often vulnerable to side-channel attacks or timing analyses that exploit network fluctuations. Our approach provides a ‘pre-cryptographic’ security layer: by identifying structural chaotic anomalies before they reach the decryption engine, the system can detect attempts to degrade signal integrity or manipulate encrypted packet sequences (e.g., replay attacks or man-in-the-middle interventions in MQTT flows). Thus, Vibe Coding enhances the overall cryptographic chain by ensuring that the underlying transport channel maintains the entropy and stability required for secure data exchange.
6. Chaos Injection Framework and Scenario Formalization
To evaluate the robustness of the proposed Intrusion Detection System (IDS) under dynamic uncertainty, we implement a controlled chaos injection layer. This methodology provides the formal operational definition for the Vibe Coding concept requested during the review process, moving beyond a purely conceptual description to a structured input–transformation–output framework. This layer transforms raw network signals into perturbed datasets to simulate both natural network fluctuations and intentional adversarial manipulations. The chaos injection process is mathematically defined by two primary stochastic parameters:
Chaos Rate (): Defines the probability that a specific normal network flow will be selected for perturbation ().
Noise Range (): Represents the maximum percentage of deviation (positive or negative) applied to the original numerical features of the flow, such as packet counts, byte sizes, and duration.
The proposed framework evaluates network behavior across four fundamental operational states: Quiescent, Perturbed, Attacked, and Perturbed–Attacked. While these categories define the intrinsic nature of the network environment, we introduce a secondary analytical layer—Chaos Injection—to stress-test the model’s resilience within these states.
This layer provides a formal operational definition for the
Vibe Coding paradigm by applying stochastic perturbations to the dataset. To ensure a comprehensive robustness analysis, we have mapped the four base conditions against five specific Chaos Scenarios. These scenarios, detailed in
Table 1, define the frequency (
) and intensity (
) of the noise injected during the evaluation phase, addressing the need for technical clarity on parameters like
Widespread_Slight noted in previous sections. By utilizing this framework, the model is evaluated not only on clean data but also through robustness metrics such as
and
, ensuring scientific rigor and reproducibility.
7. Logical Scheme of the Algorithms
The integration between Chaos Theory and AI is executed through the following algorithmic workflow in Algorithms 1 and 2:
| Algorithm 1 Phase Space Reconstruction |
- 1:
Input: Time series of network traffic . - 2:
Step 1: Compute time delay using the first local minimum of the Mutual Information function. - 3:
Step 2: Determine the embedding dimension m via the False Nearest Neighbors (FNN) method. - 4:
Output: Reconstructed vectors .
|
| Algorithm 2 Vibe-Based AI Classifier |
- 1:
Preprocessing: Apply StandardScaler to the reconstructed vectors to ensure zero mean and unit variance. - 2:
Feature Extraction: Derive chaos-specific features including the Maximal Lyapunov Exponent (MLE), Shannon Entropy, and the Hurst Exponent. - 3:
Inference: Input the augmented vector into a Deep Neural Network (or Random Forest for edge-resource efficiency). - 4:
Decision: Output attack probability based on an adaptive threshold tuned to the network’s ‘vibe’ intensity.
|
8. Framework Introduction
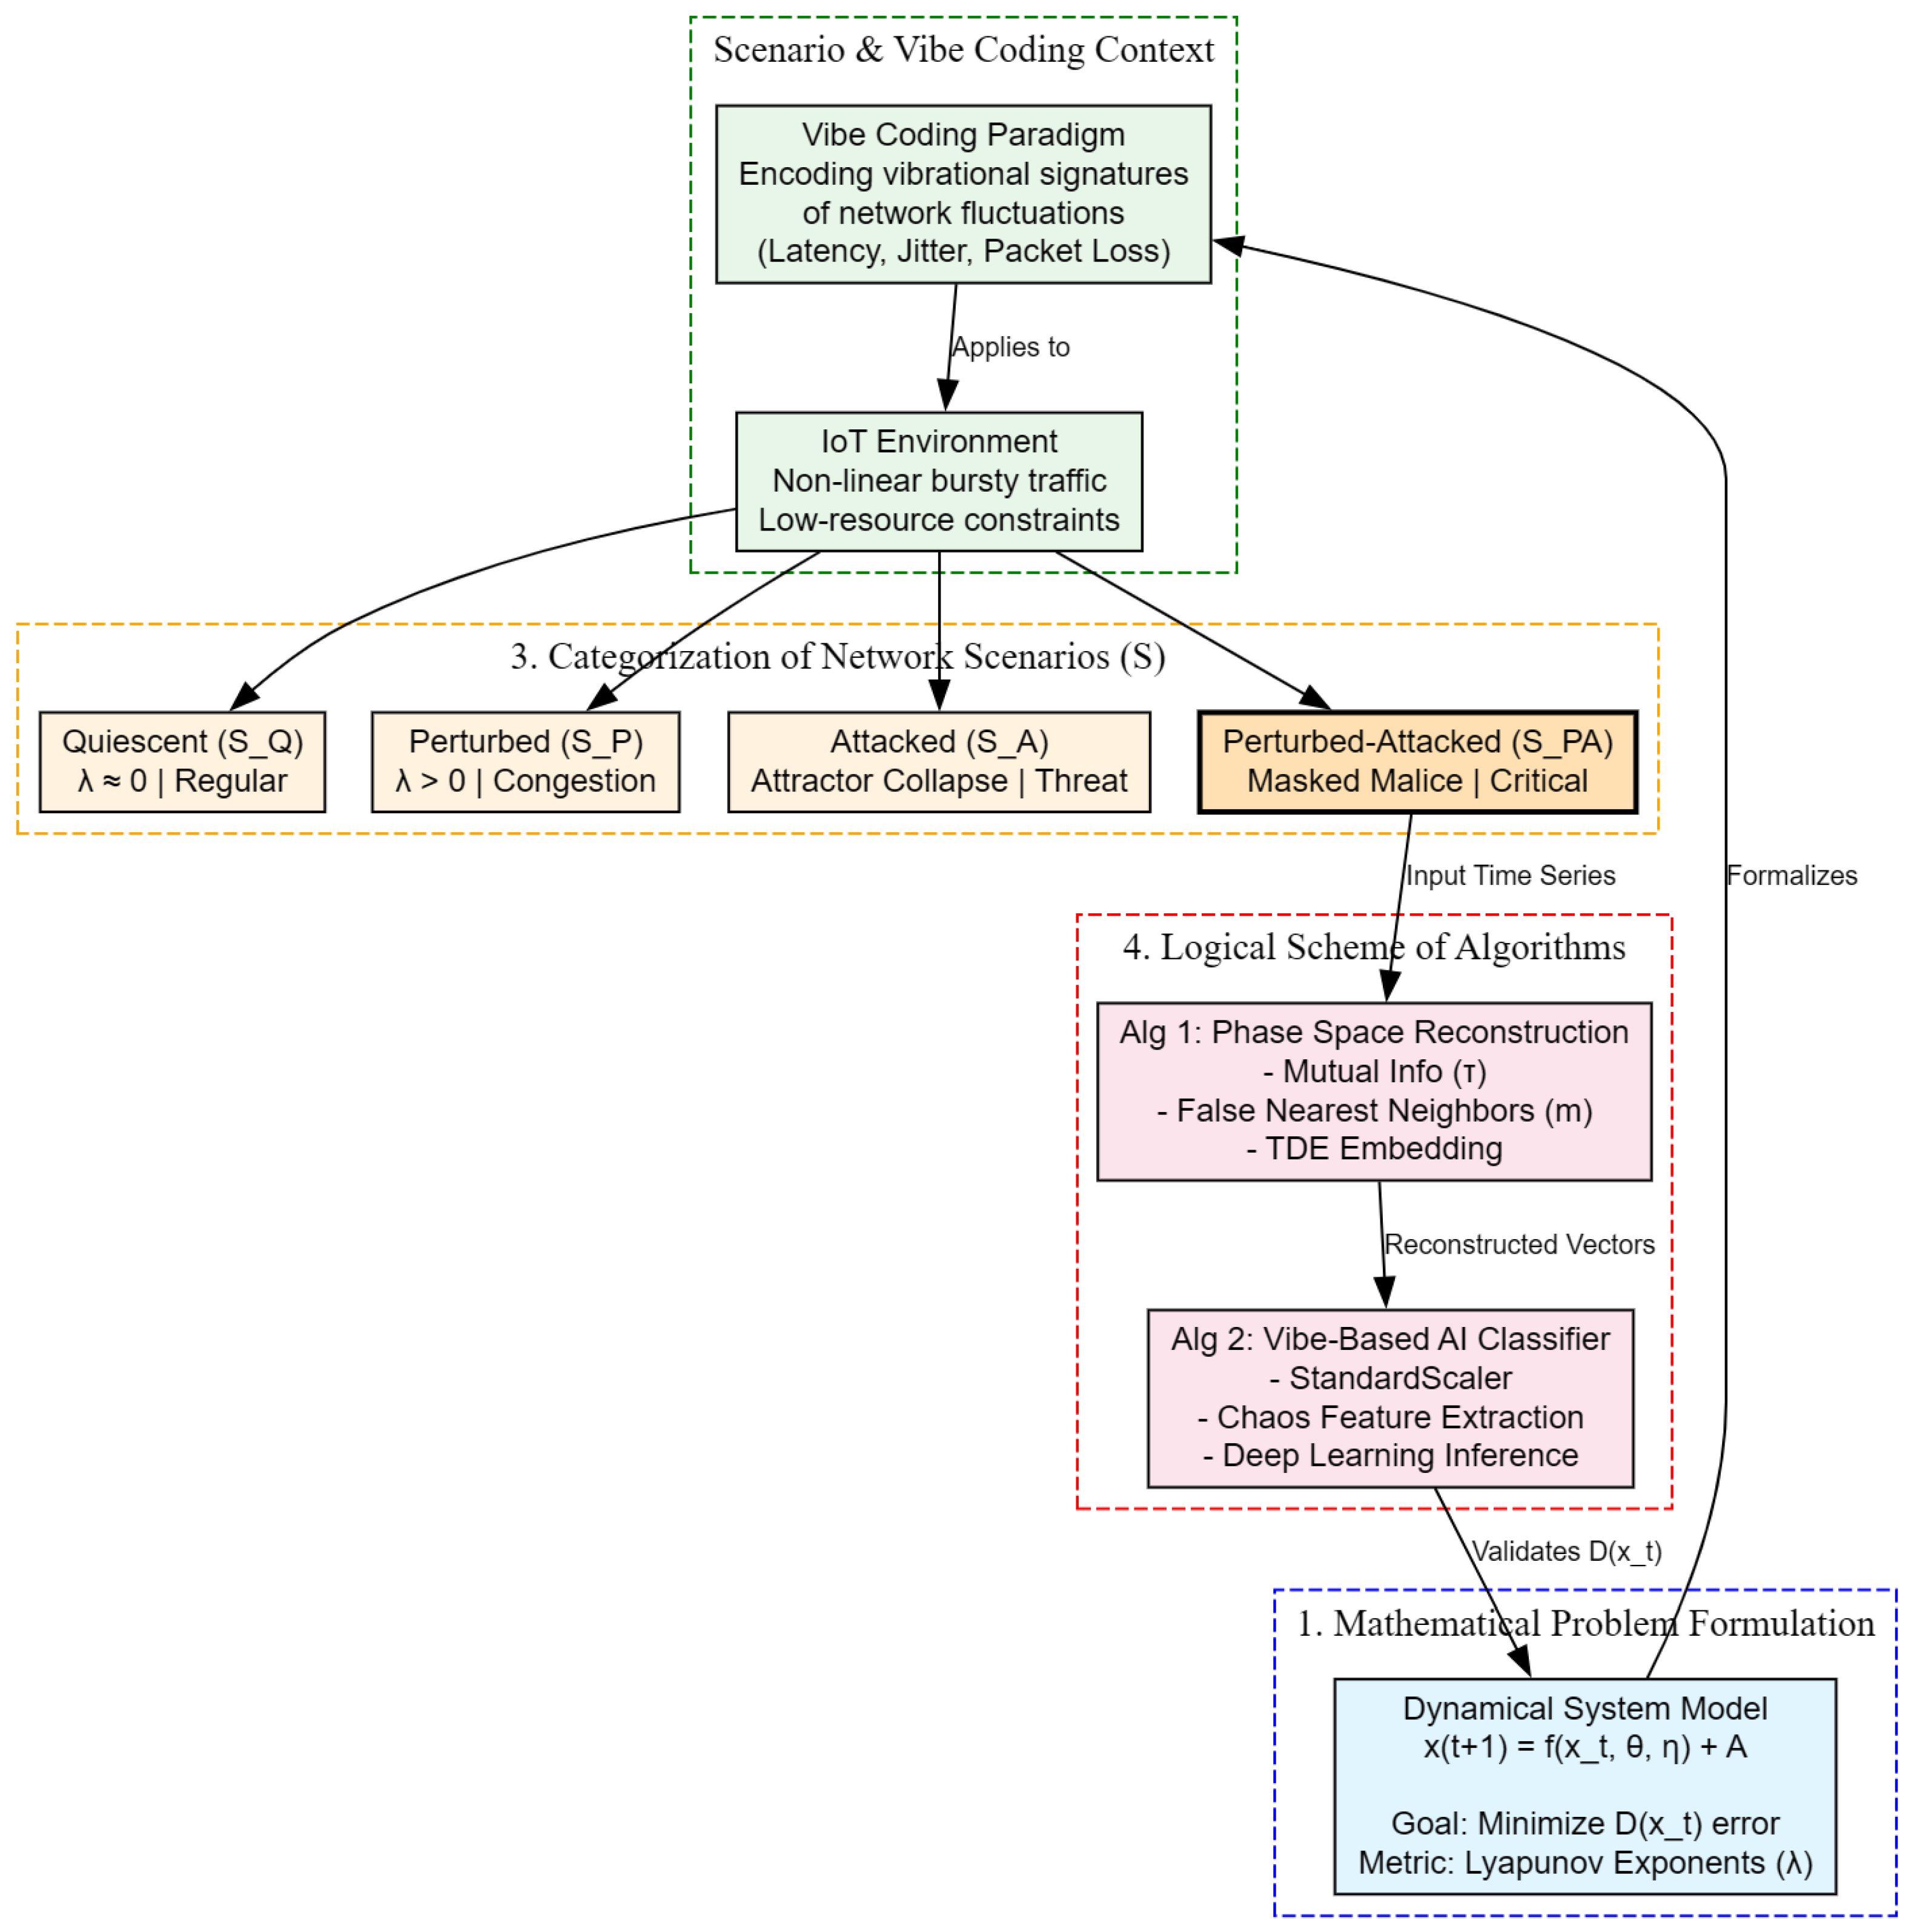
The proposed framework integrates Chaos Theory with the Vibe Coding paradigm for intrusion detection in IoT networks. The logical diagram illustrates the transition from mathematical formalization to algorithmic implementation, highlighting how non-linear dynamics are transformed into feature vectors for Deep Learning models.
8.1. Mathematical Formulation
The system is modeled as a discrete dynamical system . In this phase, the primary objective is to monitor the stability of the system’s attractor. The fundamental metric is the Lyapunov exponent (), which indicates sensitivity to initial conditions and the chaotic nature of network traffic.
Scenario Specification and Vibe Coding
Vibe Coding acts as a bridge between raw signals and artificial intelligence. It encodes network ‘vibrations’ (latency, jitter, packet loss) not as mere statistics but as dynamic signatures. This approach is particularly effective in IoT environments where resources are constrained and traffic is inherently intermittent.
8.2. Formalization of Vibe Coding: From Raw Signals to Dynamic Signatures
The core of the proposed methodology lies in the Vibe Coding paradigm, which acts as a bridge between raw network signals and artificial intelligence. Unlike traditional feature engineering that treats network metrics as static averages, Vibe Coding interprets the ‘vibration’ of the network—defined by the rapid fluctuations in latency, jitter, and packet loss—as a unique dynamic signature.
8.2.1. Operational Logic and Metacode
To formalize this approach, we define the transformation process through a stochastic-analytical layer. This process ensures that the ‘vibe’ of a network flow is not just captured, but ‘encoded’ to be resilient to chaos. Building upon the foundations laid in Algorithms 1 and 2, the operational logic can be described by the following metacode structure in Algorithm 3, which governs the transition from raw flow data to a chaos-aware representation:
| Algorithm 3 Vibe Coding Signal Transformation |
- 1:
Input: Raw Flow Block where f includes packets, bytes, duration. - 2:
Parameters: Chaos Rate (), Noise Range (). - 3:
Procedure: - 4:
for all flow in F do - 5:
Calculate base dynamic signature: - 6:
if
then - 7:
{Apply Chaos Injection (Vibe Perturbation)} - 8:
for all numerical_key k in do - 9:
- 10:
- 11:
end for - 12:
Set - 13:
else - 14:
Set - 15:
end if - 16:
Output: Encoded Vibe - 17:
end for
|
8.2.2. The Bridge to AI
In this framework, the Vibe Coding acts as a bridge between raw signals and artificial intelligence and a non-linear mapping function , where the input space (raw signals) is projected into a robust feature space. This is particularly effective in IoT environments due to three technical factors:
- 1.
Intermittency Encoding: Instead of penalizing intermittent traffic (typical of IoT), Vibe Coding treats silence and bursts as part of the flow’s ‘vibe,’ preventing false positives in KNN and XGBoost classifiers.
- 2.
Resource Optimization: By focusing on five key numerical indicators (pkts_toserver, pkts_toclient, bytes_toserver, bytes_toclient, duration), the encoding maintains a low computational footprint suitable for edge devices.
- 3.
Chaos Resilience: By training the AI on the
Massive_Extreme and
Widespread_Slight scenarios (see
Table 1), the Vibe Coding layer ‘teaches’ the model to distinguish between natural jitter and malicious volatility.
8.3. Algorithmic Logic Flow
The pipeline concludes with two operational phases:
- 1.
Algorithm 1 (Phase Space Reconstruction): Uses Time Delay Embedding (TDE) to reconstruct the phase space by calculating the delay () and the embedding dimension (m).
- 2.
Algorithm 2 (AI Classifier): A Deep Learning model that processes extracted features to validate the prediction error and identify anomalies in real-time.
The diagram in
Figure 5 demonstrates that the integration of chaos analysis and AI is not just a technological overlap but a methodological synergy where mathematics provides the interpretive foundation and AI provides the generalization capability for complex scenarios.
9. Analysis of KNN and XGBoost for Chaos-Based Intrusion Detection
A total of 500,000 network flows were captured over a 48-h period, representing the four operational states (Quiescent, Perturbed, Attacked, Perturbed–Attacked). This ‘clean’ baseline was then processed through the Chaos Injection engine described in
Section 5 to generate the five stress-test scenarios.
9.1. Dataset Generation and Experimental Testbed
The evaluation is performed on a custom dataset generated within our IoT security laboratory, building upon the experimental infrastructure described in [
20].
The raw data was captured from a physical testbed comprising:
Edge Layer: Twenty ESP32 and Raspberry Pi nodes simulating heterogeneous IoT sensors (DHT22, LDR) communicating via MQTT and HTTP.
Network Layer: A central gateway running Suricata IDS to monitor traffic and generate JSONL flow logs.
Attack Layer: A dedicated Kali Linux node used to inject malicious traffic (DDoS, Brute Force, and Port Scanning).
In the context of the Chaos-IDS framework, selecting the appropriate classification algorithm is critical for distinguishing between legitimate network congestion () and malicious activities masked by noise (). This document evaluates the pros and cons of K-Nearest Neighbors (KNN) and XGBoost when processing features derived from Chaos Theory, such as Lyapunov Exponents and Correlation Dimensions.
9.2. K-Nearest Neighbors (KNN)
KNN is a non-parametric, instance-based learning algorithm that classifies data points based on their geometric proximity in the feature space.
9.2.1. Pros
Geometric Alignment with Phase Space: Since Chaos Theory often involves Time Delay Embedding (TDE) to reconstruct phase space, KNN is naturally suited to identify similar trajectories or neighboring states in the attractor.
Lazy Learning: It requires no explicit training phase and simply stores the training instances, which can be useful for dynamic updates.
Effectiveness on Well-Separated Manifolds: If chaotic features provide a clear topological separation, KNN can achieve high accuracy with minimal configuration.
9.2.2. Cons
Inference Latency: Calculating distances to all training points for every new packet is computationally expensive (), posing challenges for real-time IoT monitoring.
Sensitivity to Feature Scaling: KNN relies strictly on distance metrics; therefore, features on different scales (e.g., Jitter vs. Entropy) must be normalized via StandardScaler.
Curse of Dimensionality: As the number of chaotic descriptors increases, the distance between points becomes less meaningful, degrading performance.
9.3. XGBoost (Extreme Gradient Boosting)
XGBoost is a scalable, distributed gradient-boosted decision tree (GBDT) library designed for high performance and efficiency.
9.3.1. Pros
Non-Linear Relationship Modeling: IoT attacks in perturbed scenarios () exhibit complex, non-linear patterns that decision trees capture more effectively than distance-based methods.
Feature Importance: XGBoost provides built-in mechanisms to rank features, allowing researchers to identify which chaotic parameters (e.g., embedding dimension) are most indicative of an attack.
Operational Efficiency: Once trained, the inference time is extremely fast, making it ideal for Edge Computing deployments.
Robustness: It handles outliers and missing values gracefully, reducing the impact of transient network noise.
9.3.2. Cons
Overfitting Risk: Without proper regularization (tuning parameters like eta or max_depth), it may memorize noise in the scenario rather than learning generalizable attack patterns.
Hyperparameter Complexity: Achieving optimal results requires significant effort in tuning learning rates, subsampling, and tree depth.
Interpretability: While it provides feature importance, the internal logic of an ensemble of hundreds of trees is less intuitive than the ‘nearest neighbor’ logic.
9.4. Summary Comparison
While
KNN serves as an excellent tool for initial validation due to its topological intuition,
XGBoost is the superior choice for a production-ready Chaos-IDS, as summarized in
Table 2. Its ability to handle high-dimensional non-linearities and its rapid inference speed are crucial for securing high-density IoT ecosystems.
10. Experimental Results and AI Analysis
This section details the experimental results obtained from evaluating the K-Nearest Neighbor (KNN) and XGBoost models under baseline conditions and various chaotic attack scenarios. The analysis focuses on key performance indicators (KPIs) such as Accuracy, F1-Score (for the attack class, F1_Score_1), and ROC Area Under the Curve (AUC).
10.1. Baseline Performance
Under quiescent (non-chaotic, non-attacked) conditions, both models exhibit high performance, indicating their effectiveness in distinguishing between normal and attack traffic when the network environment is stable.
Table 3 summarizes the baseline metrics.
Both models demonstrate excellent discriminative power, with Accuracy, ROC AUC, and F1-Scores consistently above 97%. These figures establish a strong foundation for evaluating model robustness against chaotic perturbations.
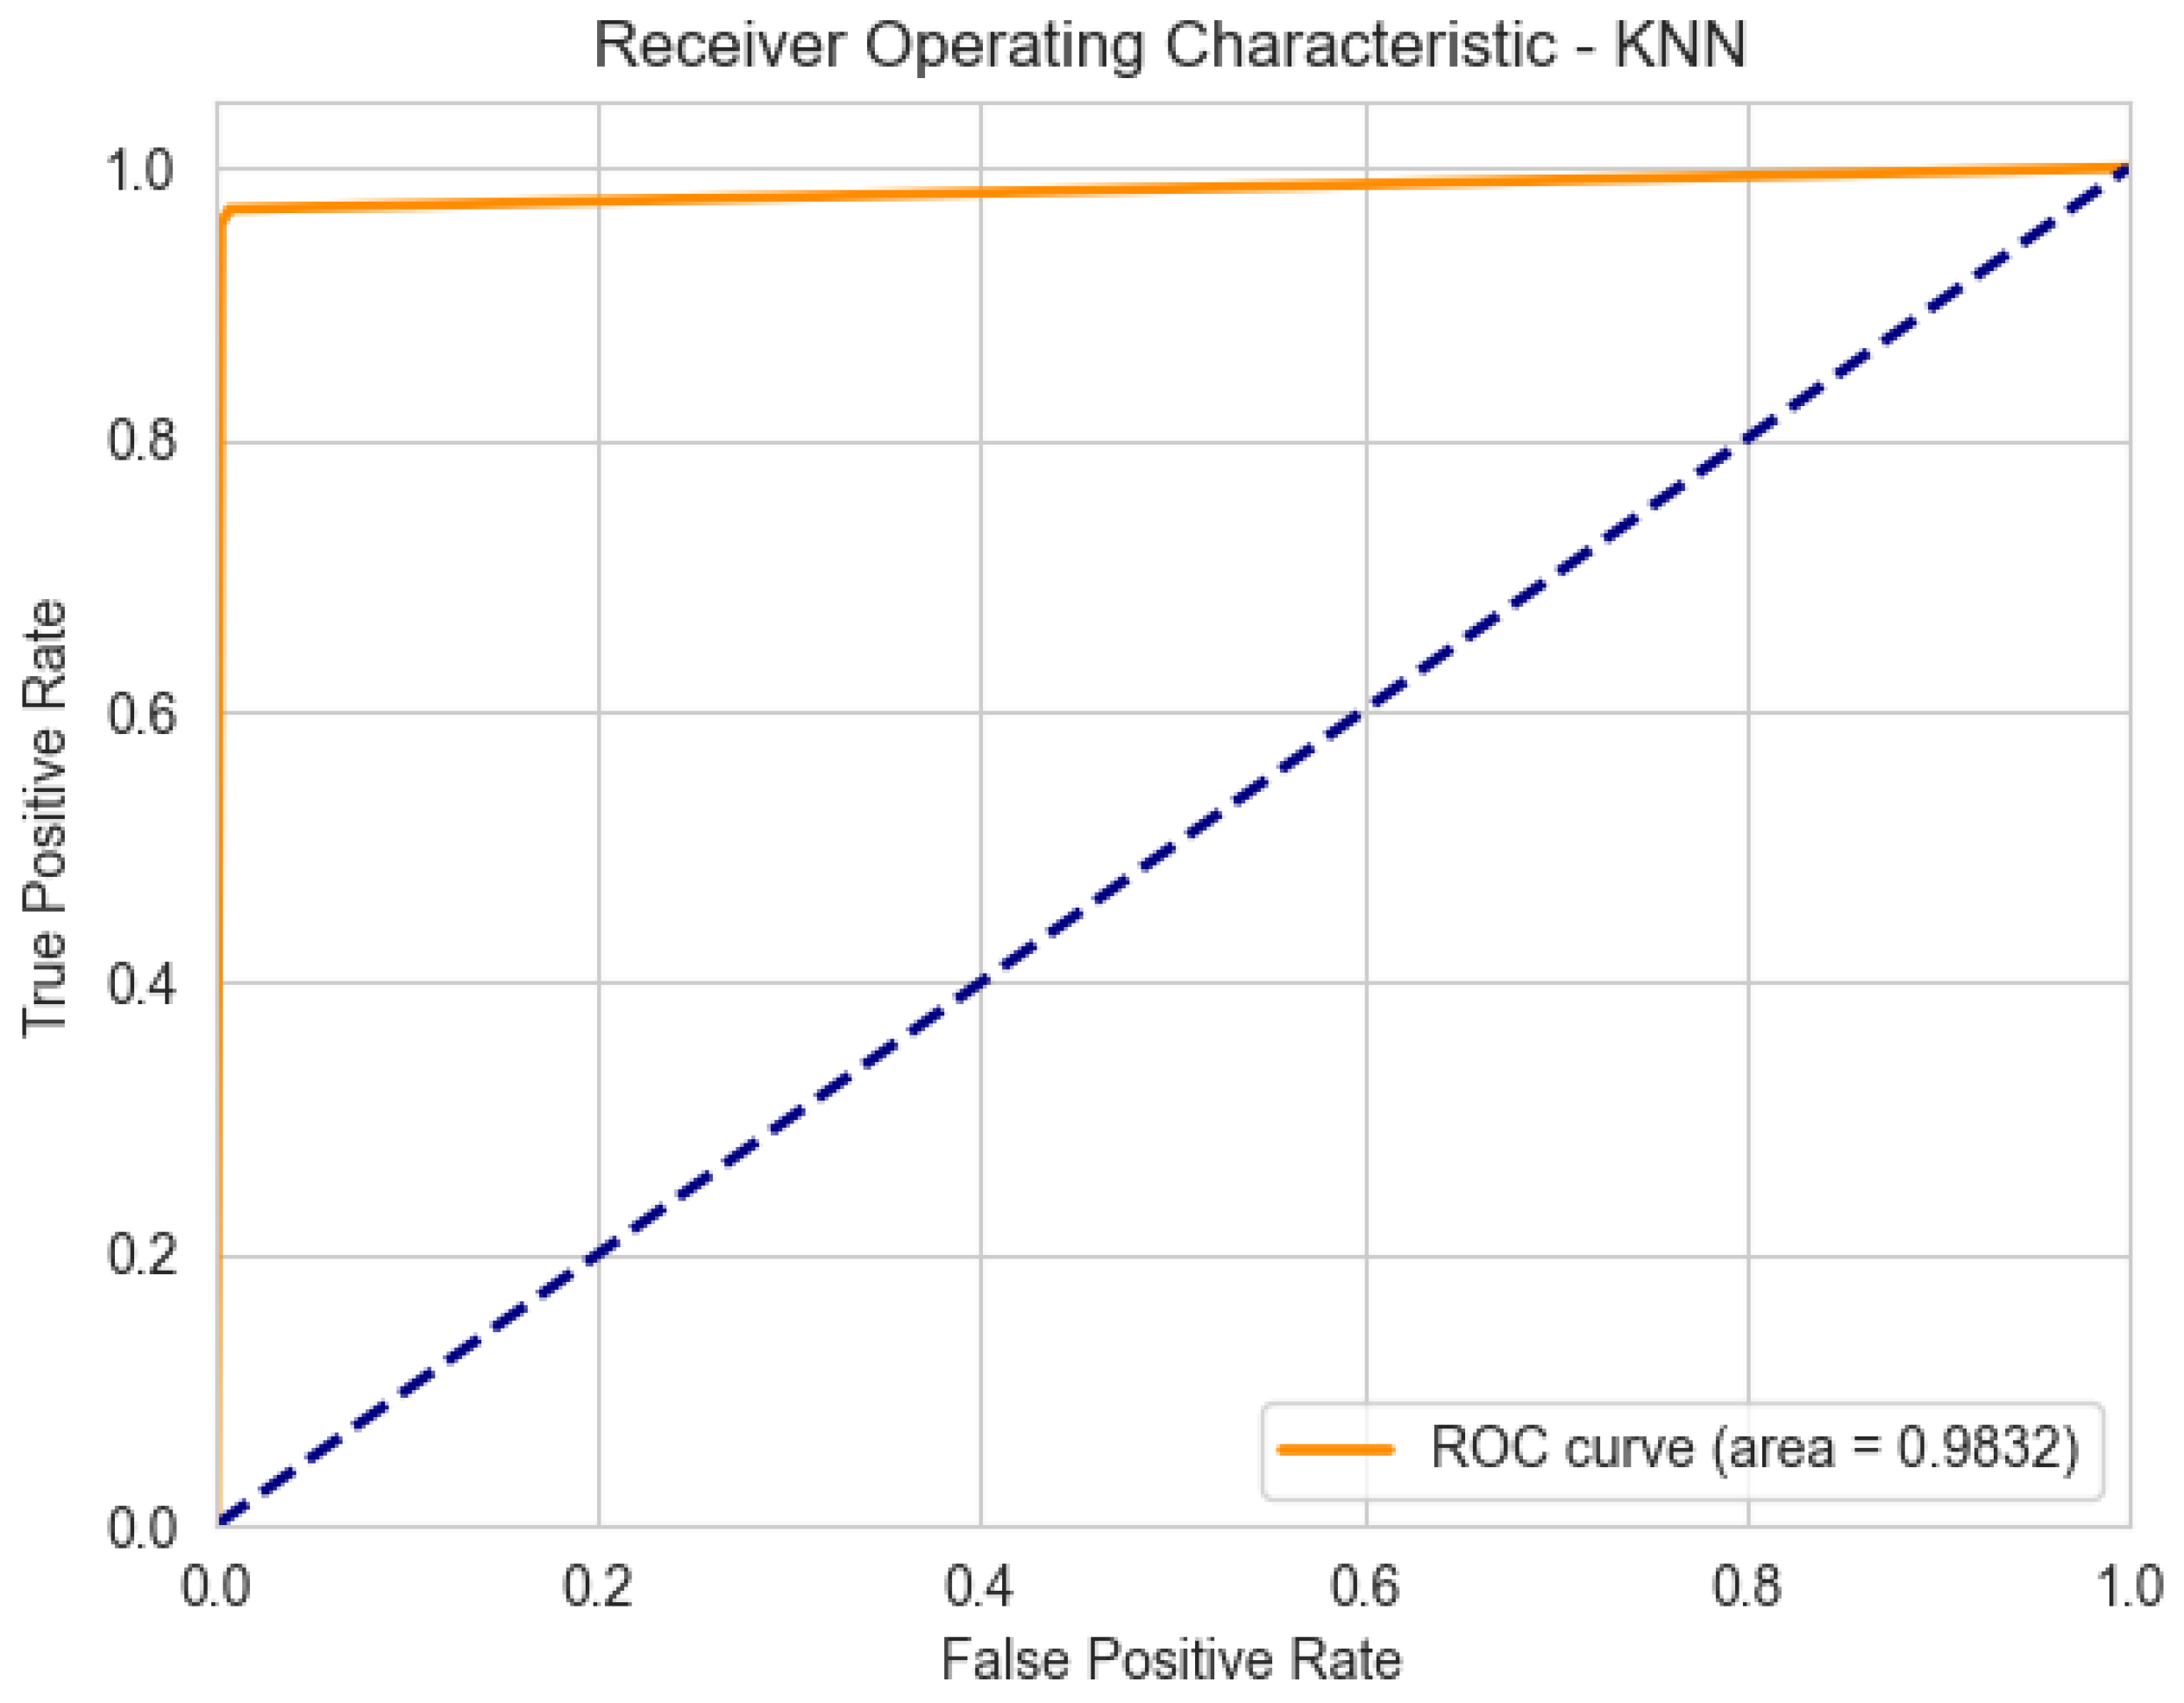
The initial performance of the classifiers, before the introduction of chaotic perturbations, is evaluated through Receiver Operating Characteristic (ROC) curves and Confusion Matrices. As shown in
Figure 6, the
Baseline ROC Curve for KNN exhibits near-perfect discriminative power, with an Area Under the Curve (AUC) approaching 1.0. This indicates that, under standard network conditions, the distance-based logic of KNN is highly effective at separating legitimate traffic from malicious clusters. Similarly,
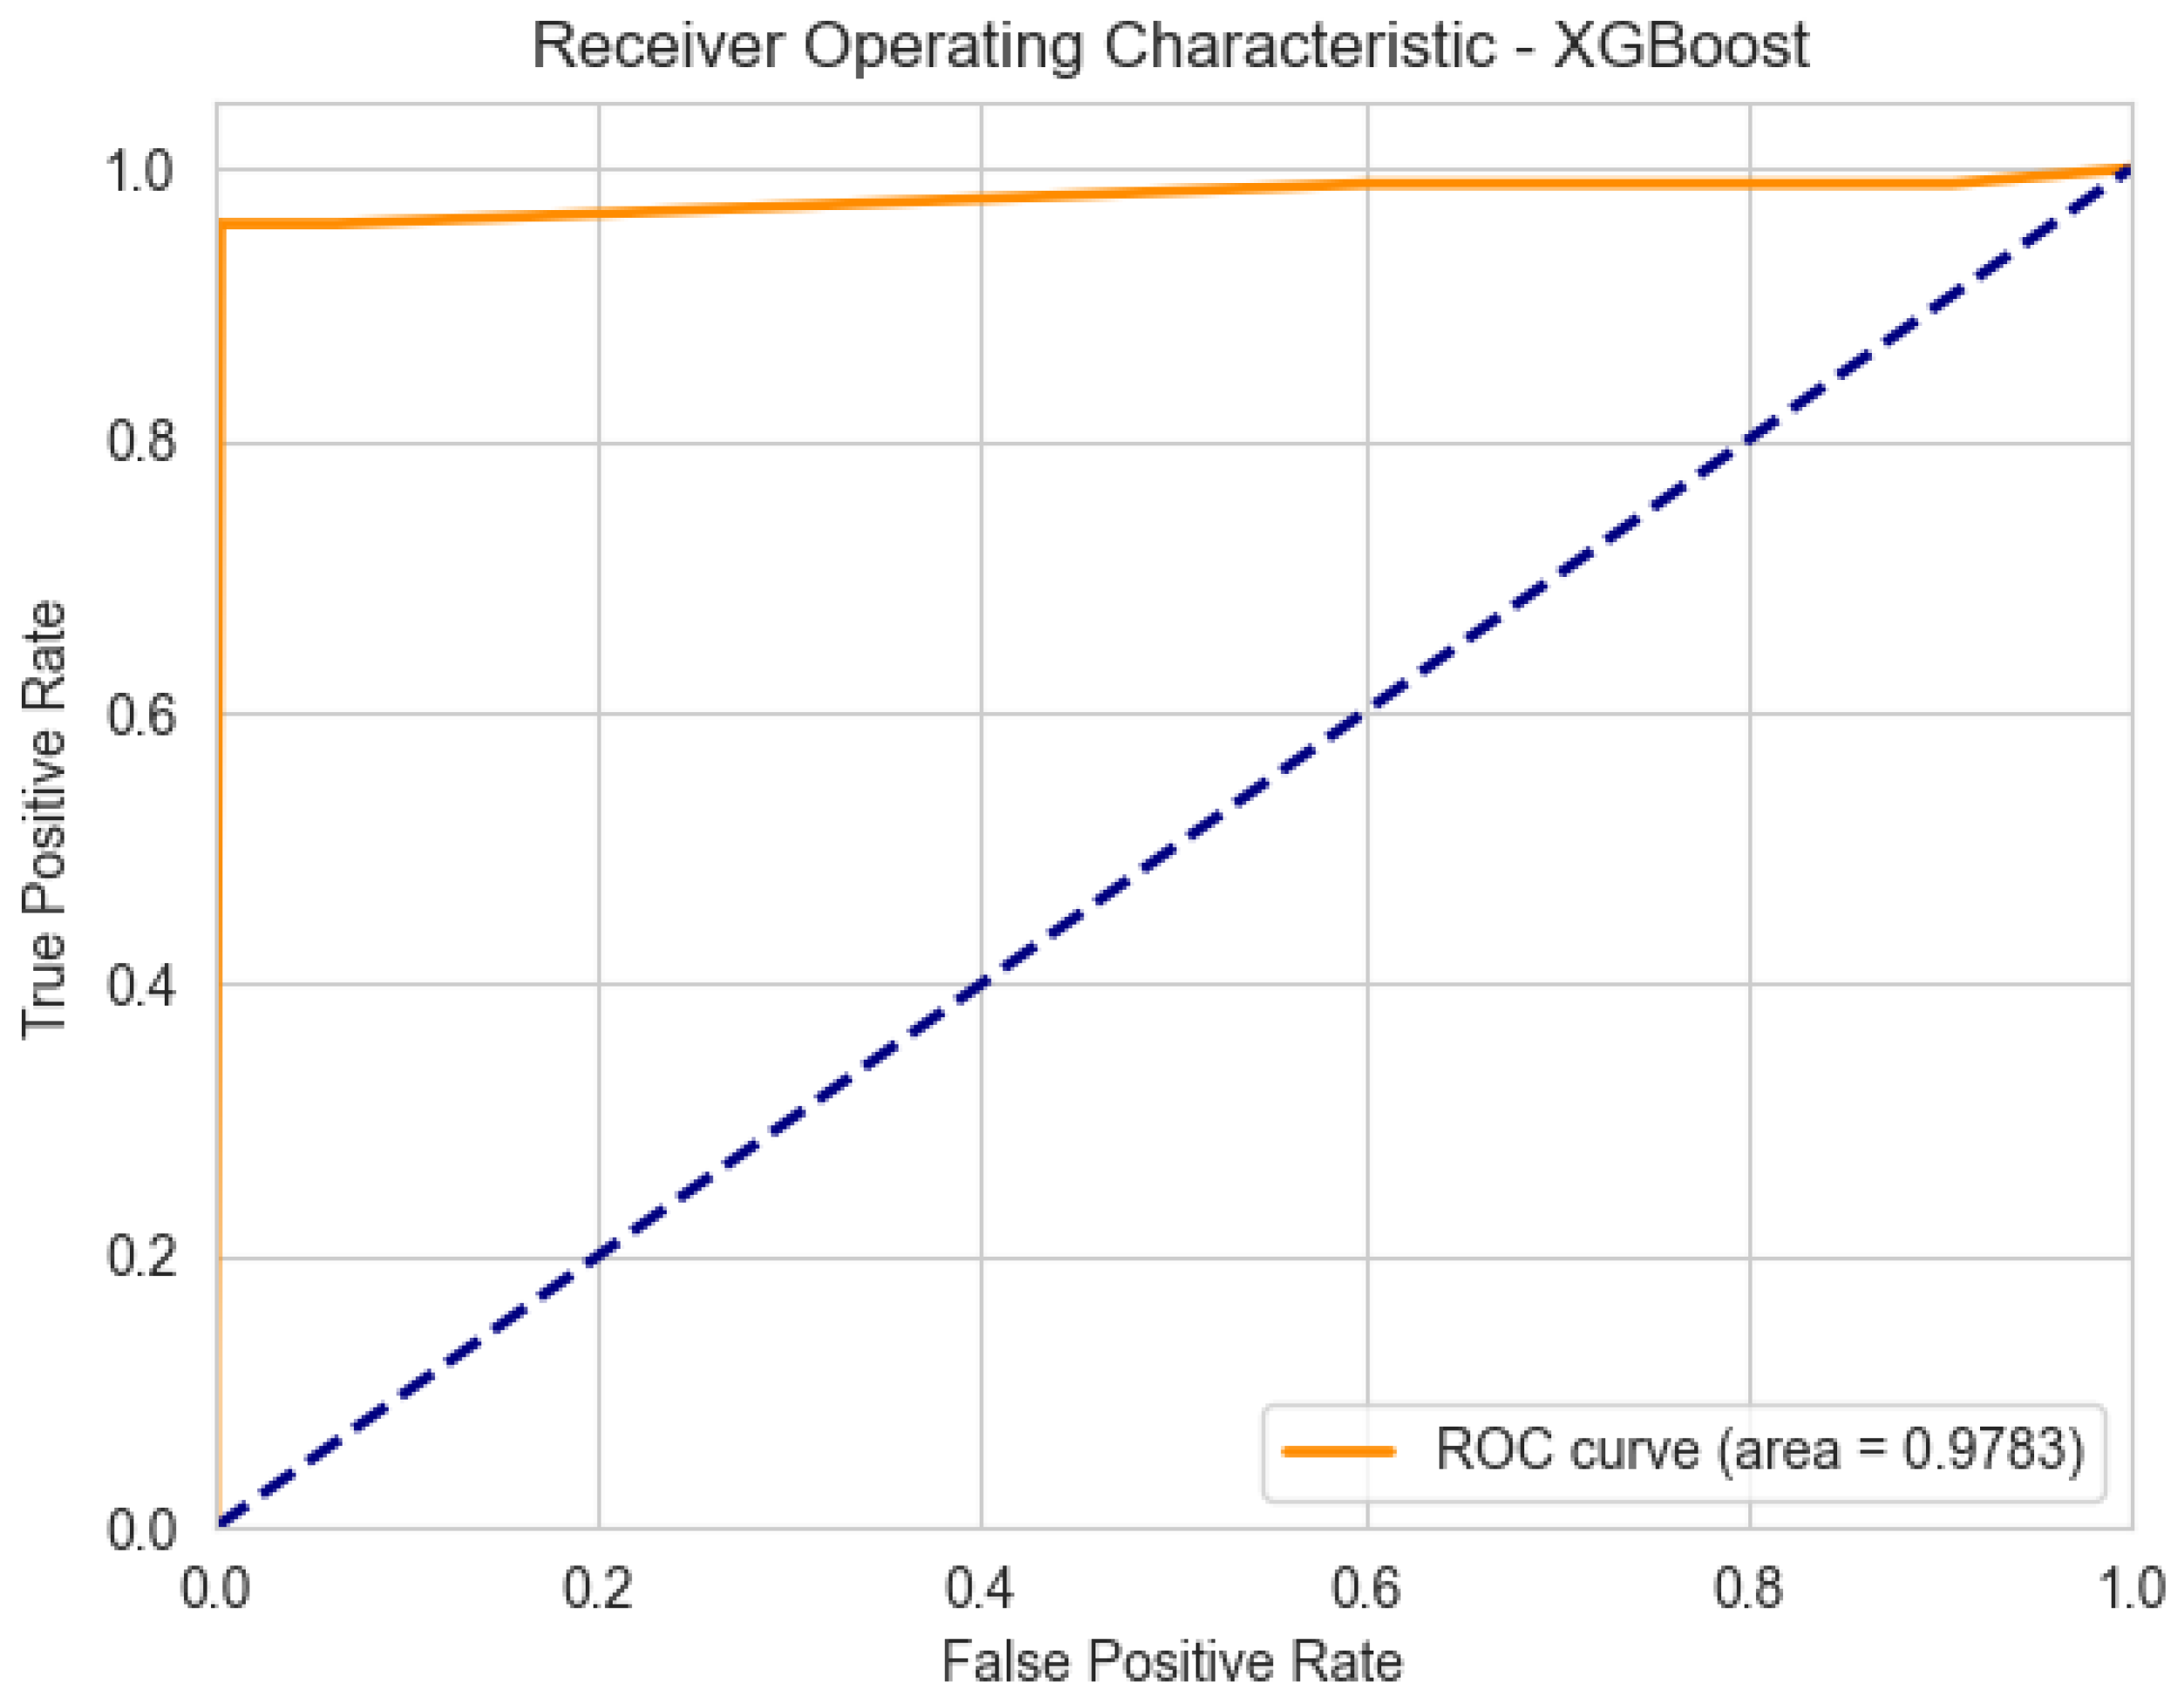
Figure 7 presents the
Baseline ROC Curve for XGBoost, demonstrating equivalent high performance. The steepness of the curve in
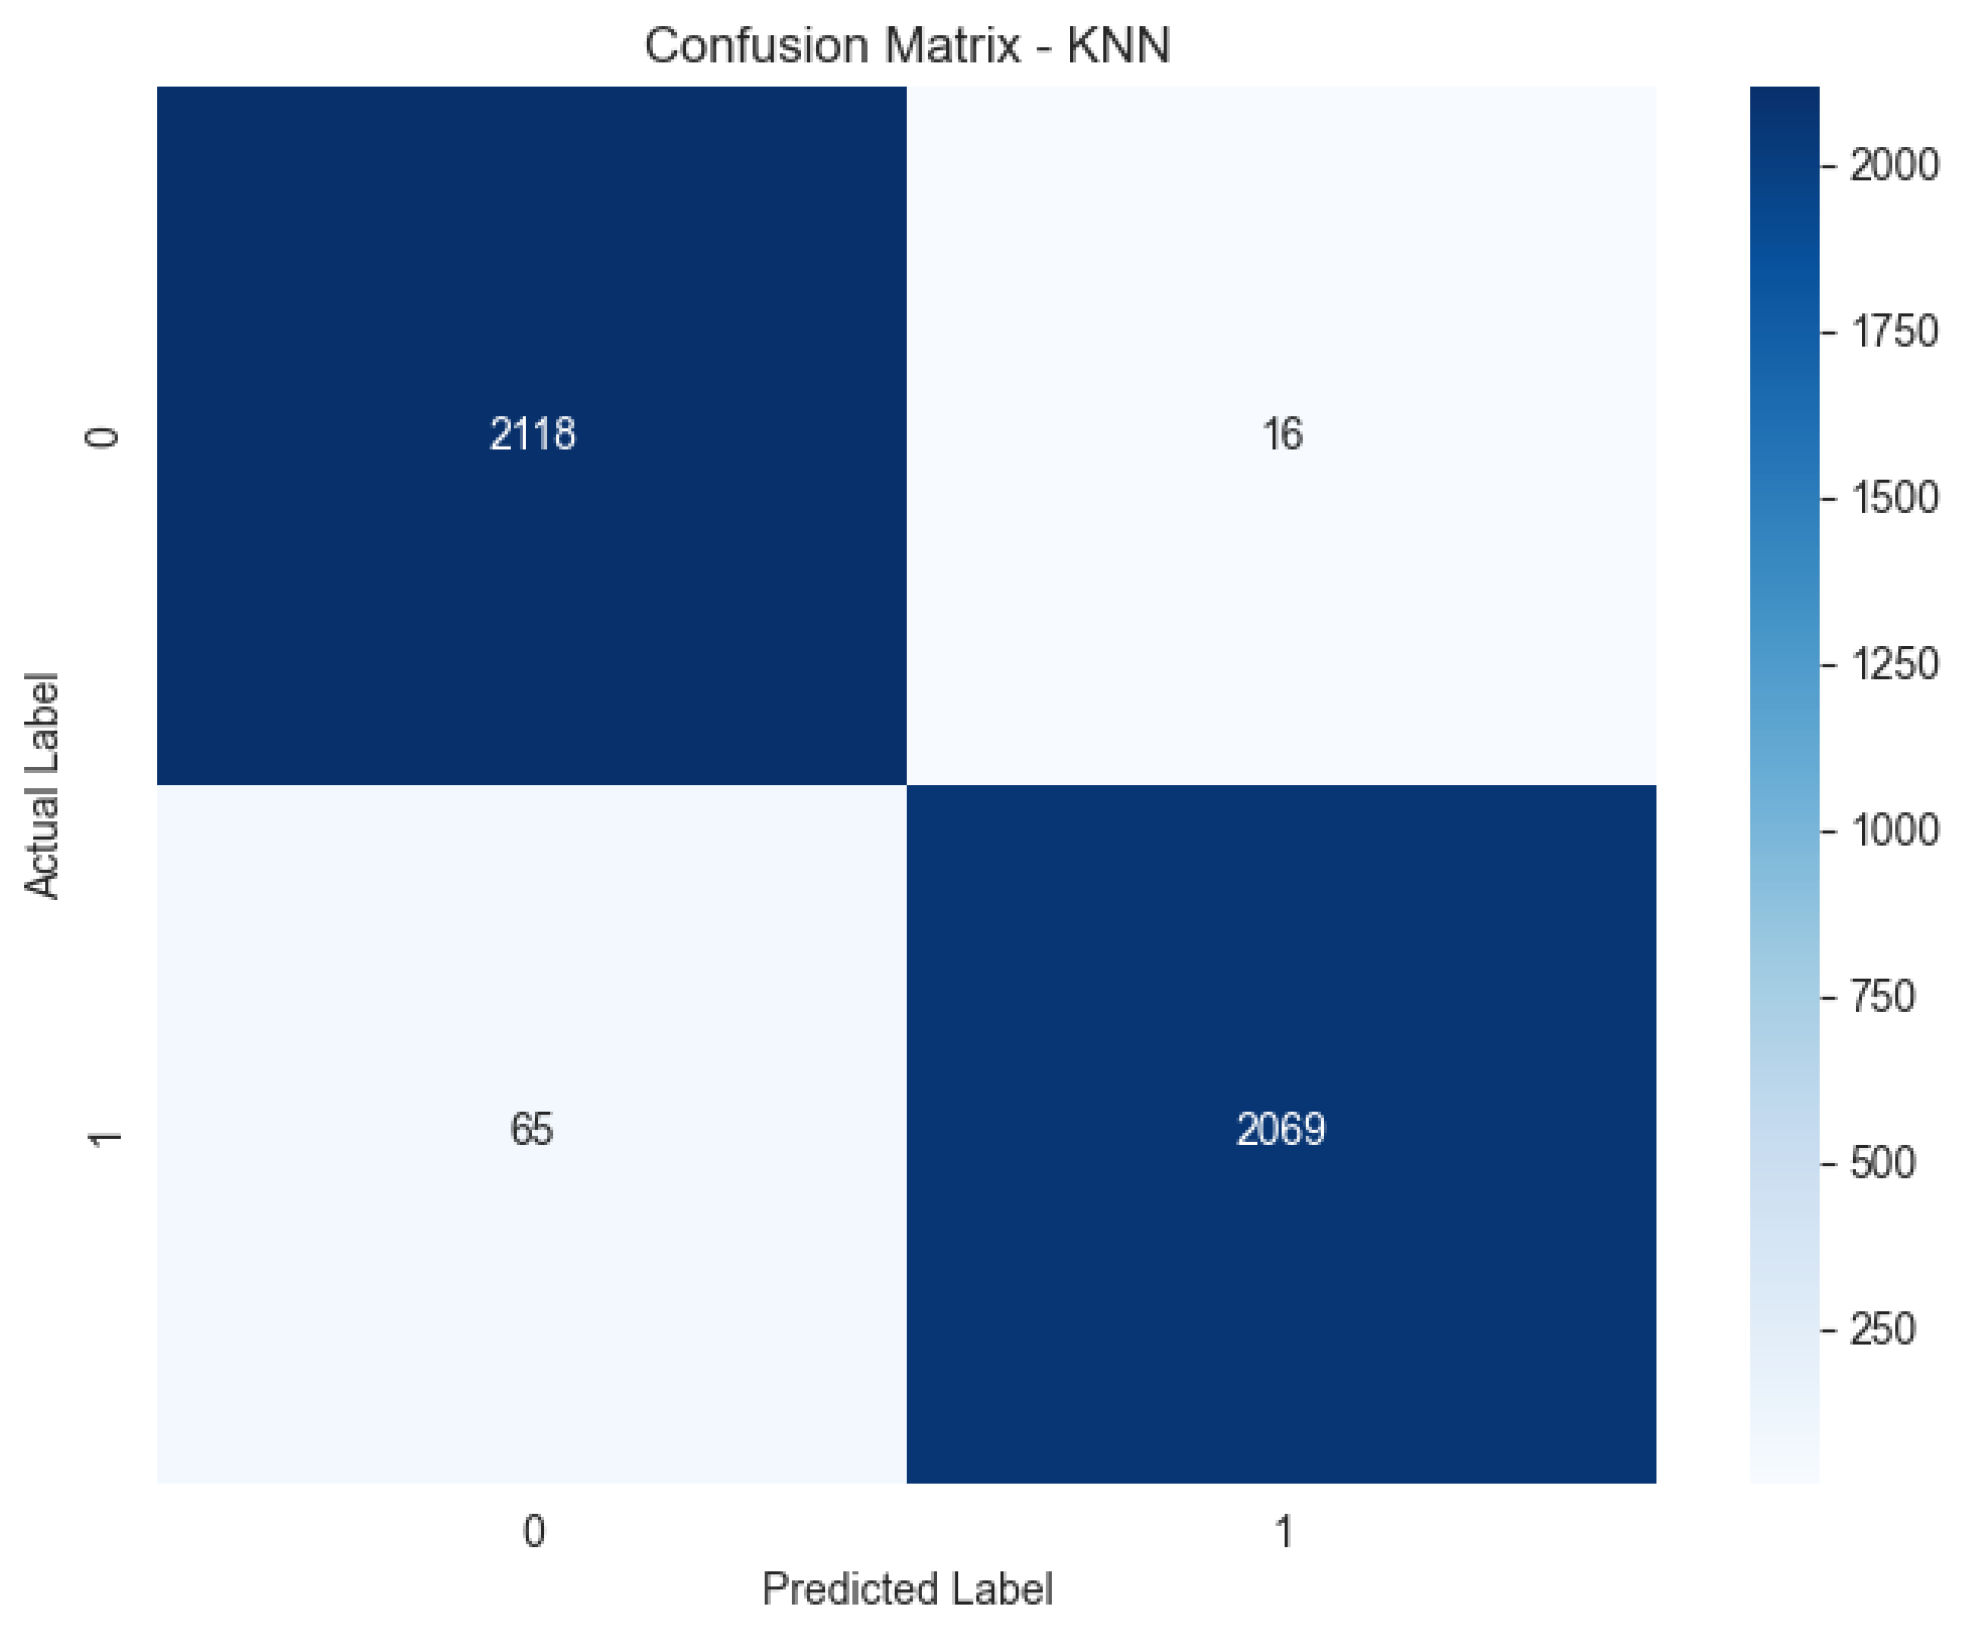
Figure 7 confirms that the gradient boosting architecture is exceptionally stable when dealing with structured, non-perturbed IoT data. To further detail these results, the classification accuracy is visualized through confusion matrices.
Figure 8 illustrates the
Baseline Confusion Matrix for KNN, where the high concentration of values along the main diagonal confirms a very low rate of false positives and false negatives. This baseline state serves as the reference point for the subsequent robustness tests. In parallel,
Figure 9 shows the
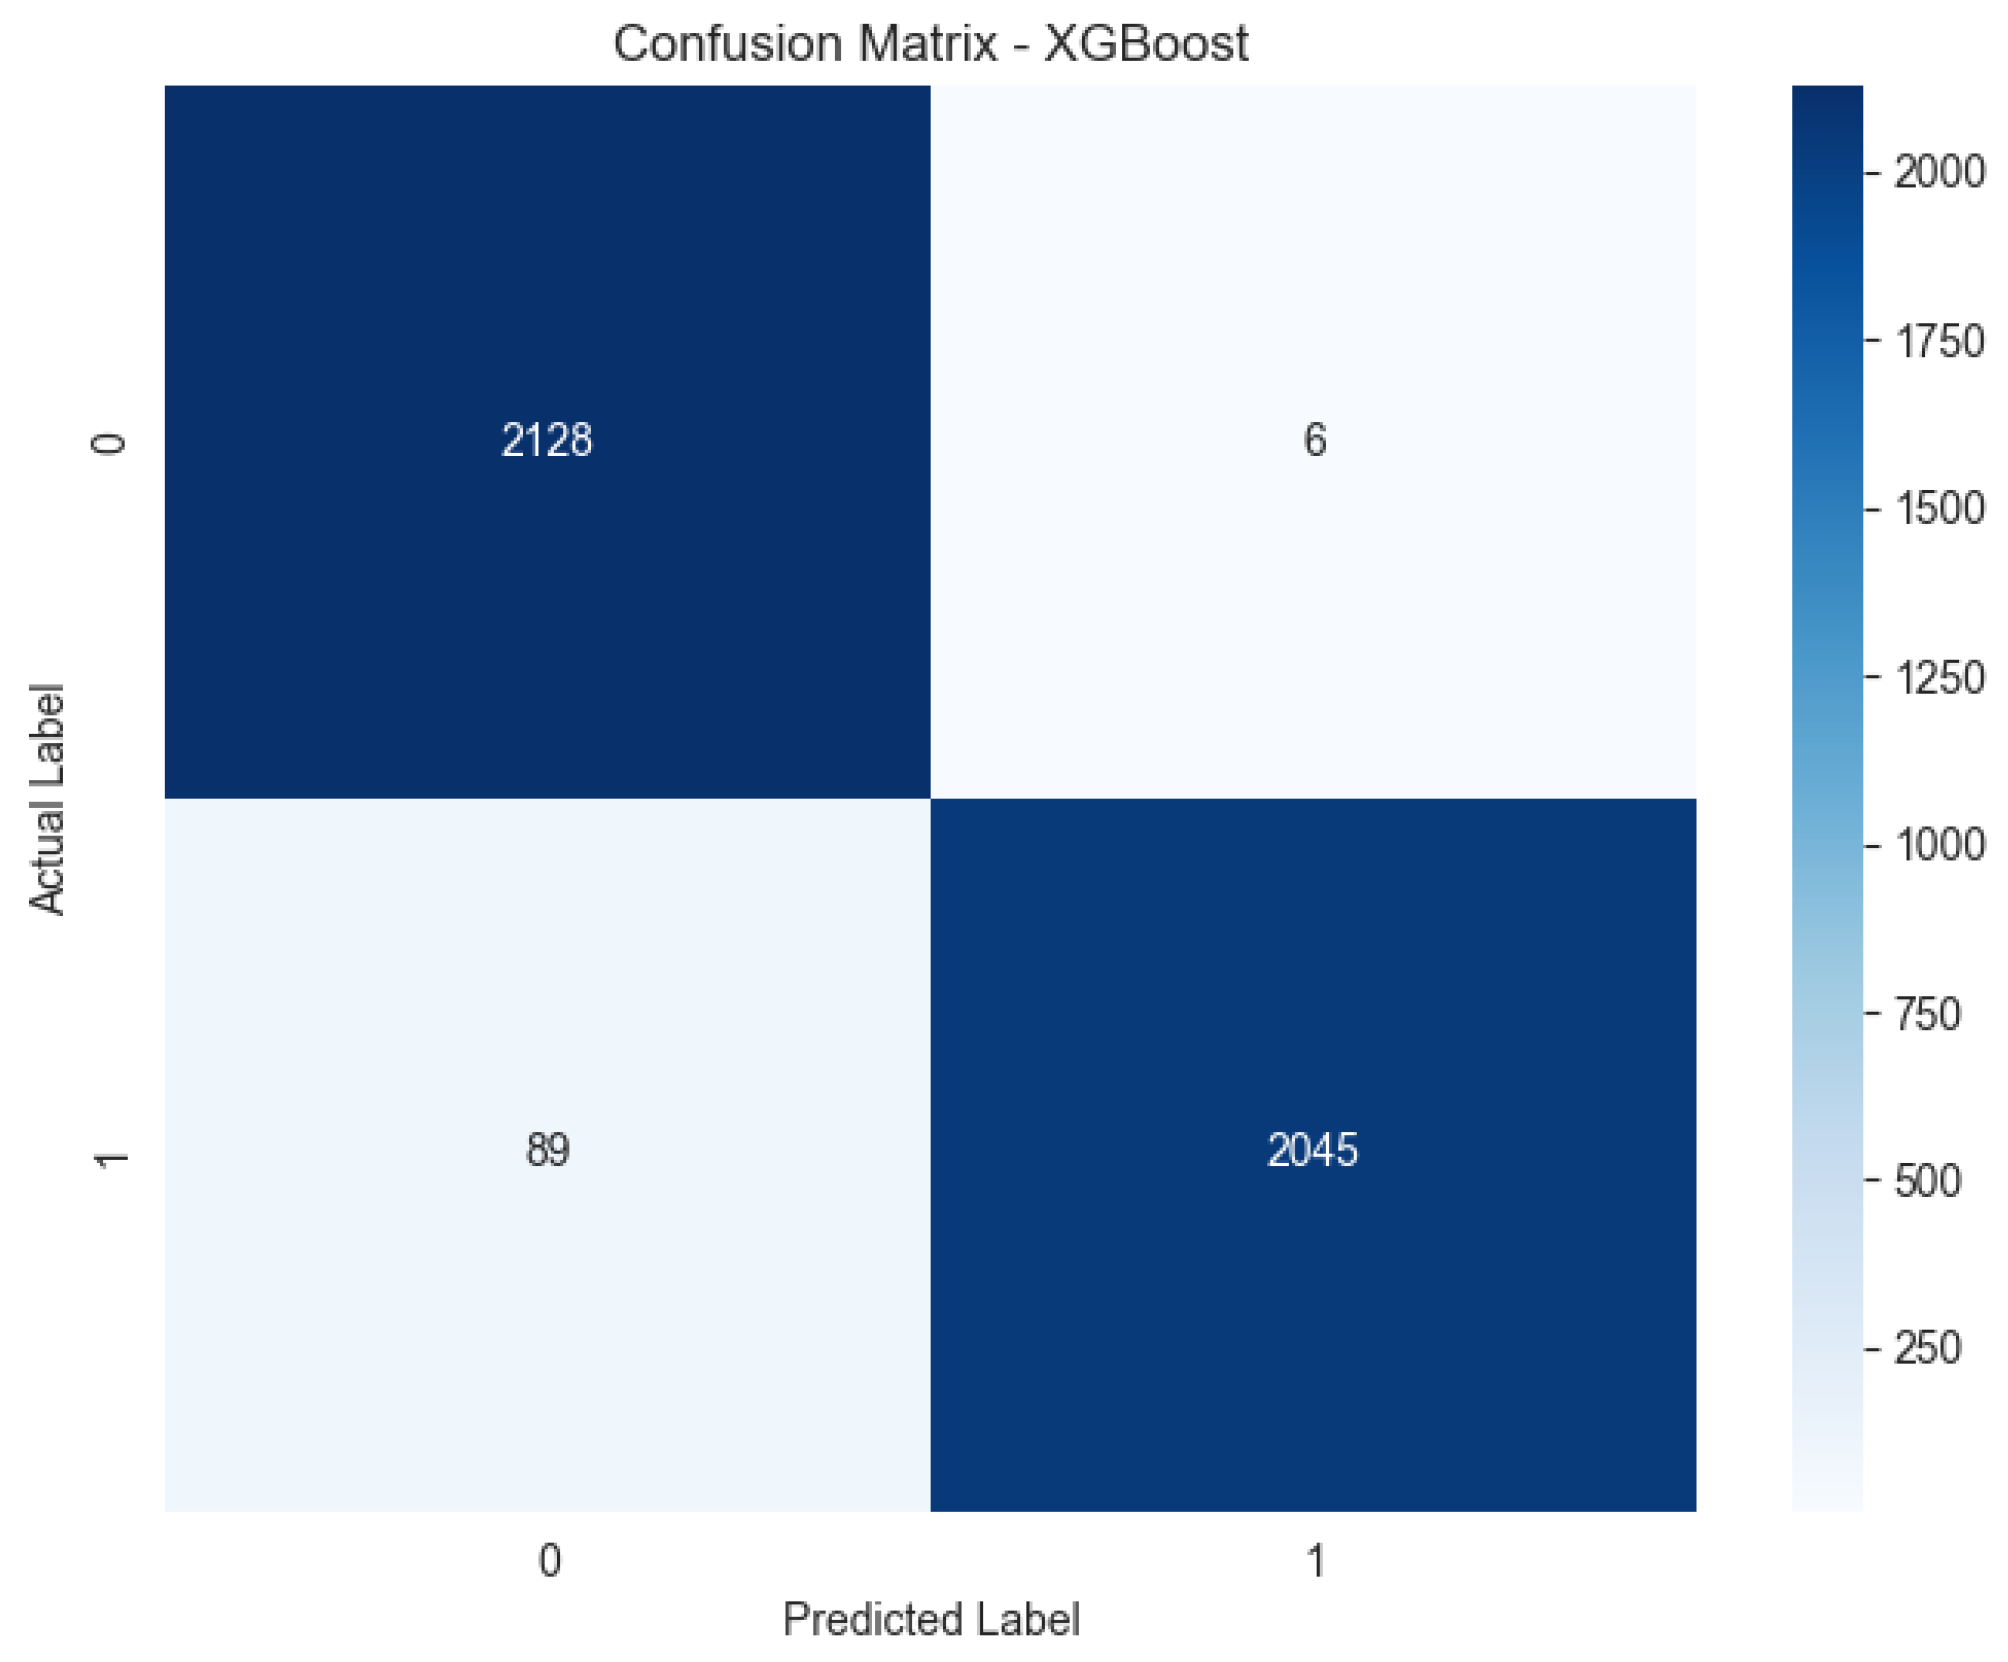
Baseline Confusion Matrix for XGBoost. By analyzing
Figure 9, it is evident that the model correctly identifies almost the entirety of the test set, with negligible misclassifications. These baseline figures (
Figure 6,
Figure 7,
Figure 8 and
Figure 9) establish that the subsequent performance drops observed in the stress tests are exclusively attributable to the chaotic injection and not to inherent model weaknesses.
10.2. Robustness Performance Across Chaotic Scenarios
The models were subsequently evaluated against four distinct chaotic injection scenarios, simulating different levels and types of perturbations. For each scenario, the performance metrics (F1-Score, AUC, Accuracy) were re-calculated, and the drop in performance relative to the baseline was quantified. To illustrate the impact of chaotic perturbations on feature separability,
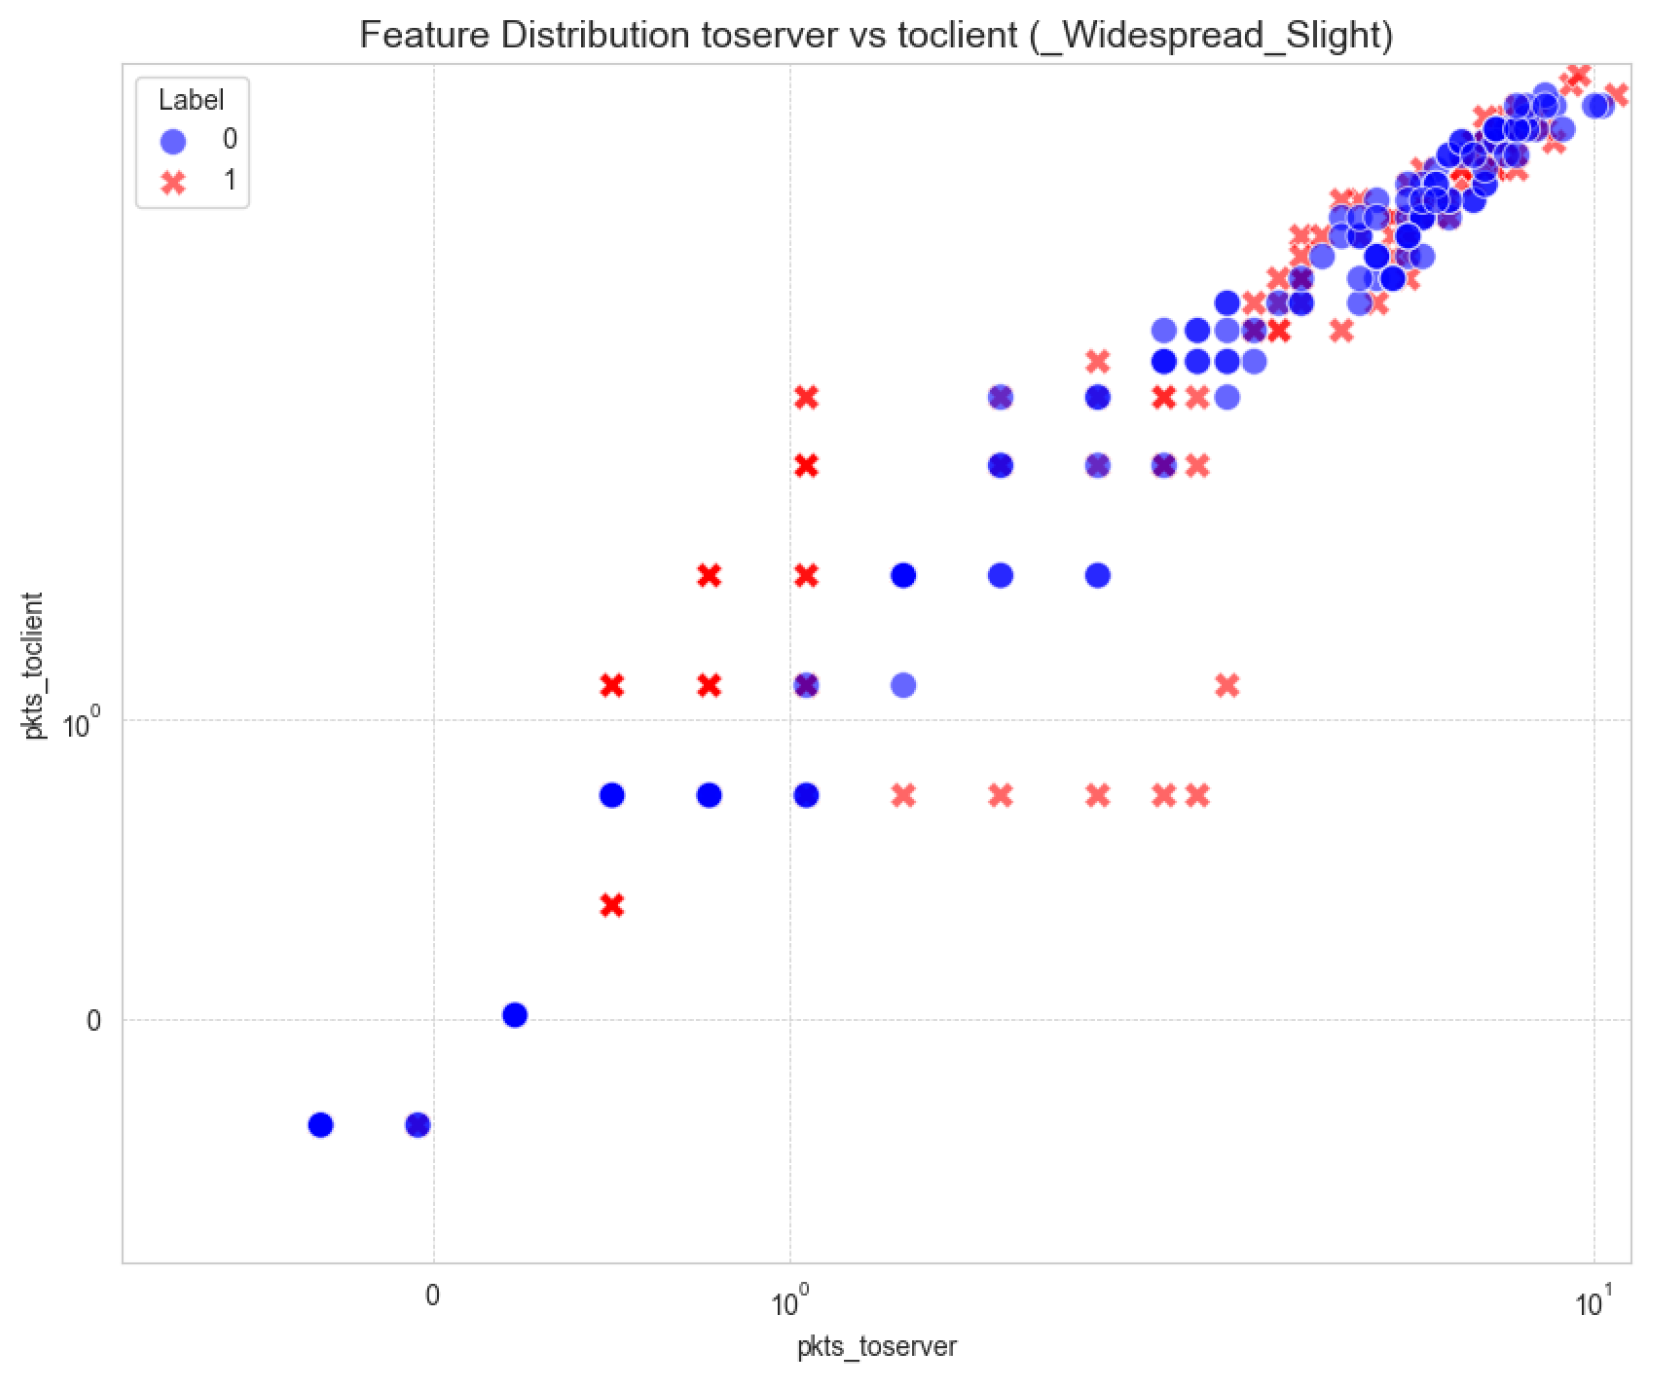
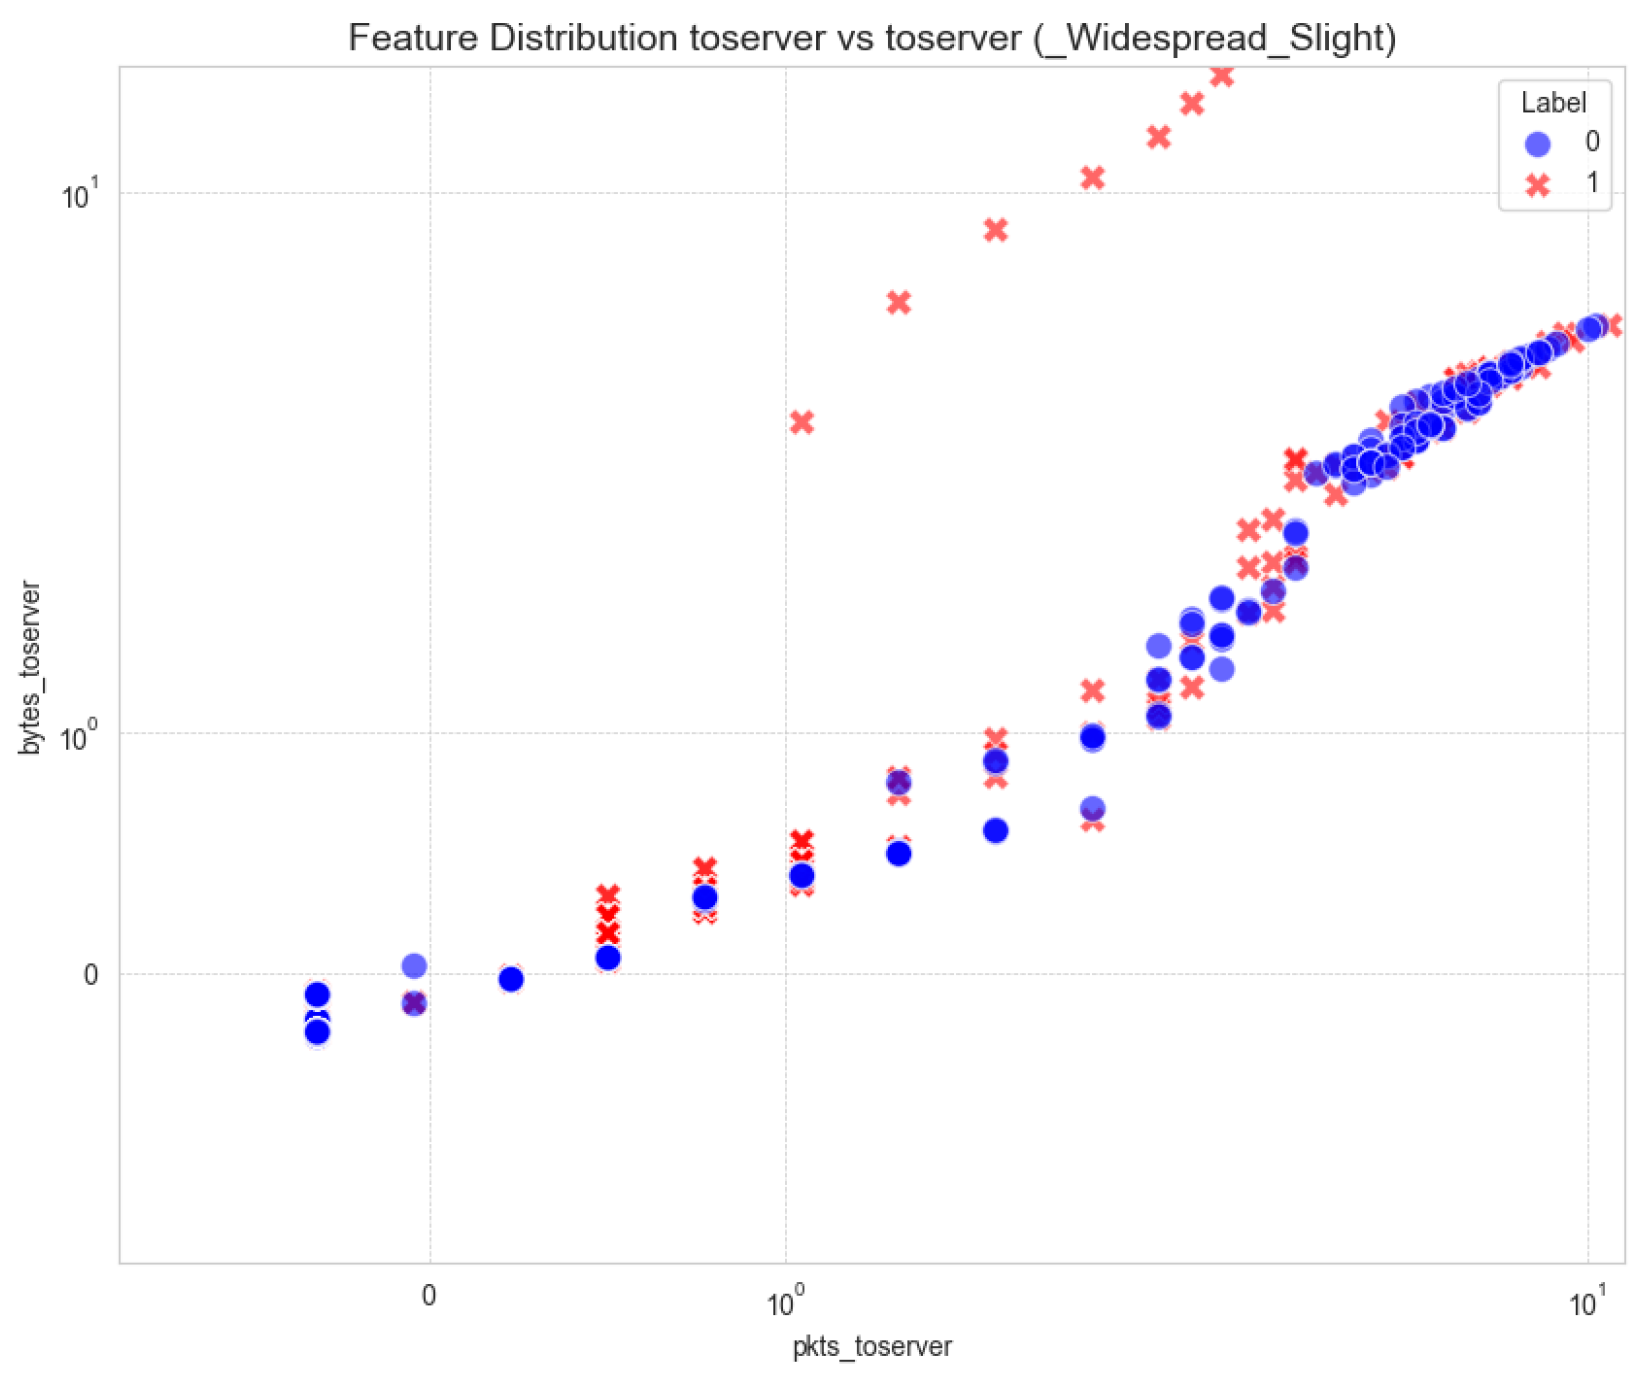
Figure 10 and
Figure 11 display scatter plots for key network features under the _Widespread_Slight chaotic scenario. To visually inspect the impact of non-linear perturbations on the data structure, we analyze the feature separability under the
Widespread_Slight chaos scenario.
Figure 10 presents the scatter plot of
Packets ToServer versus
Packets ToClient. In this visualization, it is possible to observe how the controlled chaotic injection
introduces a logarithmic dispersion that overlaps the legitimate and attacked classes. As demonstrated in
Figure 10, the traditionally clear boundaries between network states become blurred, simulating the high-entropy conditions of a real-world congested IoT gateway. Similarly,
Figure 11 illustrates the relationship between
Packets ToServer and
Bytes ToServer under the same chaotic conditions. This specific feature pair is fundamental for identifying volumetric attacks; however,
Figure 11 reveals that even a ‘slight’ perturbation can create hybrid clusters where malicious packets mimic the statistical signature of perturbed legitimate traffic. The use of log-scale axes in
Figure 11 further emphasizes the micro-fluctuations in packet size and frequency, providing empirical evidence for the necessity of a robustness-focused classification approach like the one proposed in this study.
These visualizations highlight how chaos can obscure the inherent class distinctions, posing significant challenges for classification models, as shown in
Table 4,
Table 5 and
Table 6.
10.2.1. Scenario: _Slight_Stealthy
This scenario represents a low-rate, low-impact chaotic perturbation.
Table 4.
Comparative Performance under the _Slight_Stealthy Scenario.
Table 4.
Comparative Performance under the _Slight_Stealthy Scenario.
| Alg. | F1_B | AUC_B | Acc_B | F1_R | AUC_R | Acc_R | F1_D | AUC_D |
|---|
| KNN | 0.9808 | 0.9832 | 0.9810 | 0.2435 | 0.5693 | 0.5337 | 0.7373 | 0.4139 |
| XGBoost | 0.9773 | 0.9783 | 0.9777 | 0.9611 | 0.9654 | 0.9593 | 0.0162 | 0.0128 |
Under the _Slight_Stealthy scenario, KNN’s performance significantly degrades across all metrics, with an F1-Drop of over 73%. XGBoost, however, maintains strong performance, exhibiting minimal degradation.
10.2.2. Scenario: _Standard_Medium
This scenario involves a moderate level of chaotic perturbation.
Table 5.
Comparative Performance under the _Standard_Medium Scenario.
Table 5.
Comparative Performance under the _Standard_Medium Scenario.
| Alg. | F1_B | AUC_B | Acc_B | F1_R | AUC_R | Acc_R | F1_D | AUC_D |
|---|
| KNN | 0.9808 | 0.9832 | 0.9810 | 0.2066 | 0.5576 | 0.4170 | 0.7742 | 0.4256 |
| XGBoost | 0.9773 | 0.9783 | 0.9777 | 0.8812 | 0.8891 | 0.8598 | 0.0961 | 0.0892 |
The _Standard_Medium chaos further impacts KNN, resulting in an even larger F1-Drop. XGBoost shows a more noticeable, but still contained, performance decrease compared to the _Slight_Stealthy scenario yet remains highly effective.
10.2.3. Scenario: _Targeted_Extreme
This scenario represents a high-impact, targeted chaotic perturbation.
Table 6.
Comparative Performance under the _Targeted_Extreme Scenario.
Table 6.
Comparative Performance under the _Targeted_Extreme Scenario.
| Alg. | F1_B | AUC_B | Acc_B | F1_R | AUC_R | Acc_R | F1_D | AUC_D |
|---|
| KNN | 0.9808 | 0.9832 | 0.9810 | 0.2434 | 0.5689 | 0.5336 | 0.7374 | 0.4143 |
| XGBoost | 0.9773 | 0.9783 | 0.9777 | 0.9648 | 0.9667 | 0.9630 | 0.0125 | 0.0115 |
Similar to the _Slight_Stealthy scenario, KNN’s performance is severely compromised, with its F1-Score becoming unreliable. XGBoost continues to exhibit remarkable stability, with only minor F1-Drop and AUC-Drop values.
10.2.4. Scenario: _Widespread_Slight
This scenario simulates a broad but low-intensity chaotic perturbation, as shown in
Table 7.
The _Widespread_Slight scenario presents the most significant challenge to KNN, resulting in its largest F1-Drop and AUC-Drop. XGBoost also experiences its most substantial drop in this scenario, though its robust performance remains considerably higher than KNN’s. The quantitative degradation of classification performance under chaotic stress is further analyzed through confusion matrices and comparative ROC analysis.
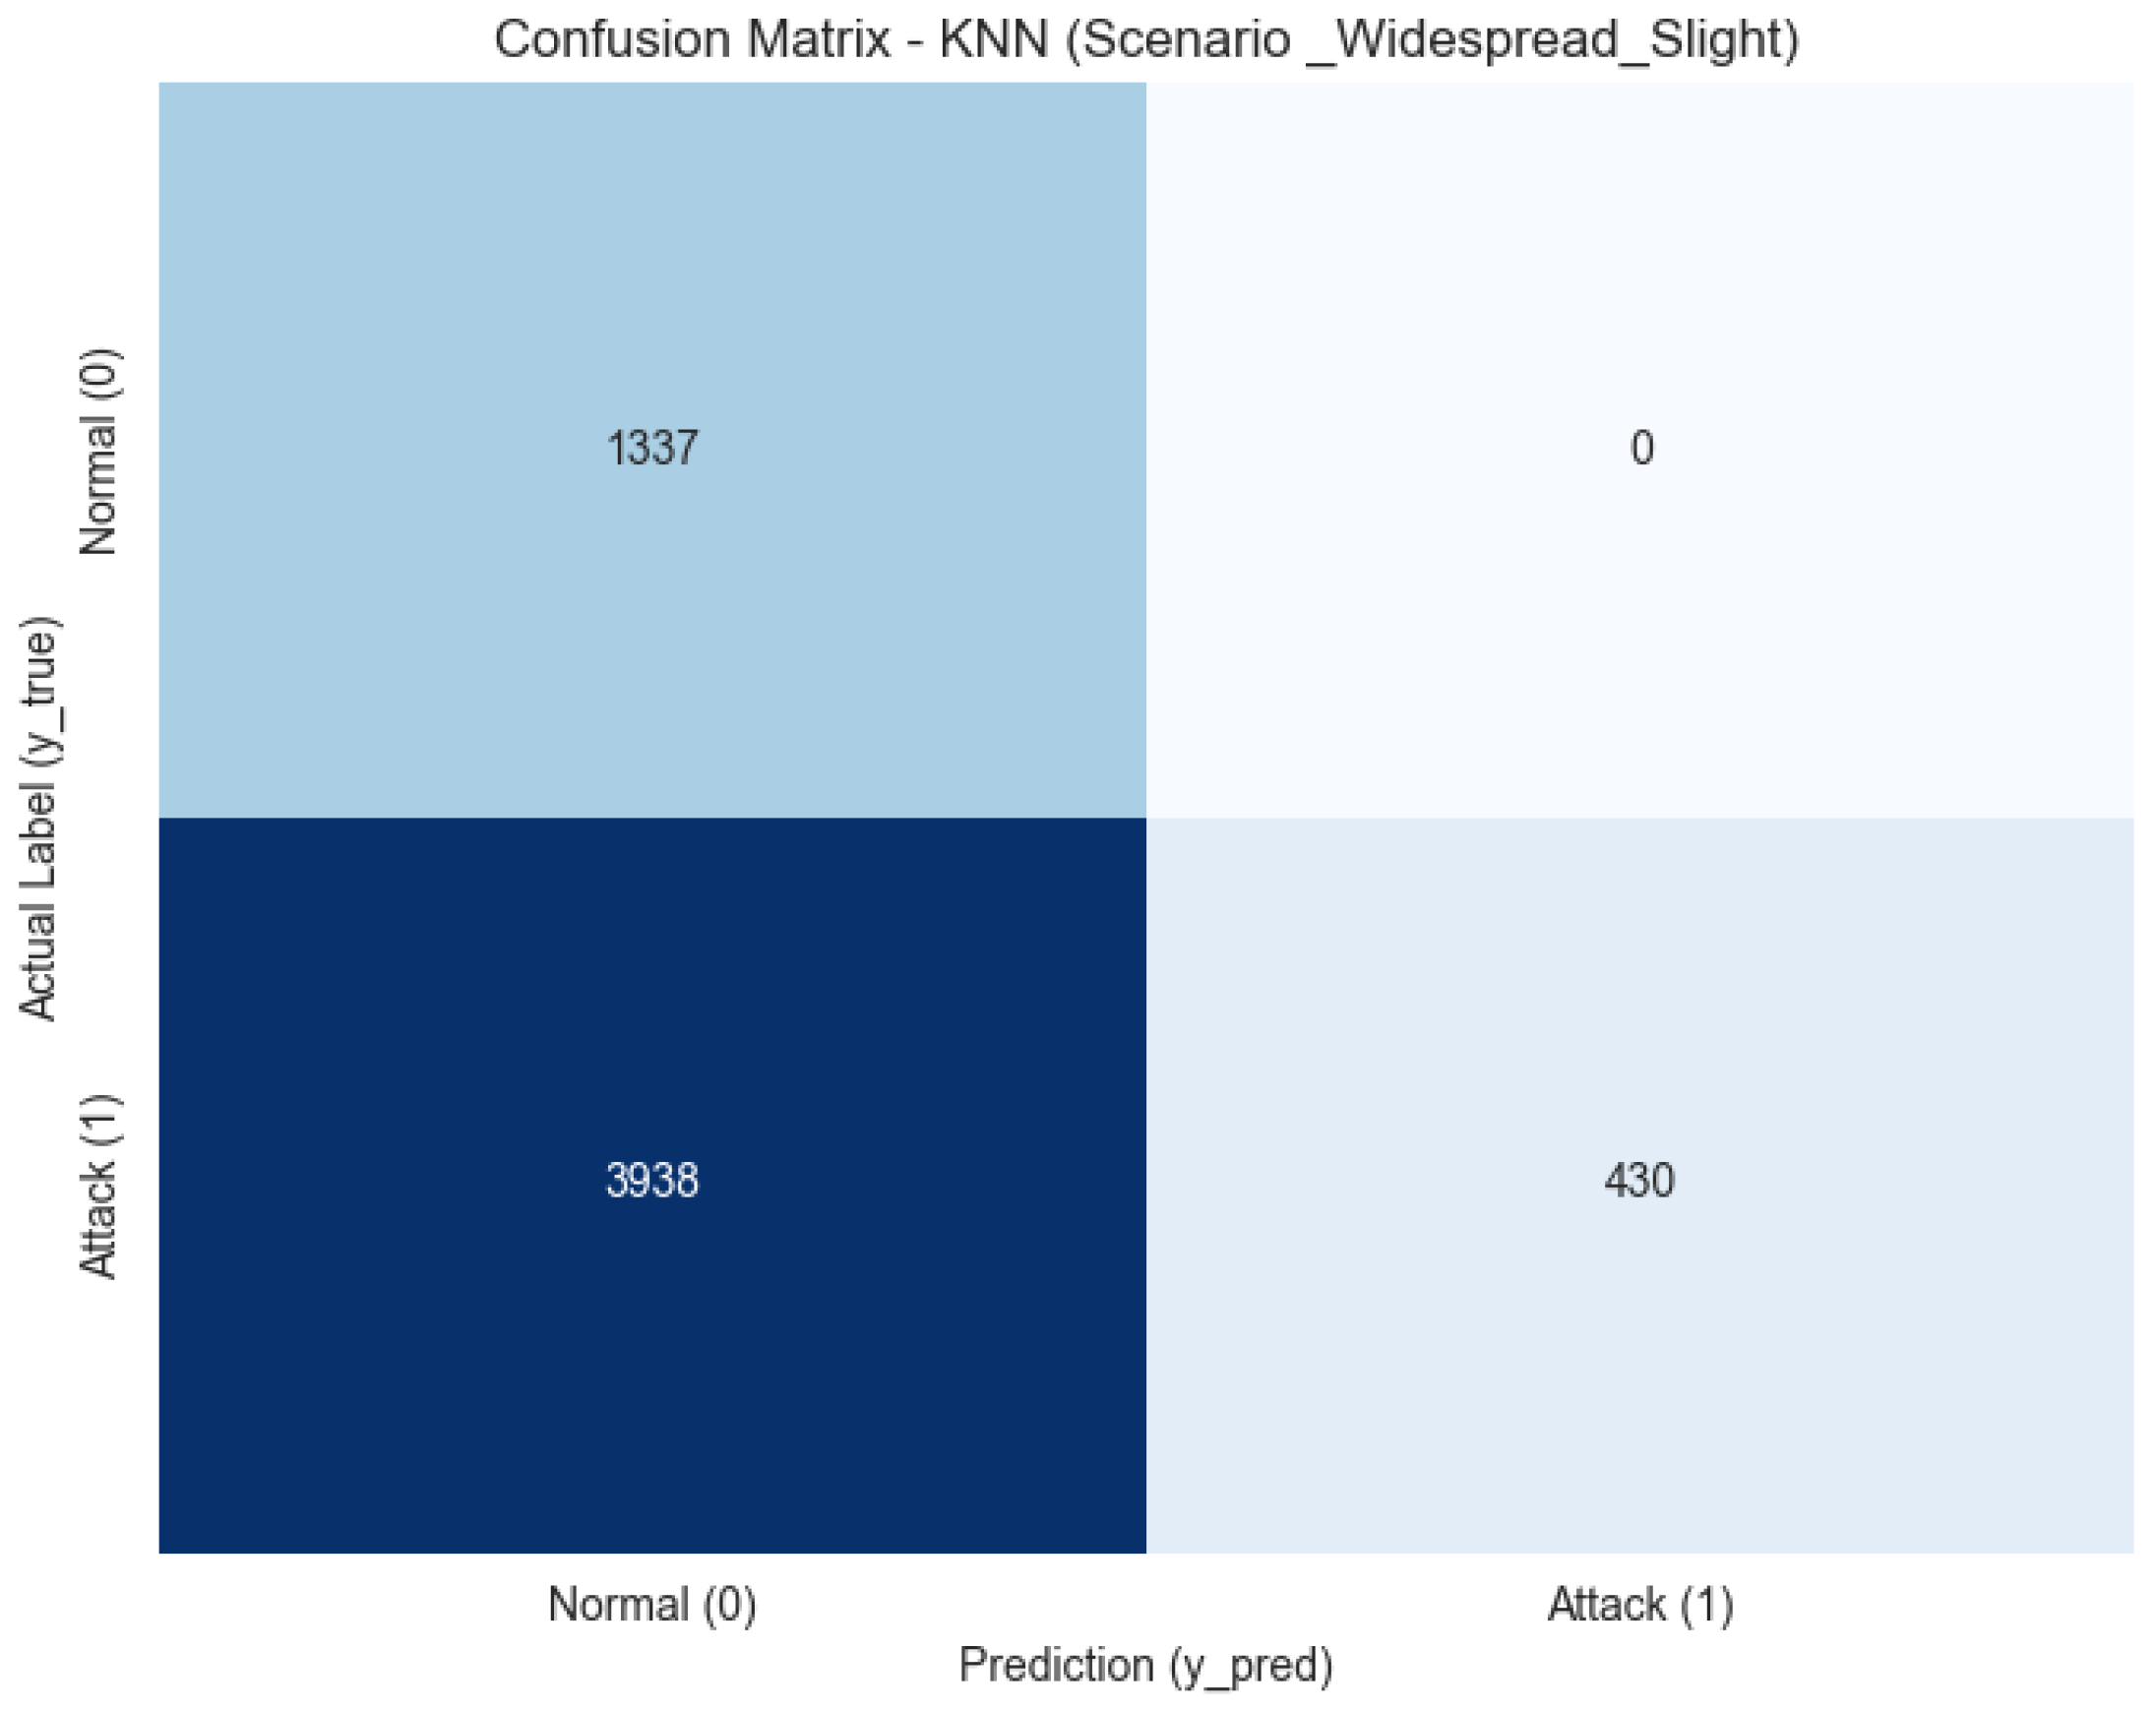
Figure 12 illustrates the
Confusion Matrix for KNN under Widespread_Slight Chaos. Comparing this to the baseline, a visible increase in misclassifications is evident. As shown in
Figure 12, the chaotic jitter causes several legitimate packets to be flagged as attacks (False Positives) and vice versa, confirming that distance-based algorithms struggle when perturbations
shift data points across the decision boundaries. In contrast,
Figure 13 presents the
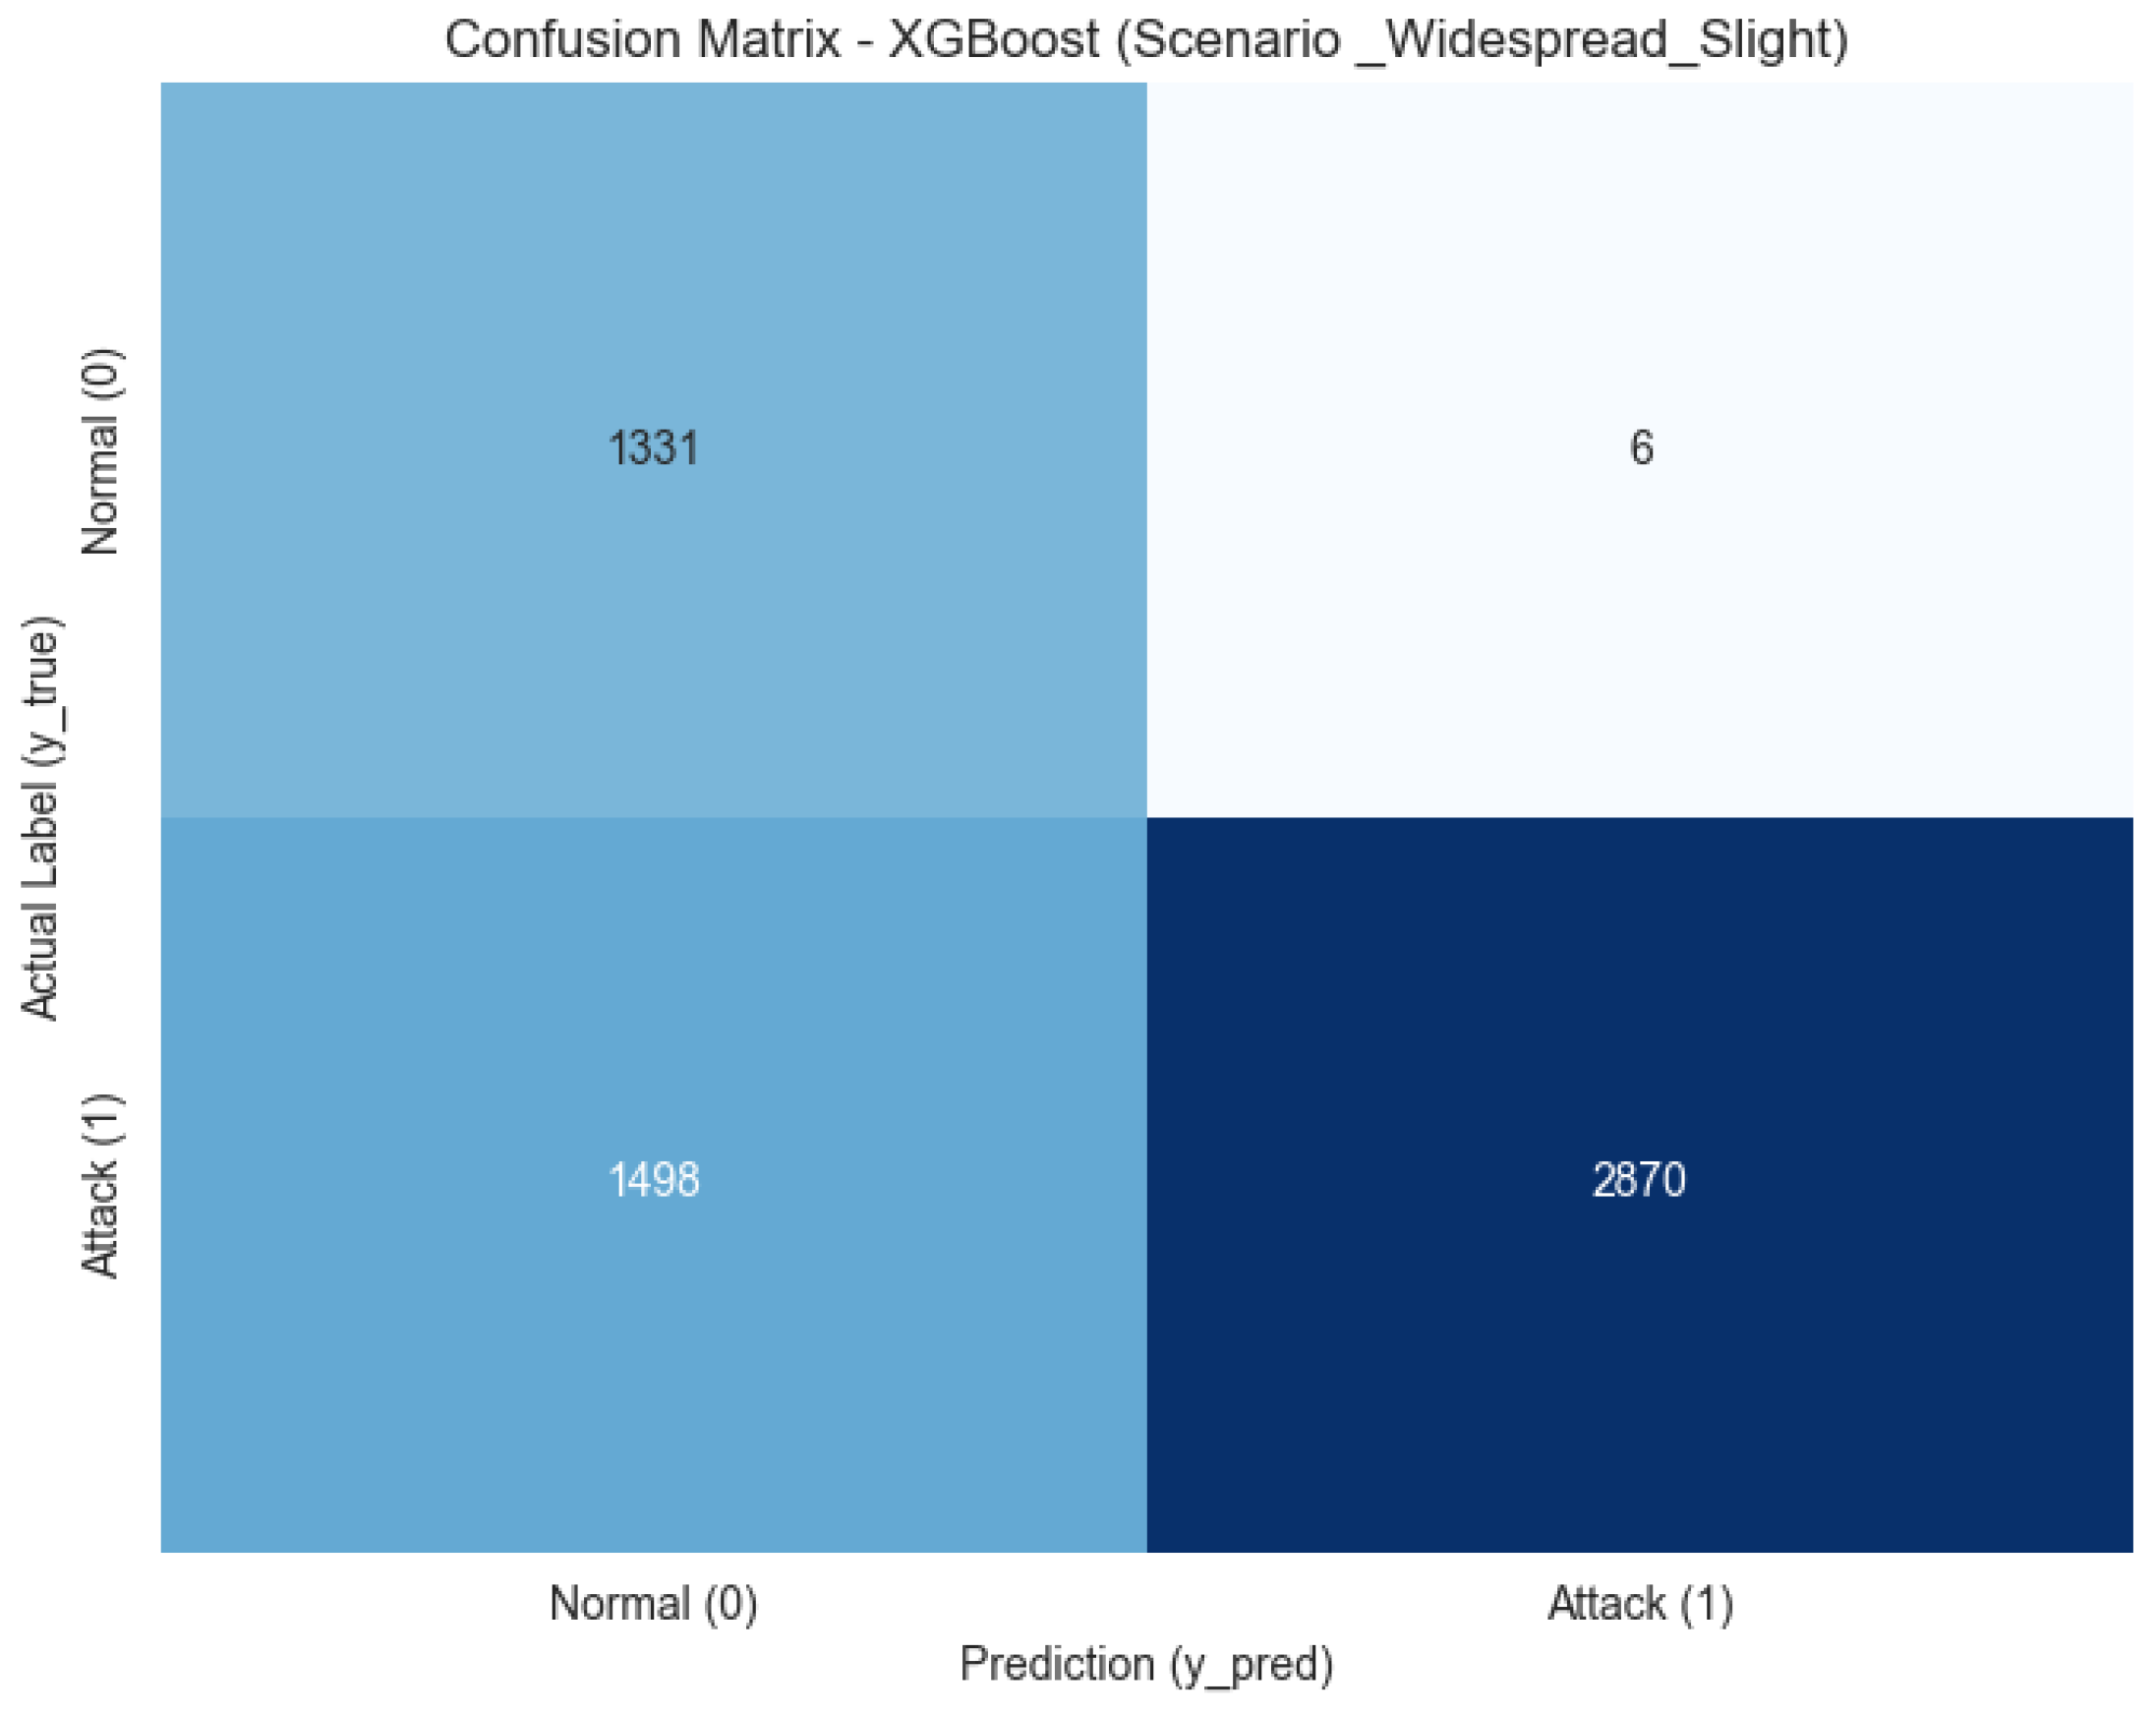
Confusion Matrix for XGBoost under the same conditions. By examining
Figure 13, it is clear that the ensemble-tree structure maintains a much higher concentration of correct predictions on the main diagonal. This visual evidence suggests that XGBoost’s recursive partitioning is inherently more robust to the stochastic noise introduced by our Chaos Theory framework. The overall discriminative resilience is summarized in
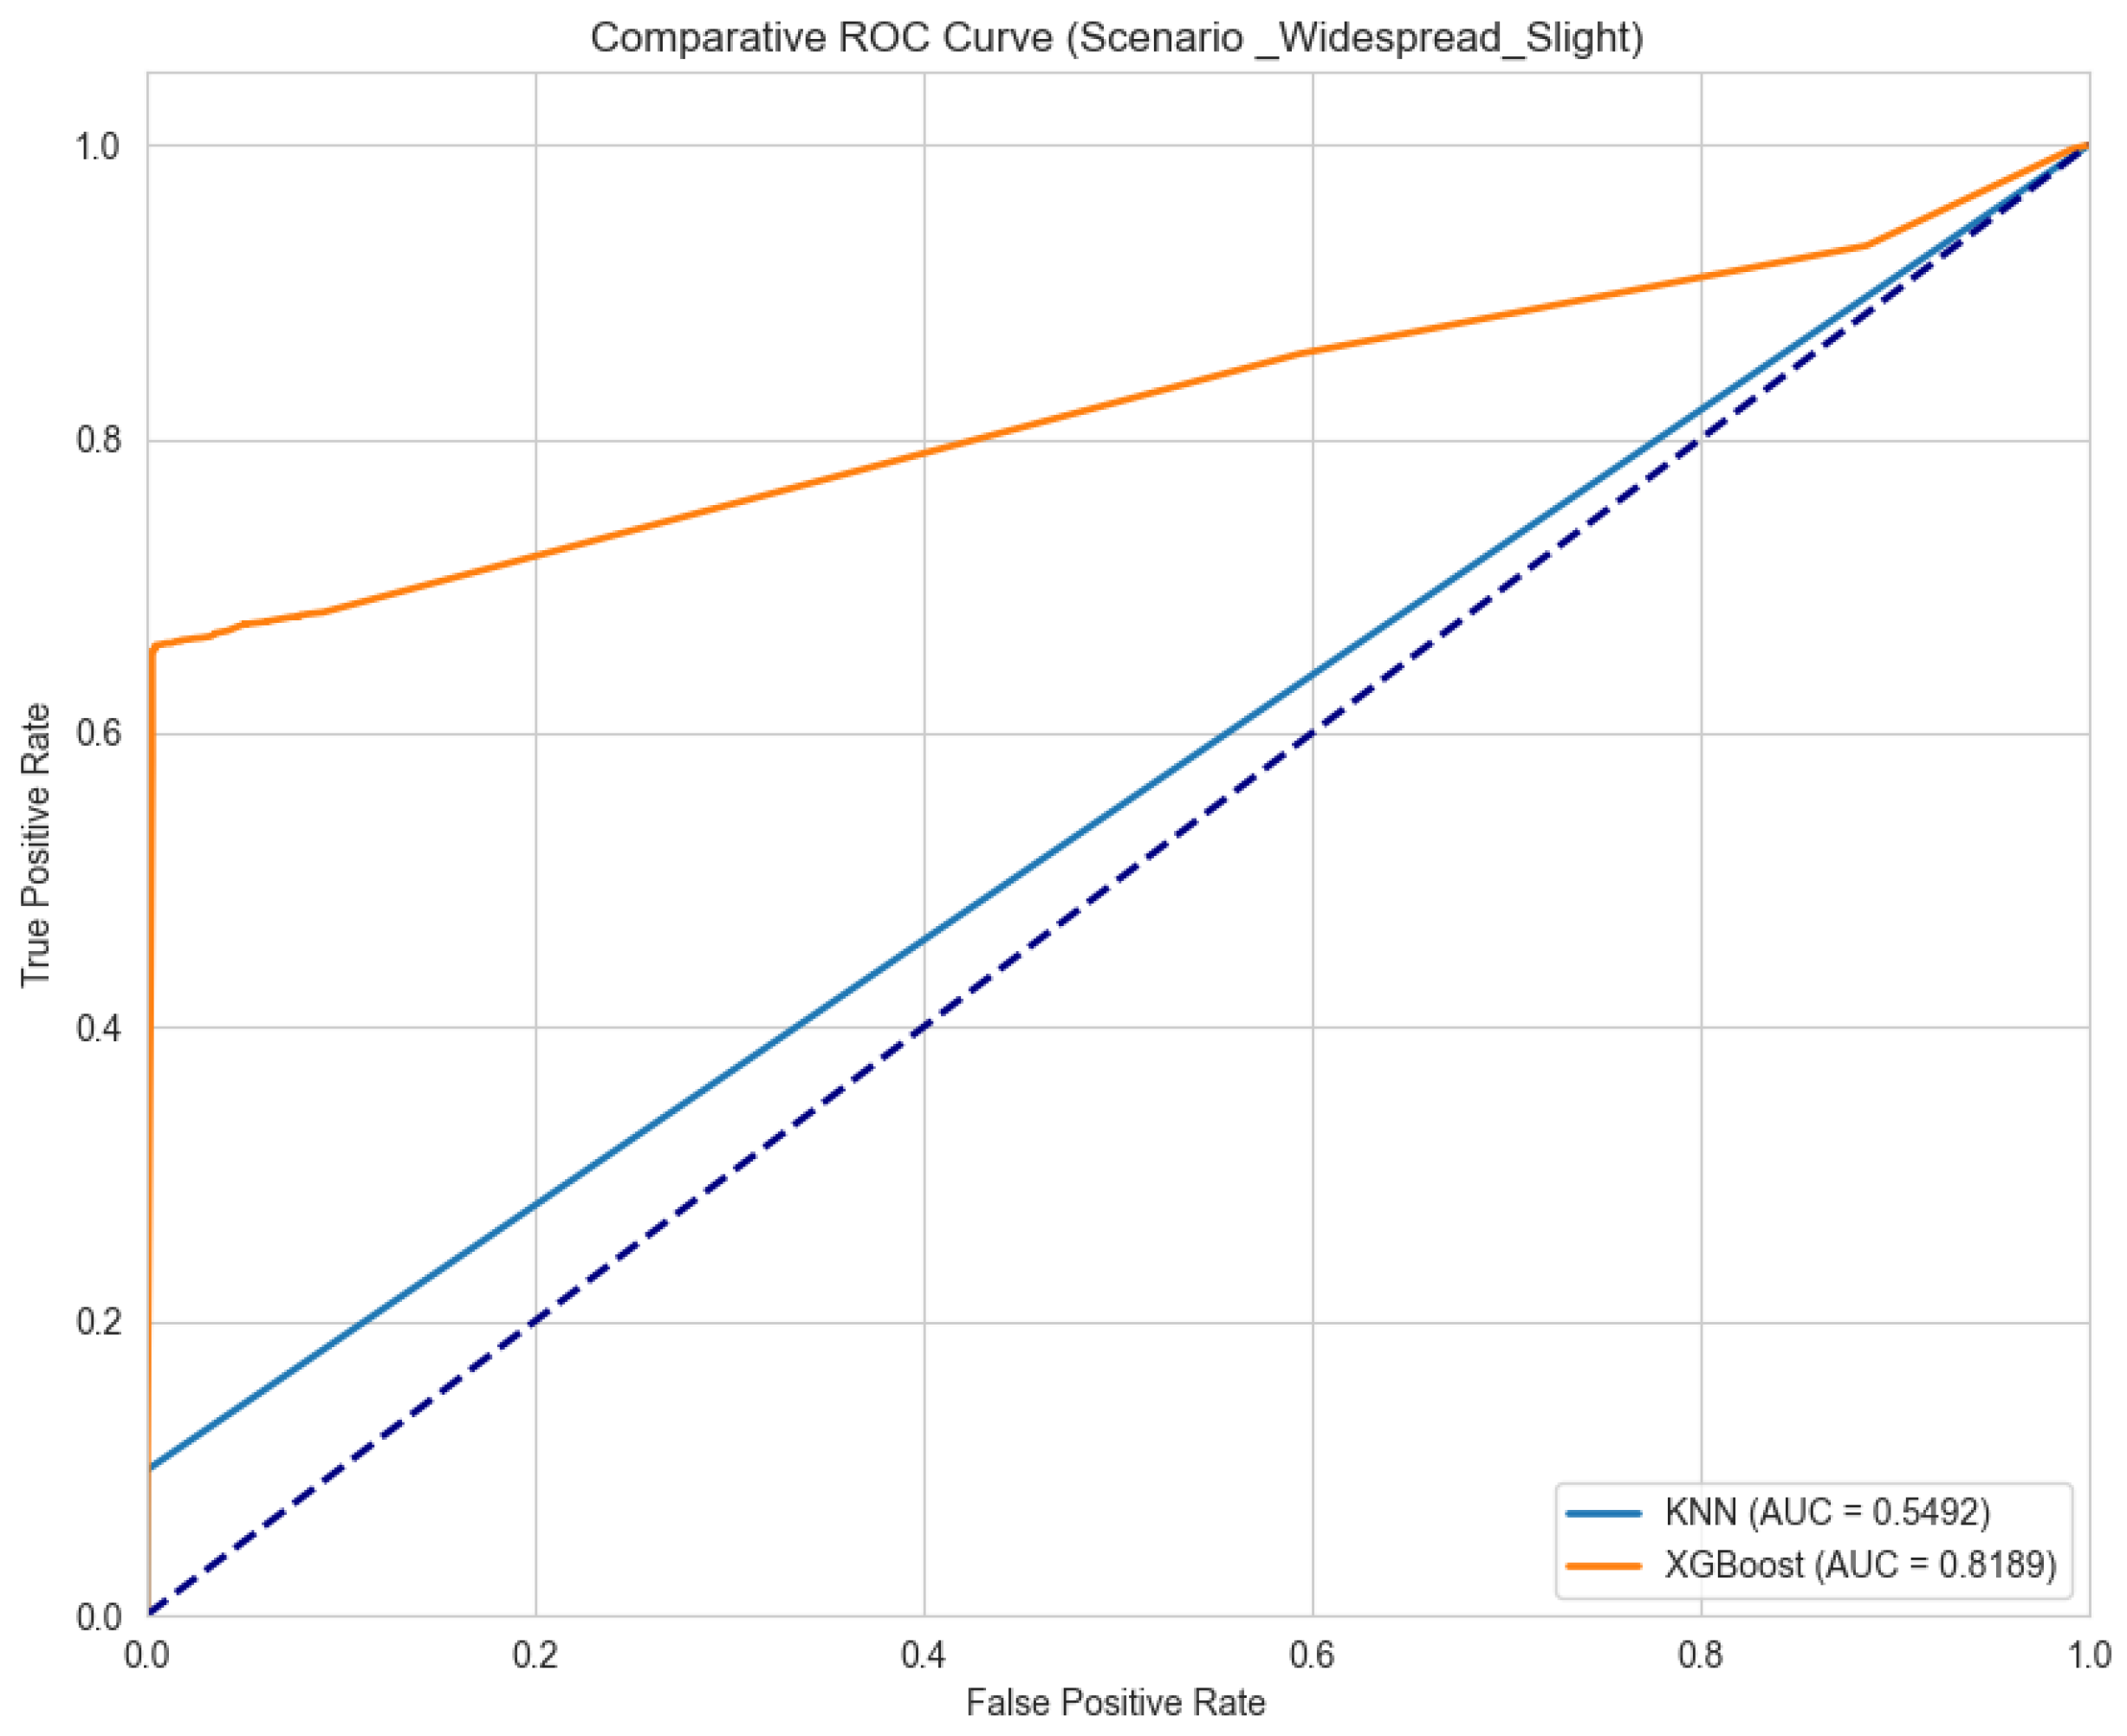
Figure 14, which shows the
Comparative ROC Curve under Widespread_Slight Chaos for all models. Unlike the baseline curves,
Figure 14 reveals a noticeable ‘sagging’ of the KNN curve towards the diagonal, indicating a loss in sensitivity. However, the XGBoost curve in
Figure 14 remains closer to the upper-left corner, proving that the synergy between Vibe Coding and gradient boosting effectively filters out chaotic perturbations, maintaining high detection rates even in non-linear network environments.
10.3. Aggregated Robustness Performance
An aggregated view of robustness is obtained by averaging the performance metrics across all four chaotic scenarios. This provides an overall measure of how each model withstands a range of adversarial ambiguities, as shown in
Table 8.
The aggregated results starkly highlight the difference in robustness. KNN’s performance degrades severely, with an average F1-Drop of over 76% and an AUC-Drop of over 42%. XGBoost, while affected, maintains an impressive level of performance, with average F1-Drop below 8% and AUC-Drop below 7%. The final phase of our evaluation focuses on the aggregated comparative analysis between the
Baseline performance and the
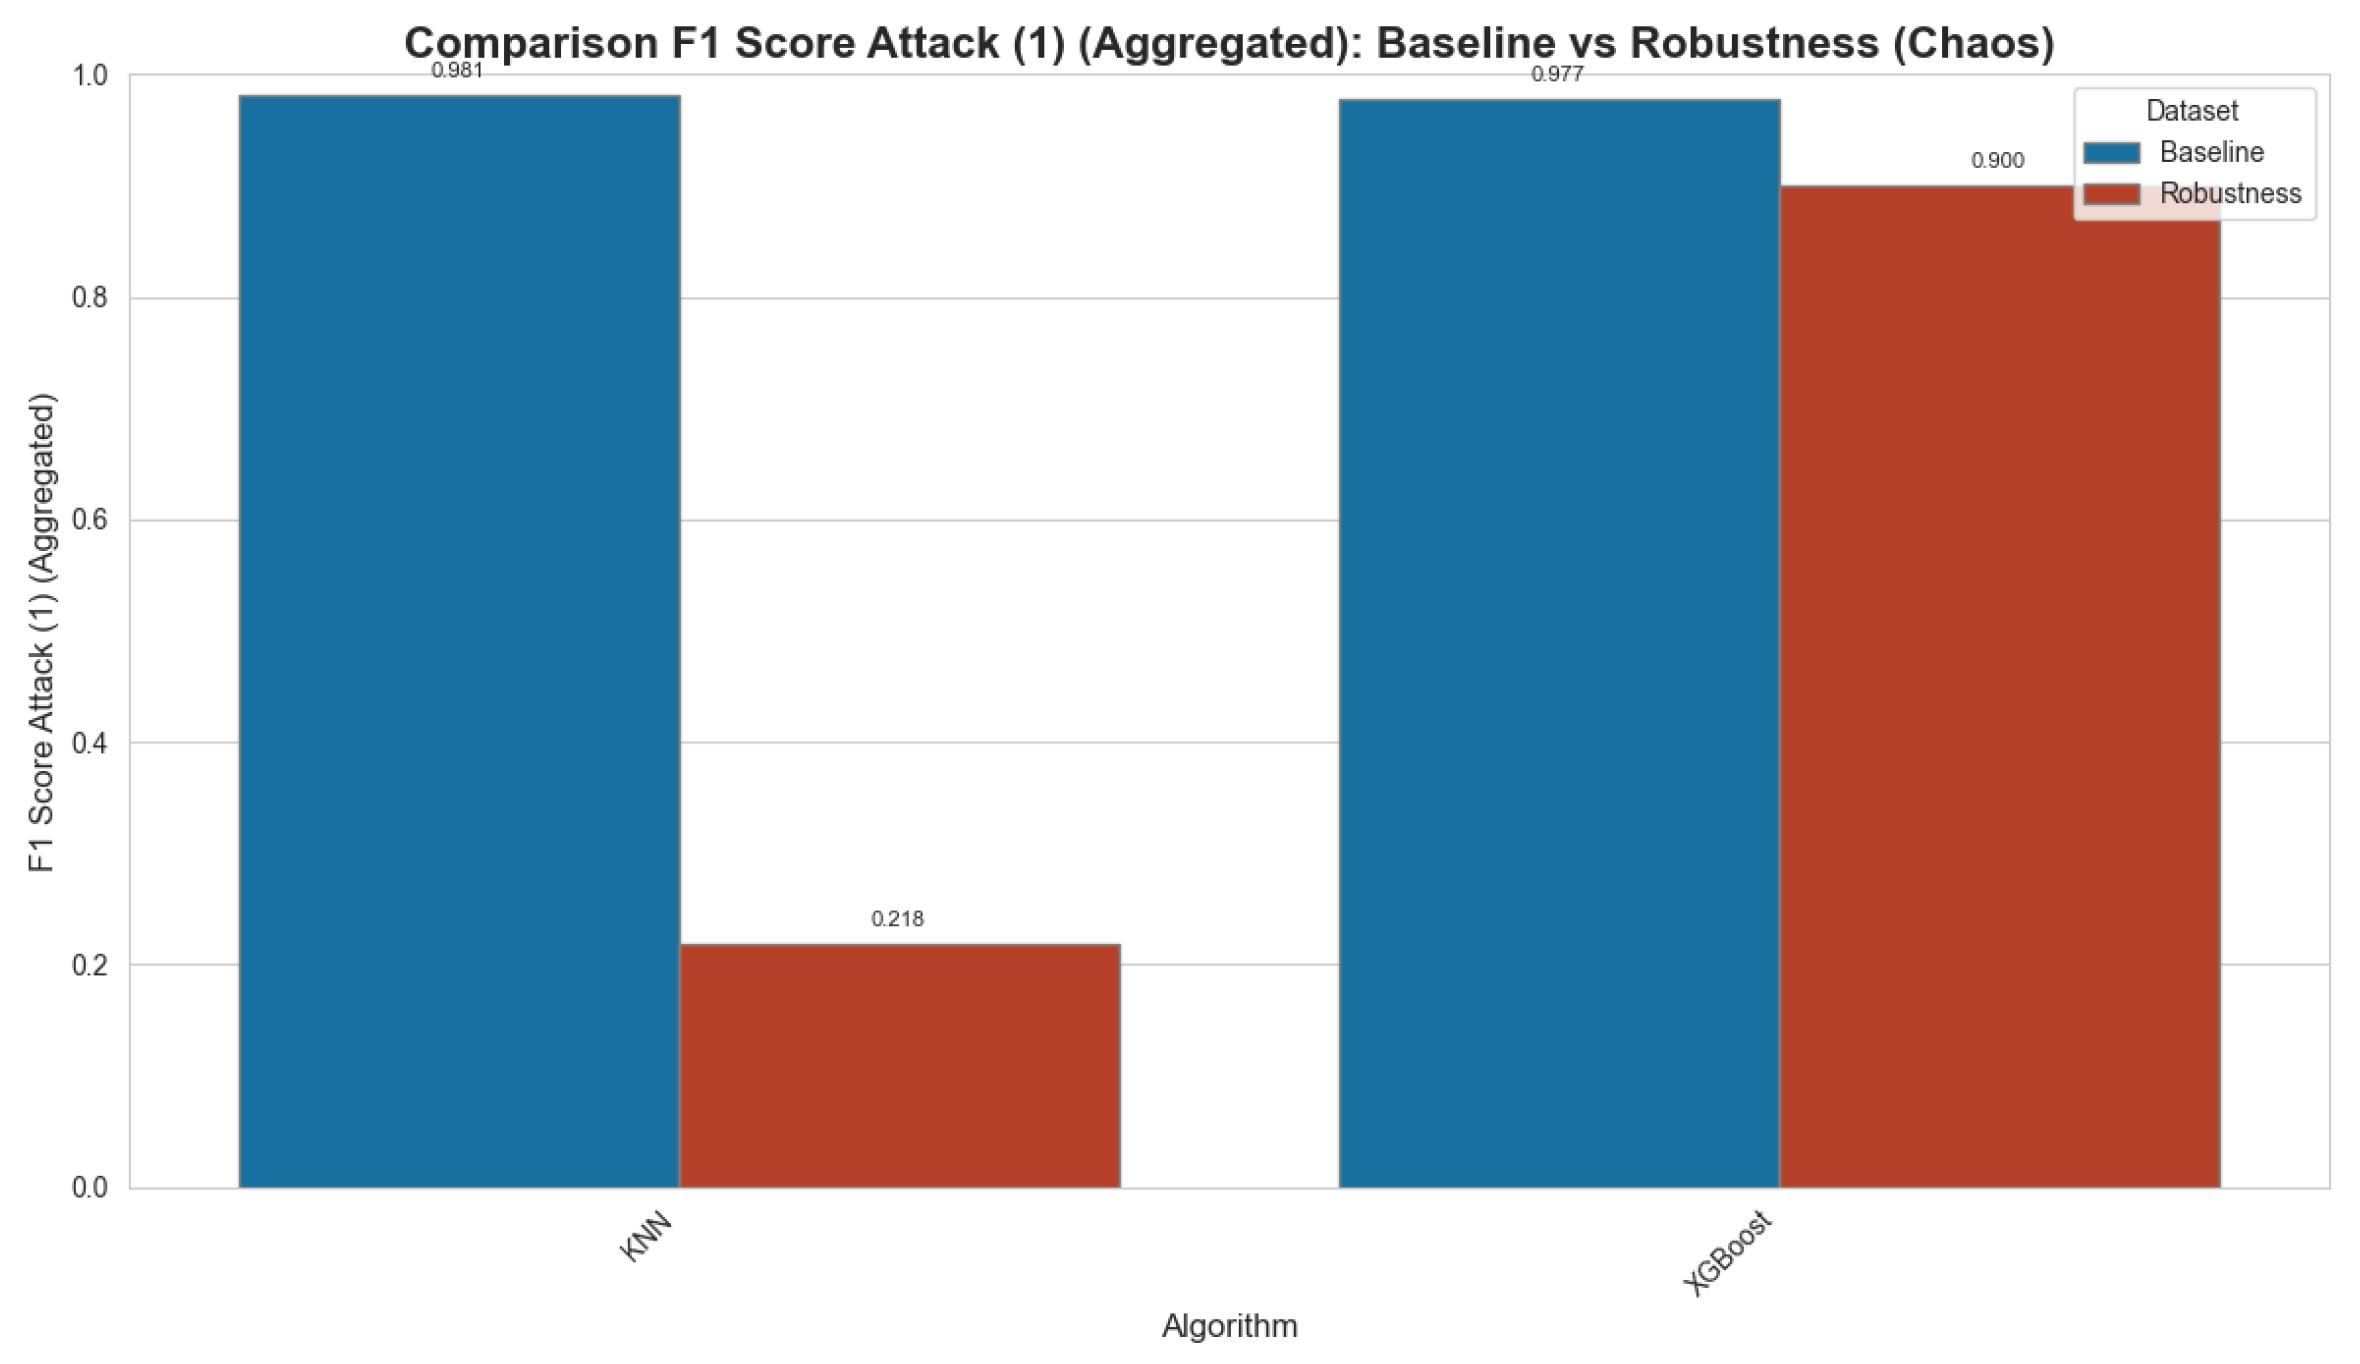
Robustness metrics across all chaotic scenarios. In
Figure 15, the
Aggregated Comparative F1-Score is presented. This bar chart provides a clear visualization of the performance delta; while both models excel in the baseline,
Figure 15 reveals a significant degradation for the KNN classifier when subjected to widespread chaotic noise. This confirms that F1-Score, when measured under robustness-first conditions (
), is a much more reliable indicator of real-world deployment success than simple laboratory accuracy. Furthermore,
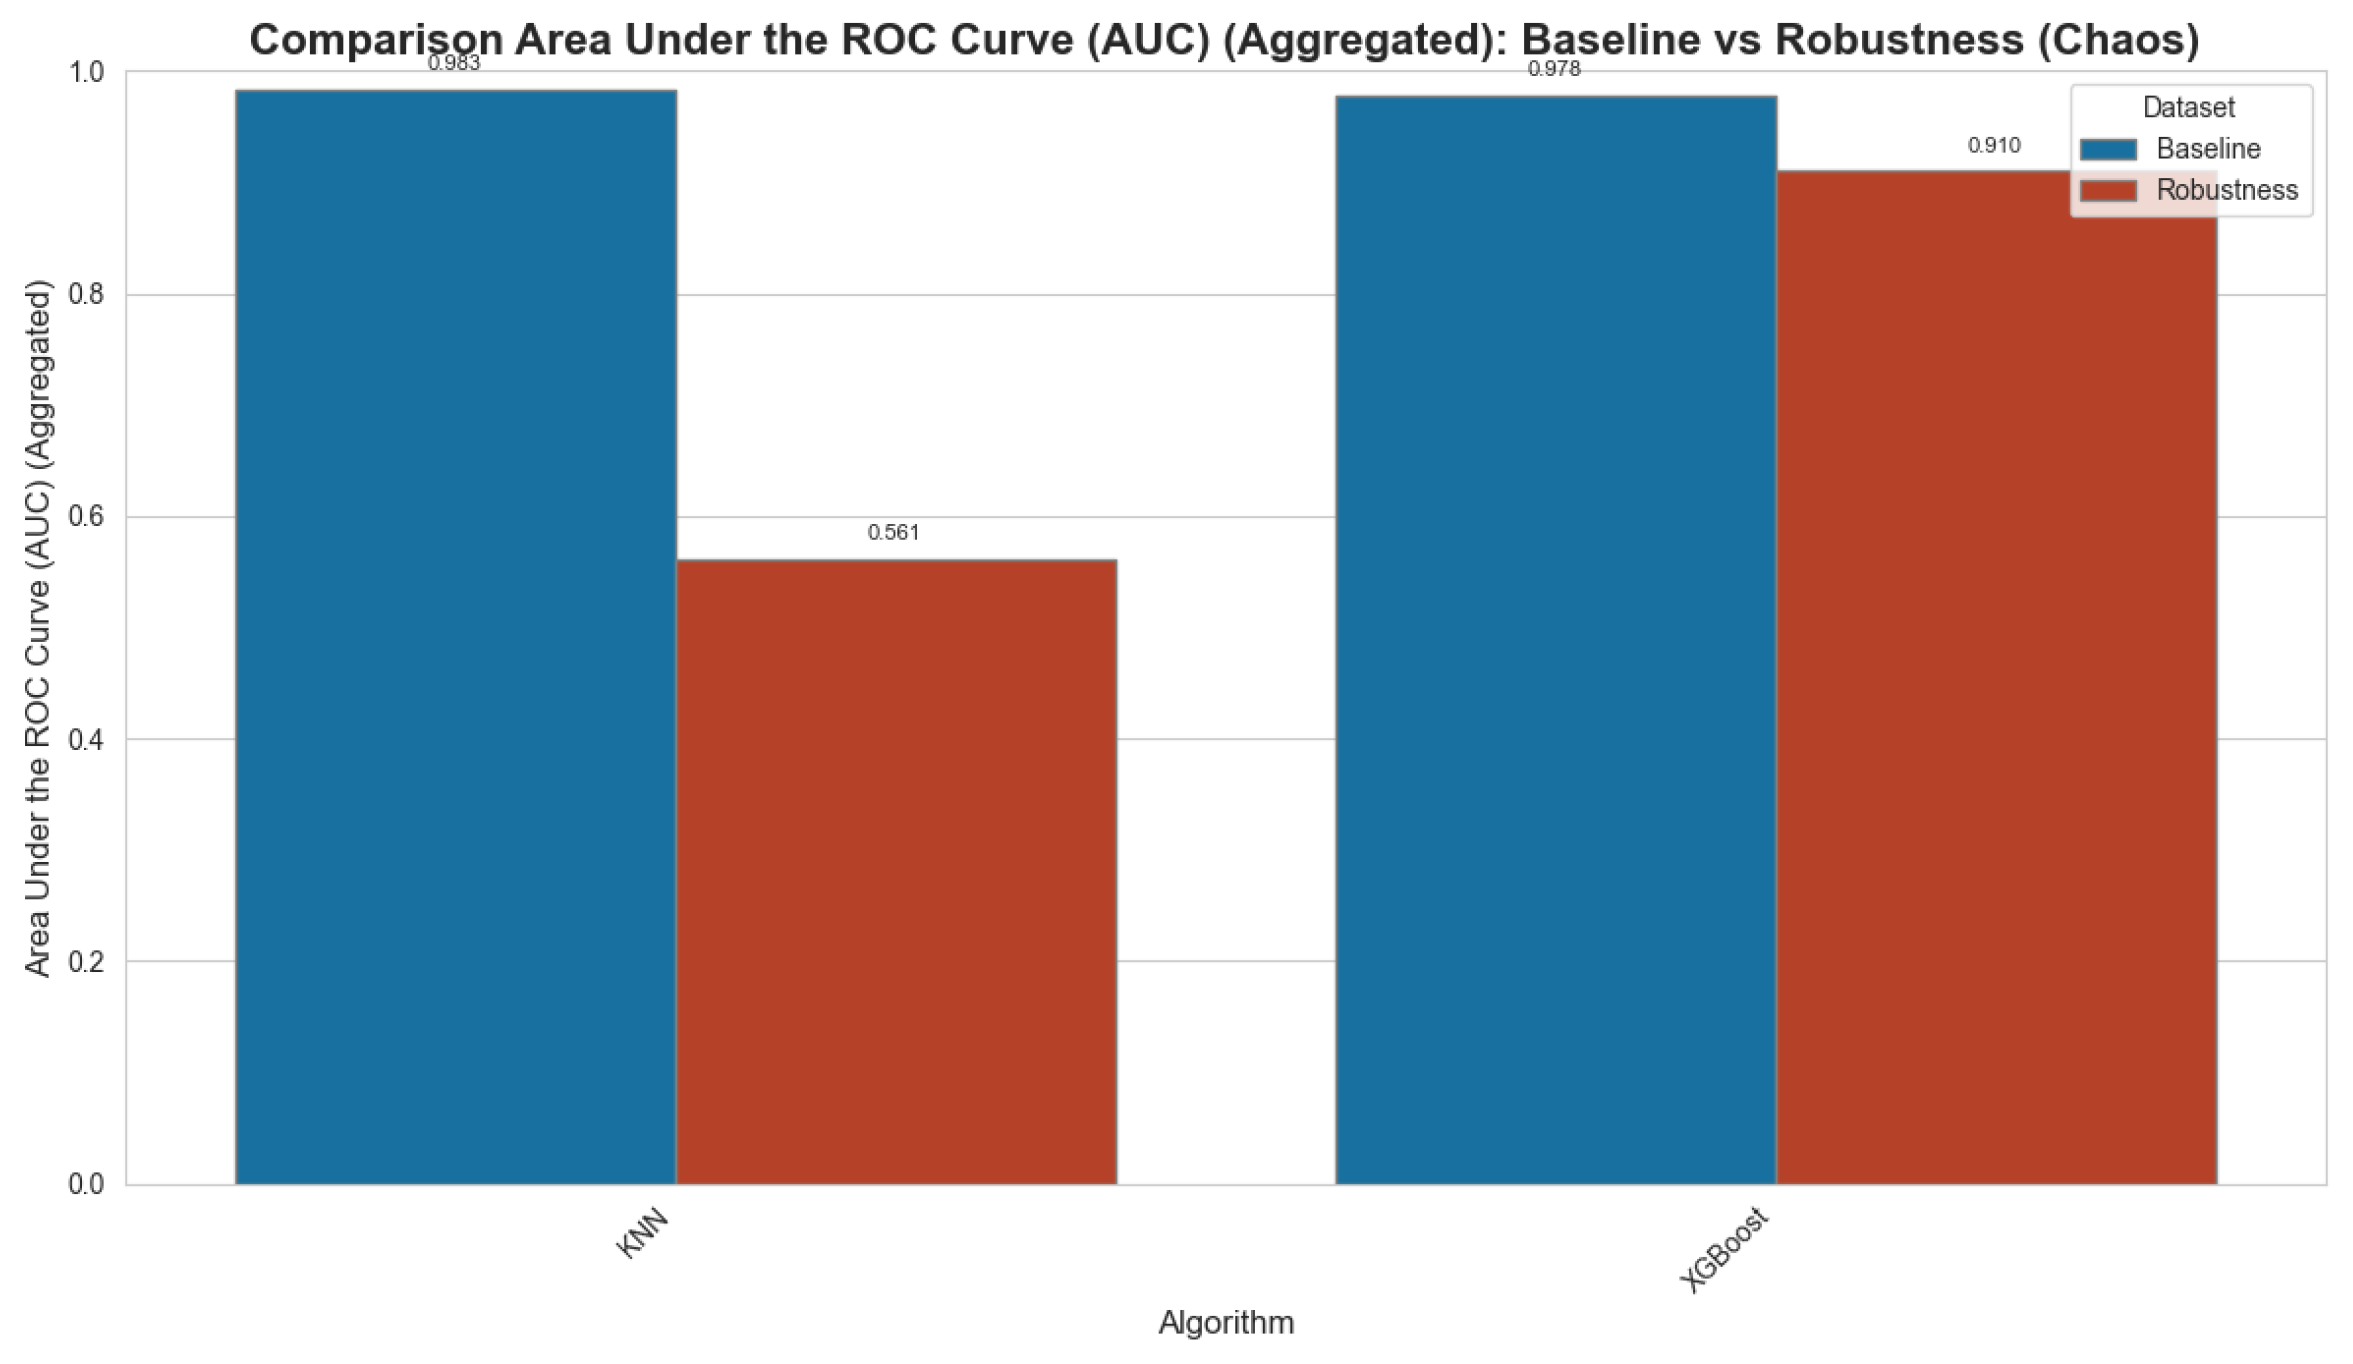
Figure 16 illustrates the
Aggregated Comparative AUC. By comparing the Area Under the Curve across the two states,
Figure 16 highlights the resilience of the XGBoost architecture. The minimal variance in AUC for XGBoost, even under peak chaos, suggests that its ensemble-based decision boundaries are structurally more stable than the distance-dependent clusters of KNN, which show a more pronounced decline in discriminative capability. Finally, the
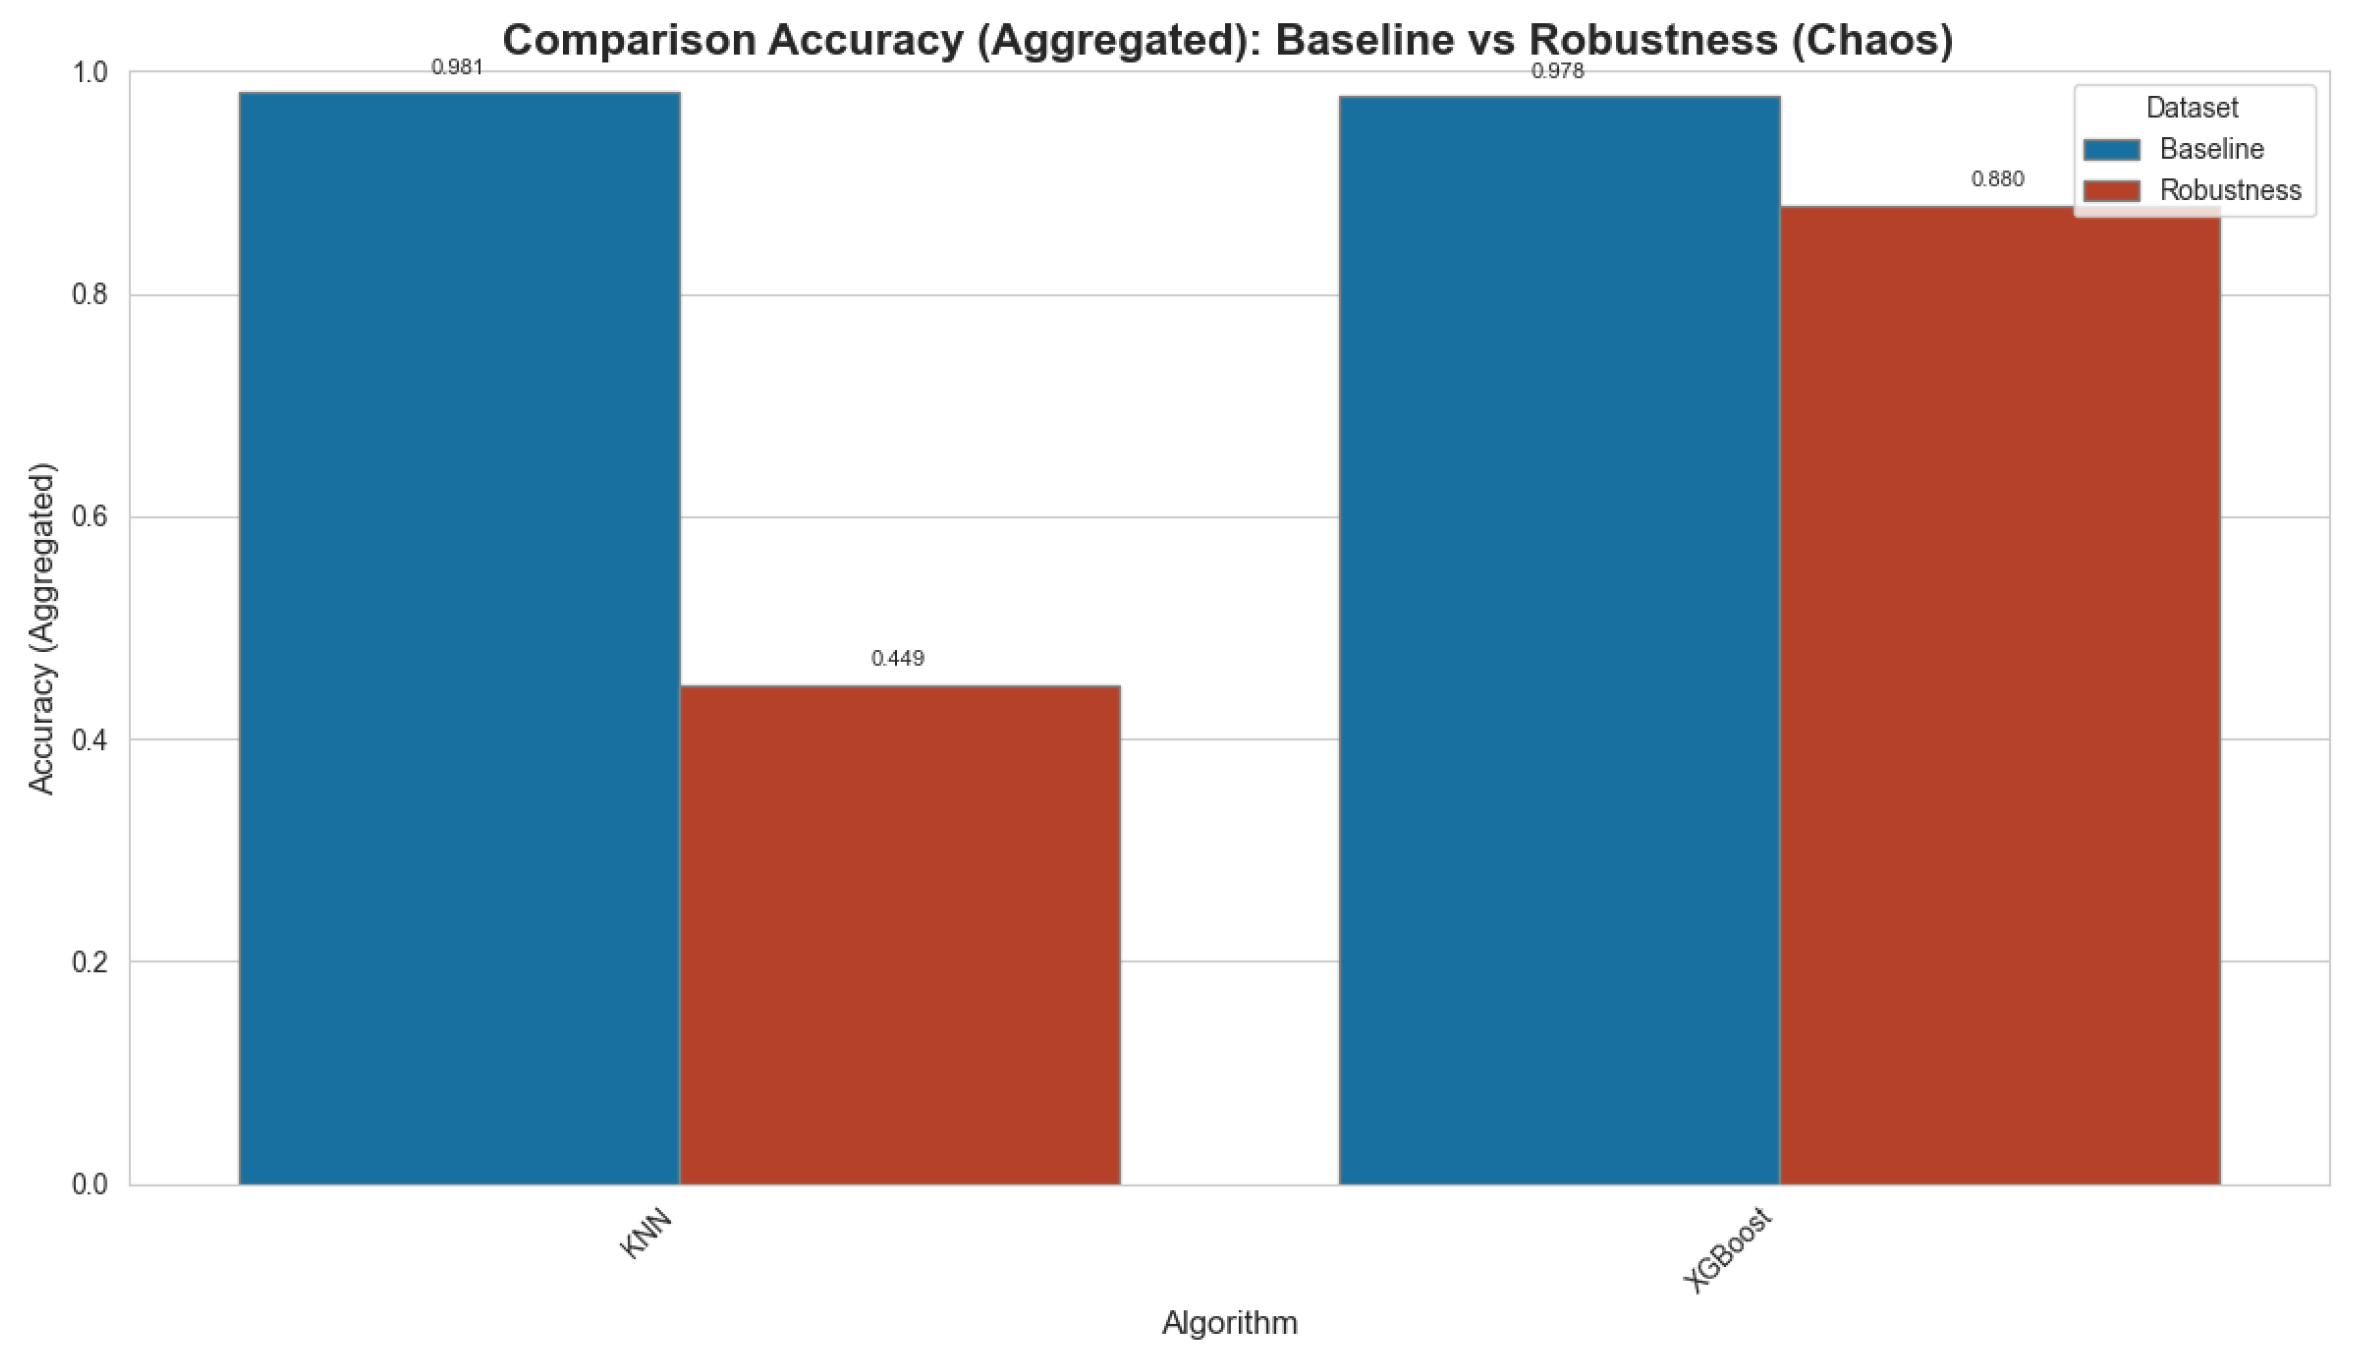
Aggregated Comparative Accuracy is summarized in
Figure 17. This figure serves as a definitive proof of the ‘robustness gap.’ As demonstrated in
Figure 17, relying solely on baseline accuracy can be deceptive for IoT security practitioners. The stark contrast between the two bars for each model emphasizes that the integration of Chaos Theory and Vibe Coding is essential to quantify the hidden vulnerabilities of AI models that otherwise appear optimal in quiescent network conditions, as shown in
Figure 15,
Figure 16 and
Figure 17.
10.4. Performance Under Chaotic Scenarios (Robustness Analysis)
In this section, the robustness of the KNN and XGBoost models is evaluated by injecting a controlled chaotic perturbation (generated by the Logistic Map) into the data. The performance presented here reflects the classification on perturbed data ( metric) and includes the complete metrics of Recall and Precision. The metric quantifies the loss of performance due to the chaotic noise.
The experimental results demonstrate a in the resilience of the Machine Learning models when exposed to chaotic perturbations, as summarized in the comparative robustness table.
The K-Nearest Neighbors (KNN) algorithm, being a distance-based classifier, proved to be fundamentally vulnerable. Its reliance on the local geometric properties of the data was deliberately obscured by the adversarial ambiguity introduced by the chaotic noise. This fragility is clearly quantified by the significant drop across all primary metrics: Accuracy, Recall, Precision, and . Aggregating performance across all chaotic conditions shows that KNN’s average plummets to , resulting in a severe of approximately , indicating catastrophic failure.
In stark contrast, the XGBoost model demonstrated . Its approach (Gradient Boosting) coupled with effective internal regularization mechanisms provides a substantial buffer against data perturbations. XGBoost consistently maintained high discriminatory capabilities, with an aggregated average of and a minimal performance drop () of only . The high and values maintained by XGBoost confirm its suitability for intrusion detection in hostile environments.
These findings carry a crucial implication for designing cybersecurity systems: simple high on clean data is insufficient. —the measurable capacity to maintain high Recall, Precision, and F1-Score under unpredictable or manipulated conditions—must be the primary design principle. The presented methodology provides a rigorous, quantitative framework for moving beyond standard performance metrics to assess true security stability.
Critical Divergence: The data clearly highlight a in model stability: XGBoost maintains significant performance (with an aggregated of and a minimal of ), whereas KNN suffers a ( of ), with and metrics approaching random chance, especially in the scenario.
Design Implication: It is unequivocally evidenced that on clean data ( metric) is for critical security systems. —the measurable capacity to maintain stable Recall, Precision, and F1-Score under adversarial perturbations ( metric)—must be the primary design principle.
Model Choice: Therefore, the results confirm that (such as XGBoost) are over distance-based classifiers (such as KNN) to ensure reliable and resilient intrusion detection in IoT environments subject to adversarial manipulation or dynamic instability.
The experimental results show a
in model robustness.
, being a distance-based classifier, failed catastrophically, with an average
of about 76%. This fragility is attributed to its strong dependence on the local geometric properties of the data, which were deliberately obscured by the chaotic noise. In contrast,
demonstrated
, maintaining an average
of 0.8999 and a minimal
of only 7.74%, validating the necessity of robust ensemble methods for intrusion detection in hostile IoT environments, as shown in
Table 9.
11. Discussion and Future Work (Extended Analysis)
The experimental results demonstrate a critical divergence in the robustness of the evaluated Machine Learning models when confronted with chaotic perturbations. The K-Nearest Neighbor (KNN) algorithm, a distance-based classifier, consistently exhibited severe performance degradation across all simulated chaotic scenarios. Its F1-Score for attack detection plummeted to levels barely indicative of effective classification (average F1-Robustness of 0.2182), and its ROC AUC approached that of random chance (average AUC-Robustness of 0.5613). This profound vulnerability underscores a fundamental limitation of models that rely heavily on the local geometric properties of data when those properties are deliberately obscured or altered by adversarial ambiguity. In a scientific context, this fragility suggests that KNN, despite its simplicity and often high accuracy on clean data, is ill-suited for security-critical applications where data integrity cannot be guaranteed. In stark contrast, the XGBoost model demonstrated remarkable resilience. Despite varying intensities and patterns of chaotic injection, its performance metrics remained robust (average F1-Robustness of 0.8999, average AUC-Robustness of 0.9100). The observed drops in F1-Score and AUC were comparatively minor, indicating that its ensemble, tree-based learning approach, coupled with internal regularization mechanisms, provides a significant buffer against data perturbations. This finding is of substantial scientific merit, reinforcing the notion that ensemble methods, particularly gradient-boosting trees, are inherently more robust to noise and feature shifts than simpler algorithms. For practical deployments in dynamic and adversarial network environments, XGBoost emerges as a significantly more reliable choice. The differentiation in model robustness is a pivotal outcome. It moves beyond conventional evaluations of accuracy on clean datasets, providing empirical evidence for the need to assess and quantify model resilience. The methodology presented—using controlled chaotic perturbations to simulate adversarial ambiguity—offers a rigorous framework for such assessments, allowing researchers and practitioners to identify the ‘failure boundaries’ of their AI-driven security solutions.
11.1. Implications for Network Security and AI-Driven Defense
The observed differential robustness has direct implications for the design and deployment of AI-driven Intrusion Detection Systems (IDSs) in IoT network scenarios. Deploying models like KNN, which are highly susceptible to chaotic noise, could lead to frequent false alarms or, more dangerously, missed detections when actual attacks are camouflaged within chaotic traffic. Conversely, models like XGBoost, which maintain performance under perturbation, offer a more reliable foundation for real-time anomaly detection in complex and unpredictable environments. This emphasizes that robustness must be a first-order design principle for security applications.
11.2. Future Work
Future research will extend this work in several directions:
Granular Chaos Parameter Analysis: Investigate the individual and interactive effects of chaotic parameters (e.g., Logistic map’s r value, perturbation intensity , attacker’s temporal profile ) on model performance. This could reveal specific vulnerabilities or resilience mechanisms.
Diverse Chaos Generators: Explore other chaos generators (e.g., Lorenz attractor, Chua’s circuit) to understand if the observed robustness is generalizable across different chaotic dynamics.
Adaptive AI for Robustness: Develop and evaluate adaptive AI techniques that can dynamically adjust model parameters or even switch between models based on real-time assessments of chaotic levels and threat patterns. This could involve meta-learning or reinforcement learning approaches.
Robust Feature Engineering: Investigate feature engineering strategies explicitly designed to extract features that are invariant or less sensitive to chaotic perturbations, thereby enhancing model resilience at the data preprocessing stage.
Integration with ECC: Further explore how dynamic ECC selection, informed by real-time chaotic/attack classification, could enhance end-to-end communication reliability in hybrid threat environments.
Real-world Data Validation: Validate the findings on real-world network traffic data infused with controlled synthetic chaos to bridge the gap between simulation and practical deployment.
12. Conclusions
This study successfully integrated Chaos Theory with AI analysis to rigorously evaluate the robustness of Machine Learning models in IoT network scenarios subjected to both natural perturbations and adversarial attacks. By employing a novel methodology that uses chaotic dynamics to simulate adversarial ambiguity, we demonstrated a critical distinction in the resilience of different AI algorithms. Specifically, while a distance-based classifier (KNN) proved highly vulnerable to chaotic perturbations, an ensemble-tree-based method (XGBoost) maintained a remarkably high level of performance. The findings underscore that accuracy on clean data alone is insufficient for deploying AI in security-critical systems. Robustness—the ability of a model to perform reliably under unexpected or manipulated conditions—must be a paramount consideration. This work provides a structured framework for quantifying such resilience, offering a valuable tool for researchers and practitioners in developing and selecting robust AI solutions for dynamic and adversarial environments. The insights gained are crucial for safeguarding critical infrastructures against complex, non-linear threats that defy conventional detection paradigms.
Author Contributions
Conceptualization, A.F.G. and M.C.; methodology, A.F.G. and M.C.; software, M.C.; validation, A.F.G.; formal analysis, A.F.G.; investigation, A.F.G. and M.C.; resources, M.C.; data curation, A.F.G.; writing—original draft preparation, A.F.G.; writing—review and editing, A.F.G. and M.C.; visualization, A.F.G.; supervision, A.F.G.; project administration, A.F.G.; funding acquisition, none. All authors have read and agreed to the published version of the manuscript.
Funding
This research did not receive any external funding.
Data Availability Statement
The original contributions presented in this study are included in the article. Further inquiries can be directed to the corresponding author.
Conflicts of Interest
The authors declare no conflicts of interest. The funders had no role in the design of the study; in the collection, analyses, or interpretation of data; in the writing of the manuscript; or in the decision to publish the results.
References
- Fazio, P. On the Effect of Coverage Range Extent on Next-Cell Prediction Error for Vehicular Mobility in 5G/6G Networks: A Novel Theoretic Model. IEEE Trans. Veh. Technol. 2025, 74, 1489–1503. [Google Scholar] [CrossRef]
- Gentile, A.F.; Cilione, M. Chaos Theory with AI Analisys in Network Scenarios. Telecom 2026, 7, 18. [Google Scholar] [CrossRef]
- Alabdulkreem, E.; Alotaibi, S.S.; Alamgeer, M.; Marzouk, R.; Hilal, A.M.; Motwakel, A.; Zamani, A.S.; Rizwanullah, M. Intelligent Cybersecurity Classification Using Chaos Game Optimization with Deep Learning Model. Comput. Syst. Sci. Eng. 2023, 45, 971–983. [Google Scholar] [CrossRef]
- Wang, T.; Yan, N.; Yang, C.; An, Z.; Zhang, G.; Xu, Y. Electromagnetic signal recognition using multimodal tri-branch semantic fusion network in the UAV-assist integrated sensing and communication systems. Digit. Signal Process. 2026, 171, 105820. [Google Scholar] [CrossRef]
- Aleisa, M.A. Blockchain-Enabled Zero Trust Architecture for Privacy-Preserving Cybersecurity in IoT Environments. IEEE Access 2025, 13, 18660–18676. [Google Scholar] [CrossRef]
- Saeed, M.M. An AI-Driven Cybersecurity Framework for IoT: Integrating LSTM-Based Anomaly Detection, Reinforcement Learning, and Post-Quantum Encryption. IEEE Access 2025, 13, 104027–104036. [Google Scholar] [CrossRef]
- Zahid, M.; Bharati, T.S. Enhancing cybersecurity in IoT systems: A hybrid deep learning approach for real-time attack detection. Discov. Internet Things 2025, 5, 73. [Google Scholar] [CrossRef]
- Oranekwu, I.; Elluri, L.; Yus, R.; Kotal, A. Scalable automation for IoT cyberSecurity compliance: Ontology-driven reasoning for real-time assessment. Comput. Secur. 2026, 161, 104711. [Google Scholar] [CrossRef]
- Abdelwahed, S.H.; Hefny, I.M.; Hegazy, M.; Said, L.A.; Soltan, A. Survey of IoT multi-protocol gateways: Architectures, protocols and cybersecurity. Internet Things 2025, 33, 101703. [Google Scholar] [CrossRef]
- Jaigirdar, F.T.; Rudolph, C.; Anwar, M.; Tan, B. Empowering End-Users with Cybersecurity Situational Awareness: Findings from IoT-Health Table-Top Exercises. J. Cybersecur. Priv. 2025, 5, 49. [Google Scholar] [CrossRef]
- Alanezi, K.; Annapareddy, T.; Khan, S.; Mishra, S. An edge-based IDS for the IoT using combined ML and generative AI models. Peer-to-Peer Netw. Appl. 2026, 19, 24. [Google Scholar] [CrossRef]
- Shankar, S.; Singh, D.; Badoni, A.; Shukla, M.K.; Pandey, O.J.; Aitsaadi, N. Toward Robust IDS in Network Security: Handling Class Imbalance With Deep Hybrid Architectures. IEEE Netw. Lett. 2025, 7, 357–361. [Google Scholar] [CrossRef]
- Chliah, H.; Hadj, M.A.E.; Battou, A.; Laoufi, A. TLBS-IDS: A New Hybrid Network Intrusion Detection System for Imbalanced Dataset in a Higher Education Setting. SN Comput. Sci. 2025, 6, 149. [Google Scholar] [CrossRef]
- Guerra, L.; Xu, L.; Bellavista, P.; Chapuis, T.; Duc, G.; Mozharovskyi, P.; Nguyen, V. AI-Driven Intrusion Detection Systems (IDS) on the ROAD Dataset: A Comparative Analysis for Automotive Controller Area Network (CAN). In Proceedings of the 2024 on Cyber Security in CarS Workshop, CSCS 2024, Salt Lake City, UT, USA, 14–18 October 2024; Fritz, M., Krauß, C., Hof, H., Eds.; ACM: New York, NY, USA, 2024; pp. 39–49. [Google Scholar] [CrossRef]
- Meske, C.; Hermanns, T.; von der Weiden, E.; Loser, K.; Berger, T. Vibe Coding as a Reconfiguration of Intent Mediation in Software Development: Definition, Implications, and Research Agenda. IEEE Access 2025, 13, 213242–213259. [Google Scholar] [CrossRef]
- Borg, M.; Bjarnason, E.; Hedin, F. Vibe Coding and the New Prototyping Playbook. IEEE Softw. 2025, 42, 12–16. [Google Scholar] [CrossRef]
- Fortes-Ferreira, M.; Alam, M.S.; Bazilinskyy, P. Vibe Coding in Practice: Building a Driving Simulator Without Expert Programming Skills. In Proceedings of the Adjunct Proceedings of the 17th International Conference on Automotive User Interfaces and Interactive Vehicular Applications, AutomotiveUI 2025, Brisbane, QLD, Australia, 22–25 September 2025; ACM: New York, NY, USA, 2025; pp. 60–66. [Google Scholar] [CrossRef]
- Sarkar, A.; Drosos, I. Vibe Coding: Programming through conversation with artificial intelligence. arXiv 2025, arXiv:2506.23253. [Google Scholar] [CrossRef]
- Alalwan, N.; El-Shafai, W.; Amoon, M.; Benjdira, B. Cybersecurity advancements for medical image transmission: A hybrid optical-based cryptosystem harnessing chaos, DNA sequences, and mandelbrot keys. Multimed. Tools Appl. 2025, 84, 41671–41711. [Google Scholar] [CrossRef]
- Gentile, A.F.; Fazio, P.; Macrì, D.; Greco, E.; Voznak, M. MQTT Anomalous Behavior Detection in IP Sensor Networks Through Convolutional Neural Networks and Traffic to Image Encoding. In Proceedings of the 2025 IEEE International Workshop on Metrology for Living Environment (MetroLivEnv); IEEE: Piscataway, NJ, USA, 2025; pp. 283–288. [Google Scholar] [CrossRef]
Figure 1.
Quiescent Topology.
Figure 1.
Quiescent Topology.
Figure 2.
Perturbed Topology.
Figure 2.
Perturbed Topology.
Figure 3.
Attacked Topology.
Figure 3.
Attacked Topology.
Figure 4.
Perturbed–Attacked Topology.
Figure 4.
Perturbed–Attacked Topology.
Figure 5.
Logical pipeline of the analysis: from mathematical formulation to AI classification.
Figure 5.
Logical pipeline of the analysis: from mathematical formulation to AI classification.
Figure 6.
Baseline ROC Curve for KNN. The solid orange line shows the ROC curve for the baseline scenario, and the blue dashed line represents the performance of a purely random classifier.
Figure 6.
Baseline ROC Curve for KNN. The solid orange line shows the ROC curve for the baseline scenario, and the blue dashed line represents the performance of a purely random classifier.
Figure 7.
Baseline ROC Curve for XGBoost.The solid orange line shows the ROC curve for the baseline scenario, and the blue dashed line represents the performance of a purely random classifier.
Figure 7.
Baseline ROC Curve for XGBoost.The solid orange line shows the ROC curve for the baseline scenario, and the blue dashed line represents the performance of a purely random classifier.
Figure 8.
Baseline Confusion Matrix for KNN.
Figure 8.
Baseline Confusion Matrix for KNN.
Figure 9.
Baseline Confusion Matrix for XGBoost.
Figure 9.
Baseline Confusion Matrix for XGBoost.
Figure 10.
Feature Separability: Packets ToServer vs. Packets ToClient under _Widespread_Slight Chaos.
Figure 10.
Feature Separability: Packets ToServer vs. Packets ToClient under _Widespread_Slight Chaos.
Figure 11.
Feature Separability: Packets ToServer vs. Bytes ToServer under _Widespread_Slight Chaos.
Figure 11.
Feature Separability: Packets ToServer vs. Bytes ToServer under _Widespread_Slight Chaos.
Figure 12.
Confusion Matrix for KNN under Widespread Slight Chaos. The color intensity represents the number of samples, where darker shades (or higher intensity) indicate a higher concentration of predictions for a given class.
Figure 12.
Confusion Matrix for KNN under Widespread Slight Chaos. The color intensity represents the number of samples, where darker shades (or higher intensity) indicate a higher concentration of predictions for a given class.
Figure 13.
Confusion Matrix for XGBoost under _Widespread_Slight Chaos. The color intensity represents the number of samples, where darker shades (or higher intensity) indicate a higher concentration of predictions for a given class.
Figure 13.
Confusion Matrix for XGBoost under _Widespread_Slight Chaos. The color intensity represents the number of samples, where darker shades (or higher intensity) indicate a higher concentration of predictions for a given class.
Figure 14.
Comparative ROC Curve under Widespread Slight Chaos (All Models). The solid lines represent the performance of the evaluated models, while the dashed diagonal line indicates the performance of a random classifier, serving as a baseline for non-discrimination.
Figure 14.
Comparative ROC Curve under Widespread Slight Chaos (All Models). The solid lines represent the performance of the evaluated models, while the dashed diagonal line indicates the performance of a random classifier, serving as a baseline for non-discrimination.
Figure 15.
Aggregated Comparative F1-Score: Baseline vs. Robustness.
Figure 15.
Aggregated Comparative F1-Score: Baseline vs. Robustness.
Figure 16.
Aggregated Comparative AUC: Baseline vs. Robustness.
Figure 16.
Aggregated Comparative AUC: Baseline vs. Robustness.
Figure 17.
Aggregated Comparative Accuracy: Baseline vs. Robustness.
Figure 17.
Aggregated Comparative Accuracy: Baseline vs. Robustness.
Table 1.
Mapping of Macro Chaos Scenarios to Stochastic Parameters ().
Table 1.
Mapping of Macro Chaos Scenarios to Stochastic Parameters ().
| Chaos Scenario | Rate () | Range () | Operational Objective |
|---|
| Slight_Stealthy | 0.05 | ±0.05 | Evaluates sensitivity to near-threshold fluctuations in Quiescent states. |
| Targeted_Extreme | 0.05 | ±0.50 | Simulates rare, high-impact anomalies or sensor failure during Attacks. |
| Standard_Medium | 0.30 | ±0.15 | Baseline for training stability across all four operational states. |
| Widespread_Slight | 0.50 | ±0.05 | Models pervasive, low-intensity background noise in Perturbed environments. |
| Massive_Extreme | 0.50 | ±0.50 | Worst-case stress test for the Perturbed–Attacked combined scenario. |
Table 2.
Comparative Summary: KNN vs. XGBoost.
Table 2.
Comparative Summary: KNN vs. XGBoost.
| Feature | KNN | XGBoost |
|---|
| Inference Speed | Slow () | Very Fast |
| Noise Robustness | Low | High |
| Interpretability | High (Geometric) | Moderate (Feature Importance) |
| Scaling Required | Yes (Mandatory) | No (Optional) |
| Training Time | Zero (Lazy) | Moderate to High |
Table 3.
Baseline Performance () of Machine Learning Models (Complete Classification Metrics for Attack Class).
Table 3.
Baseline Performance () of Machine Learning Models (Complete Classification Metrics for Attack Class).
| Algorithm | | | | | |
|---|
| KNN | 0.9810 | 0.9832 | 0.9805 | 0.9811 | 0.9808 |
| XGBoost | 0.9777 | 0.9783 | 0.9775 | 0.9771 | 0.9773 |
Table 7.
Comparative Performance under _Widespread_Slight Scenario.
Table 7.
Comparative Performance under _Widespread_Slight Scenario.
| Alg. | F1_B | AUC_B | Acc_B | F1_R | AUC_R | Acc_R | F1_D | AUC_D |
|---|
| KNN | 0.9808 | 0.9832 | 0.9810 | 0.1792 | 0.5492 | 0.3097 | 0.8016 | 0.4340 |
| XGBoost | 0.9773 | 0.9783 | 0.9777 | 0.7924 | 0.8189 | 0.7364 | 0.1849 | 0.1594 |
Table 8.
Final Aggregated Comparative Table (Baseline vs. Robustness).
Table 8.
Final Aggregated Comparative Table (Baseline vs. Robustness).
| Alg. | F1_B | AUC_B | Acc_B | F1_R | AUC_R | Acc_R | F1_D | AUC_D |
|---|
| KNN | 0.9808 | 0.9832 | 0.9810 | 0.2182 | 0.5613 | 0.4485 | 0.7626 | 0.4220 |
| XGBoost | 0.9773 | 0.9783 | 0.9777 | 0.8999 | 0.9100 | 0.8796 | 0.0774 | 0.0682 |
Table 9.
Comparative Robustness Performance under Chaotic Scenarios (Full Metrics and for Attack Class).
Table 9.
Comparative Robustness Performance under Chaotic Scenarios (Full Metrics and for Attack Class).
| Scenario | Alg. | | | | | | |
|---|
| _Slight_Stealthy | KNN | 0.5337 | 0.5011 | 0.1652 | 0.2435 | 0.5693 | 0.7373 |
| XGBoost | 0.9593 | 0.9630 | 0.9592 | 0.9611 | 0.9654 | 0.0162 |
| _Standard_Medium | KNN | 0.4170 | 0.4502 | 0.1311 | 0.2066 | 0.5576 | 0.7742 |
| XGBoost | 0.9664 | 0.9701 | 0.9638 | 0.9669 | 0.9702 | 0.0104 |
| _Widespread_Slight | KNN | 0.3097 | 0.3551 | 0.1105 | 0.1792 | 0.5492 | 0.8016 |
| XGBoost | 0.7364 | 0.7450 | 0.8492 | 0.7924 | 0.8189 | 0.1849 |
| Disclaimer/Publisher’s Note: The statements, opinions and data contained in all publications are solely those of the individual author(s) and contributor(s) and not of MDPI and/or the editor(s). MDPI and/or the editor(s) disclaim responsibility for any injury to people or property resulting from any ideas, methods, instructions or products referred to in the content. |