1. Introduction
With information technology deeply integrated into the economy and society, information security has become the cornerstone of national security and the digital economy. Although the mathematical security of cryptographic algorithms has been rigorously proven, their physical implementations inevitably leak side-channel information through various observable phenomena, including power consumption [
1,
2], electromagnetic radiation [
3,
4], and execution timing [
5]. Side-channel analysis (SCA), first systematically introduced by Kocher et al. in 1999 [
1], exploits these unintentional physical leakages to recover secret keys, posing a severe threat to cryptographic devices. Consequently, SCA has become an indispensable tool for evaluating the actual security of cryptographic implementations in hardware and embedded systems.
SCA serves as a critical means for evaluating the security of cryptographic implementations. Among the various SCA techniques, differential power analysis (DPA) and simple power analysis (SPA) are two commonly used methods. DPA exploits statistical correlations across a large number of power traces to extract key-dependent information, whereas SPA attempts to directly infer key-dependent behavior from a small number of traces or even a single power consumption trace. While advanced side-channel attacks are more effective against heavily protected targets, SPA, with its minimal trace requirements (one trace or few traces) and low attack cost, poses a distinct threat to resource-constrained embedded devices that typically lack sophisticated countermeasures.
However, in practical measurement environments, power traces are often affected by measurement noise, temporal misalignment, and redundant patterns unrelated to cryptographic computations. These factors obscure the instantaneous power features associated with key-dependent information, making reliable identification difficult under the single-trace setting. As a result, effective preprocessing of power traces is essential for successful SPA attacks.
The objective of SPA trace preprocessing is to enhance instantaneous local power patterns correlated with key-dependent behavior. This requires preprocessing techniques that preserve power consumption variations, suppress noise, correct alignment deviations, and crop regions of interest corresponding to sensitive cryptographic computations. Such preprocessing yields a cleaner and more discriminative trace representation, facilitating subsequent key recovery.
Related Works: Preprocessing methods for SPA have evolved with the goal of enhancing key-related leakage under noisy and misaligned measurements. Early works mainly focused on trace preprocessing techniques, such as low-pass filtering and moving average [
1,
6], as well as resampling and compression methods [
7,
8]. These techniques are widely used in SPA and primarily aim to suppress high-frequency noise, smooth power traces, or reduce data redundancy.
Beyond denoising, temporal alignment is a critical preprocessing step in SPA. Homma et al. [
9] introduced phase-only correlation for alignment, but it is sensitive to high-frequency noise and often requires additional filtering. Subsequent studies applied principal component analysis (PCA) [
10,
11] for dimensionality reduction, and dynamic time warping (DTW) [
12,
13] for nonlinear alignment. However, DTW suffers from quadratic computational complexity and is sensitive to outliers and noise. Gu et al. [
14] employed adaptive filtering to address low-SNR alignment challenges, although it still requires careful manual parameter tuning to prevent over-filtering.
Data-driven decomposition techniques were later incorporated into SPA preprocessing. Wavelet-based methods with synchrosqueezing [
15] and empirical mode decomposition [
16] improve denoising effectiveness but suffer from high computational cost and mode-mixing issues, respectively.
More recently, deep learning approaches have been adopted to automate SPA preprocessing workflows. Zaid et al. [
17] proposed a unified neural network framework that seamlessly integrates multiple preprocessing techniques, enabling end-to-end automation, albeit at the cost of significantly increased computational complexity and training time. Extending beyond trace enhancement, Wang et al. [
18] introduced SPA-GPT, which employs reinforcement learning to automatically learn trace segmentation strategies, achieving high success rates but requiring long training times and reliance on accurate power simulation models.
While higher-order statistical measures such as kurtosis or higher-order cumulants have previously been employed to characterize non-Gaussianity in side-channel traces [
19], these approaches are typically used to assess the global distributional properties of the signal. In contrast, the proposed moving-skewness method applies a localized third-order statistical transformation to capture temporal variations in distributional asymmetry induced by secret-dependent operations. By emphasizing leakage-relevant asymmetry within short time windows, this method is designed to enhance operation-level distinguishability in SPA scenarios.
Although existing side-channel preprocessing methods have made significant progress, they still exhibit notable limitations in the context of SPA:
Most methods overlook local nonlinearity and asymmetry in power traces, which often carry highly key-sensitive leakage. Aggressive denoising eliminates subtle yet discriminative transient peaks and critical details, severely degrading trace analysis capability.
Current denoising strategies are not optimized for leakage-dependent patterns. They tend to retain a certain amount of operation-irrelevant redundant noise while inadvertently suppressing weak but genuinely leakage-related signals.
Despite their sophistication, model-based, data-driven, or integrated learning approaches still leave significant room for improvement with respect to model training difficulty, deployment computational overhead, per-trace preprocessing latency, and transferability across diverse devices and measurement environments.
In 2019, the side-channel analysis library eShard’s scared framework [
20] implemented a moving-skewness-based preprocessing method using the skewness statistic. However, the application scenarios of this method and its advantages compared with other preprocessing techniques have not yet been discussed.
Our Contributions: To address the challenges of SPA using moving skewness, we make the following key contributions:
Discussion on the Moving-Skewness Preprocessing Method: We provide a systematic discussion of the moving-skewness preprocessing method. By calculating the local skewness within a moving window along the trace, this method produces a transformed trace comprising local skewness values, which emphasizes regions of distributional asymmetry. The discussion explains why skewness, as a higher-order statistical moment, is well suited for capturing asymmetric leakage patterns arising from secret-dependent operations or switching activity, and we identify the scenarios in which moving-skewness preprocessing is particularly effective.
Enhanced Visualization and Precise Localization of Subtle Leakage: The proposed method improves the visibility of subtle leakage signals that are often difficult to observe in raw traces. By transforming subtle distributional asymmetries into more distinguishable peaks in the skewness trace, it facilitates visual identification and more accurate localization of leakage regions, thereby supporting subsequent SPA analysis.
Improved Detection Capability and Attack Success Rate: We conduct both theoretical and empirical analysis to examine the sensitivity of the moving-skewness method to subtle trace variations as well as abrupt amplitude changes associated with key-dependent operations. Compared to commonly used preprocessing methods that may smooth or obscure local structures, the inherent sensitivity of skewness to distribution shape enables it to more effectively capture asymmetric leakage features. As a result, higher success rates are achieved in practical side-channel analysis compared to common methods.
Window-Selection Strategy for Preprocessing: This paper introduces a feature-driven strategy for selecting moving-skewness window sizes based on prior knowledge of leakage characteristics. Three window-selection strategies are considered: maximizing symmetry differences, amplifying impulse-type leakage, and enhancing short-time transient features. These strategies aim to emphasize asymmetric leakage components while reducing the influence of symmetric or irrelevant regions, thereby improving preprocessing effectiveness and supporting higher attack success rates.
The remainder of this paper is organized as follows:
Section 2 introduces the necessary preliminaries.
Section 3 proposes the moving-skewness method in detail.
Section 4 presents the experimental setups and results.
Section 5 presents the discussion on other side-channel analyses.
Section 6 concludes the paper and outlines directions for future work.
2. Preliminaries
In this section, we review the preliminaries. First, we introduce the basic principles of SPA attacks. Then, we summarize commonly used preprocessing techniques for power trace analysis. Next, we briefly present PCA as a dimensionality reduction technique for feature extraction from high-dimensional traces. Finally, we introduce the skewness metric and provide its formulation, and we show the algorithm of moving skewness.
2.1. Simple Power Analysis
SPA is a non-invasive attack. It recovers secret keys by directly observing the power consumption trace when a cryptographic device runs an algorithm. The dynamic power consumption of circuits closely depends on processed data and operations. Different operations or different Hamming weights produce clear and distinguishable patterns in power traces. Typical examples include the square-always and square-and-multiply patterns in RSA modular exponentiation.
In a practical SPA workflow, the measured power trace is first segmented into shorter intervals corresponding to individual operations or instruction groups. These segments can then be represented in a reduced feature space using dimensionality reduction techniques, which preserve the dominant trace characteristics while suppressing irrelevant variations. Based on this representation, clustering is applied to group segments exhibiting similar power consumption patterns. By correlating the resulting clusters with specific operations or control-flow behaviors, an attacker can identify secret-dependent execution patterns and directly infer key-related information.
Common SPA countermeasures reduce the direct observability of operation-level patterns in power traces. Random delays, dummy operations, operation reordering, and clock jitter disrupt the temporal structure of execution, hindering reliable alignment and boundary identification. Constant-structure implementations further suppress secret-dependent control flow by enforcing uniform execution paths. Consequently, characteristic SPA patterns that are evident in unprotected implementations become difficult to discern in raw traces.
2.2. Preprocessing Method
Low-pass filtering is one of the most commonly used frequency-domain denoising techniques. Traces contain both signal components related to cryptographic operations and high-frequency noise introduced by measurement equipment and switching activity. By attenuating high-frequency components, low-pass filtering reduces noise and improves the interpretability of power traces. The frequency response of an ideal low-pass filter is defined as
where
is the cutoff frequency.
In practical engineering implementations, a first-order infinite impulse response (IIR) low-pass filter is typically employed. Its recursive form is given by
where
is the current raw sample,
is the filtered output,
is the previous filtered value, and
is the smoothing parameter.
The parameter
a is related to the cutoff frequency
and the sampling frequency
by
Rearranging the above expression with respect to
, we obtain
In this paper, we adopt an equivalent formulation of the first-order IIR low-pass filter given in Equation (
5), where
is the smoothing parameter:
This formulation is equivalent to Equation (
2), with the relationship between the parameters
w and
a given by
The proof is provided in
Appendix A.
Moving-average smoothing is a commonly used time-domain smoothing technique. It operates by averaging samples within a sliding window of length
w, which is typically chosen as an odd integer to preserve symmetry around the center sample. The filtered value at sample
i is given by
This operation is equivalent to convolving the trace with a rectangular kernel of width d. By suppressing short-duration fluctuations, moving-average filtering reduces noise and improves the interpretability of power traces. However, a large window may blur rapid transitions between adjacent operations, potentially obscuring short-duration features.
It should be noted that the above formulation is used for offline preprocessing of already-acquired side-channel traces, rather than for real-time signal processing. Therefore, the use of a non-causal form is acceptable in this work, since the entire trace is available before preprocessing.
2.3. Principal Component Analysis for Dimensionality Reduction
In real-world settings, traces often consist of hundreds of thousands or even millions of samples, resulting in high computational cost and substantial redundancy due to strong correlations between adjacent samples. PCA is a classical unsupervised linear technique that is widely used for feature extraction and dimensionality reduction in side-channel trace preprocessing. It projects high-dimensional traces onto an orthogonal basis defined by the principal directions of data covariance, thereby capturing the dominant signal characteristics while reducing the dimensionality of the data.
To formalize PCA, let
denote the matrix of
N time-aligned and centered power traces, each of length
T. The covariance matrix along the time dimension is computed as
Eigenvalue decomposition of
yields
where the eigenvalues in
are sorted in descending order. The projection matrix
is formed by the eigenvectors corresponding to the
k largest eigenvalues. Each trace
is then projected onto the resulting
k-dimensional subspace as
Typically, the smallest k is chosen such that the cumulative variance explained by the first k components reaches 95–99%. This dramatically reduces dimensionality while preserving most of the systematic variations present in the power traces. In the context of SPA, PCA is primarily used to organize high-dimensional traces into a compact representation, where operation-level and key-dependent trace structures can be more conveniently examined and compared.
2.4. Skewness Statistic and Moving Skewness
Skewness is a classical statistic that measures the asymmetry of a random variable’s probability distribution. It is defined as the third standardized central moment [
21,
22]:
where
X is the random variable,
is its mean, and
is the standard deviation. The sign of
indicates the direction of asymmetry, while its magnitude reflects its strength.
In the side-channel analysis library eShard’s scared framework [
20], a moving-skewness preprocessing method based on skewness is implemented. The corresponding algorithm is shown in Algorithm 1. Here,
and
denote the mean and standard deviation computed locally within each window, rather than over the entire trace. However, the application scenarios of this method and its advantages compared with other preprocessing techniques have not yet been discussed.
To ensure numerical stability, the skewness value is set to zero when the standard deviation within a window falls below a predefined threshold. This prevents the amplification of random fluctuations caused by division by small variance values.
Table 1 compares the computational complexity of the proposed method with that of the baseline preprocessing methods. For a trace of length
N and a sliding window of size
w, the computational cost of moving skewness is
for each window, leading to an overall complexity of
. This is in the same asymptotic order as the moving-average method. In contrast, a conventional low-pass filter can usually be implemented with a complexity of
. Therefore, compared with low-pass filtering, the proposed method introduces a higher computational cost, while compared with moving average, it has a similar asymptotic complexity but a larger constant factor due to the calculation of higher-order statistics. Nevertheless, for practical window sizes, this additional overhead remains acceptable.
| Algorithm 1 Moving Skewness in [20] |
| Require: Power trace , window size w |
| Ensure: Skewness trace |
| 1: Initialize as a zero vector |
| 2: for to do |
| 3: |
| 4: |
| 5: |
| 6: if then |
| 7: |
| 8: else |
| 9: |
| 10: end if |
| 11: end for |
| 12: Return S | ▹ Return the skewness trace |
3. Moving-Skewness Preprocessing Method
In this section, we first analyze the limitations of common preprocessing methods and the motivation for introducing moving skewness. We then discuss the applicable scenarios and advantages of the moving-skewness method. Finally, we focus on the design principles and optimization criteria of key parameters, such as the moving-window length.
3.1. Motivation and Scenarios
Low-pass filtering and moving-average techniques are commonly used in SPA to reduce noise. However, their smoothing-based nature imposes inherent limitations in certain realistic scenarios. The following two scenarios illustrate conditions under which low-pass filtering and moving-average preprocessing can weaken leakage visibility and thereby hinder effective SPA attack.
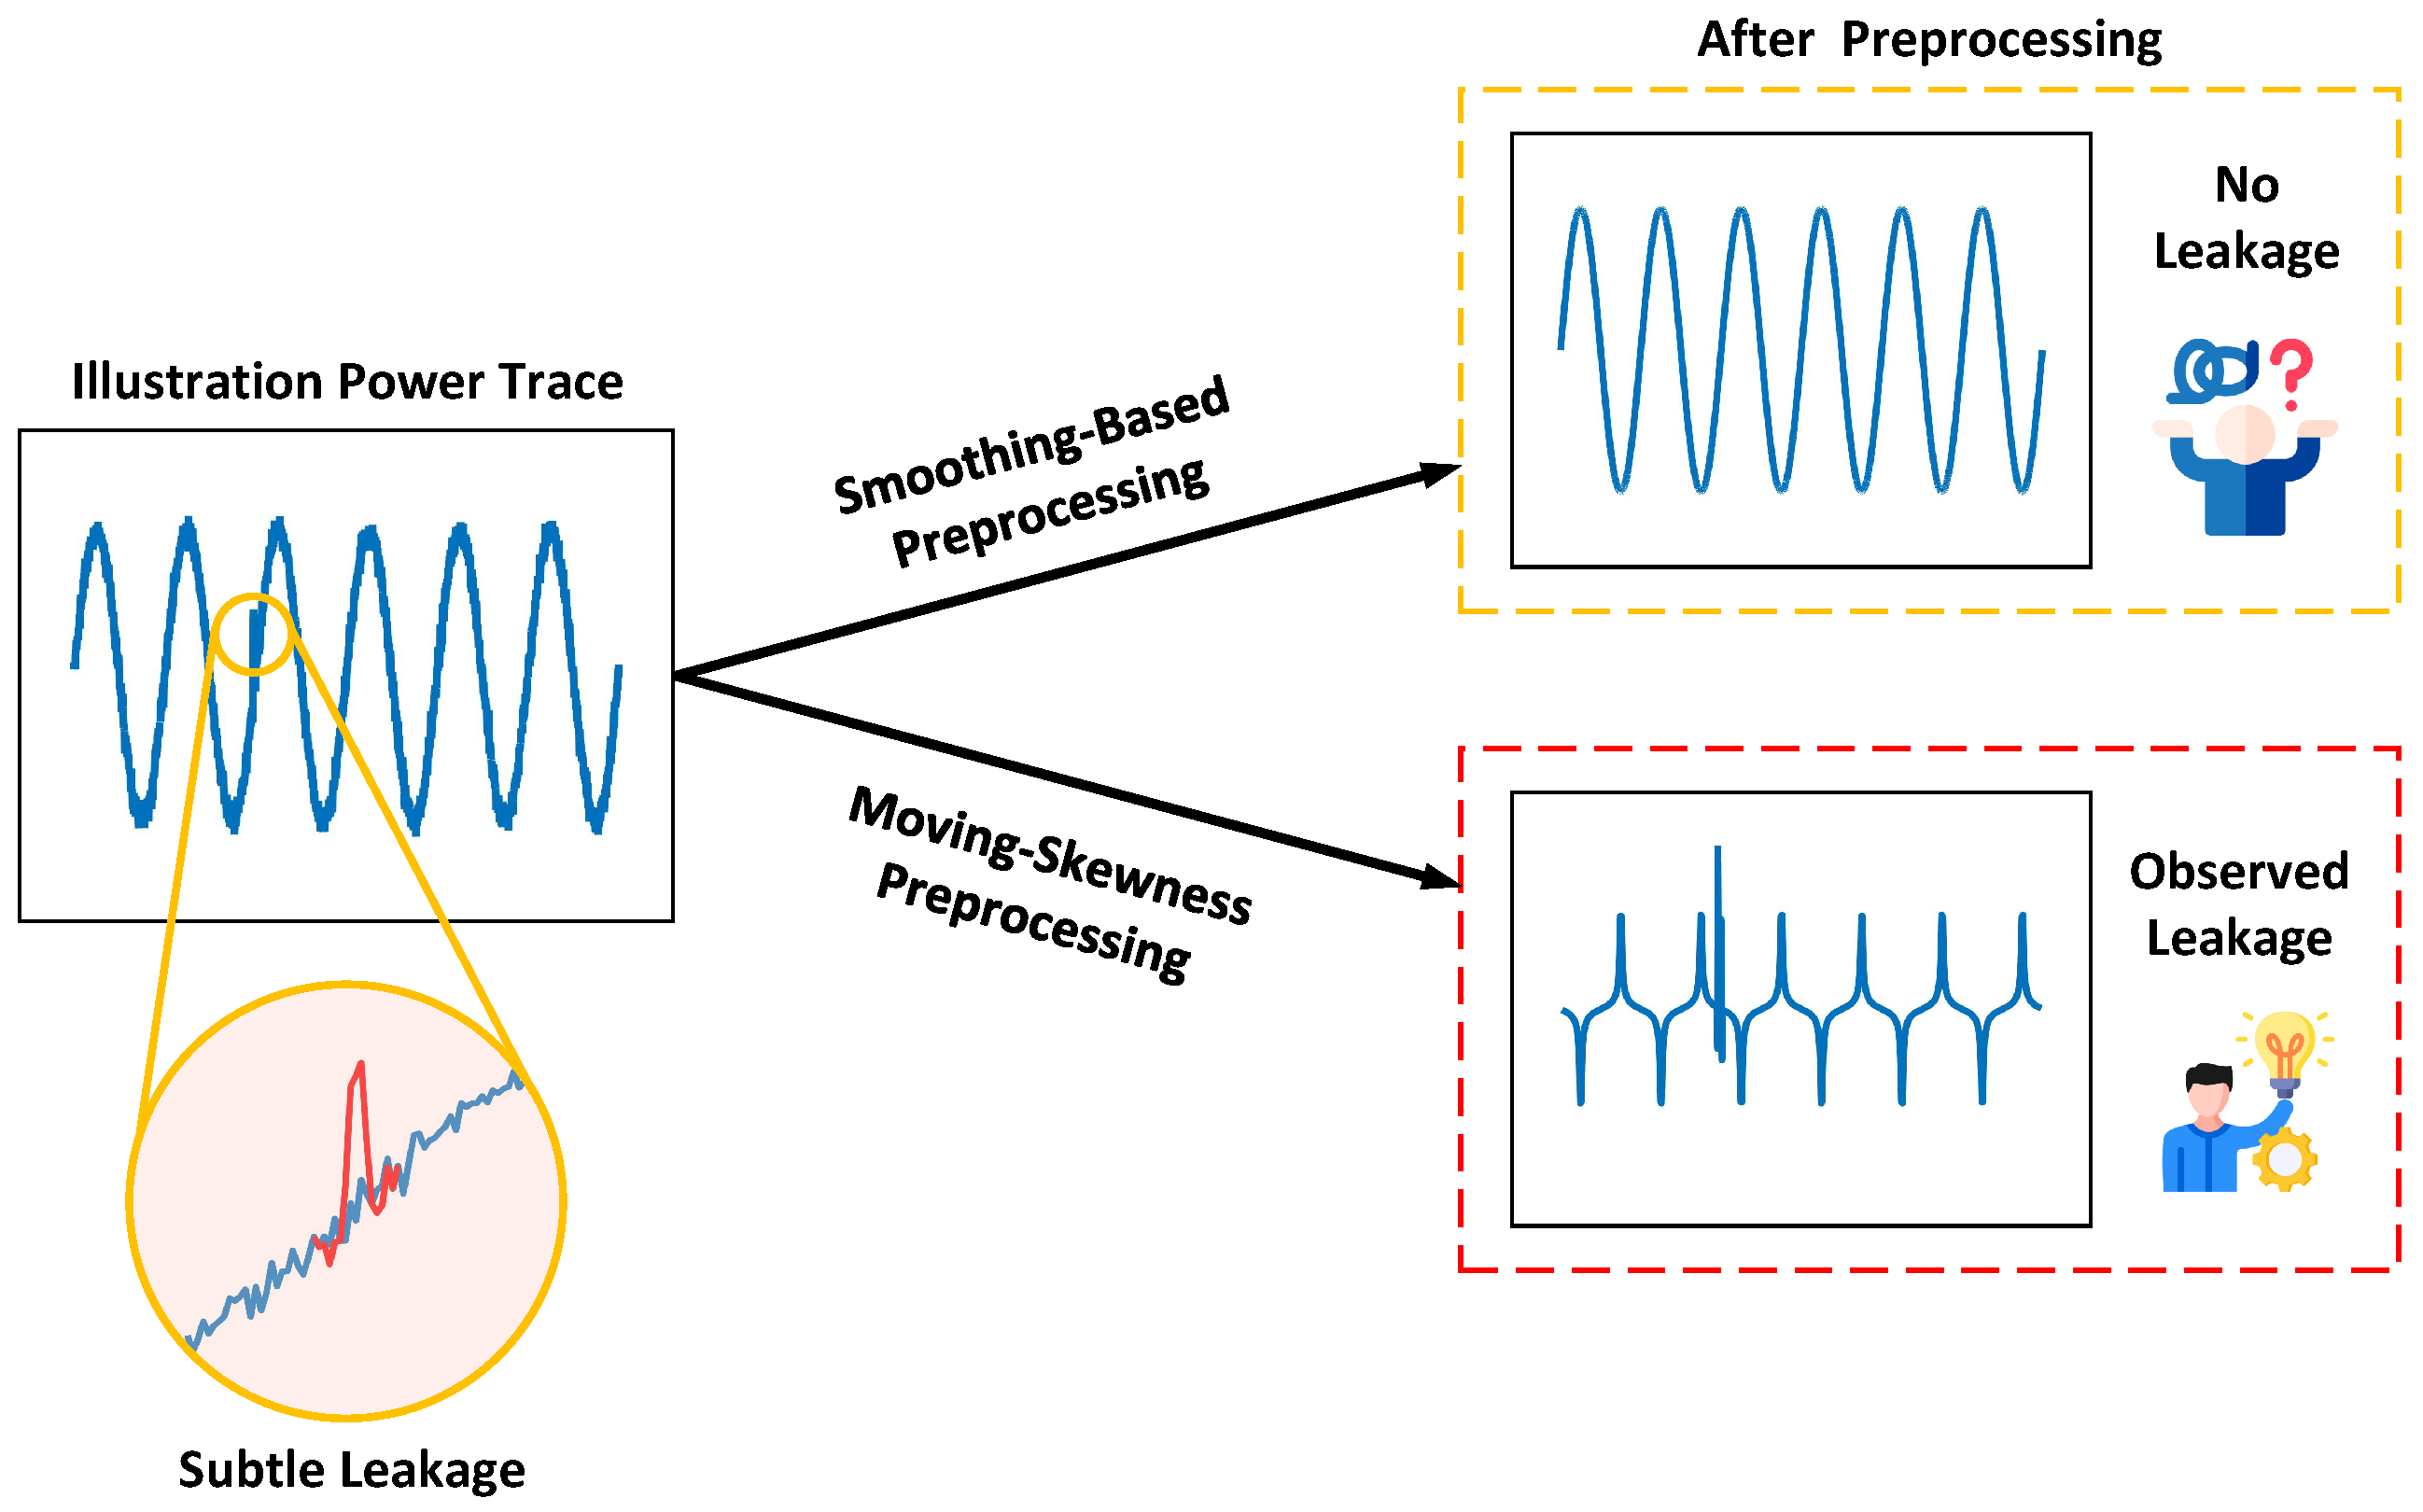
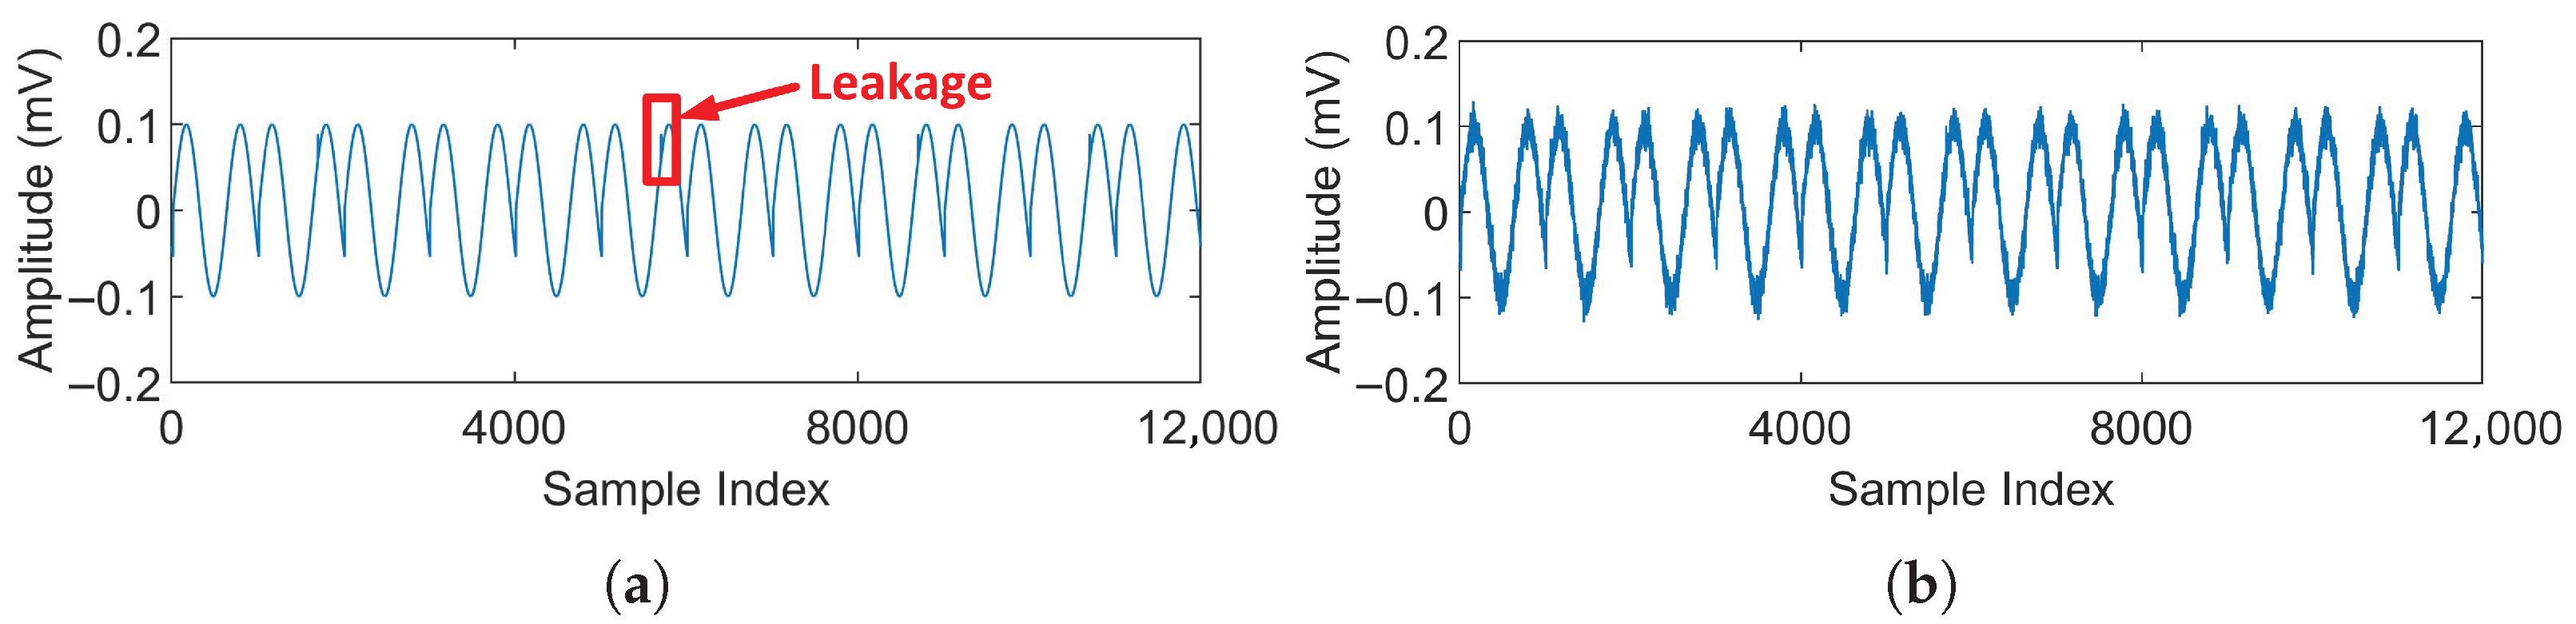
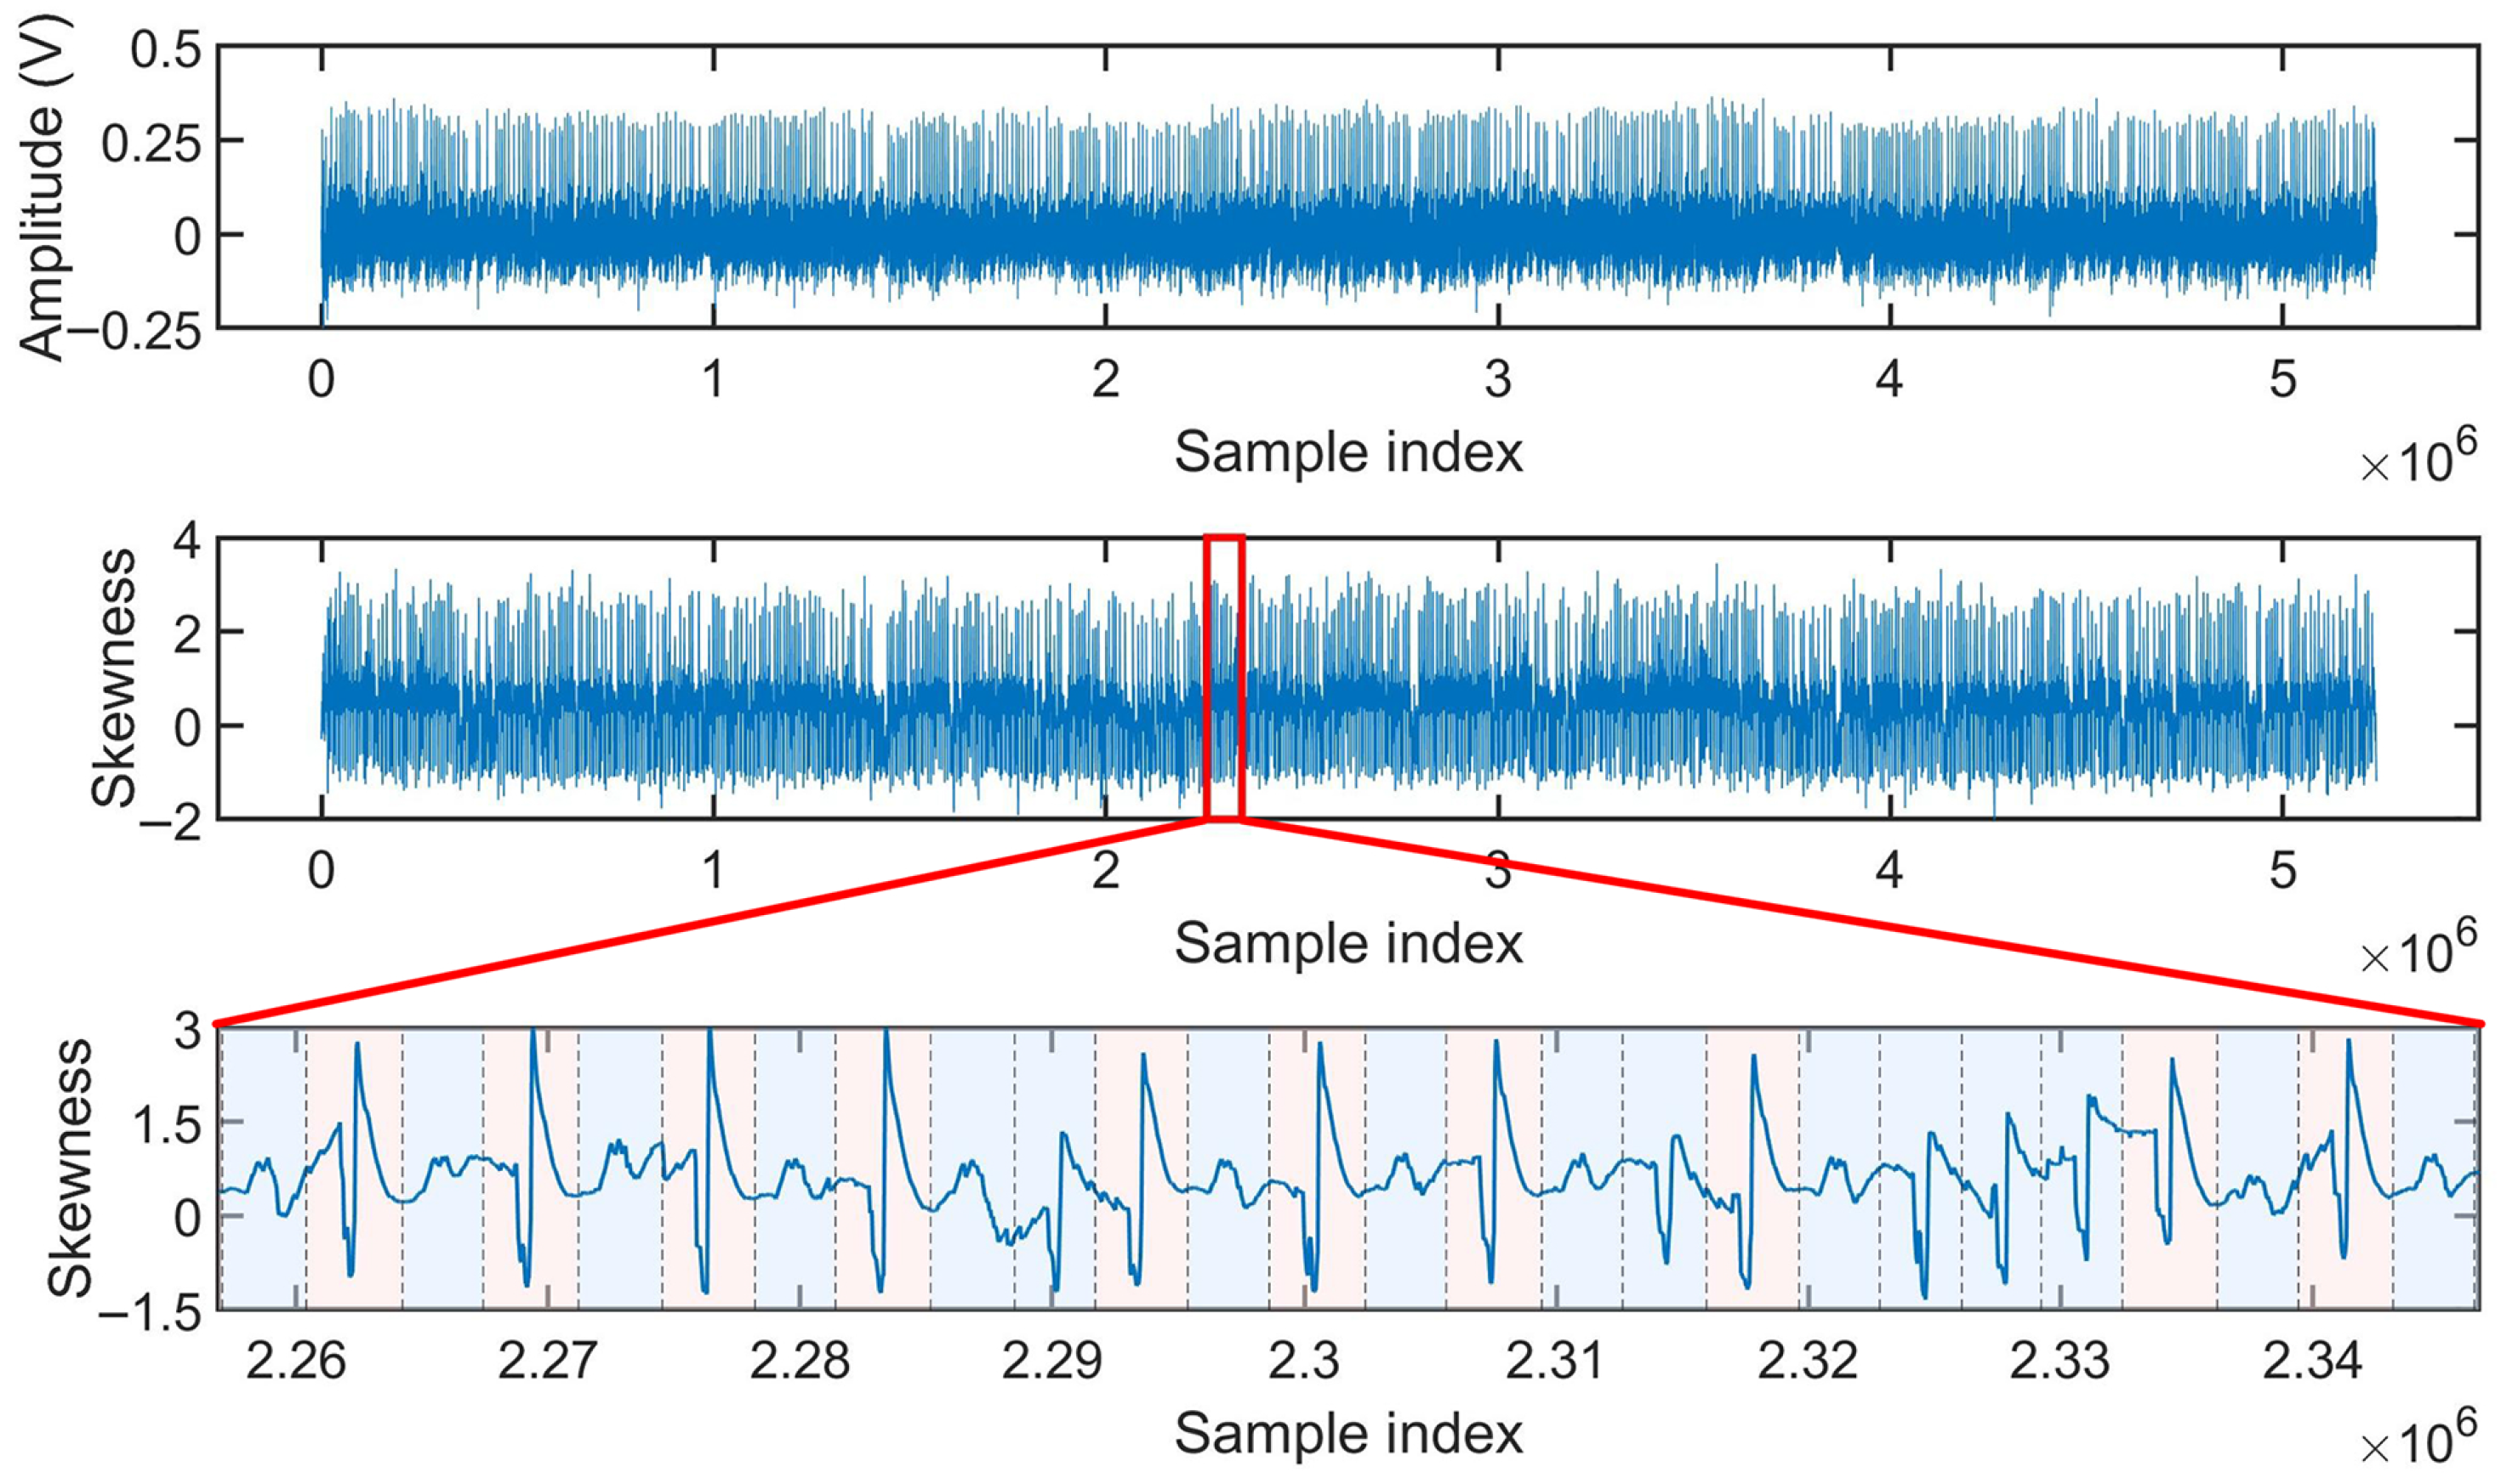
First, as illustrated in
Figure 1, leakage in some realistic scenarios is extremely weak and visually indistinguishable in the raw trace. For example, different cryptographic operations executed in an iterative manner on microchips may exhibit highly similar execution patterns, with only subtle differences in their side-channel leakage characteristics. Enhancing the perceptibility of such subtle leakage is therefore crucial for accurately identifying its location and duration, which is essential for subsequent analysis and attack design. However, when the leakage is weak, commonly used smoothing-based preprocessing techniques such as low-pass filtering and moving-average methods mainly serve as noise reduction tools and do not inherently amplify leakage-related features. Mechanistically, these methods are based on averaging neighboring samples, causing the contribution of a weak leakage point to be dominated by surrounding non-leaking samples. As a result, instead of becoming more discernible, subtle leakage may be further attenuated, making its temporal location and extent even harder to determine.
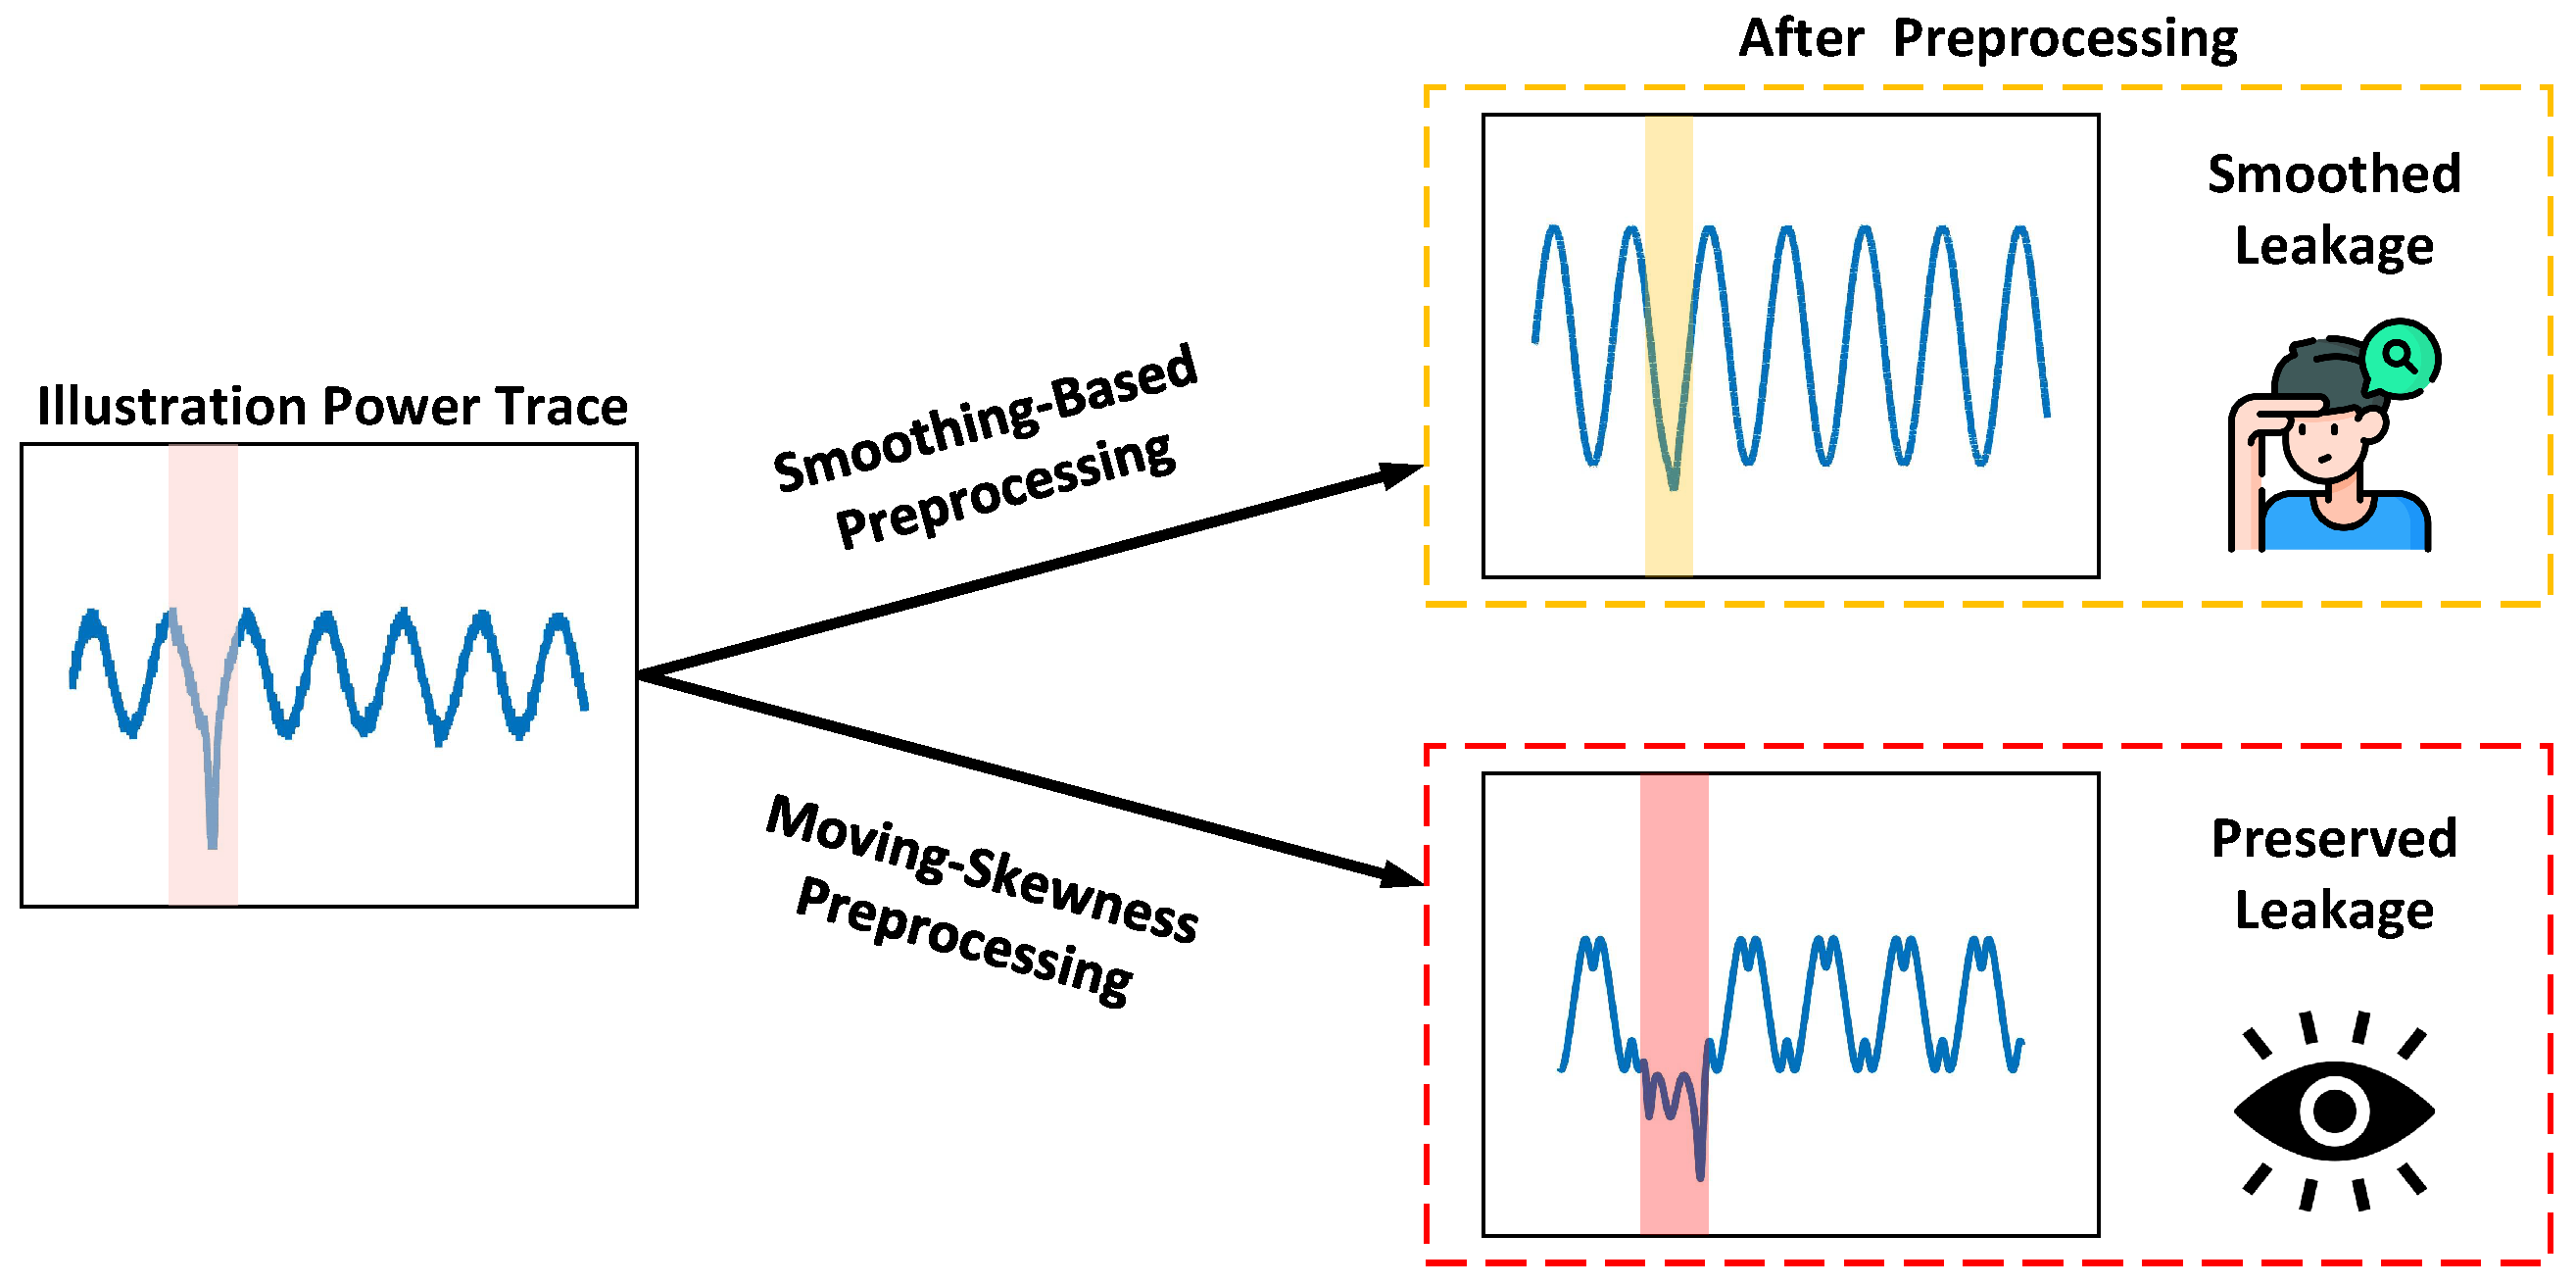
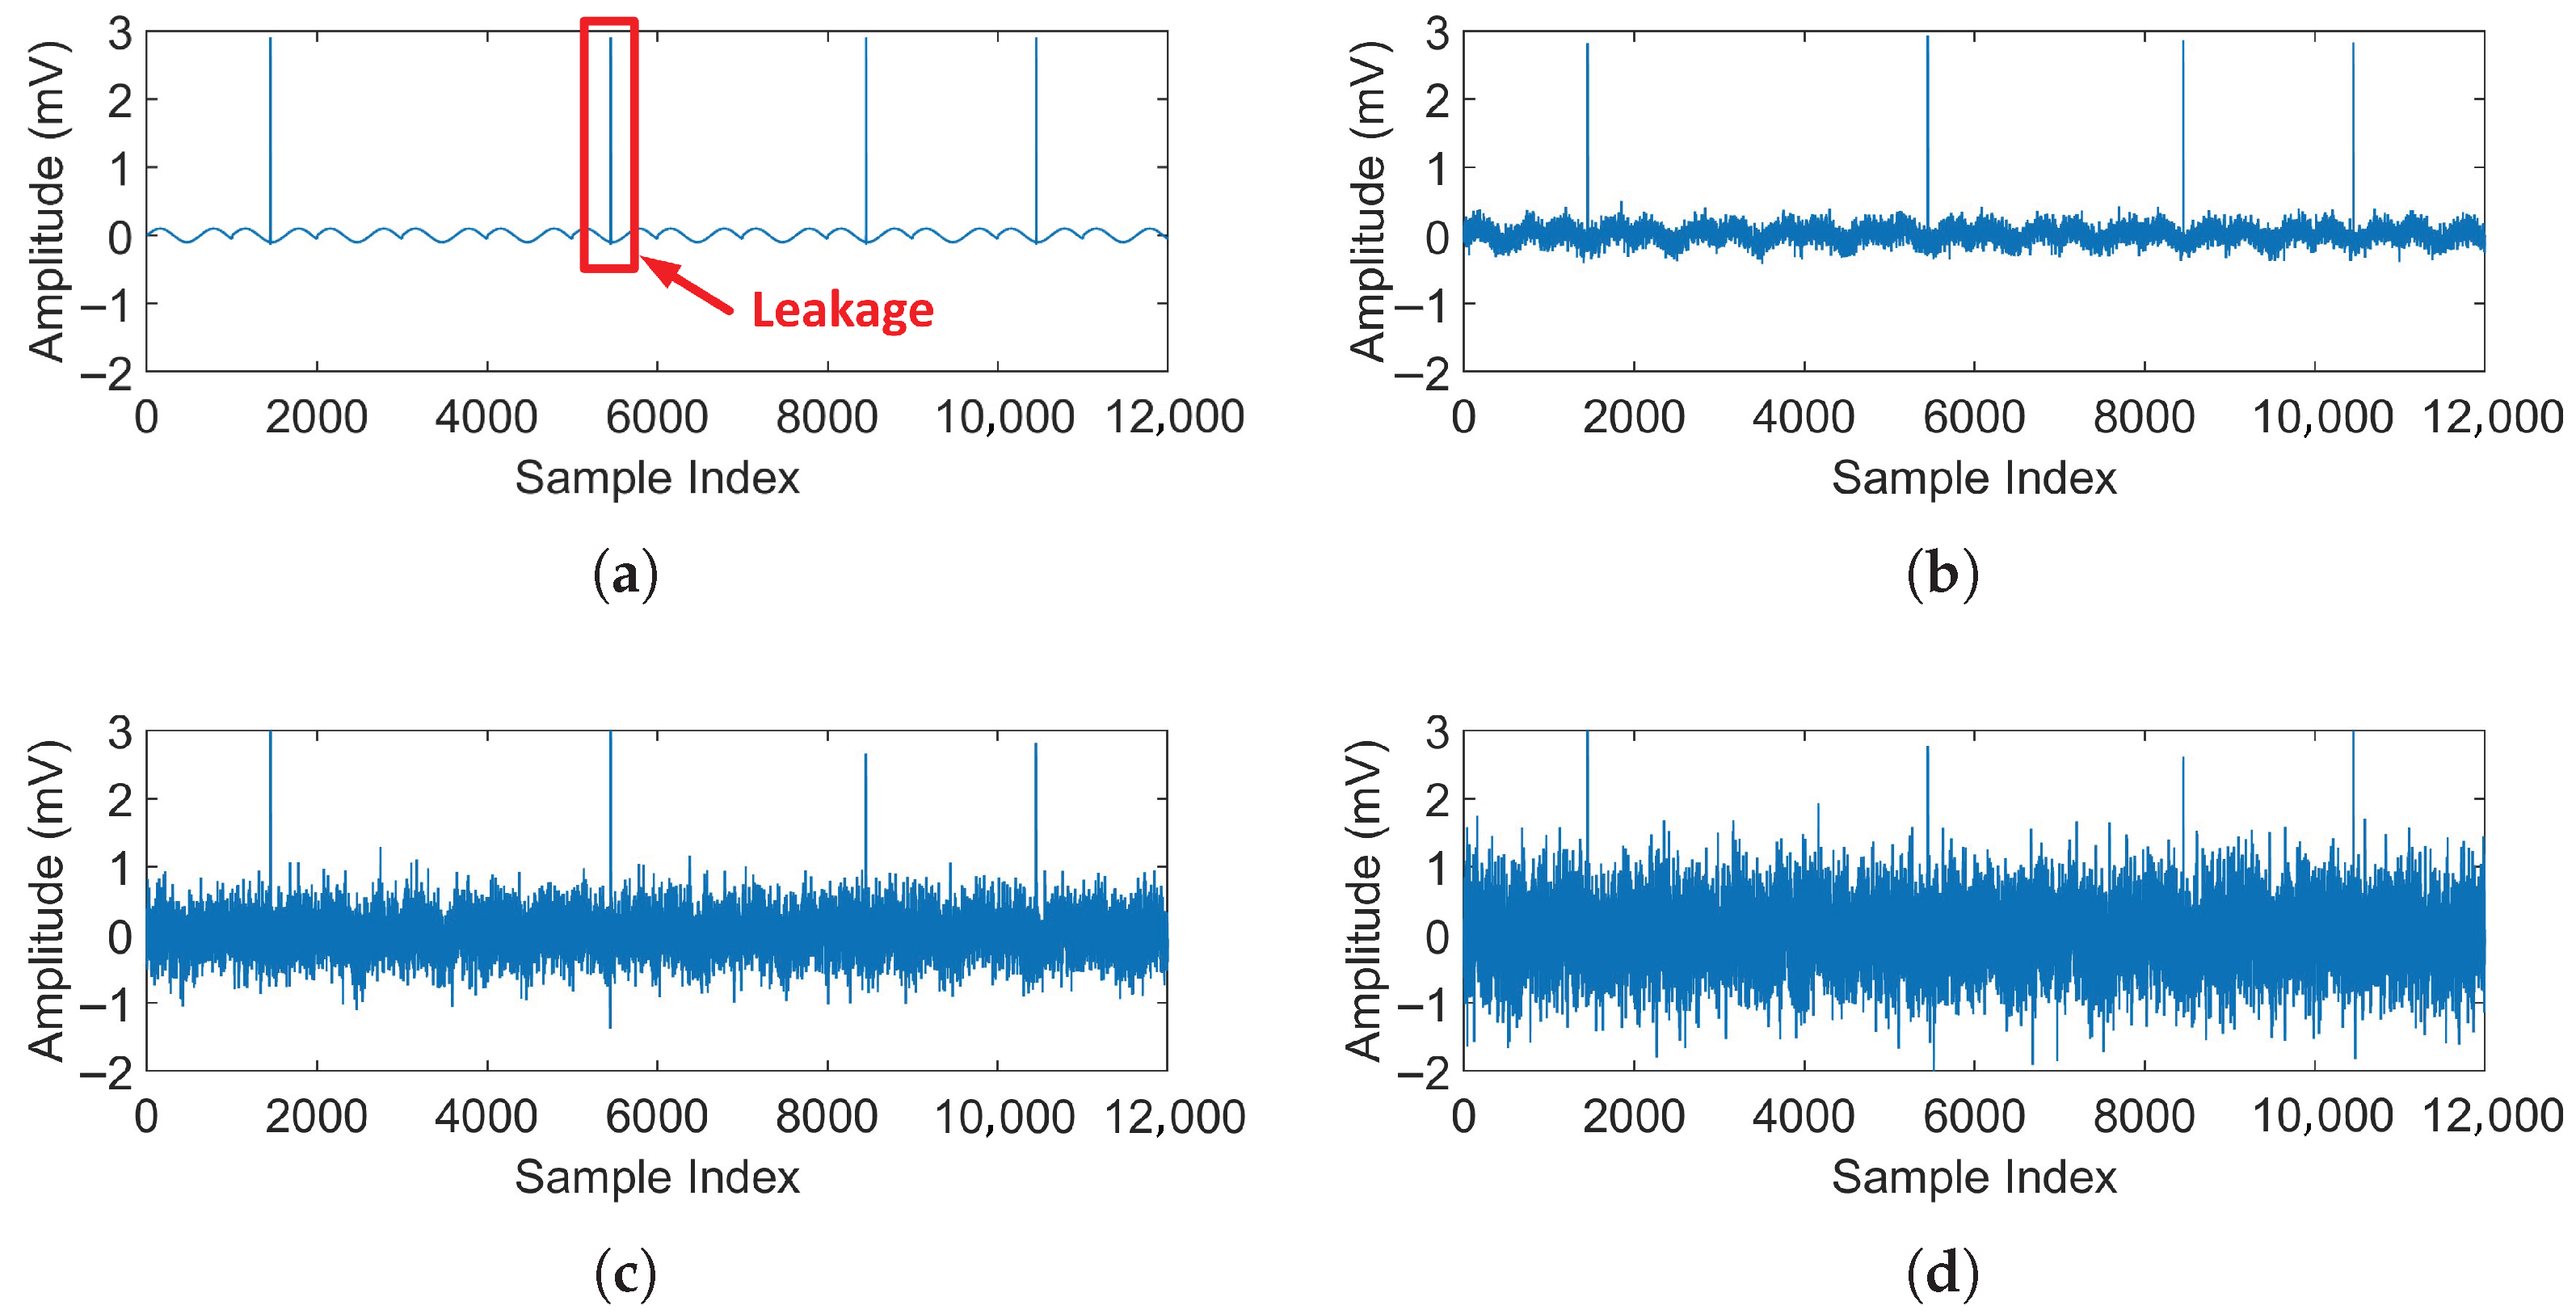
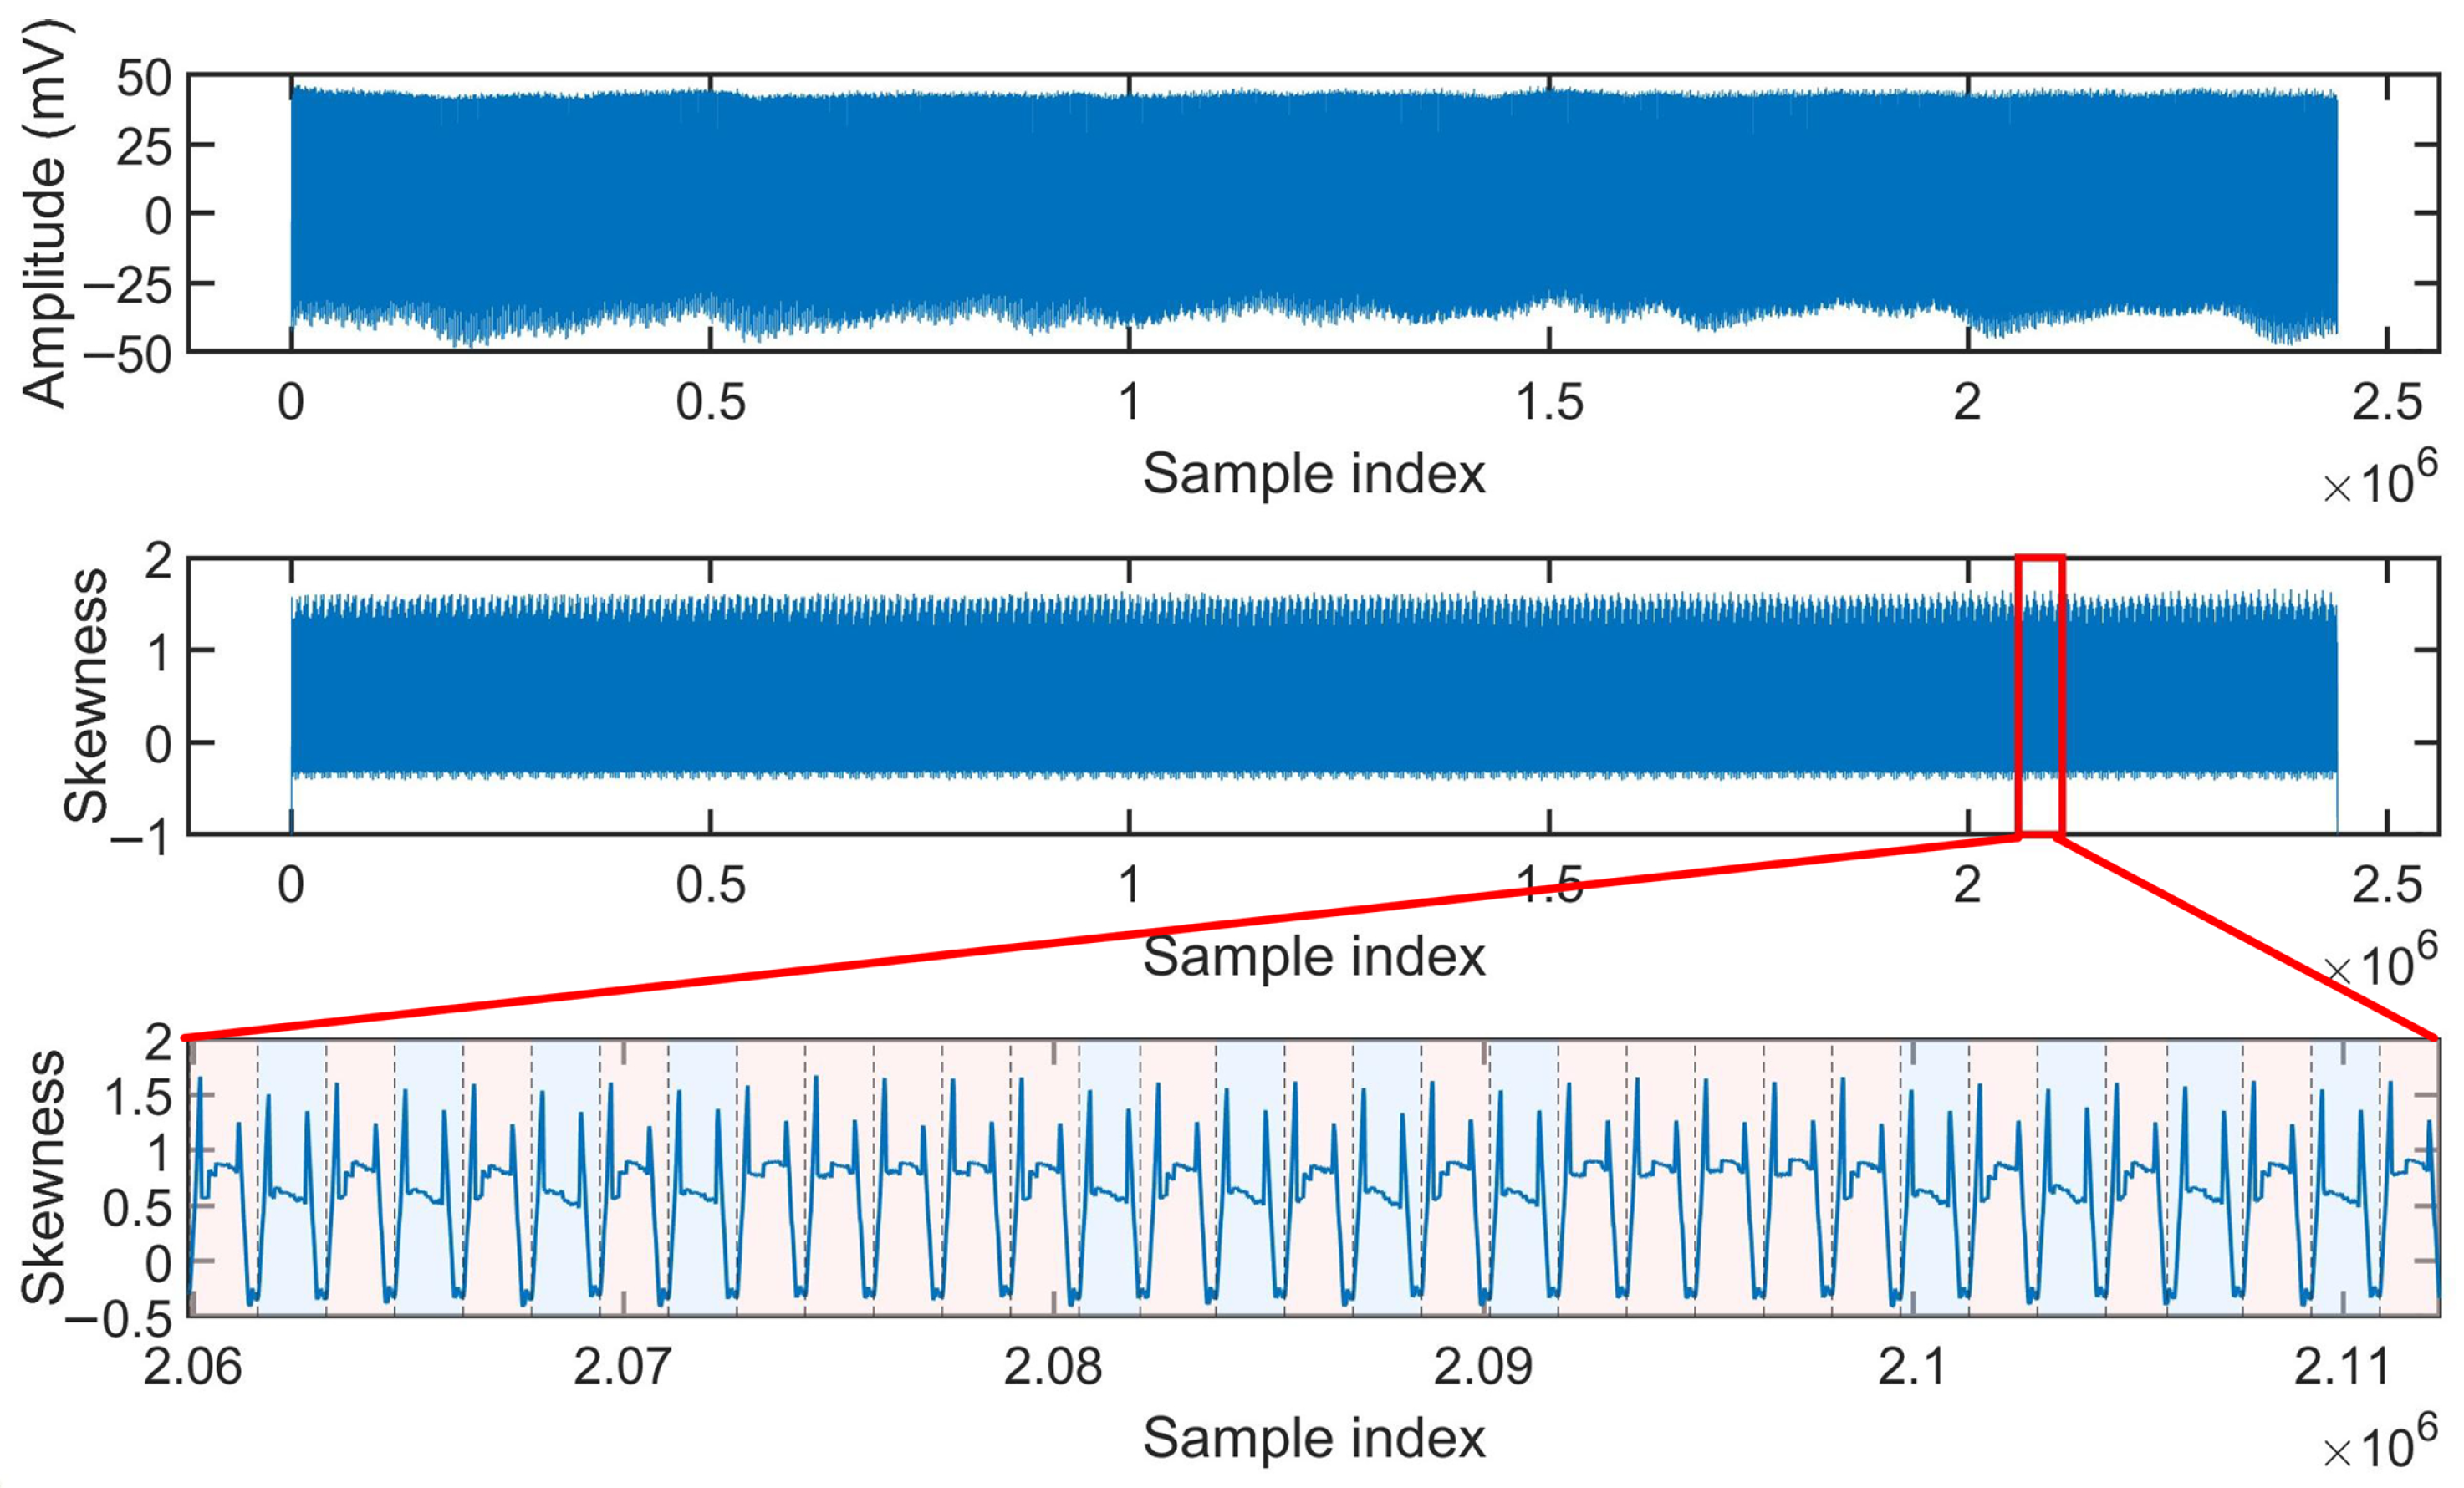
Second, when leakage manifests as abrupt amplitude variations, such as the spike-like transient events illustrated in
Figure 2, it essentially introduces higher-frequency components into the power trace due to its rapid transitions. Because of this characteristic, low-pass filtering and moving-average preprocessing methods tend to interpret such sharp transitions as noise and preferentially attenuate these high-frequency components. Consequently, the associated leakage features are weakened or even smoothed out during denoising, leading to a significant loss of exploitable information.
In contrast to the aforementioned limitations of common preprocessing techniques, the moving-skewness method offers unique advantages in the context of SPA and provides a principled and effective solution.
From a theoretical perspective, moving skewness explicitly treats skewness as the primary quantity of interest. In statistics, skewness is a measure of distribution shapes that captures information beyond first- and second-order statistics. While the mean and variance primarily characterize the central tendency and dispersion of a signal, skewness is sensitive to deviations from symmetry, particularly in the presence of tail behavior and extreme values. This property makes skewness especially suitable for analyzing intrinsic asymmetries in power consumption traces introduced by key-dependent operations.
An important advantage of skewness is its sensitivity to differences occurring at a small number of sampling points. In the first leakage scenario, characterized by subtle leakage, information related to secret-dependent operations is often confined to localized regions or sparse samples within a trace. Through the third-order moment, skewness increases the influence of extreme values, allowing local deviations to have a stronger statistical impact. As a result, hidden subtle leakage can be significantly observed, improving its visibility and detectability in the trace.
This mechanism is also applicable to the second leakage scenario involving abrupt amplitude variations, such as spike-like transient events. These spikes may exhibit inherent asymmetry, or they may be locally symmetric but induce pronounced asymmetry relative to the surrounding trace due to their sudden temporal transitions. In both cases, skewness emphasizes the resulting distributional asymmetry within a local window. As a result, the associated leakage features are preserved and, in many situations, their representation in the statistical domain is further enhanced.
In practical measurement conditions where the noise level is moderate, the effect of noise on skewness tends to be limited in a statistical sense. Although sample skewness computed over small windows may exhibit variability due to noise, such variations are generally unsystematic and, therefore, do not consistently mask leakage-induced distributional characteristics. This property supports the applicability of moving skewness in realistic SPA scenarios. In summary, moving skewness leverages distributional asymmetry in power traces by emphasizing higher-order statistical characteristics, which can improve the separability of leakage-related features and enhance attack performance.
3.2. Moving-Window Parameter Design
The effectiveness of feature enhancement in the proposed algorithm largely depends on the parameter design of the moving-window mechanism. An overly large window may smooth out fine-grained features, while an excessively small one can introduce noise. Rather than relying on a single heuristic parameter choice, this work adopts a methodology guided by prior knowledge of leakage characteristics.
The main parameters include the window size w, which defines the range of data points considered for each skewness computation, and the stride s, which determines the displacement of the window at each step and, thus, the temporal resolution of the resulting skewness trace.
The selection of window size is not fixed but depends on the types of features to be enhanced. This paper proposes three guiding strategies:
Strategy I: Maximizing Symmetry Differences Between Operations
Objective: To increase the difference in internal symmetry between two distinct cryptographic operations. This strategy is applicable in scenarios where the trace of one operation exhibits a relatively symmetric shape, while another operation shows a visibly asymmetric pattern due to differences in physical implementation. The aim is to emphasize the unique asymmetric characteristics of the latter, thereby creating clear separation in the skewness trace.
Principle: The window size is set to half of the typical single-operation duration (). This configuration allows the window to focus precisely on a more informative portion of the operation. For asymmetric operations, the local asymmetry within this region can be captured more effectively, leading to skewness values with relatively larger magnitude. Consequently, the response gap between the different operation classes in the skewness trace is increased, supporting improved discrimination.
Parameter Selection: , where can be estimated from the trace or obtained from device documentation.
Strategy II: Amplifying the Effect of Spikes for Impulse-Type Leakage
Objective: To enhance the distinction between operations that exhibit impulsive spikes and those with relatively flat profiles. This strategy applies when the primary difference between operations is characterized by the presence or absence of a prominent, localized, high-power pulse. For example, one operation may produce a short-duration transient peak caused by abrupt switching activity, whereas another operation corresponds to a relatively flat trace.
Principle: The moving window size is set to the typical width of the target spike (), so that the window covers the entire spike pulse. For operations containing spikes, the data distribution within the window becomes strongly asymmetric due to the sharp temporal transitions, leading to skewness values with larger magnitude. In contrast, for flat operations, the windowed data remain approximately symmetric with low dispersion, resulting in small skewness values. Under this configuration, impulsive and flat trace segments correspond to distinguishable differences in skewness magnitude, supporting improved discrimination.
Parameter Selection: , where can be determined by measuring the typical spike width or estimated directly through visual inspection.
Strategy III: Enhancing Short-Time Transient Leakage Features
Objective: To enhance short-time transient leakage features that occur between different operations in the measured traces, and to reduce the risk of these features being masked by the dominant characteristics of the operations themselves.
Principle: When the duration of inter-operation differences, denoted as , is much shorter than the operation length , using a large window (e.g., ) causes the short-time features to be diluted by the long-duration operation segment. Selecting the window size that matches the leakage duration () allows more precise localization of the temporal region where transient features occur, helping to capture their asymmetry without excessive smoothing.
Parameter Selection: , where can be estimated through high-resolution magnified inspection or signal processing methods.
The stride s is typically set to 1, meaning that the window moves one sampling point at a time. This generates the highest-temporal-resolution skewness trace, ensuring that no subtle features are missed. If computational resources are limited, the stride can be moderately increased, although this comes at the cost of reduced output trace resolution.
Those window-selection strategies described above rely on prior knowledge of leakage characteristics. In scenarios where such information is unavailable, a possible approach is to adopt a hierarchical search scheme for parameter tuning. For instance, the window size w may be initially set to and subsequently refined through iterative subdivision of the search range. This procedure enables efficient exploration of the parameter space in the absence of leakage-related prior knowledge.
4. Experiments and Results
4.1. Experimental Setup and Datasets
The experiments employed both simulated and measured datasets for validation. For the simulated datasets, each operation produced a trace consisting of 1000 samples, among which only a few samples differed between operations. The datasets were generated according to side-channel leakage models, where representative spike-like leakage patterns were injected at critical stages of key-dependent operations. Additive Gaussian noise was then applied, with denoting the noise level.
In both Dataset-1 and Dataset-2, the simulated traces were constructed from repeated trace segments with an underlying periodic-like pattern. In Dataset-1, only three samples contained operation-dependent differences, and the corresponding leakage remained visually imperceptible in the raw trace. In Dataset-2, five samples differed between operations, resulting in more pronounced spike-like leakage.
The measured datasets consisted of five groups of side-channel traces independently collected by the author from cryptographic devices and development boards. They covered a range of cryptographic algorithms, hardware platforms, and protection strengths. For all datasets, the corresponding key values were known, allowing the attack success rates to be evaluated. These measured traces correspond to Dataset-3 through Dataset-7, with detailed information summarized in
Table 2.
In the experiments, all of the datasets used only one trace, and the traces were first preprocessed using the proposed method, followed by PCA to identify leakage-related features. Subsequently, k-means clustering was applied to classify operation patterns, and the ASR was evaluated with respect to the ground-truth key. All experiments were conducted on a laptop equipped with an Intel Ultra-7 CPU and 16 GB RAM.
4.2. Performance Advantages of Moving Skewness in Side-Channel Analysis
This subsection examines the effectiveness and practical benefits of the proposed moving-skewness preprocessing method for SPA. We first performed simulation-based experiments to compare moving skewness with commonly used smoothing preprocessing techniques. The observations were then verified using real measurement traces under a unified SPA evaluation framework.
4.2.1. Experiments on Simulated Datasets
As shown in
Figure 3, Dataset-1 was constructed using simulated traces under different noise levels with 12 operations. The leakage is already nearly imperceptible in the raw trace, and it becomes completely masked once noise is introduced, representing a challenging weak leakage scenario under noise conditions.
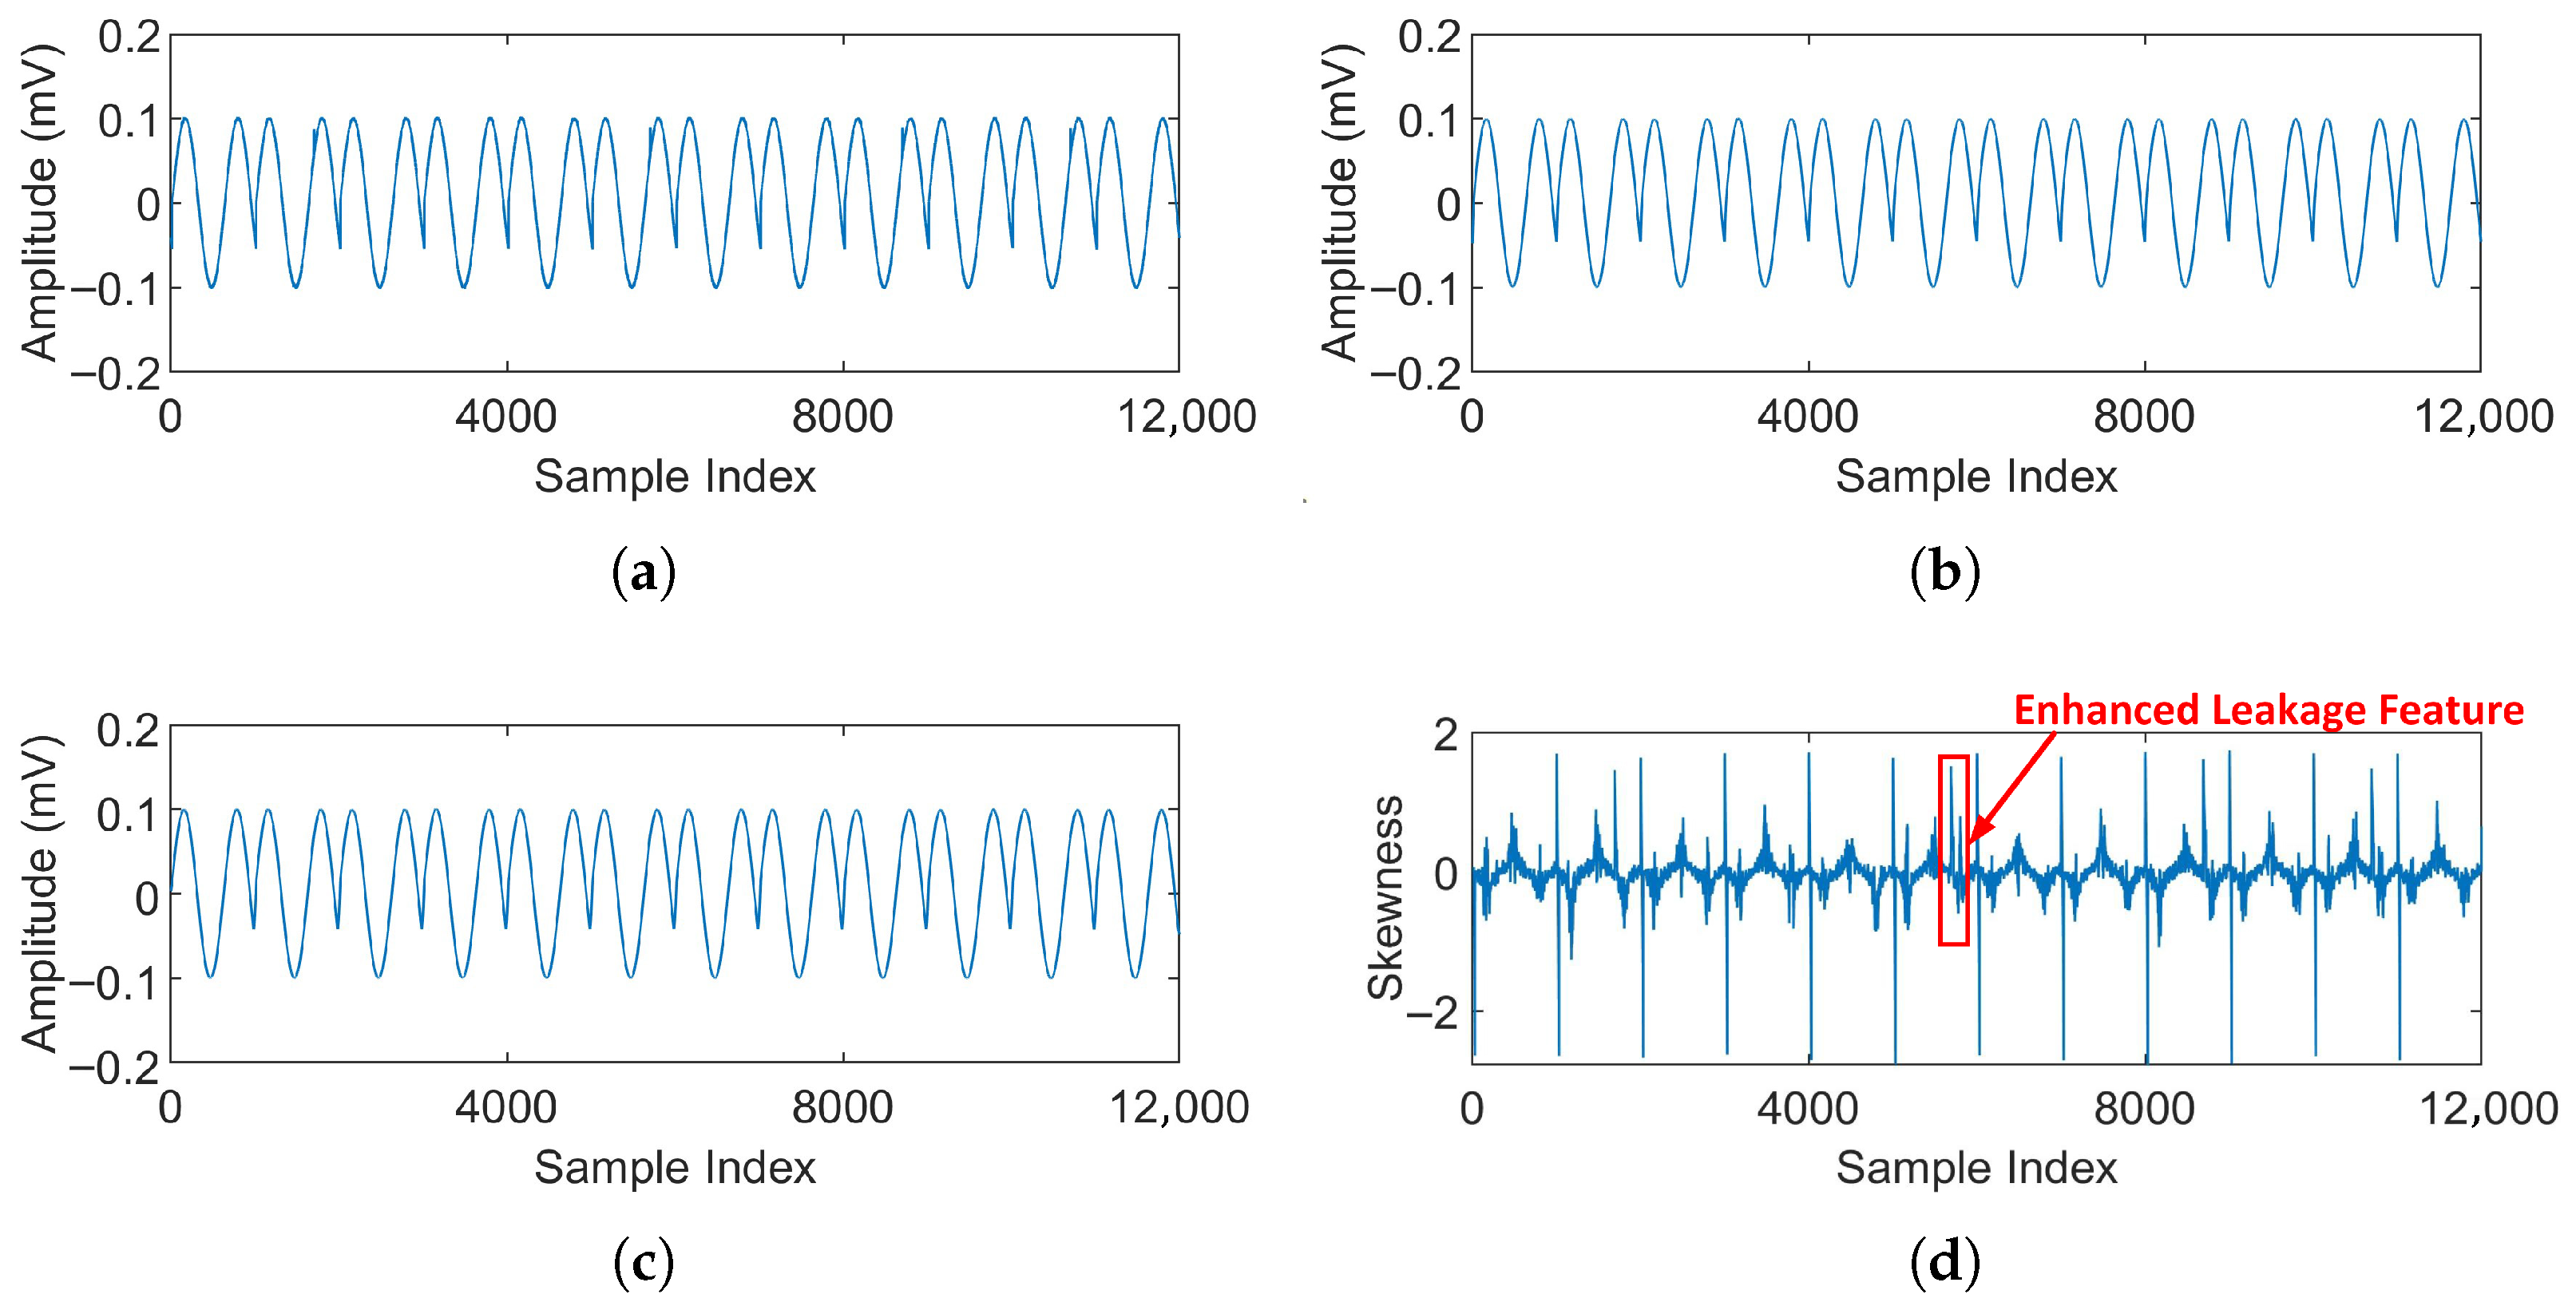
Specifically, we used the raw trace as a baseline for comparison, and we applied three preprocessing methods to the trace: low-pass filtering, moving average, and moving skewness. As shown in
Figure 4, traces processed using different preprocessing methods were compared. The window size was selected according to the window-selection strategies described above. Under identical conditions, the raw trace and those processed by low-pass filtering and moving average exhibit similar waveform shapes. While these methods suppress background noise to a certain extent, they do not reveal leakage-related features, which remain indistinguishable in the processed traces.
In contrast, moving skewness markedly enhances leakage-related characteristics by transforming visually imperceptible leakage into clearly observable features. In particular, four pronounced peaks corresponding to the leakages locations can be clearly identified in the skewness trace. This enhanced contrast improves feature separability and provides direct evidence of the effectiveness of the proposed approach.
After preprocessing, the traces were processed by PCA dimensionality reduction and clustering, and the attack success rate (ASR) was evaluated under different noise levels, with ASR defined as the percentage of successfully recovered operations over the total number of operations. To reduce randomness, the results were averaged over multiple noise seeds, enabling a reliable comparison of the effectiveness and robustness of different preprocessing methods.
To evaluate the robustness of the proposed moving-skewness preprocessing method under practical measurement conditions, we further conducted experiments across varying noise levels.
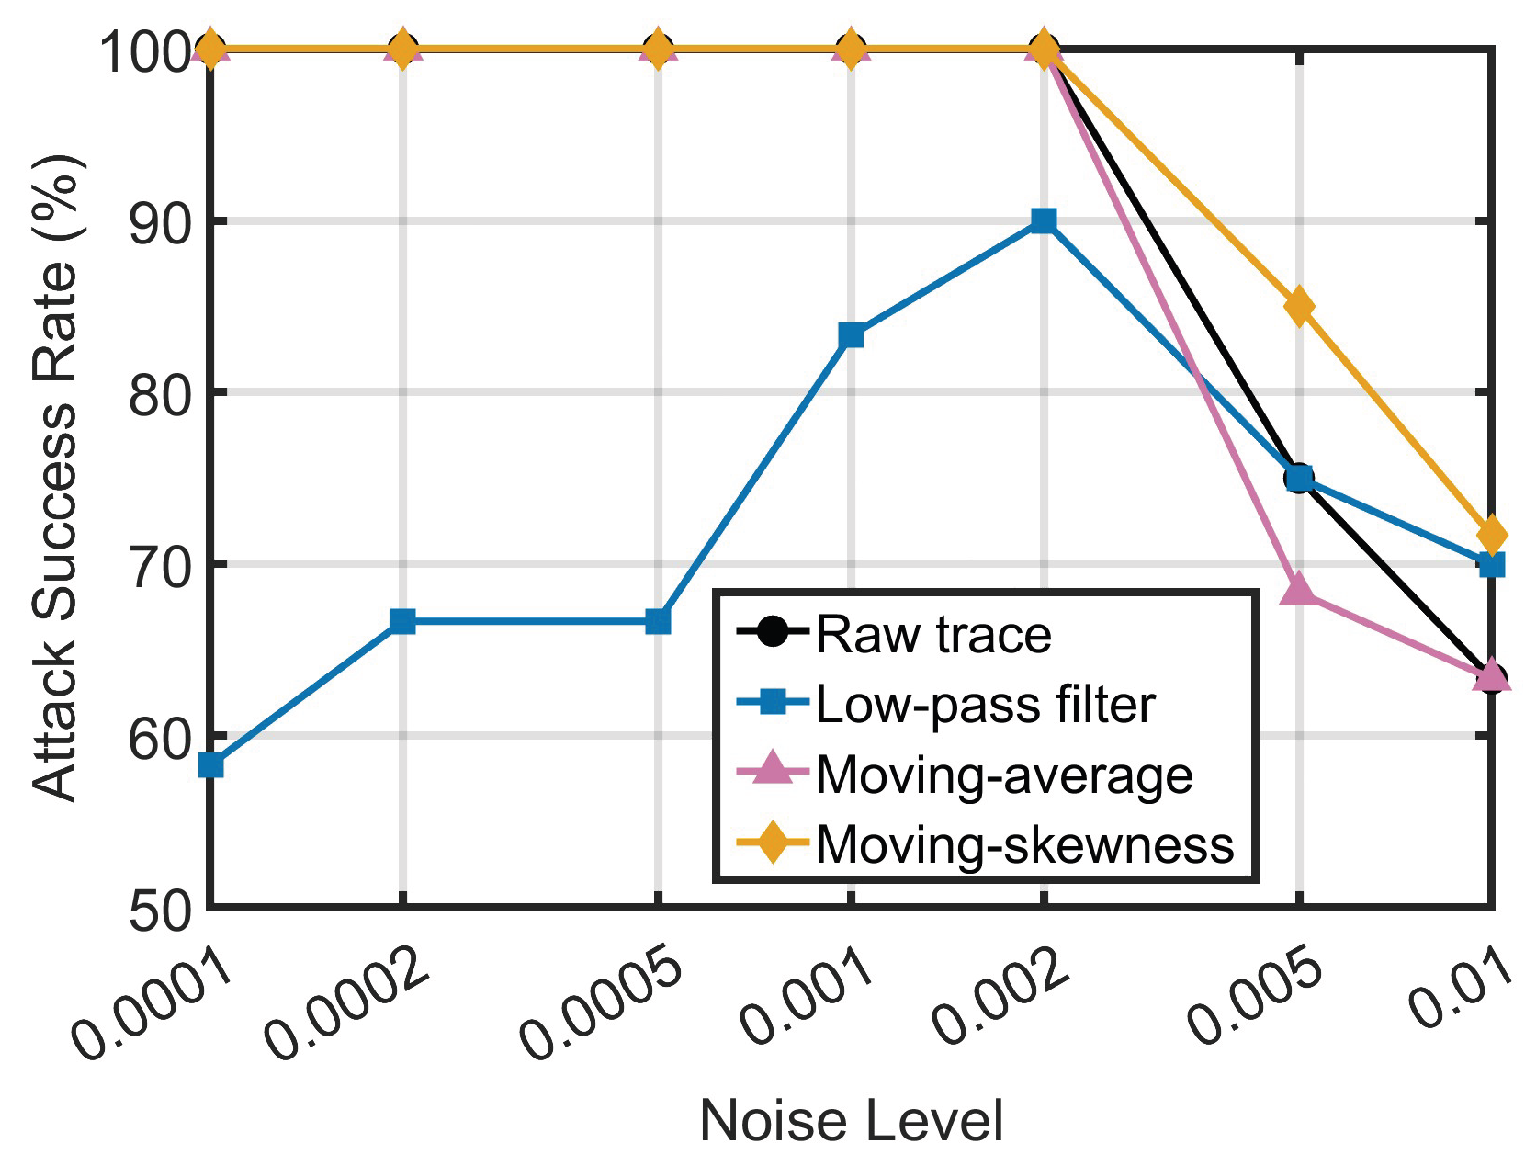
Figure 5 presents the average attack success rates of the raw trace and different preprocessing methods under varying noise levels. Moving skewness consistently achieves the highest ASR across all noise settings, indicating its effectiveness for SPA under weak leakage conditions. In contrast, low-pass filtering and moving-average exhibit lower success rates due to over-smoothing; in most cases, their performance is even inferior to that of the raw trace.
This observation aligns with the motivation discussed earlier: excessive smoothing does not enhance leakage-related information and may instead suppress discriminative features, resulting in degraded attack performance. While low-pass filtering and moving average primarily function as denoising techniques, moving skewness emphasizes feature enhancement, leading to a more effective improvement in attack success rate.
It is worth noting that, in this simulation setup, the leakage amplitude was intentionally set to be very small in order to highlight weak-leakage scenarios. Under such conditions, moving skewness does not reach a perfect 100% success rate.
As shown in
Figure 6, Dataset-2 was constructed by introducing spike-like leakage into a background trace with 12 operations. The simulated traces were generated under different noise levels, with higher noise intensities deliberately included to further challenge leakage detection. This dataset was designed to evaluate the robustness of the moving-skewness method across a wider noise range.
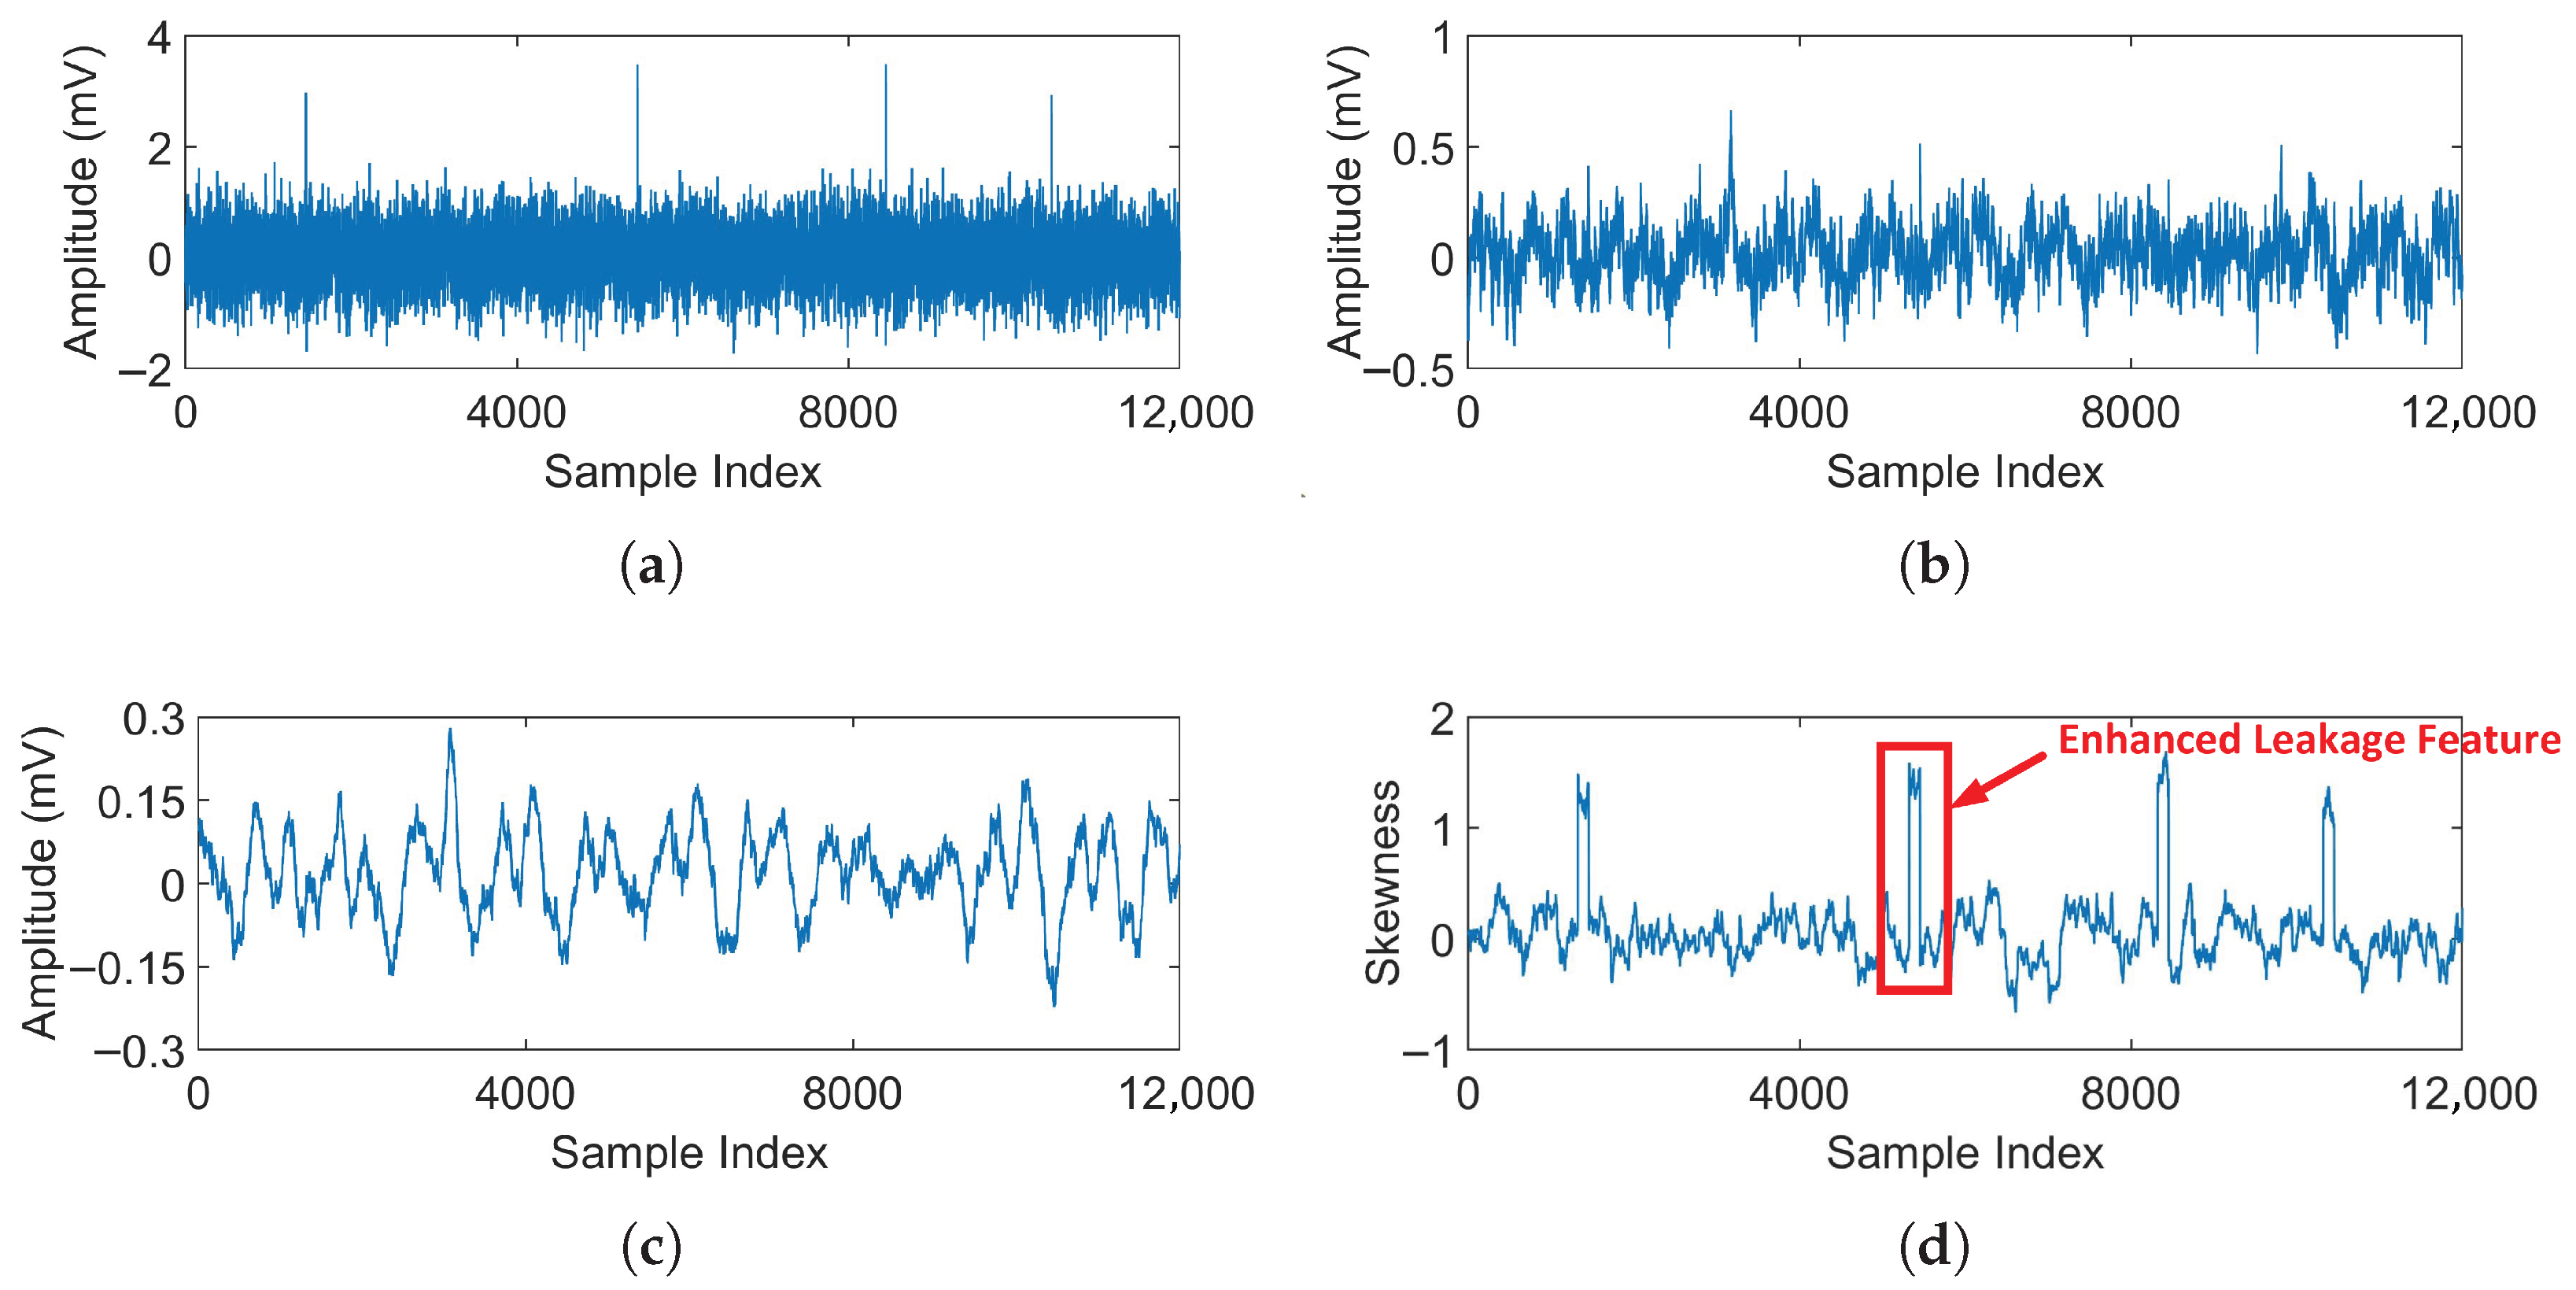
As shown in
Figure 7, the traces after different preprocessing methods were compared under high-noise conditions. Low-pass filtering and moving average effectively smooth the background noise; however, this smoothing attenuates originally observable leakage-related variations, causing the leakage to become visually indistinguishable in the trace.
In contrast, moving skewness preserves and even enhances leakage characteristics while also exhibiting a certain degree of noise suppression. As illustrated in the figure, four prominent peaks that are clearly distinguishable from the surrounding regions can be observed in the skewness trace. This behavior reflects the fundamental difference between denoising-oriented preprocessing and feature-enhancement-oriented preprocessing.
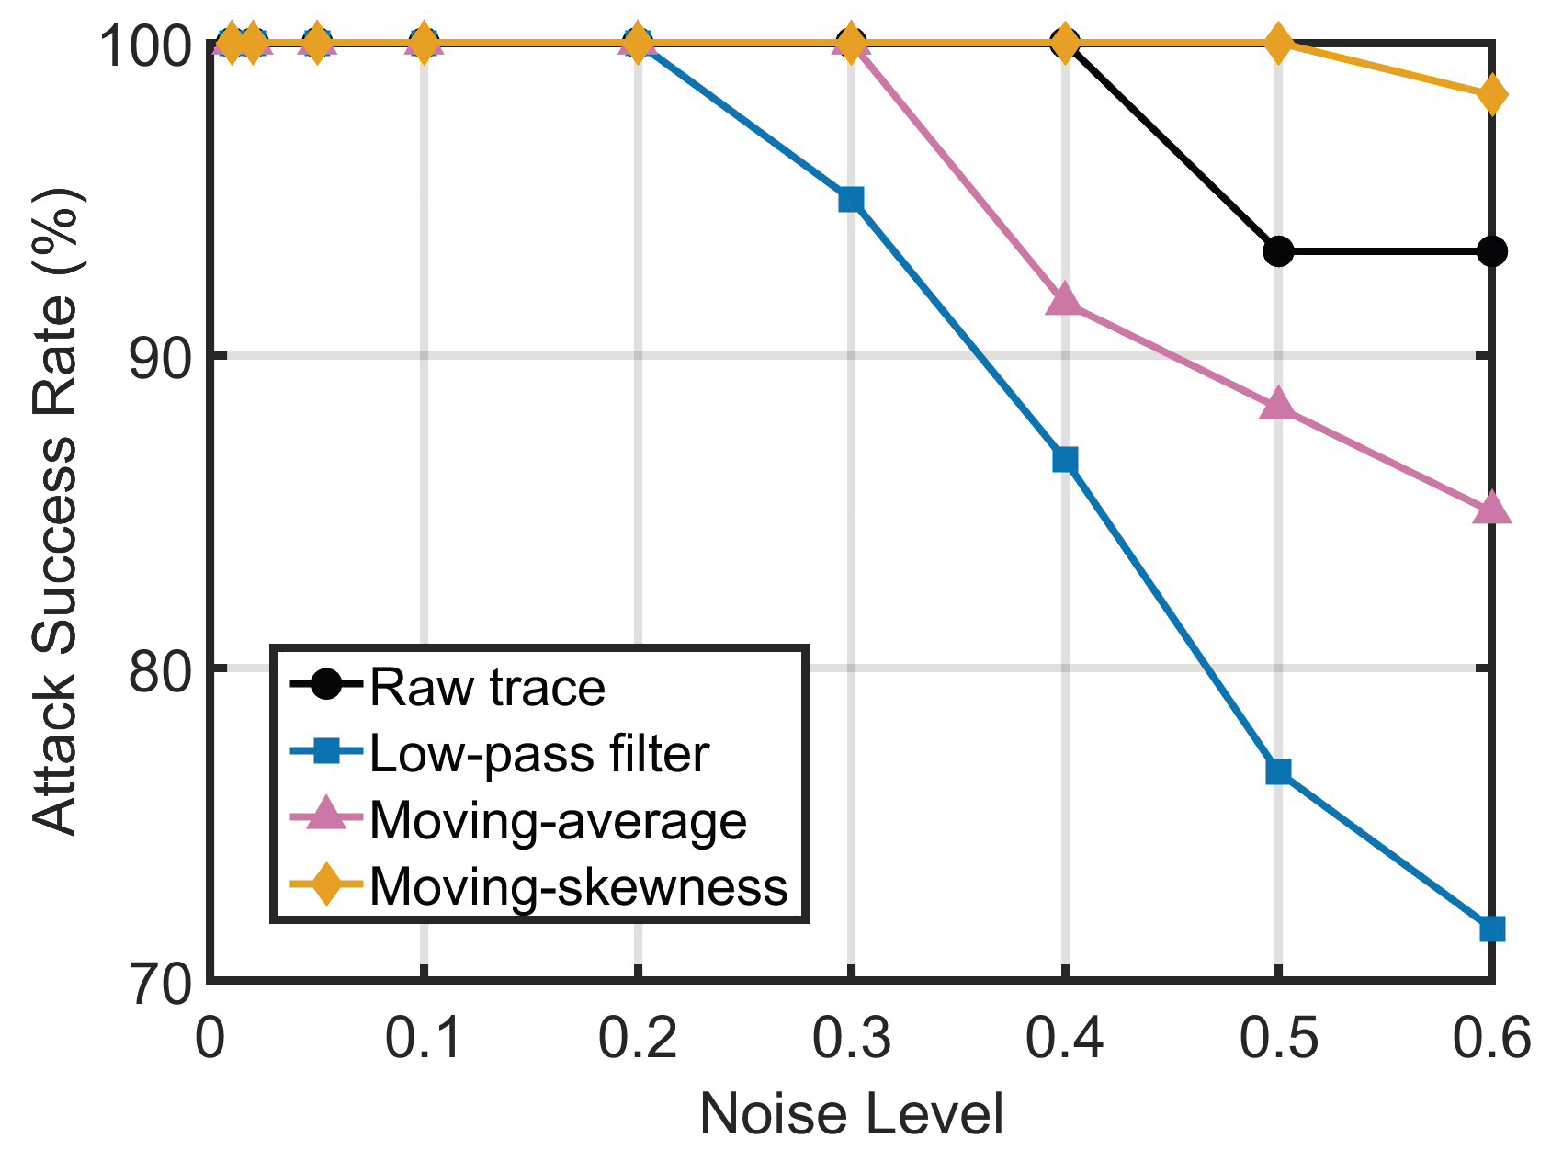
Figure 8 presents the average attack success rates of the raw trace and different preprocessing methods under varying noise levels. Moving skewness consistently achieves the highest attack success rate across all noise levels and maintains an ASR close to 100%, even under strong noise conditions.
In contrast, the ASRs of low-pass filtering and moving average are lower than that of the raw trace, suggesting that excessive smoothing degrades leakage information rather than enhancing it. These results demonstrate that moving skewness improves attack performance and demonstrates robustness in noisy environments.
4.2.2. Experiments on Real Measurement Traces
To further verify these observations, we next evaluate the preprocessing methods using real measurement traces.
Figure 9,
Figure 10,
Figure 11,
Figure 12 and
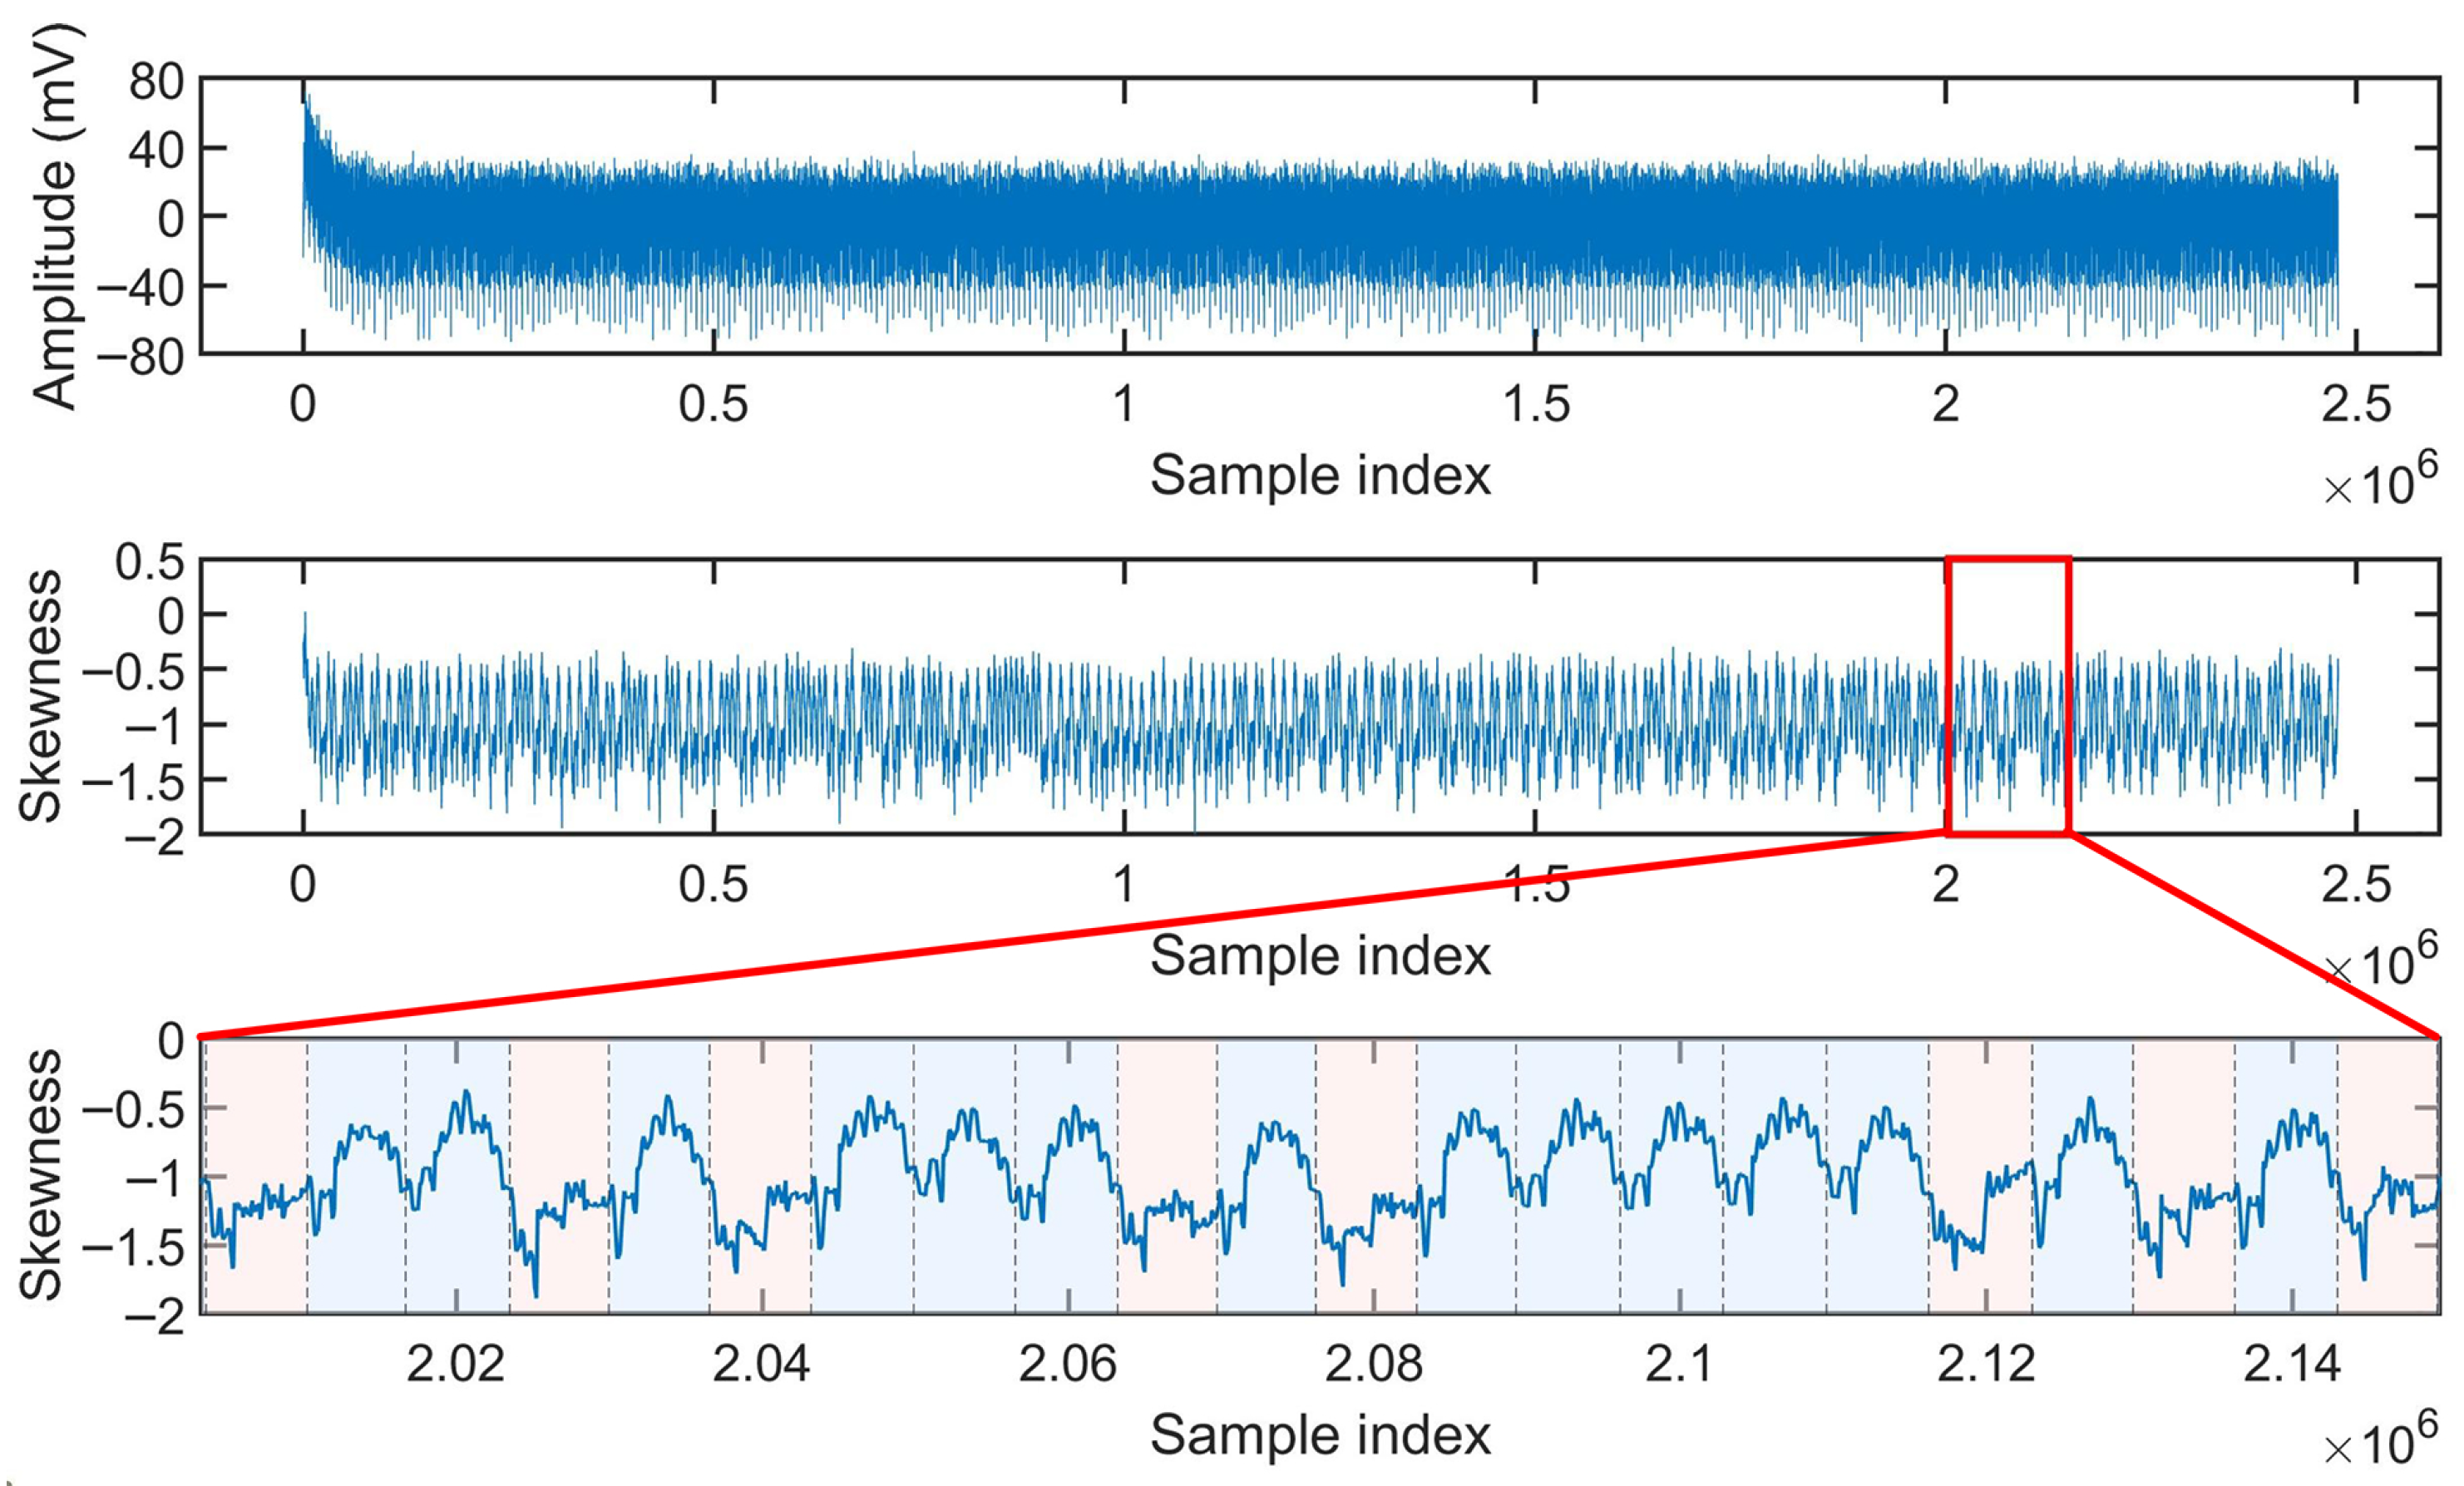
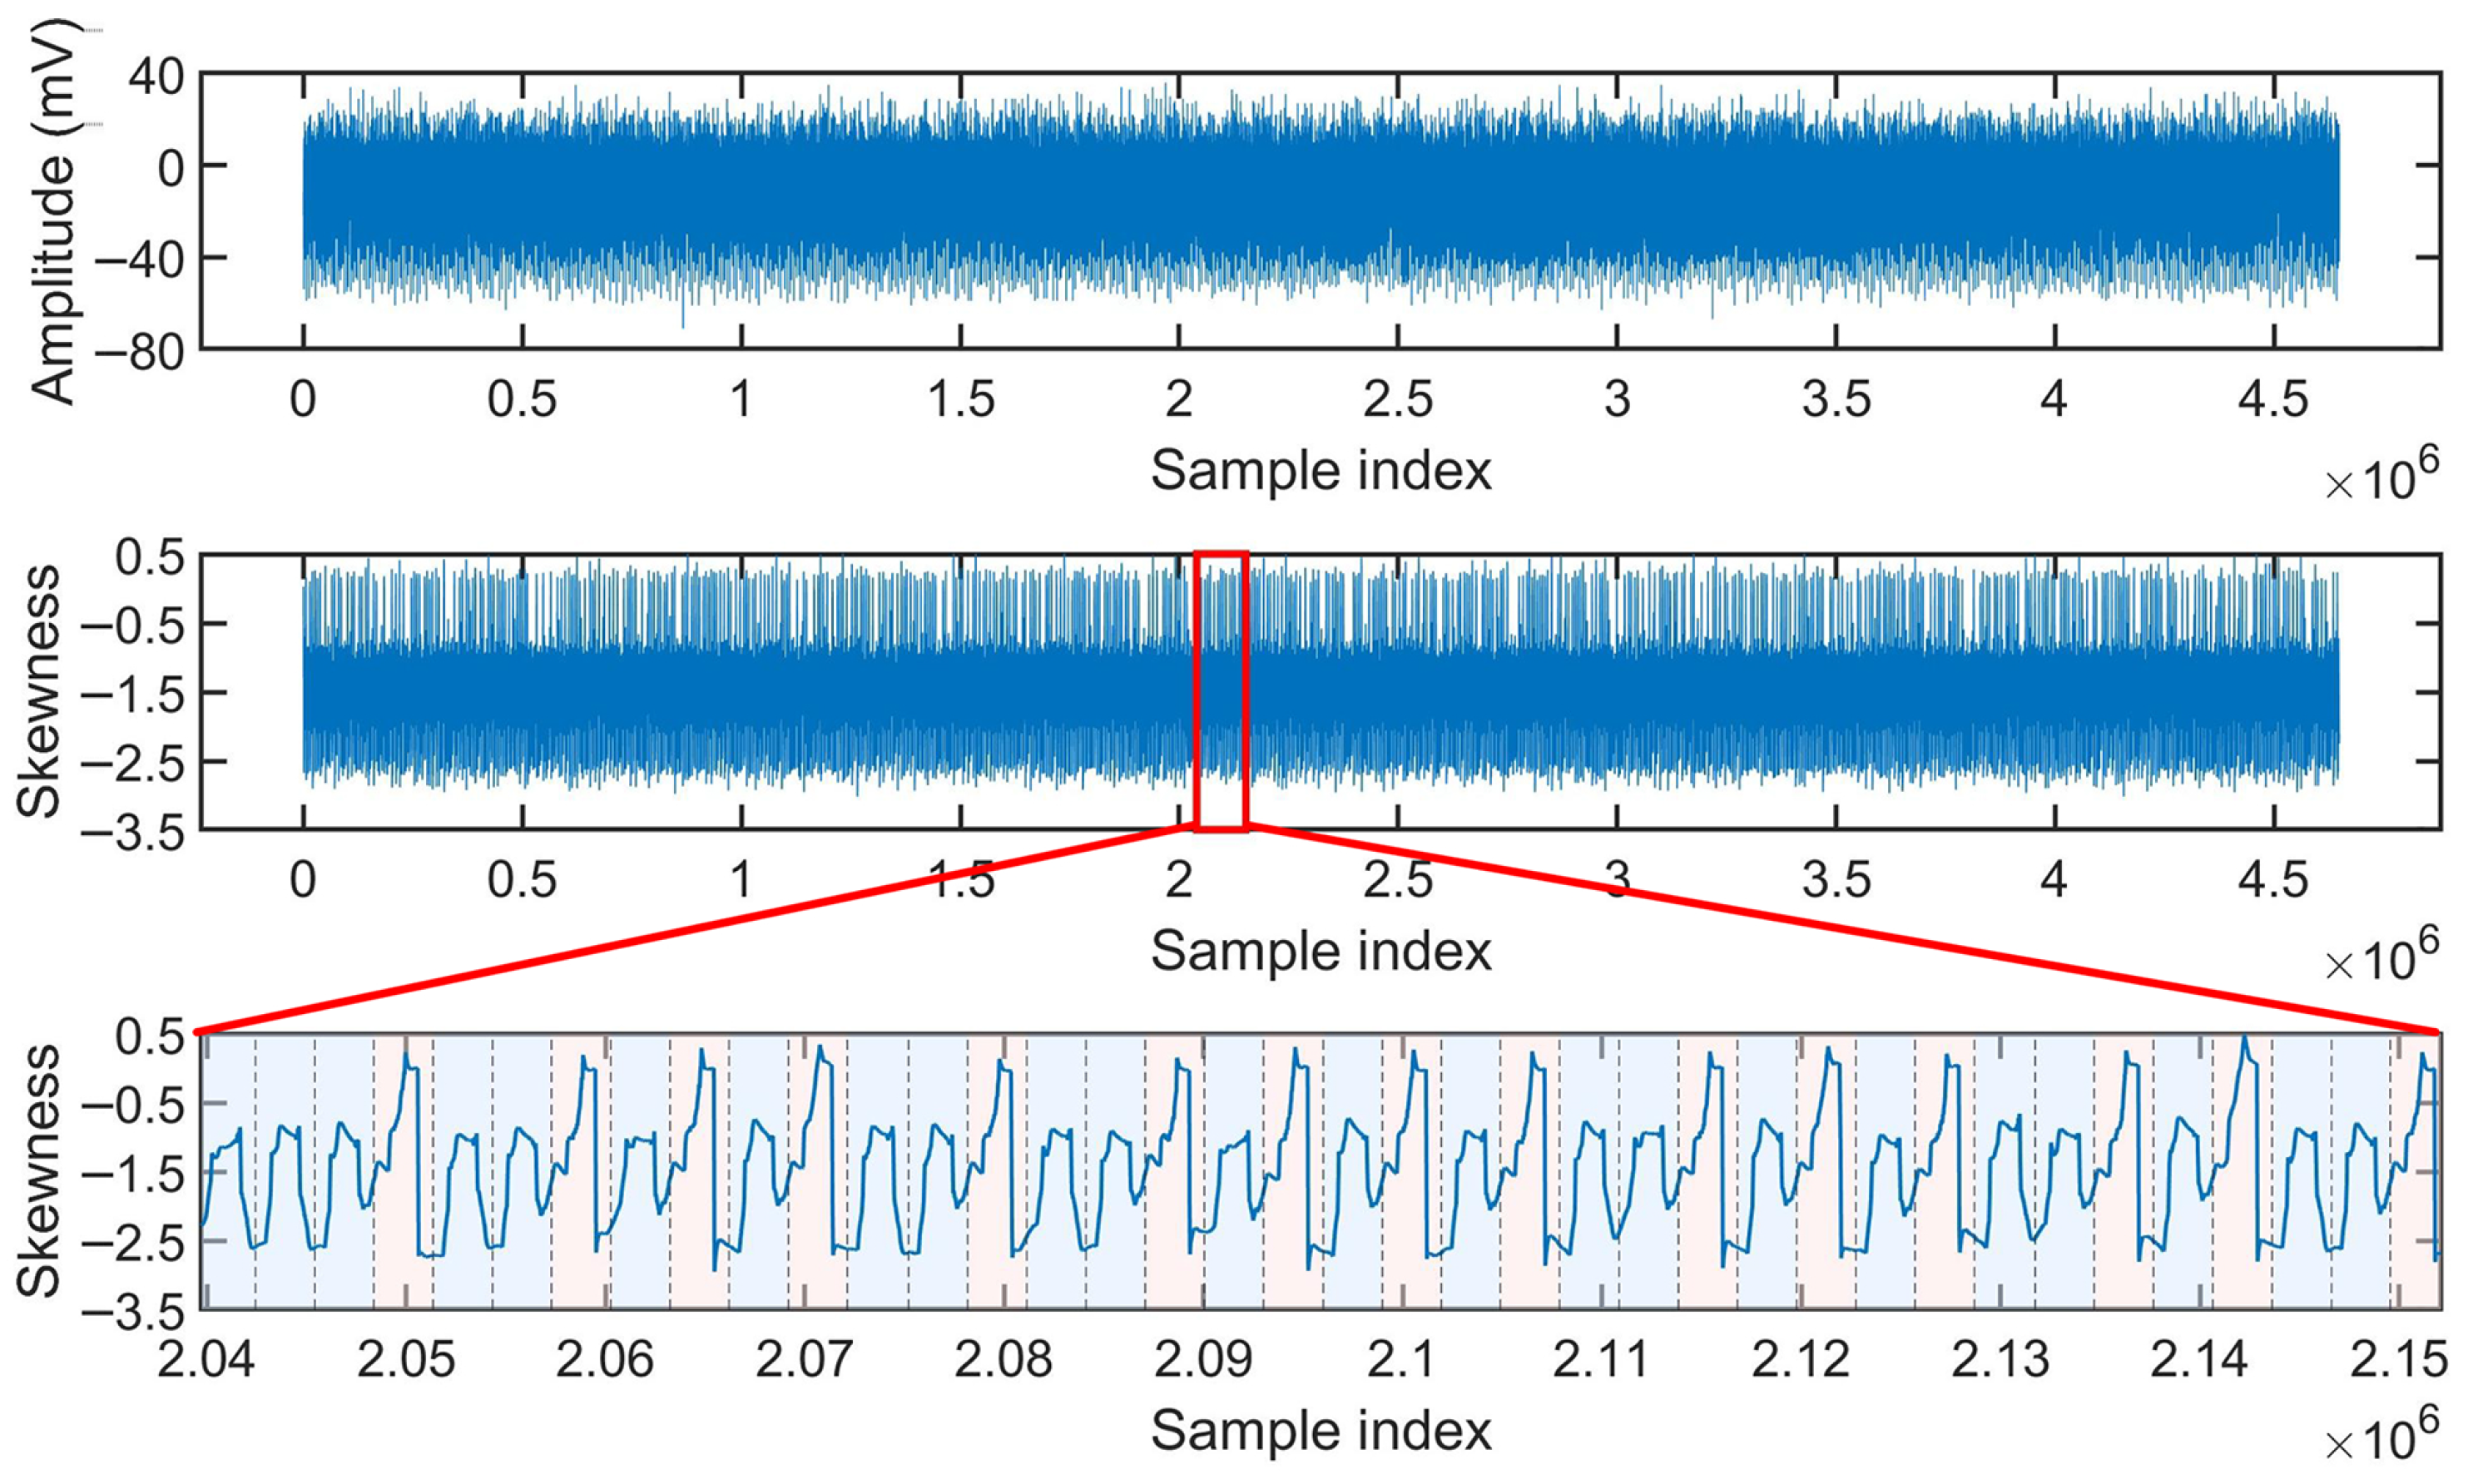
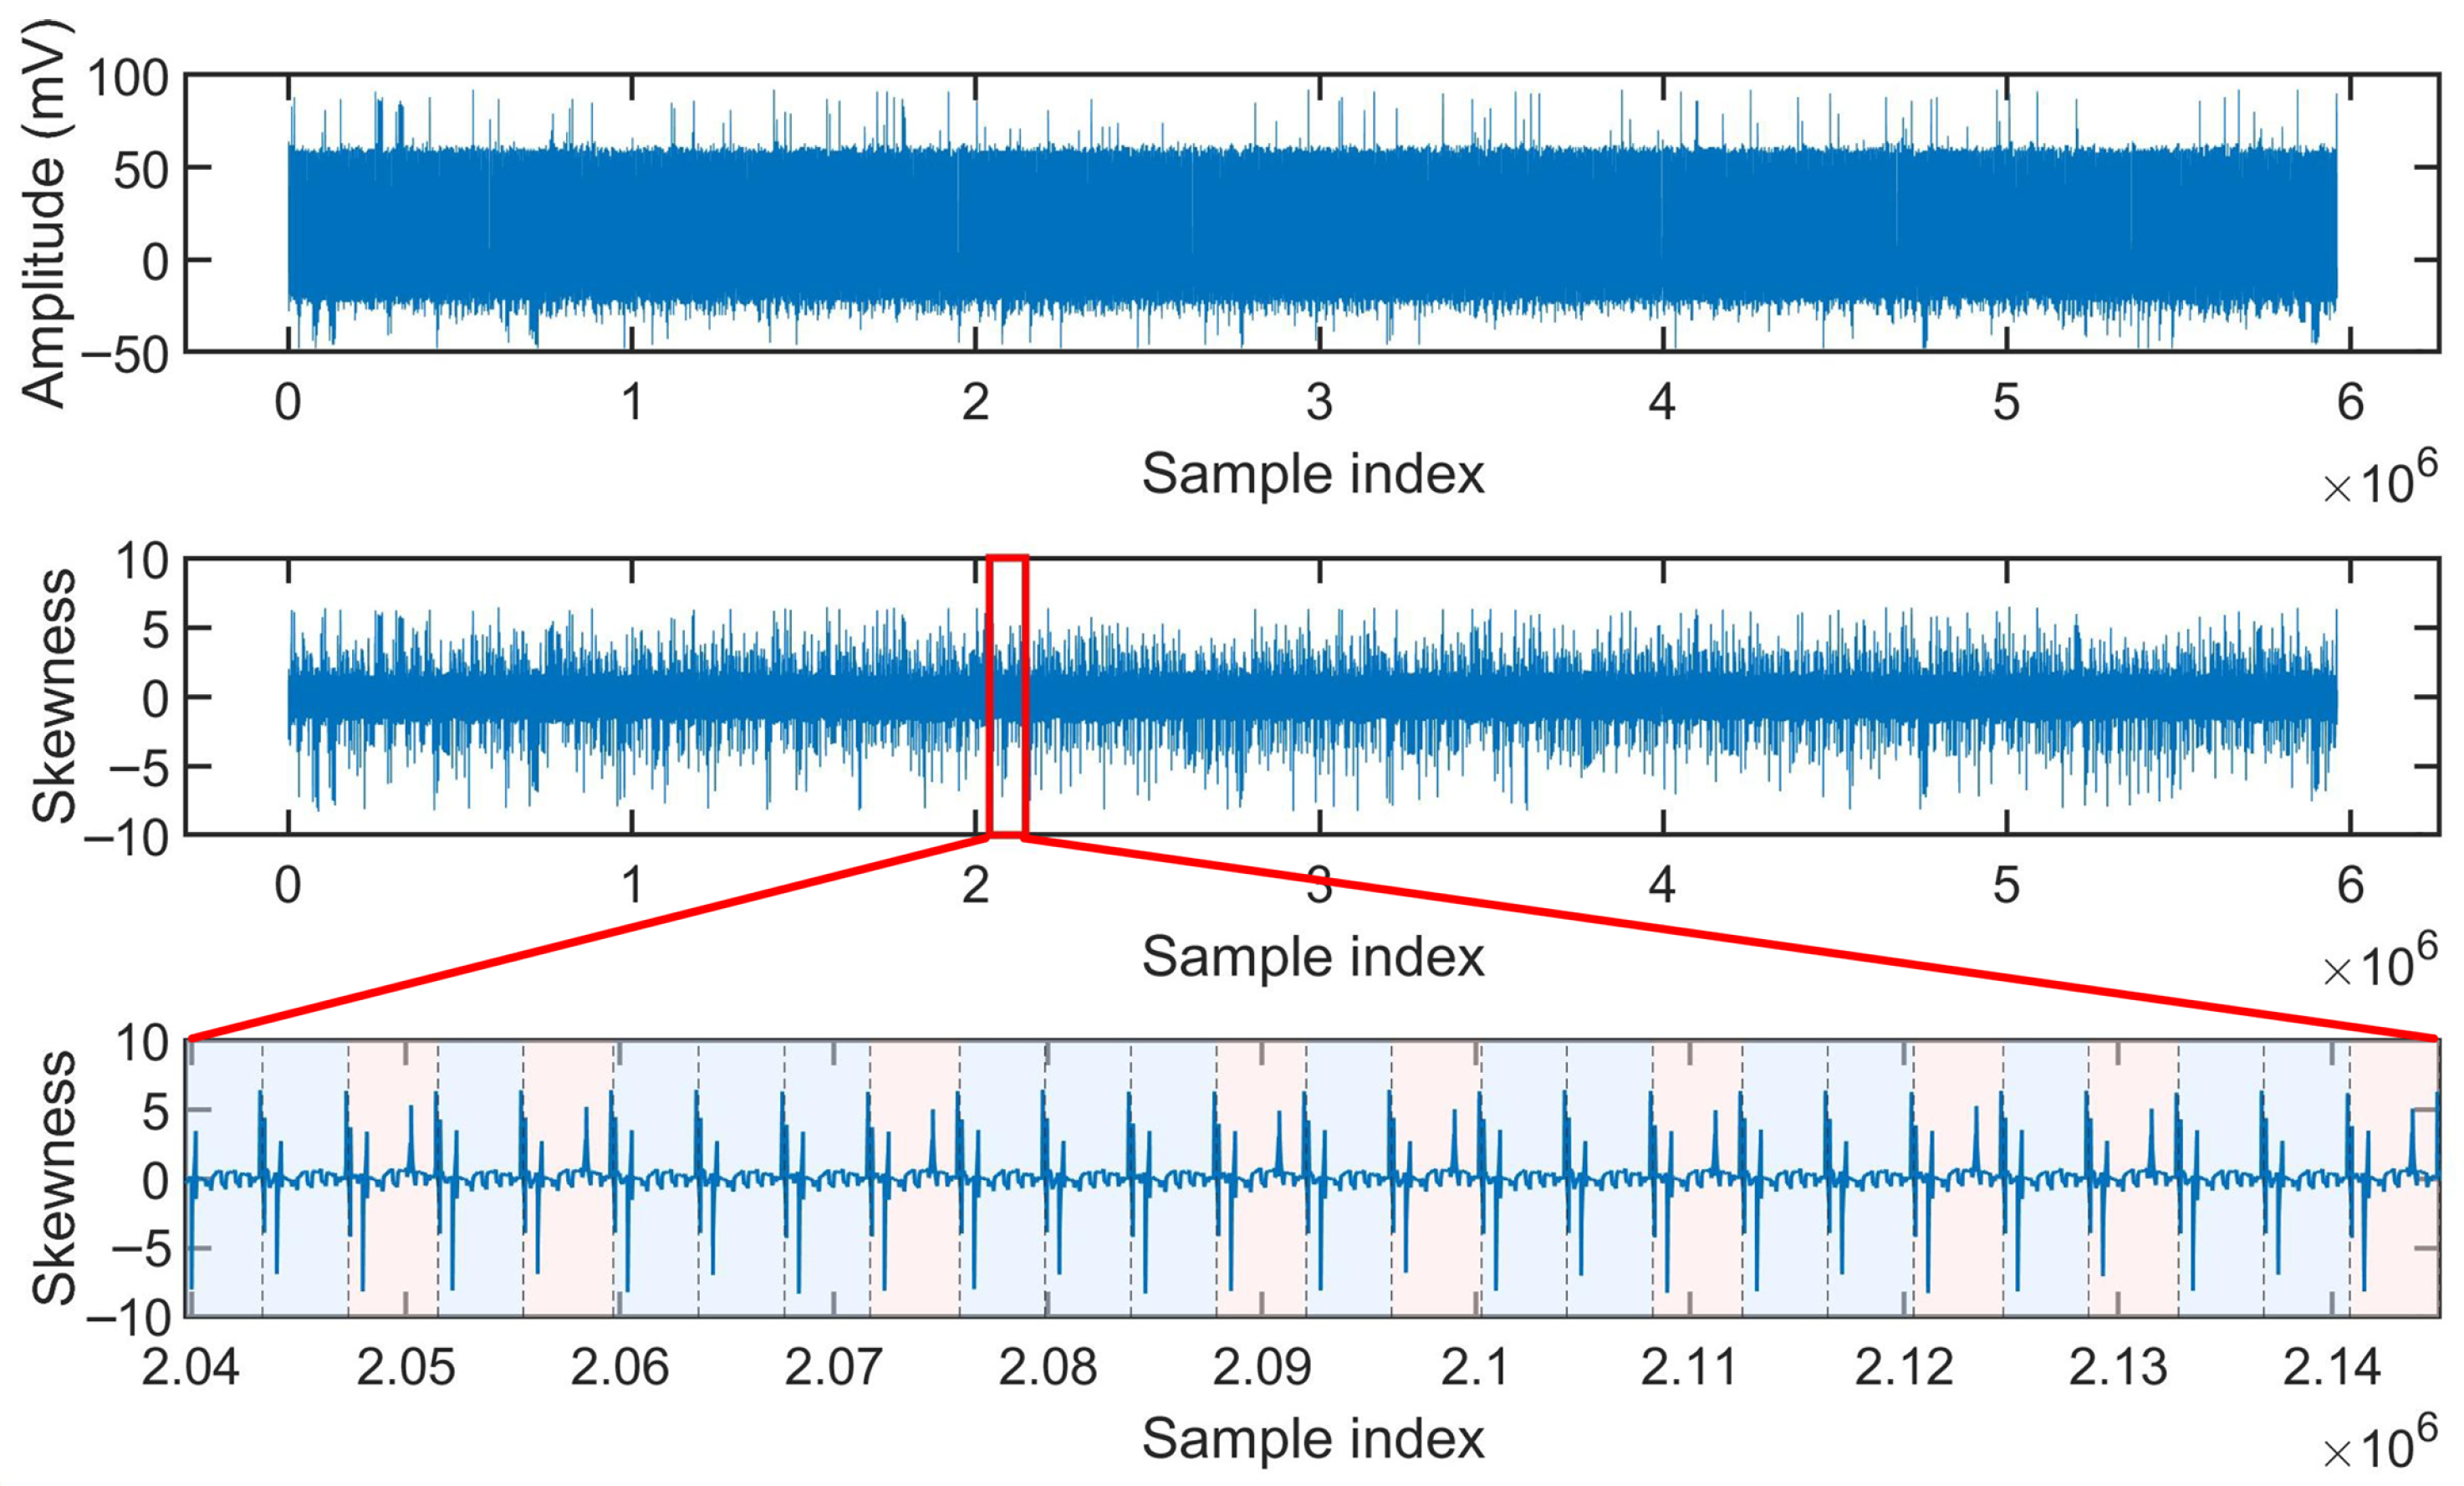
Figure 13 show the raw trace and the corresponding moving-skewness sequences for different datasets. The original traces are heavily affected by noise and frequent transient disturbances, making it difficult to identify leakage regions based solely on trace amplitudes. In contrast, the moving-skewness sequences exhibit two distinct, highly regular, and repetitive patterns that correspond to two different operations. By emphasizing the subtle asymmetries introduced by real computations, moving skewness facilitates visual inspection and improves the effectiveness of key recovery in SPA attacks.
As shown in
Table 3, we compared the performance of low-pass filtering, moving average, and moving skewness in single-trace attacks across five real-world datasets. The low-pass filter weights were selected empirically, while the window sizes for the moving-average and moving-skewness techniques were set to the optimal values determined in the next section.
The results indicate that moving skewness achieves the highest attack success rate on all datasets, reaching 100% in most cases, whereas low-pass filtering and moving average suffer from noticeable performance degradation on some datasets (e.g., Dataset-7). These findings suggest that skewness more effectively captures operation-induced distribution asymmetry and demonstrates stronger robustness to noise and trace variations.
For Dataset-5, the only dataset in which moving skewness does not achieve a success rate of 100%, the reduced performance is mainly attributable to fluctuations in a small number of operation segments during data acquisition. Due to the inherent sensitivity of classification methods to outliers, some samples may be misclassified. Such effects are common in real-world measurements and do not negate the overall effectiveness of the moving-skewness feature, which still maintains a high success rate.
4.3. Window Size Selection and Parameter Sensitivity
This subsection investigates the impact of window size on the performance of moving skewness and examines the need for explicit window-selection strategies. We first analyze parameter sensitivity through simulated datasets under different noise levels, and then we verify the observations using real-world datasets.
4.3.1. Window Parameter Evaluation on Simulated Datasets
In moving-skewness preprocessing,
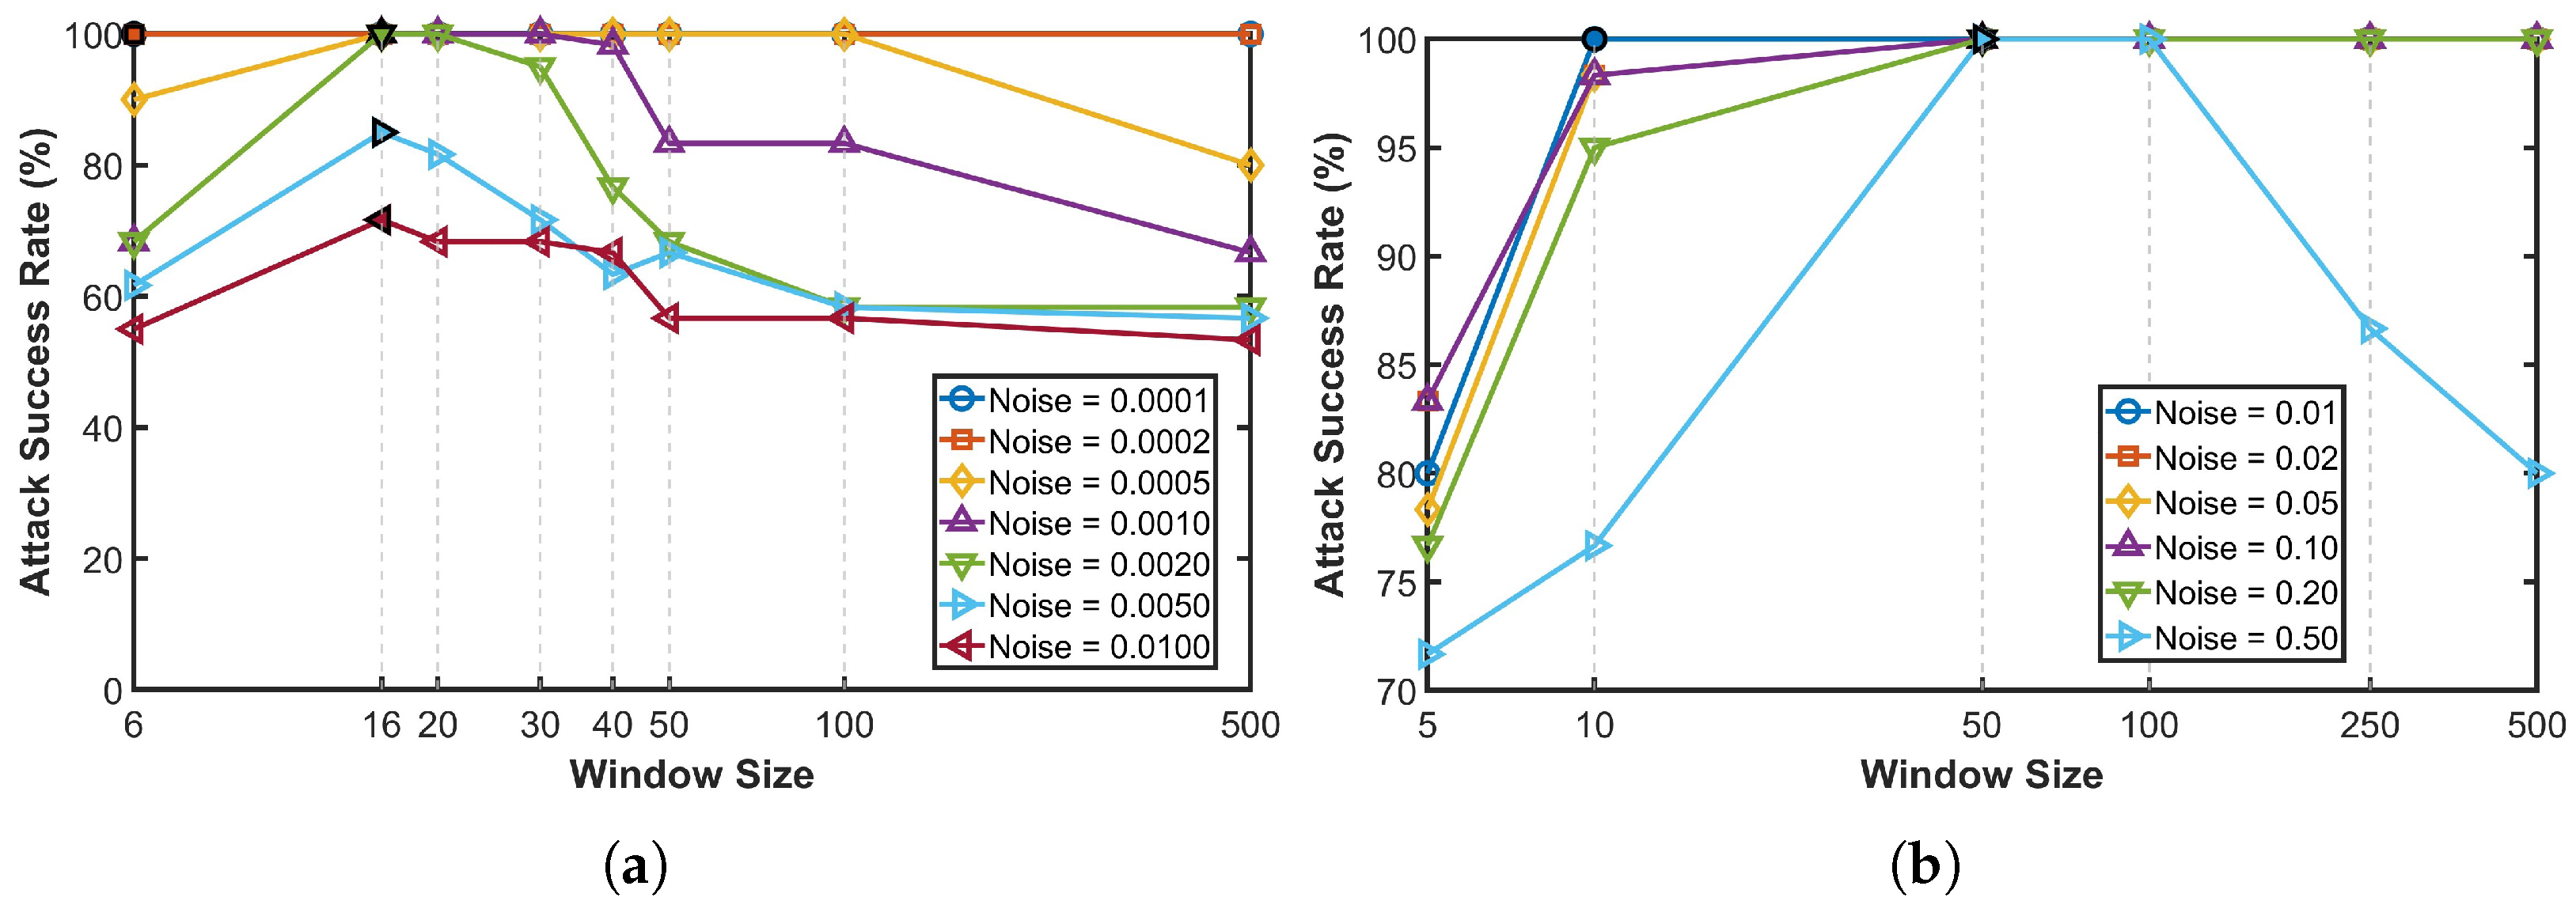
Figure 14 illustrates the impact of window size on SPA attack success rate. For Dataset-1, a consistent optimal window size of 16 can be observed across different noise levels. Small windows suffer from insufficient statistical stability under noisy conditions, whereas overly large windows include irrelevant points that dilute leakage contributions, resulting in degraded performance. Given the sparsity of leakage points (3 out of 1000), the optimal window reflects a trade-off between leakage density and noise robustness. Although based on simulated data, this trend is consistent with theoretical expectations and supports the rationale behind the window-selection strategy discussed earlier.
For Dataset-2, it achieves optimal performance with window sizes in the range of 50 to 100. The optimal range becomes wider as the noise level decreases, indicating the influence of noise on the stability of skewness estimation. Due to higher noise levels, Dataset-2 requires larger window sizes despite having similarly sparse leakage (5 out of 1000 samples). Since real measurement traces typically exhibit lower noise levels, the proposed window-selection Strategy III remains applicable in practical scenarios. Overall, the window size should be chosen to balance noise robustness and leakage scale in order to maximize attack performance.
4.3.2. Window Parameter Evaluation on Measured Datasets
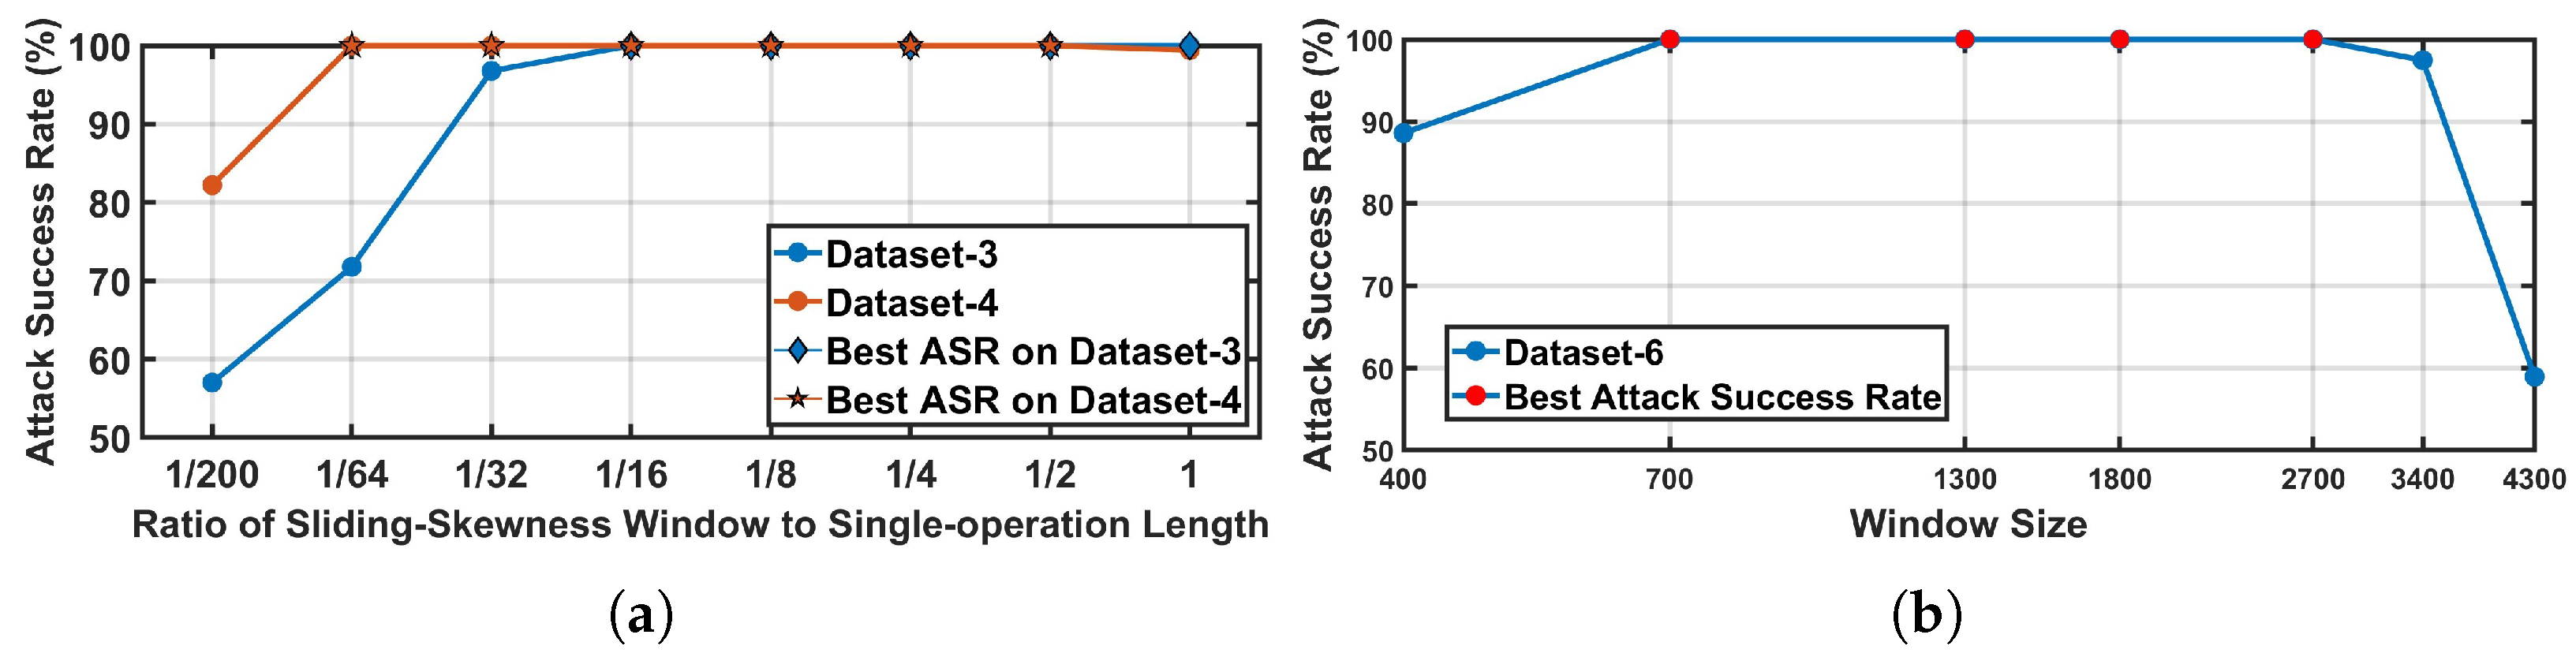
The impact of window size variation on real measurement traces further supports the window-selection strategies proposed in this work. Dataset-3 and Dataset-4 provide validation for Strategy I. The traces in both datasets consist of two consecutive operations, where one operation exhibits no pronounced asymmetry, while the other shows a clear asymmetric characteristic. As illustrated in
Figure 15a, the ASR reaches its maximum when the window size is set to half the length of a single operation.
Dataset-6 provides validation for Strategy II. In this dataset, the differences between operations are primarily characterized by the presence or absence of a prominent peak, with leakage features highly concentrated within this peak region. As shown in
Figure 15b, the attack success rate reaches its maximum when the window size is selected to match the width of the peak. These results suggest that aligning the window scale with the dominant leakage structure is important for improving attack performance.
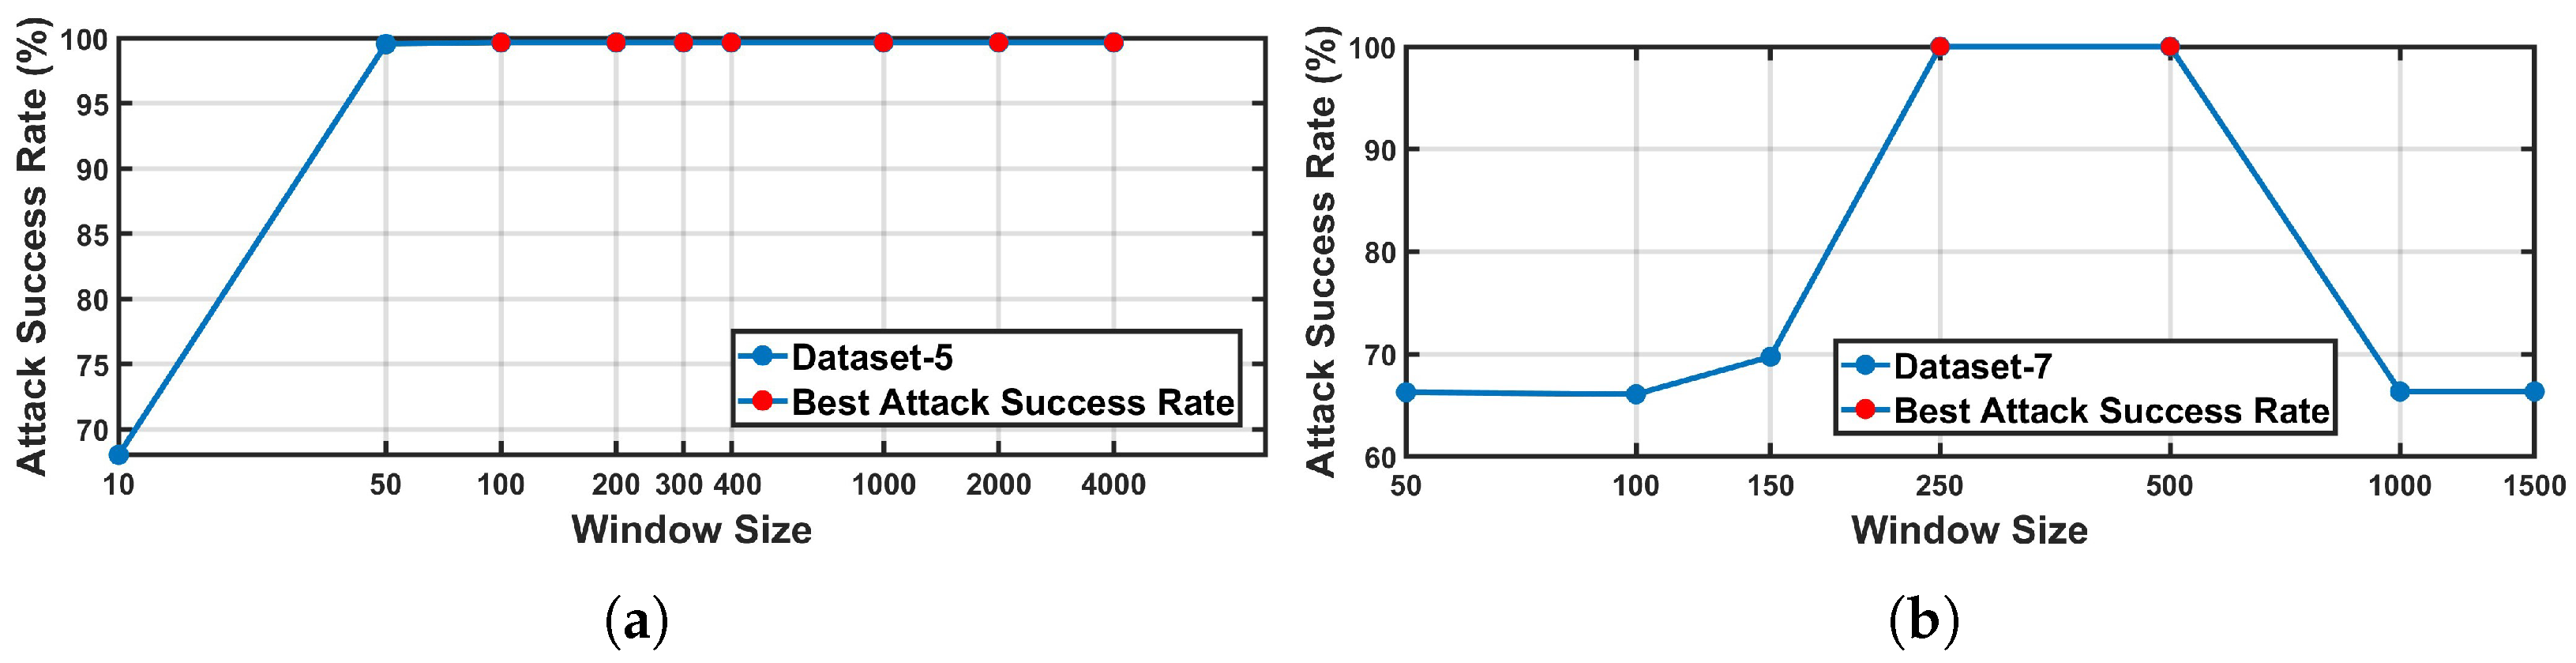
Dataset-5 and Dataset-7 provide validation for Strategy III. In these datasets, there is a significant discrepancy between the single-operation length and the effective leakage duration. As illustrated in
Figure 16, the ASR reaches its maximum when the window size is set to match the leakage duration.
Overall, consistent trends can be observed for both real and simulated traces. When the window size is either too small or too large, sliding skewness fails to effectively support SPA attacks, indicating the existence of an optimal window size range. The proposed window-selection strategies, which are guided by trace characteristics, offer a practical approach for selecting window sizes within this effective range. These results support the validity of the proposed strategies across different datasets and experimental conditions.
5. Discussion on Other Side-Channel Analyses
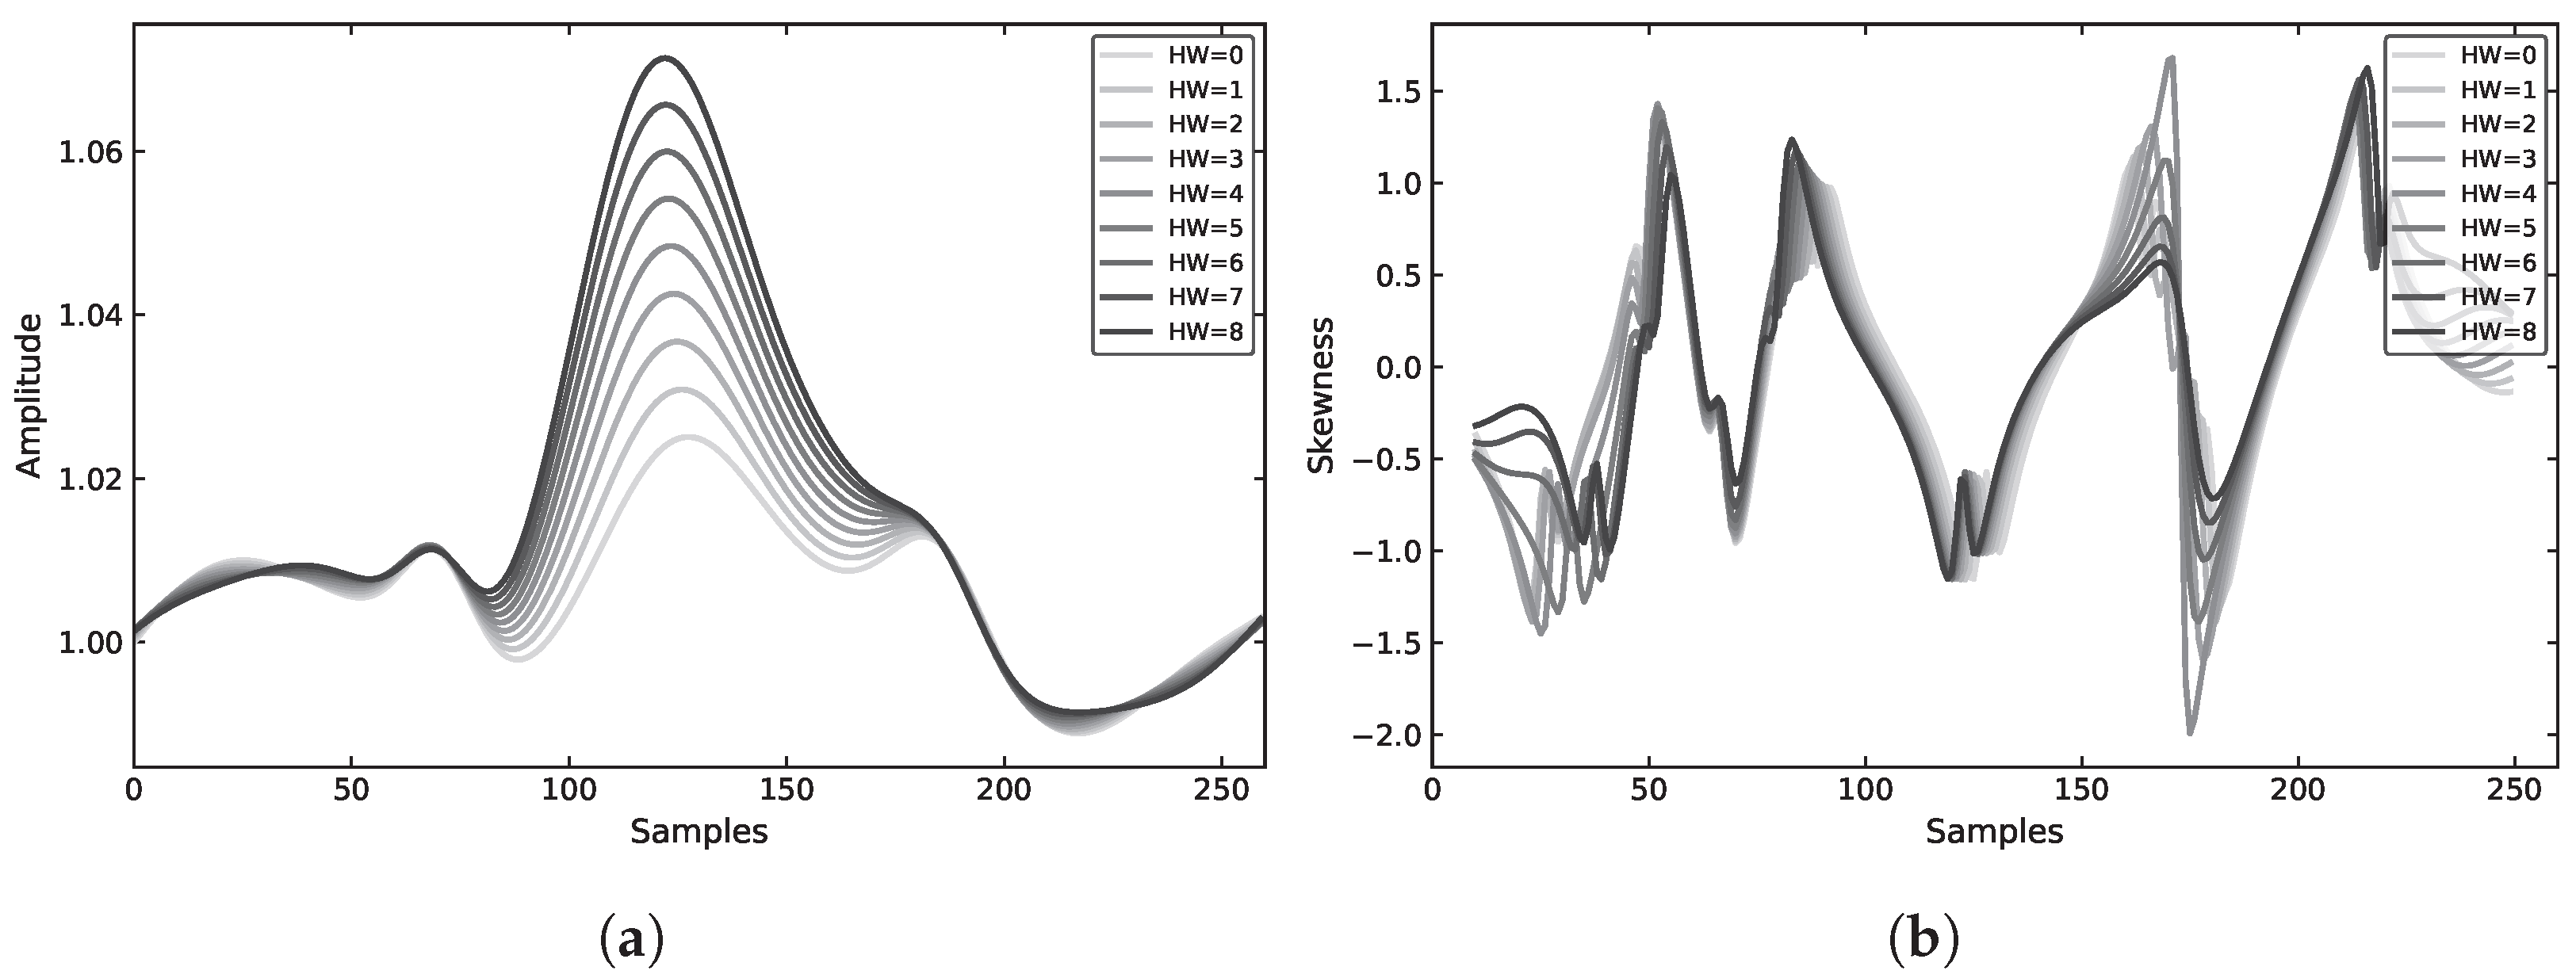
In addition to SPA, correlation power analysis (CPA), DPA, and template attacks are also widely used side-channel analysis methods. Specifically, CPA exploits the correlation between the measured leakage and a hypothetical power model, such as the Hamming weight or Hamming distance of an intermediate value. DPA partitions traces into different groups according to a predicted intermediate bit and distinguishes the correct key hypothesis by evaluating the statistical difference between the groups. Template attacks, as a profiling-based approach, first construct statistical models for different classes from training traces and then identify the most likely class or key hypothesis from the attack traces. Although these methods differ in their statistical procedures, they generally rely on the same prerequisite: the raw traces should preserve stable and distinguishable amplitude-dependent leakage related to the processed intermediate values.
However, the proposed moving-skewness preprocessing is not designed to preserve such leakage. As illustrated in
Figure 17, the raw traces corresponding to different Hamming weights exhibit relatively clear ordering and separability, whereas after moving-skewness transformation this structure becomes less regular and the inter-class difference is reduced. This is because moving skewness is a nonlinear higher-order statistic that emphasizes local distributional asymmetry within a sliding window, rather than the original amplitude itself. Therefore, the common leakage information required by CPA, DPA, and template attacks may be weakened after transformation. For this reason, the proposed method is mainly suitable for SPA and clustering-based SPA, where the main objective is to highlight weak local structural differences, rather than to serve as a universal preprocessing technique for all side-channel attacks.
6. Conclusions
This paper provides a systematic discussion of moving-skewness-based preprocessing for simple power analysis under realistic and noisy measurement conditions. By analyzing skewness as a higher-order statistical feature, we show how this approach captures local distributional asymmetries associated with secret-dependent operations, which are often overlooked or attenuated by conventional smoothing-based preprocessing techniques. Through theoretical analysis and extensive experiments on both simulated and real-world datasets, we demonstrate that moving-skewness preprocessing effectively highlights subtle leakage features and achieves improved SPA success rates compared with low-pass filtering and moving-average methods.
In addition, this work proposes feature-driven window-selection strategies that align the preprocessing parameters with different leakage characteristics, including asymmetric operations, impulse-type leakage, and short-time transient features. The experimental results show that these strategies provide practical guidance for parameter selection and improve robustness across diverse devices, algorithms, and noise levels.
Overall, moving skewness offers a lightweight and interpretable preprocessing solution that improves the practicality and effectiveness of SPA. Future work will explore the integration of moving skewness with other higher-order statistical features and further investigate its applicability and limitations in a broader range of side-channel analysis settings.