


A Study Protocol on Risk Prediction Modelling of Mortality and In-Hospital Major Bleeding Following Percutaneous Coronary Intervention in an Australian Population: Machine Learning Approach

 , and
, and
Abstract
1. Introduction
1.1. Overall Aim
1.2. Specific Aims
- To develop an ML-based preprocedural risk prediction model for 30-day all-cause mortality post-PCI in an Australian population.
- To develop an ML-based preprocedural risk prediction model for in-hospital major bleeding post-PCI in an Australian Population.
- To develop an ML-based preprocedural risk prediction model for one-year mortality post-PCI in an Australian population.
2. Methods
2.1. Study Design and Population
2.2. The Victorian Cardiac Outcomes Registry Database
- A dataset aligned with national reporting guidelines,
- Developing a centralized mechanism for providing feedback,
- Benchmarking clinical outcomes and improving patient care,
- Areas of excellence and opportunities for improvement,
- Adequacy of access to resources available,
- Development of procedures, clinical guidelines, and policies,
- Insight into the safety of cardiac services,
- Identification of population groups that may require better access to care.
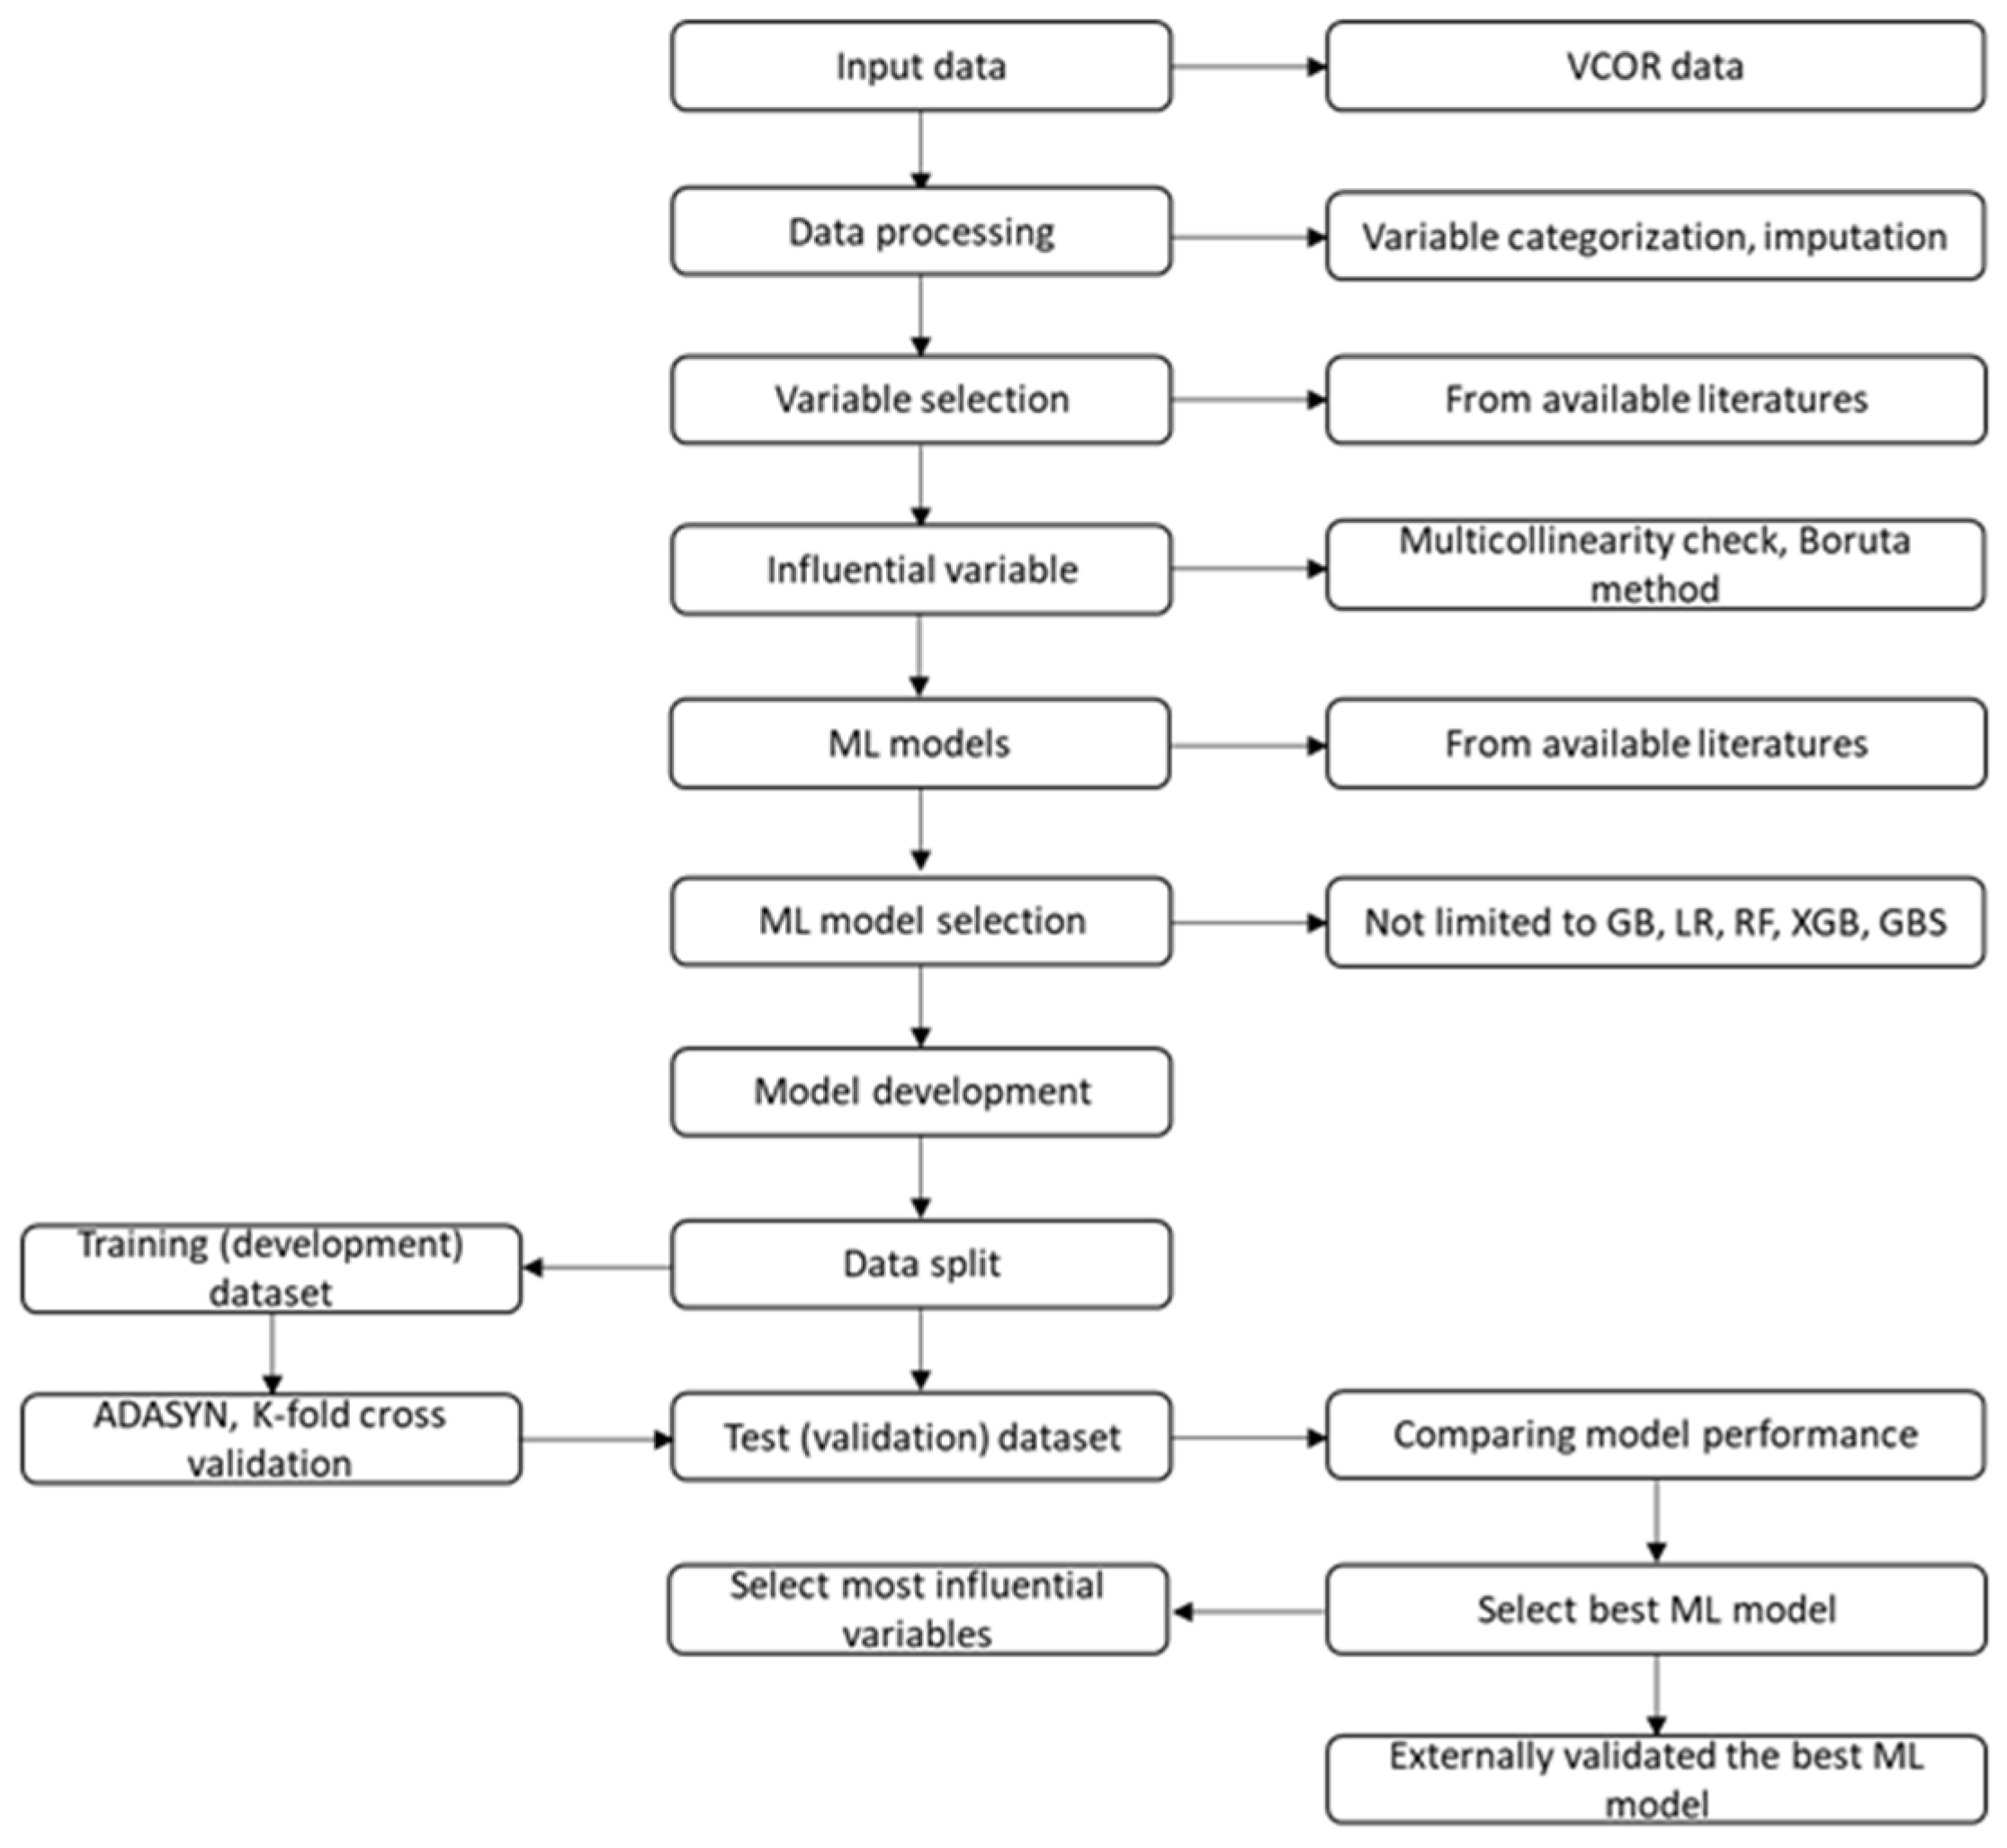
2.3. Overview of Model Development
2.4. Variable Selection
2.5. Outcome Variables
2.6. Exposure Variables
2.7. Treatment of Missing Data
2.8. Analyses
2.9. Development of ML-Based Risk Prediction Models
2.10. Presentation of the Model
2.11. External Validation
2.12. Healthcare Services’ Performance
2.13. Statistical Software
2.14. Strengths and Limitations of This Study
- This study will utilize registry data comprising a large cohort of patients who underwent percutaneous coronary intervention across 33 specialized hospitals in Victoria, Australia.
- A number of sophisticated ML algorithms will be employed to develop the risk prediction models.
- The risk prediction models will undergo further validation using external data.
- The study sample will consist solely of patients from Australia, which may introduce a cultural gap and restrict the generalizability of our findings.
- The study will rely on registry data, which may restrict the inclusion of certain variables previously identified as important.
3. Discussion
Author Contributions
Funding
Institutional Review Board Statement
Informed Consent Statement
Data Availability Statement
Acknowledgments
Conflicts of Interest
Abbreviations
| AHHREC | Alfred Hospital Human Research Ethics Committee |
| ANCR | Australian National Cardiac Registry |
| BARC | Bleeding Academic Research Consortium |
| CABG | Coronary artery bypass grafting |
| CAD | Coronary artery disease |
| CoxPH | Cox proportional hazard |
| eGFR | estimated Glomerular Filtration Rate |
| GB | Gradient Booster |
| GBS | Gradient Boosting Survival |
| LR | Logistic Regression |
| LVEF | Left ventricular ejection fraction |
| ML | Machine learning |
| MLP | Multilayer perceptron |
| MI | Myocardial infarction |
| MICE | Multiple Imputations by Chained Equations |
| MUHREC | Monash University Human Research Ethics Committee |
| NCR | National Cardiac Registry |
| NDI | National Death Index |
| NHMRC | National Health and Medical Research Council |
| PCI | Percutaneous coronary intervention |
| RF | Random forest |
| RSF | Random Survival Forest |
| ROC | Receiver operating characteristics |
| TRIPOD | Transparent Reporting of a multivariable prediction model for Individual Prognosis Or Diagnosis |
| VCOR | Victorian Cardiac Outcomes Registry |
| VIF | Variance Inflation Factor |
| XGB | Extreme gradient booster |
References
- GHE. Deaths by Cause, Age, Sex, by Country and by Region, 2000–2016; Global Health Estimates: Geneva, Switzerland, 2018. [Google Scholar]
- ABS. National Health Survey: First Results 2017-18; Australian Bureau of Statistics (ABS): Canberra, Australia, 2018.
- ABS. Causes of Death 2019; Cat. No. 3303.0. 2020; Australian Bureau of Statistics: Canberra, Australia, 2019.
- AIHW. Data Tables: Cardiovascular Disease 2020; Australian Institute of Health and Welfare: Canberra, Australia, 2020.
- AIHW. Australian Burden of Disease Study: Impact and Causes of Illness and Death in Aboriginal and Torres Strait Islander People 2011; Australian Burden of Disease Study Series No. 6. Cat. No. BOD 7; AIHW: Canberra, Australia, 2016.
- Ahmad, M.; Mehta, P.; Reddivari, A.K.R.; Mungee, S. Percutaneous Coronary Intervention. In StatPearls; StatPearls Publishing LLC.: Treasure Island, FL, USA, 2022. [Google Scholar]
- AIHW. National Hospital Morbidity Database (NHMD); Australian Institute of Health and Welfare: Canberra, Australia, 2020.
- Sabatine, M.S.; Bergmark, B.A.; Murphy, S.A.; O’Gara, P.; Smith, P.K.; Serruys, P.W.; Kappetein, A.P.; Park, S.-J.; Park, D.-W.; Christiansen, E.H. Percutaneous coronary intervention with drug-eluting stents versus coronary artery bypass grafting in left main coronary artery disease: An individual patient data meta-analysis. Lancet 2021, 398, 2247–2257. [Google Scholar] [CrossRef] [Scilit]
- Murali, S.; Vogrin, S.; Noaman, S.; Dinh, D.T.; Brennan, A.L.; Lefkovits, J.; Reid, C.M.; Cox, N.; Chan, W. Bleeding severity in percutaneous coronary intervention (PCI) and its impact on short-term clinical outcomes. J. Clin. Med. 2020, 9, 1426. [Google Scholar] [CrossRef] [Scilit]
- Goldstein, B.A.; Navar, A.M.; Pencina, M.J.; Ioannidis, J. Opportunities and challenges in developing risk prediction models with electronic health records data: A systematic review. J. Am. Med. Inform. Assoc. 2017, 24, 198–208. [Google Scholar] [CrossRef] [Scilit] [PubMed]
- McCreanor, V.; Nowbar, A.; Rajkumar, C.; Barnett, A.G.; Francis, D.; Graves, N.; Boden, W.E.; Weintraub, W.S.; Al-Lamee, R.; Parsonage, W.A. Cost-effectiveness analysis of percutaneous coronary intervention for single-vessel coronary artery disease: An economic evaluation of the ORBITA trial. BMJ Open 2021, 11, e044054. [Google Scholar] [CrossRef] [Scilit] [PubMed]
- Baber, U.; Mehran, R.; Giustino, G.; Cohen, D.J.; Henry, T.D.; Sartori, S.; Ariti, C.; Litherland, C.; Dangas, G.; Gibson, C.M. Coronary thrombosis and major bleeding after PCI with drug-eluting stents: Risk scores from PARIS. J. Am. Coll. Cardiol. 2016, 67, 2224–2234. [Google Scholar] [CrossRef] [Scilit]
- Tang, E.W.; Wong, C.-K.; Herbison, P. Global Registry of Acute Coronary Events (GRACE) hospital discharge risk score accurately predicts long-term mortality post acute coronary syndrome. Am. Heart J. 2007, 153, 29–35. [Google Scholar] [CrossRef] [Scilit]
- Scruth, E.A.; Cheng, E.; Worrall-Carter, L. Risk score comparison of outcomes in patients presenting with ST-elevation myocardial infarction treated with percutaneous coronary intervention. Eur. J. Cardiovasc. Nurs. 2013, 12, 330–336. [Google Scholar] [CrossRef] [Scilit] [PubMed]
- Antman, E.M.; Cohen, M.; Bernink, P.J.; McCabe, C.H.; Horacek, T.; Papuchis, G.; Mautner, B.; Corbalan, R.; Radley, D.; Braunwald, E. The TIMI risk score for unstable angina/non–ST elevation MI: A method for prognostication and therapeutic decision making. JAMA 2000, 284, 835–842. [Google Scholar] [CrossRef] [Scilit]
- Baptista, S.B.; Loureiro, J.; Thomas, B.; Nédio, M.; Gago, S.; Ferreira, R. PAMI risk score for mortality prediction in acute myocardial indarction treated with primary angioplasty. Rev. Port. Cardiol. 2004, 23, 683–693. [Google Scholar]
- Panch, T.; Pearson-Stuttard, J.; Greaves, F.; Atun, R. Artificial intelligence: Opportunities and risks for public health. Lancet Digit. Health 2019, 1, e13–e14. [Google Scholar] [CrossRef] [Scilit]
- Tacey, M.; Dinh, D.T.; Andrianopoulos, N.; Brennan, A.L.; Stub, D.; Liew, D.; Reid, C.M.; Duffy, S.J.; Lefkovits, J. Risk-adjusting key outcome measures in a clinical quality PCI registry: Development of a highly predictive model without the need to exclude high-risk conditions. JACC Cardiovasc. Interv. 2019, 12, 1966–1975. [Google Scholar] [CrossRef] [Scilit]
- D’Elia, N.; Vogrin, S.; Brennan, A.L.; Dinh, D.; Lefkovits, J.; Reid, C.M.; Stub, D.; Bloom, J.; Haji, K.; Biswas, S.; et al. Development of an acute coronary syndrome-cardiogenic shock risk score for 30-day mortality from the Victorian Cardiac Outcomes Registry (VCOR ACS-CS Risk Score). Catheter. Cardiovasc. Interv. 2025, 106, 303–316. [Google Scholar] [CrossRef] [Scilit]
- Aldridge, R.W. Research and training recommendations for public health data science. Lancet Public Health 2019, 4, e373. [Google Scholar] [CrossRef] [Scilit] [PubMed]
- Motwani, M.; Dey, D.; Berman, D.S.; Germano, G.; Achenbach, S.; Al-Mallah, M.H.; Andreini, D.; Budoff, M.J.; Cademartiri, F.; Callister, T.Q. Machine learning for prediction of all-cause mortality in patients with suspected coronary artery disease: A 5-year multicentre prospective registry analysis. Eur. Heart J. 2017, 38, 500–507. [Google Scholar] [CrossRef] [Scilit]
- Shickel, B.; Tighe, P.J.; Bihorac, A.; Rashidi, P. Deep EHR: A survey of recent advances in deep learning techniques for electronic health record (EHR) analysis. IEEE J. Biomed. Health Inform. 2017, 22, 1589–1604. [Google Scholar] [CrossRef] [Scilit]
- Cheng, Y.; Wang, F.; Zhang, P.; Hu, J. Risk prediction with electronic health records: A deep learning approach. In Proceedings of the 2016 SIAM International Conference on Data Mining (SIAM 2016), Miami, FL, USA, 5–7 May 2016; pp. 432–440. [Google Scholar]
- Morgan, D.J.; Bame, B.; Zimand, P.; Dooley, P.; Thom, K.A.; Harris, A.D.; Bentzen, S.; Ettinger, W.; Garrett-Ray, S.D.; Tracy, J.K. Assessment of machine learning vs standard prediction rules for predicting hospital readmissions. JAMA Netw. Open 2019, 2, e190348. [Google Scholar] [CrossRef] [Scilit]
- Kehl, K.L.; Elmarakeby, H.; Nishino, M.; Van Allen, E.M.; Lepisto, E.M.; Hassett, M.J.; Johnson, B.E.; Schrag, D. Assessment of deep natural language processing in ascertaining oncologic outcomes from radiology reports. JAMA Oncol. 2019, 5, 1421–1429. [Google Scholar] [CrossRef] [Scilit]
- Dagliati, A.; Marini, S.; Sacchi, L.; Cogni, G.; Teliti, M.; Tibollo, V.; De Cata, P.; Chiovato, L.; Bellazzi, R. Machine learning methods to predict diabetes complications. J. Diabetes Sci. Technol. 2018, 12, 295–302. [Google Scholar] [CrossRef] [Scilit]
- Lefkovits, J.; Dinh, D.; Carruthers, H.; Doyle, J.; Scanlon, P.; Lucas, M.; Reid, C.M. The Victorian Cardiac Outcomes Registry Annual Report 2020; Report No 8; Monash University: Victoria, Australia, 2021; 88p. [Google Scholar]
- Stub, D.; Lefkovits, J.; Brennan, A.L.; Dinh, D.; Brien, R.; Duffy, S.J.; Cox, N.; Nadurata, V.; Clark, D.J.; Andrianopoulos, N. The establishment of the Victorian Cardiac Outcomes Registry (VCOR): Monitoring and optimising outcomes for cardiac patients in Victoria. Heart Lung Circ. 2018, 27, 451–463. [Google Scholar] [CrossRef] [Scilit] [PubMed]
- Collins, G.S.; Reitsma, J.B.; Altman, D.G.; Moons, K.G. Transparent reporting of a multivariable prediction model for individual prognosis or diagnosis (TRIPOD) the TRIPOD statement. Circulation 2015, 131, 211–219. [Google Scholar] [CrossRef] [Scilit] [PubMed]
- Moons, K.G.; Kengne, A.P.; Woodward, M.; Royston, P.; Vergouwe, Y.; Altman, D.G.; Grobbee, D.E. Risk prediction models: I. Development, internal validation, and assessing the incremental value of a new (bio) marker. Heart 2012, 98, 683–690. [Google Scholar] [CrossRef] [Scilit]
- Mehran, R.; Rao, S.V.; Bhatt, D.L.; Gibson, C.M.; Caixeta, A.; Eikelboom, J.; Kaul, S.; Wiviott, S.D.; Menon, V.; Nikolsky, E. Standardized bleeding definitions for cardiovascular clinical trials: A consensus report from the Bleeding Academic Research Consortium. Circulation 2011, 123, 2736–2747. [Google Scholar] [CrossRef] [Scilit]
- Jäger, S.; Allhorn, A.; Bießmann, F. A benchmark for data imputation methods. Front. Big Data 2021, 4, 693674. [Google Scholar] [CrossRef] [Scilit]
- Kang, H. The prevention and handling of the missing data. Korean J. Anesthesiol. 2013, 64, 402–406. [Google Scholar] [CrossRef] [Scilit] [PubMed]
- Xu, B.-Z.; Wang, B.; Chen, J.-P.; Xu, J.-G.; Wu, X.-Y. Construction and validation of a personalized risk prediction model for in-hospital mortality in patients with acute myocardial infarction undergoing percutaneous coronary intervention. Clinics 2025, 80, 100580. [Google Scholar] [CrossRef] [Scilit] [PubMed]
- Liu, Y.; De, A. Multiple imputation by fully conditional specification for dealing with missing data in a large epidemiologic study. Int. J. Stat. Med. Res. 2015, 4, 287. [Google Scholar] [CrossRef] [Scilit]
- Azur, M.J.; Stuart, E.A.; Frangakis, C.; Leaf, P.J. Multiple imputation by chained equations: What is it and how does it work? Int. J. Methods Psychiatr. Res. 2011, 20, 40–49. [Google Scholar] [CrossRef] [Scilit]
- Schafer, J.L.; Graham, J.W. Missing data: Our view of the state of the art. Psychol. Methods 2002, 7, 147. [Google Scholar] [CrossRef]
- Greenland, S.; Finkle, W.D. A critical look at methods for handling missing covariates in epidemiologic regression analyses. Am. J. Epidemiol. 1995, 142, 1255–1264. [Google Scholar] [CrossRef] [Scilit]
- Hair, J.F.; Black, W.C.; Babin, B.J.; Anderson, R.E. Multivariate data analysis. In Cengage Learning EMEA; Cheriton House: Andover, UK, 2019. [Google Scholar]
- Chen, R.-C.; Dewi, C.; Huang, S.-W.; Caraka, R.E. Selecting critical features for data classification based on machine learning methods. J. Big Data 2020, 7, 52. [Google Scholar] [CrossRef] [Scilit]
- Lundberg, S.M.; Lee, S.-I. A unified approach to interpreting model predictions. Adv. Neural Inf. Process. Syst. 2017, 30, 4768–4777. [Google Scholar]
- Al’Aref, S.J.; Singh, G.; van Rosendael, A.R.; Kolli, K.K.; Ma, X.; Maliakal, G.; Pandey, M.; Lee, B.C.; Wang, J.; Xu, Z. Determinants of in-hospital mortality after percutaneous coronary intervention: A machine learning approach. J. Am. Heart Assoc. 2019, 8, e011160. [Google Scholar] [CrossRef] [Scilit]
- Hsieh, M.-H.; Lin, S.-Y.; Lin, C.-L.; Hsieh, M.-J.; Hsu, W.-H.; Ju, S.-W.; Lin, C.-C.; Hsu, C.Y.; Kao, C.-H. A fitting machine learning prediction model for short-term mortality following percutaneous catheterization intervention: A nationwide population-based study. Ann. Transl. Med. 2019, 7, 732. [Google Scholar] [CrossRef] [Scilit]
- Mortazavi, B.J.; Bucholz, E.M.; Desai, N.R.; Huang, C.; Curtis, J.P.; Masoudi, F.A.; Shaw, R.E.; Negahban, S.N.; Krumholz, H.M. Comparison of machine learning methods with national cardiovascular data registry models for prediction of risk of bleeding after percutaneous coronary intervention. JAMA Netw. Open 2019, 2, e196835. [Google Scholar] [CrossRef] [Scilit]
- Spooner, A.; Chen, E.; Sowmya, A.; Sachdev, P.; Kochan, N.A.; Trollor, J.; Brodaty, H. A comparison of machine learning methods for survival analysis of high-dimensional clinical data for dementia prediction. Sci. Rep. 2020, 10, 20410. [Google Scholar] [CrossRef] [Scilit]
- Katzman, J.L.; Shaham, U.; Cloninger, A.; Bates, J.; Jiang, T.; Kluger, Y. DeepSurv: Personalized treatment recommender system using a Cox proportional hazards deep neural network. BMC Med. Res. Methodol. 2018, 18, 24. [Google Scholar] [CrossRef] [Scilit] [PubMed]
- Khera, R.; Haimovich, J.; Hurley, N.; McNamara, R.; Spertus, J.A.; Desai, N.; Masoudi, F.A.; Huang, C.; Normand, S.-L.; Mortazavi, B.J. Machine-learning to improve prediction of mortality following acute myocardial infarction: An assessment in the NCDR-Chest Pain-Myocardial infarction registry. bioRxiv 2019. preprint. [Google Scholar] [CrossRef] [Scilit]
- Burrello, J.; Gallone, G.; Burrello, A.; Pagliari, J.D.; Ploumen, E.H.; Iannaccone, M.; De Luca, L.; Zocca, P.; Patti, G.; Cerrato, E. Prediction of all-cause mortality following percutaneous coronary intervention in bifurcation lesions using machine learning algorithms. J. Pers. Med. 2022, 12, 990. [Google Scholar] [CrossRef] [Scilit] [PubMed]
- Friberg, L.; Rosenqvist, M.; Lip, G.Y. Evaluation of risk stratification schemes for ischaemic stroke and bleeding in 182 678 patients with atrial fibrillation: The Swedish Atrial Fibrillation cohort study. Eur. Heart J. 2012, 33, 1500–1510. [Google Scholar] [CrossRef] [Scilit]
- Quiroz, J.C.; Brieger, D.; Jorm, L.R.; Sy, R.W.; Hsu, B.; Gallego, B. Predicting Adverse Outcomes Following Catheter Ablation Treatment for Atrial Flutter/Fibrillation. Heart Lung Circ. 2024, 33, 470–478. [Google Scholar] [CrossRef] [Scilit] [PubMed]
- Spiegelhalter, D.J. Funnel plots for comparing institutional performance. Stat. Med. 2005, 24, 1185–1202. [Google Scholar] [CrossRef] [Scilit]
- Wang, X.; Hu, J.; Wu, D. Risk factors for frailty in older adults. Medicine 2022, 101, e30169. [Google Scholar] [CrossRef] [Scilit] [PubMed]
- Pabbidi, M.R.; Kuppusamy, M.; Didion, S.P.; Sanapureddy, P.; Reed, J.T.; Sontakke, S.P. Sex differences in the vascular function and related mechanisms: Role of 17β-estradiol. Am. J. Physiol.-Heart Circ. Physiol. 2018, 315, H1499–H1518. [Google Scholar] [CrossRef] [Scilit] [PubMed]
- Zuckerman, M.; Greller, H.A.; Babu, K.M. A Review of the Toxicologic Implications of Obesity. J. Med. Toxicol. 2015, 11, 342–354. [Google Scholar] [CrossRef] [Scilit]
- Ehrenberger, R.; Németh, B.T.; Kulyassa, P.; Fülöp, G.A.; Becker, D.; Kiss, B.; Zima, E.; Merkely, B.; Édes, I.F. Acute coronary syndrome associated cardiogenic shock in the catheterization laboratory: Peripheral veno-arterial extracorporeal membrane oxygenator management and recommendations. Front. Med. 2023, 10, 1277504. [Google Scholar] [CrossRef] [Scilit] [PubMed]
- Jentzer, J.C.; van Diepen, S.; Barsness, G.W.; Henry, T.D.; Menon, V.; Rihal, C.S.; Naidu, S.S.; Baran, D.A. Cardiogenic Shock Classification to Predict Mortality in the Cardiac Intensive Care Unit. J. Am. Coll. Cardiol. 2019, 74, 2117–2128. [Google Scholar] [CrossRef] [Scilit]
- Iyngkaran, P.; Thomas, M.; Majoni, W.; Anavekar, N.S.; Ronco, C. Comorbid Heart Failure and Renal Impairment: Epidemiology and Management. Cardiorenal Med. 2012, 2, 281–297. [Google Scholar] [CrossRef] [Scilit]
- Giao, D.M.; Giugliano, R.P. Left Ventricular Mechanical Circulatory Support Devices for Cardiogenic Shock After Myocardial Infarction. Cardiol. Ther. 2025, 14, 123–139. [Google Scholar] [CrossRef] [Scilit]
- Rask-Madsen, C.; King, G.L. Vascular complications of diabetes: Mechanisms of injury and protective factors. Cell Metab. 2013, 17, 20–33. [Google Scholar] [CrossRef] [Scilit]
- Tummala, R.; Rai, M.P. Glycoprotein IIb/IIIa Inhibitors. In StatPearls; StatPearls Publishing: Treasure Island, FL, USA, 2025. Available online: https://www.ncbi.nlm.nih.gov/books/NBK554376/ (accessed on 7 November 2025).
- Iftikhar, S.F.; Bishop, M.A.; Hu, P. Complex Coronary Artery Lesions. In StatPearls; StatPearls Publishing: Treasure Island, FL, USA, 2025. Available online: https://www.ncbi.nlm.nih.gov/books/NBK539899/ (accessed on 7 November 2025).

| Variables | Definition | Scale of Measurement | Type |
|---|---|---|---|
| Demographics and anthropometric variables | |||
| Age (group in years) | The date of birth of the patients was collected in DD/MM/YYYY format. | <80 years and ≥80 years | Binary |
| Gender | The gender (sex) of the patients | Male, female | Binary |
| Body mass index (BMI) | Body mass index was calculated using the following formula: BMI = Weight in kg/(Height in meters)2 kg/m2. Weight was measured in kg in light clothing and height in centimetres in bare or stockinged feet. Height and weight measurements could be self-reported. | Underweight (<18.5 kg/m2), normal (18.5–24.9 kg/m2), Overweight (25.0–29.9 kg/m2), obesity (30.0 kg/m2 and above) | Categorical |
| Clinical variables | |||
| Acute coronary syndrome (ACS) | ACS encompasses clinical features comprising chest pain or overwhelming shortness of breath, defined by accompanying clinical, ECG, and biochemical features. Specifically, ACS refers to unstable angina, non-ST-Elevation Myocardial Infarction (NSTEMI), and/or ST-Elevation Myocardial Infarction (STEMI). The patient must have experienced an ACS event within the last 7 days to be coded “yes” for ACS at the time of the PCI event. | No, yes | Binary |
| Cardiogenic shock | Cardiogenic shock is coded as ‘yes’ if all of the following apply: 1. Sustained (>30 min) episode of systolic blood pressure <90 mm Hg (or vasopressors required to maintain BP > 90 mm Hg); AND 2. Evidence of elevated filling pressures (e.g., pulmonary congestion on examination or chest radiograph); AND 3. Evidence of end-organ hypoperfusion (e.g., urine output 30 mL/h; or cold/diaphoretic extremities; or altered mental status, etc.). | No, yes | Binary |
| Out-of-hospital cardiac arrest | Cardiac arrest is coded as ‘yes’ if any one of the following applies: 1. If the patient has experienced an out-of-hospital cardiac arrest (i.e., the lack of effective cardiac output), including if the person was under cardiac arrest at the time of presentation to the hospital and/or the patient was intubated prior to the PCI procedure. and 2. If the patient was intubated prior to the PCI procedure. | No, yes | Binary |
| estimated Glomerular Filtration Rate (eGFR) | Record the last serum creatinine levels recorded within 60 days prior to the current PCI (in μmol/L). To convert from mmol/L to μmol/L, multiply by 1000 or move the decimal point 3 spaces to the right. The formula for eGFR uses age, gender, and the level of creatinine in blood to estimate GFR.
| Normal, mild, moderate, severe | Categorical |
| Mechanical ventricular support | If a patient required mechanical ventricular support prior to the current PCI procedure. | No, yes | Binary |
| Comorbid variables | |||
| Diabetes | If the patient had a current medical diagnosis of diabetes that required medical intervention (regardless of duration of the disease). This includes a medical diagnosis made during the current admission where medication is prescribed. The patient must be on anti-diabetic medication to lower blood sugar. Antidiabetic medications to lower blood sugar include oral hypoglycaemics and insulin. For patients whose diabetes is controlled with diet alone, code as ‘no’. | No, yes | Binary |
| Peripheral vascular disease (PVD) | If the patient displays evidence of either chronic or acute PVD. The presence of PVD must be demonstrated by vascular reconstruction or amputation for arterial insufficiency, bypass surgery, or percutaneous intervention. PVD includes the aorta, extremities, and carotid vessels. | No, yes | Binary |
| Cerebrovascular disease (CVD) | Indicate whether the patient has a history of stroke or cerebrovascular accident resulting from an ischaemic or intracerebral haemorrhagic event, only where the patient suffered a loss of neurological function with residual symptoms remaining for at least 72 h. | No, yes | Binary |
| Previous percutaneous coronary intervention (PCI) | If the patient has had a prior Percutaneous Transluminal Coronary Angioplasty, Coronary Atherectomy, and/or coronary stent performed at any time prior to the current PCI procedure. | No, yes | Binary |
| Previous coronary artery bypass grafting (CABG) | If the patient has had a prior CABG. | No, yes | Binary |
| Pre-procedural medication variables | |||
| Glycoprotein IIb/IIIa inhibitor therapy | Agents include abciximab, eptifibatide, and tirofiban | ||
| Aspirin | Agents include aspirin, astrix, cardiprin, cartia, assasantin, aspro, disprin, and solprin. | ||
| Procedural variable | |||
| Lesion location | Indicate the coronary segment that applies to each coronary lesion attempted during the current PCI. Every coronary lesion attempted during the current PCI must be recorded separately. Up to five lesions per PCI can be recorded.
| Right coronary artery, left anterior descending, circumflex artery, left main, graft | Categorical |
| Lesion complexity | Lesion type according to the ACC/AHA classification guideline for current lesion. Type A: Minimally complex, discrete (<10 mm), concentric, readily accessible, lesion in non-angulated segment (<45 degrees), smooth contour, little or no calcification, less than total occlusion, not ostial in location, no major side branch involvement, absence of thrombus. Type B: Only one type B characteristic—lesion moderately complex, tubular (10–20 mm), eccentric, moderately tortuosity of proximal segments, lesion in moderately angulated segment (>45 degrees but <90 degrees), irregular contour, moderately to heavy calcification, total occlusion less than three months old, ostial in location, bifurcation lesions requiring double guide wires, some thrombus present. Type B2: More than one type B characteristic Type C: severe complex diffuse (>20 mm), excessive tortuosity of proximal segment, lesion in extremely angulated segment >90 degrees, total occlusion greater than 3 months old or bridging collaterals, inability to protect major side branches, degenerated vein graft with friable lesion. | Type A and B Type B2 and C | Binary |
| Chronic total occlusion | Indicate whether the current lesion was presumed to be a chronic total occlusion. Chronic total occlusion is defined as being >3 months old and/or bridging collaterals. | No, yes | Binary |
| Left Ventricular Ejection Fraction (LVEF) | For all patients (excluding STEMIs), indicate whether the patient’s ventricular ejection fraction (EF) was measured (or estimated) within 6 months prior to the current procedure and up to four weeks post-discharge. This includes the period leading up to and including the cardiac catheter lab visit, after the lab visit, and up to four weeks after the patient was discharged. If multiple test results are available during this period, select the test result closest to the date/time of the current PCI. For STEMI patients, a LVEF test must have been recorded during the current admission or up to four weeks post-discharge for this item to be coded ‘yes’. For these patients, where no LVEF test was performed during the current admission or up to four weeks post-discharge, code “no”. EF tests include, but are not limited to, angiography, echocardiography, nuclear stress tests, and imaging scans. | No, yes | Binary |
| True positive | A true positive is an outcome where the model correctly predicts the positive class |
| True negative | A true negative is an outcome where the model correctly predicts the negative class |
| False positive | A false positive is an outcome where the model incorrectly predicts the positive class |
| False negative | A false negative is an outcome where the model incorrectly predicts the negative class. |
| Accuracy | Accuracy tells us the overall proportion of correct predictions made by the model (both true positives and true negatives). Model accuracy is defined as the number of classifications a model correctly predicts divided by the total number of predictions made, which can be represented as: Accuracy = (True positives + True negatives)/(True positives + True negatives + False positives + False negatives). Higher accuracy indicates higher predictive performance |
| Sensitivity/recall | Sensitivity measures the model’s ability to correctly identify patients who truly have the outcome (e.g., mortality or major bleeding) Sensitivity refers to a test’s ability to designate an individual with a given disease as positive. A highly sensitive test means that there are few false negative results, and thus fewer cases of disease are missed. Sensitivity = true positive/(false negative + true positive) Higher sensitivity indicates higher predictive performance |
| Specificity | Specificity measures the model’s ability to correctly identify patients who do not have the outcome. Specificity measures the proportion of true negatives that are correctly identified by the model. Specificity = true negative/(true negative + false positive) Higher specificity indicates higher predictive performance |
| Precision | Precision measures the proportion of correctly predicted positive cases out of all predicted positive cases Precision ensures clinicians trust the model’s positive predictions, making it valuable for decision-making and resource allocation. High precision indicates that when the model flags a patient as “high risk” (or the test gives a positive result), it is usually correct, whereas low precision means that many patients identified as “at risk” do not actually experience the outcome, leading to false alarms and potentially unnecessary interventions. The formula for precision (also called positive predictive value, PPV) is: Precision = True positive/(True positive + False positive) A higher precision value indicates higher predictive performance |
| F1 score | The F1 score is the harmonic mean of precision and recall, balancing both metrics. It is calculated as follows: F1 = 2∗(Precision*recall)/(Precision + Recall) The F1 score provides a balanced measure of a model’s ability to correctly identify patients at risk while minimizing false alarms. It combines both precision (how often a predicted “high risk” is truly correct) and recall/sensitivity (how well the model captures all true high-risk patients). A high F1 score means the model not only identifies most patients who will develop the outcome but also avoids over-predicting risk, making it useful in guiding clinical decision-making where both missed cases and false positives carry important consequences. Interpretation:
The F1 score is crucial for imbalanced datasets, where accuracy alone can be misleading. |
| Receiver Operating Characteristics (ROC) | The ROC-AUC reflects how well a risk prediction model can discriminate between patients who will experience an adverse outcome (e.g., death or major bleeding) and those who will not. An AUC close to 1.0 indicates excellent discrimination, meaning the model reliably assigns higher risk scores to patients who truly experience the outcome compared to those who do not. An AUC around 0.5 suggests no better than chance, while values between 0.7 and 0.8 are considered acceptable and above 0.8 good for clinical use. In practice, a higher ROC-AUC means clinicians can more confidently use the model for risk stratification, tailoring interventions, and improving patient management decisions. The plot of sensitivity versus 1-Specificity is called the receiver operating characteristic (ROC) curve and the area under the curve (AUC). The mathematical formula of AUC is as follows: ROC = |
| Concordance Index (C-index) | The C-index is a commonly used metric to evaluate the predictive accuracy of survival models. It measures the model’s ability to correctly rank pairs of individuals based on their predicted risk scores relative to their actual survival times. Specifically, it estimates the probability that, for a randomly selected pair of patients, the one who experiences the event earlier also has a higher predicted risk. The C-index ranges from 0.5 (no better than random chance) to 1.0 (perfect prediction). It naturally handles censored data by only considering comparable pairs where the order of events can be determined. A higher C-index indicates a better discriminative ability of the survival model when distinguishing between high-risk and low-risk individuals. The C-index for survival data can be expressed as follows:
|
| Brier score | The Brier Score is a measure of the accuracy of probabilistic predictions. It evaluates how close the predicted probabilities are to the actual binary outcomes. Brier score = 1/N where
The Brier Score ranges from 0 to 1, where 0 indicates perfect predictions, 1 represents completely incorrect predictions, and lower scores signify better calibration and accuracy of probabilistic predictions. In practice, a lower Brier score indicates that clinicians can trust the model’s probability estimates for individual patients, making it more useful for guiding shared decision-making, personalized care, and risk communication with patients. |
| Integrated Brier Score (IBS) | The IBS is a metric used to evaluate the overall accuracy of survival models over time. It measures the mean squared difference between the predicted survival probabilities and the actual survival status, integrated over a specified time interval. The Brier score at a specific time t is calculated as follows: BS(t) = where
The IBS is the time-integral of the Brier score over the interval [0, τ], usually normalized by the length of the interval: IBS = Lower IBS values indicate better prediction accuracy, with 0 being perfect prediction. |
| Items | Hyperparameter Optimization | Cross-Validation (k-Fold) | Parameters | Thresholds |
|---|---|---|---|---|
| Gradian Booster (GB) | Grid search | 10 folds | n_estimators, min_samples_split, min_sample_leaf, learning_rate, learning_rate, max_features, sub_smaple, scoring, n_jobs, random_state | 0.5 |
| Logistic Regression (LR) | Grid search | 10 folds | random_state, C, penalty, solver, scoring | 0.5 |
| Random Forest (RF) | Grid search | 10 folds | n_estimators, min_samples_split, max_features | 0.5 |
| Extreme Gradient Booster (XGB) | Grid search | 10 folds | random_state, objective, alpha, gamme, eval_metrics, eta, learning_rate, max_delta_step, nthread, n_estimators, max_depth, min_child_weight, colsample_bytree, colsample_bylevel, scoring | 0.5 |
| Cox Proportional hazard model (CoxPH) | 10 folds | Penalizer, random_state | ||
| Gradient Boosting Survival (GBS) | 10 folds | n_estimators, learning_rate, max_depth, subsample, random_state | ||
| Multilayer Perceptron (MLP) | 10 folds | fc1, fc2, fc_event, fc_time | ||
| Random Survival Forest Survival (RSF) | 10 folds | n_estimators, min_samples_split, random_state |
Disclaimer/Publisher’s Note: The statements, opinions and data contained in all publications are solely those of the individual author(s) and contributor(s) and not of MDPI and/or the editor(s). MDPI and/or the editor(s) disclaim responsibility for any injury to people or property resulting from any ideas, methods, instructions or products referred to in the content. |
© 2025 by the authors. Licensee MDPI, Basel, Switzerland. This article is an open access article distributed under the terms and conditions of the Creative Commons Attribution (CC BY) license (https://creativecommons.org/licenses/by/4.0/).
Share and Cite
Chowdhury, M.R.K.; Rashid, M.; Stub, D.; Dinh, D.; Karim, M.N.; Billah, B. A Study Protocol on Risk Prediction Modelling of Mortality and In-Hospital Major Bleeding Following Percutaneous Coronary Intervention in an Australian Population: Machine Learning Approach. Methods Protoc. 2025, 8, 148. https://doi.org/10.3390/mps8060148
Chowdhury MRK, Rashid M, Stub D, Dinh D, Karim MN, Billah B. A Study Protocol on Risk Prediction Modelling of Mortality and In-Hospital Major Bleeding Following Percutaneous Coronary Intervention in an Australian Population: Machine Learning Approach. Methods and Protocols. 2025; 8(6):148. https://doi.org/10.3390/mps8060148
Chicago/Turabian StyleChowdhury, Mohammad Rocky Khan, Mamunur Rashid, Dion Stub, Diem Dinh, Md Nazmul Karim, and Baki Billah. 2025. "A Study Protocol on Risk Prediction Modelling of Mortality and In-Hospital Major Bleeding Following Percutaneous Coronary Intervention in an Australian Population: Machine Learning Approach" Methods and Protocols 8, no. 6: 148. https://doi.org/10.3390/mps8060148
APA StyleChowdhury, M. R. K., Rashid, M., Stub, D., Dinh, D., Karim, M. N., & Billah, B. (2025). A Study Protocol on Risk Prediction Modelling of Mortality and In-Hospital Major Bleeding Following Percutaneous Coronary Intervention in an Australian Population: Machine Learning Approach. Methods and Protocols, 8(6), 148. https://doi.org/10.3390/mps8060148

