
Establishing Newborn Screening for SCID in the USA: Experience in California †


Abstract
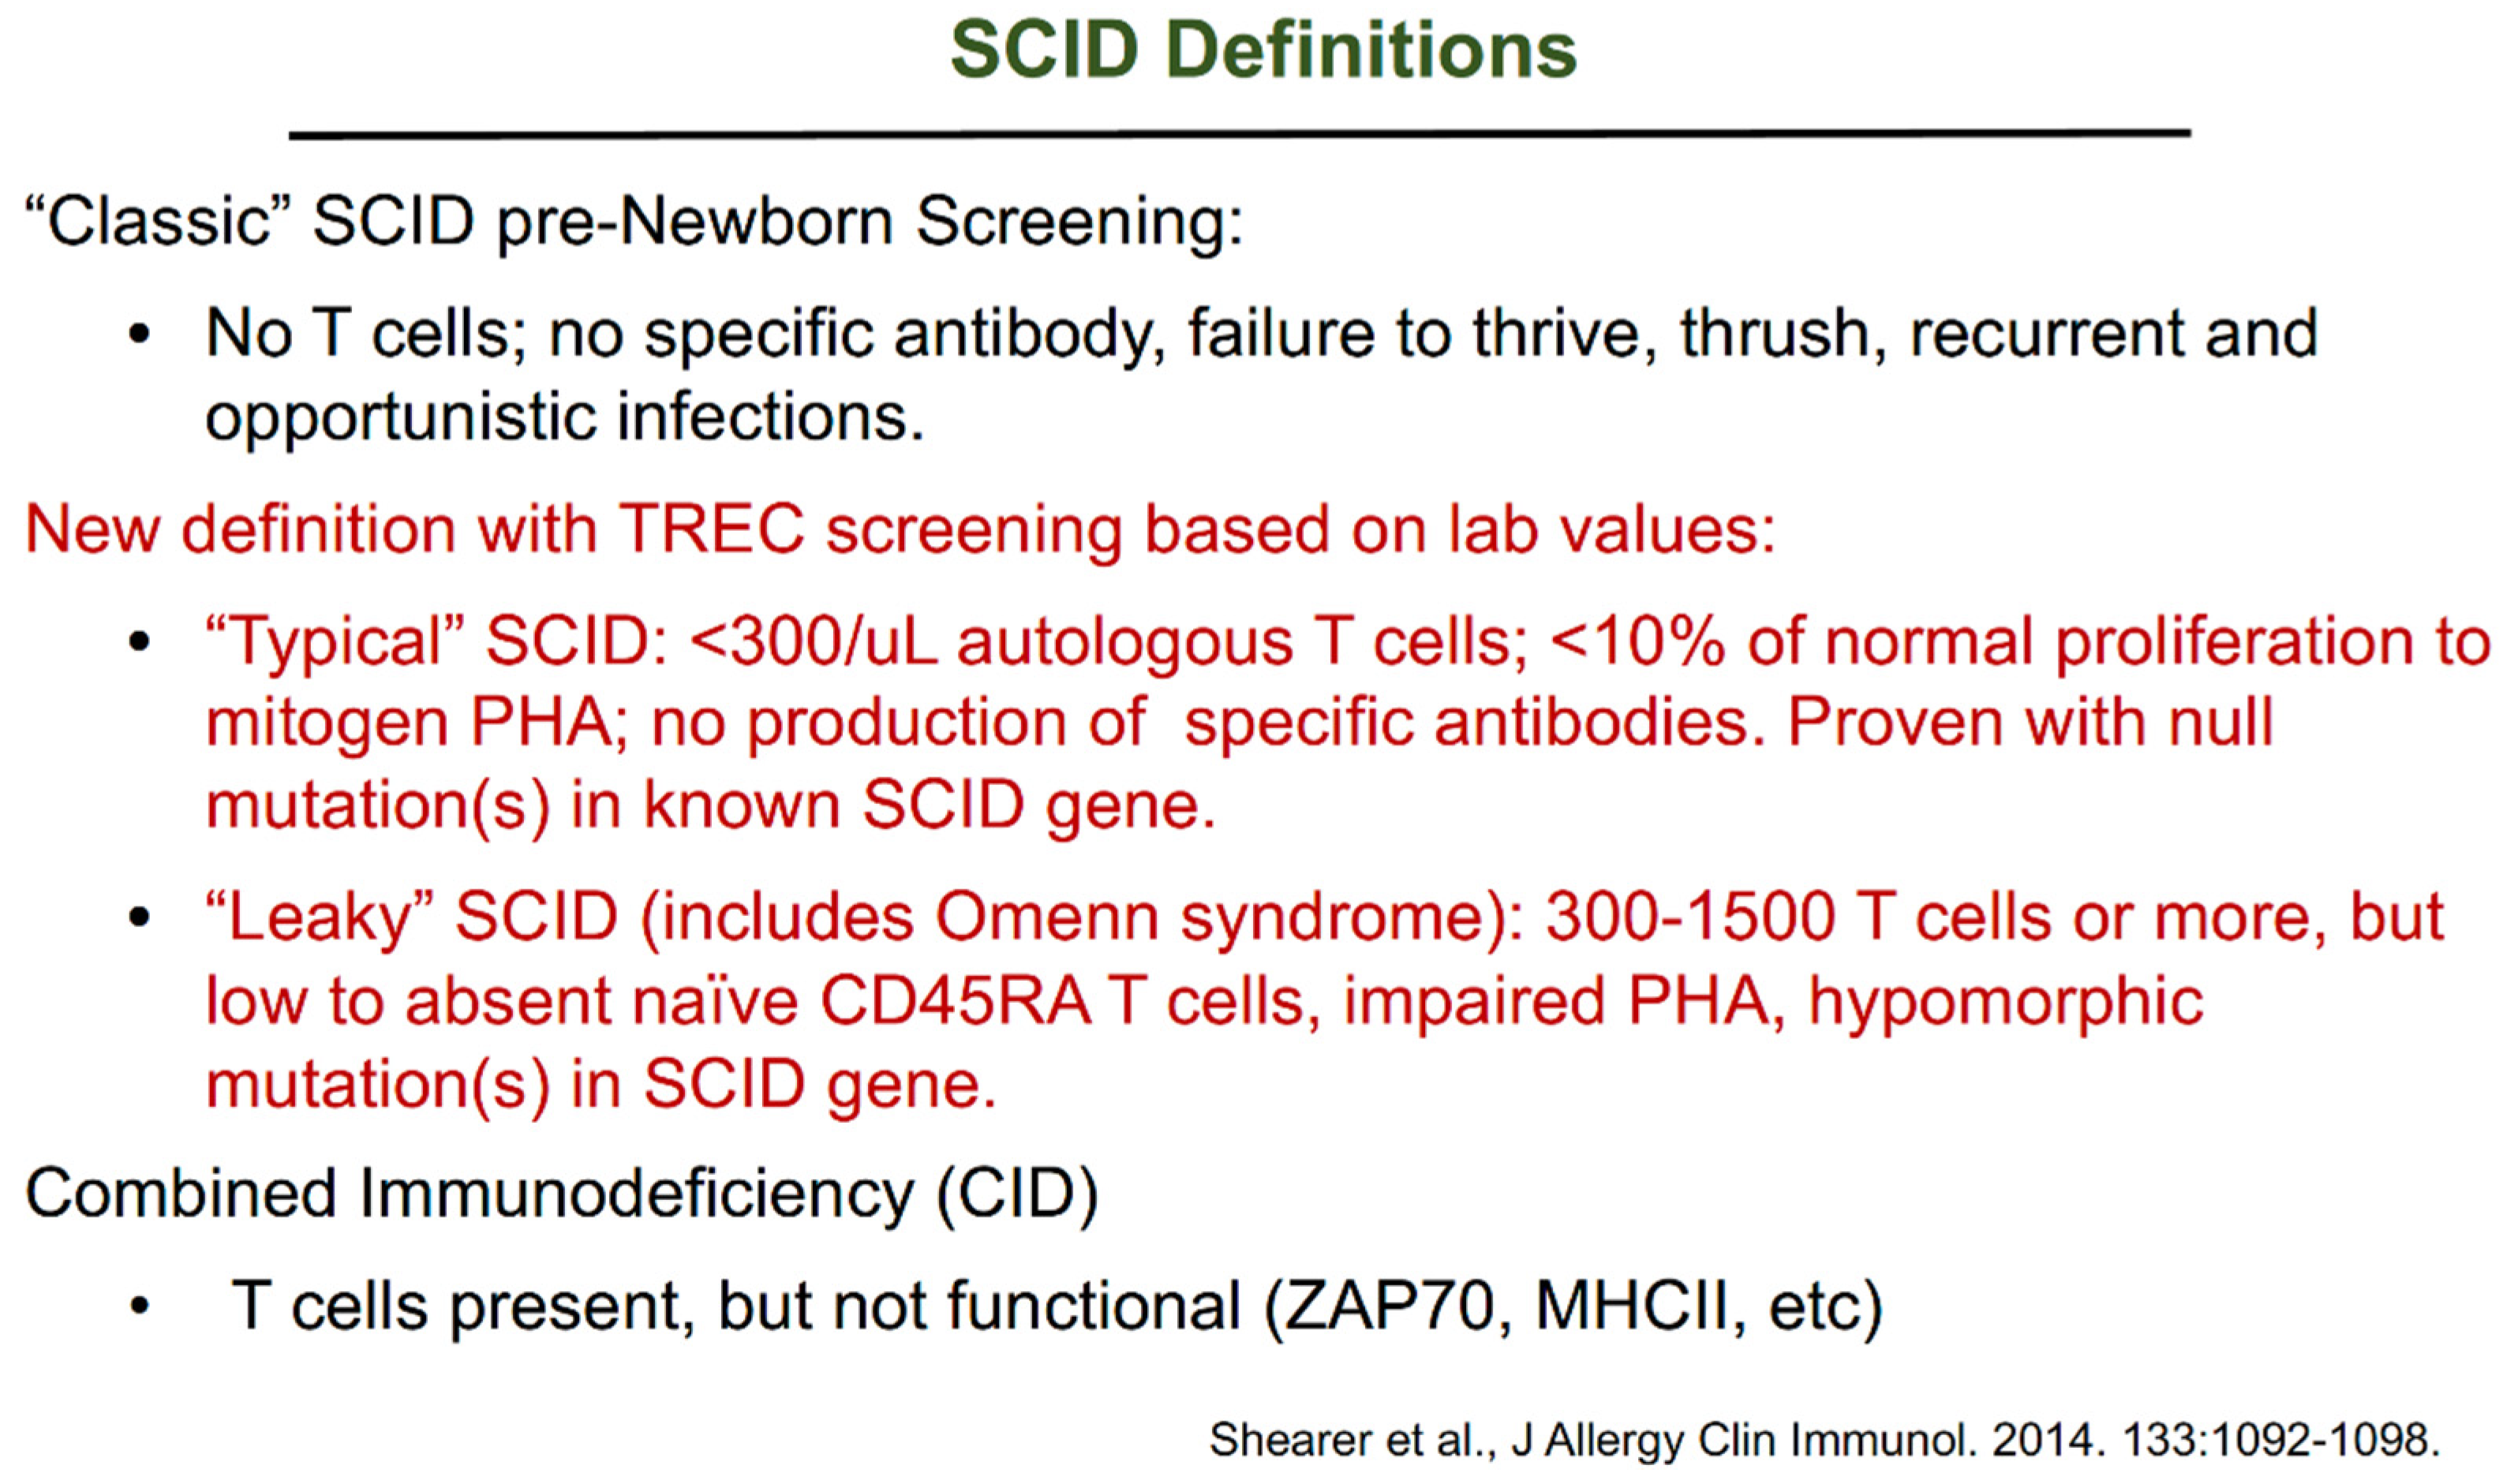
:1. Introduction to Severe Combined Immunodeficiency (SCID)
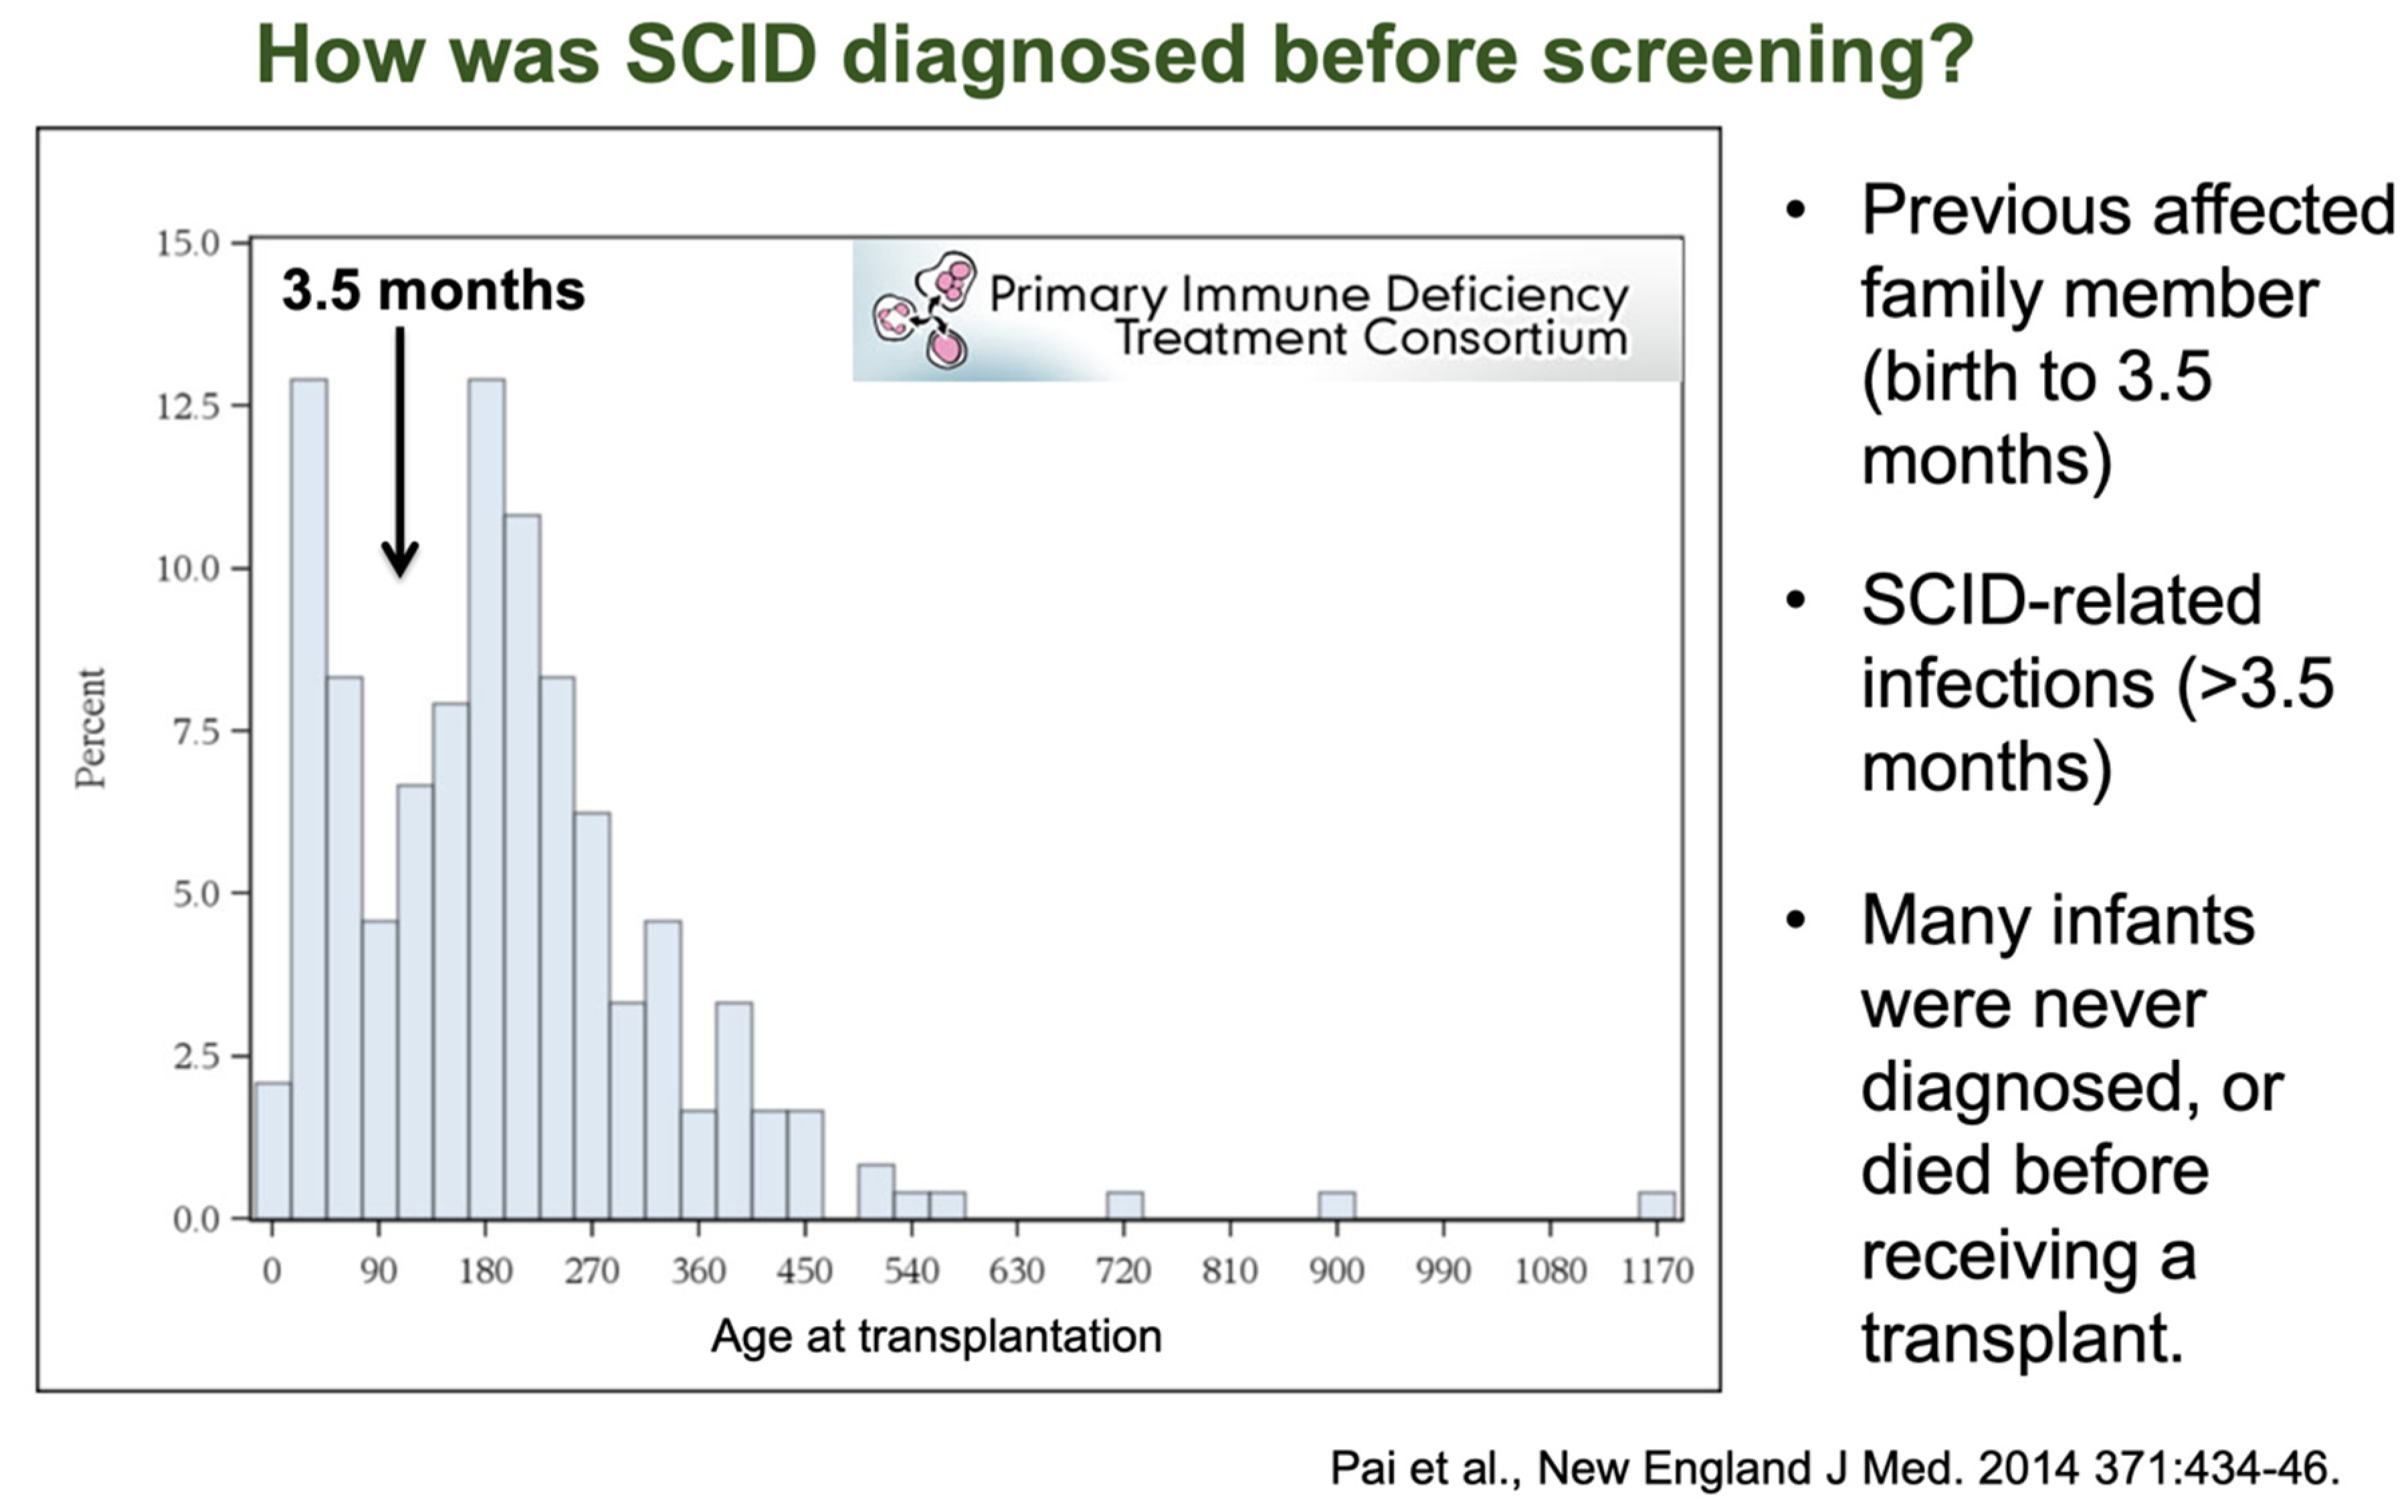
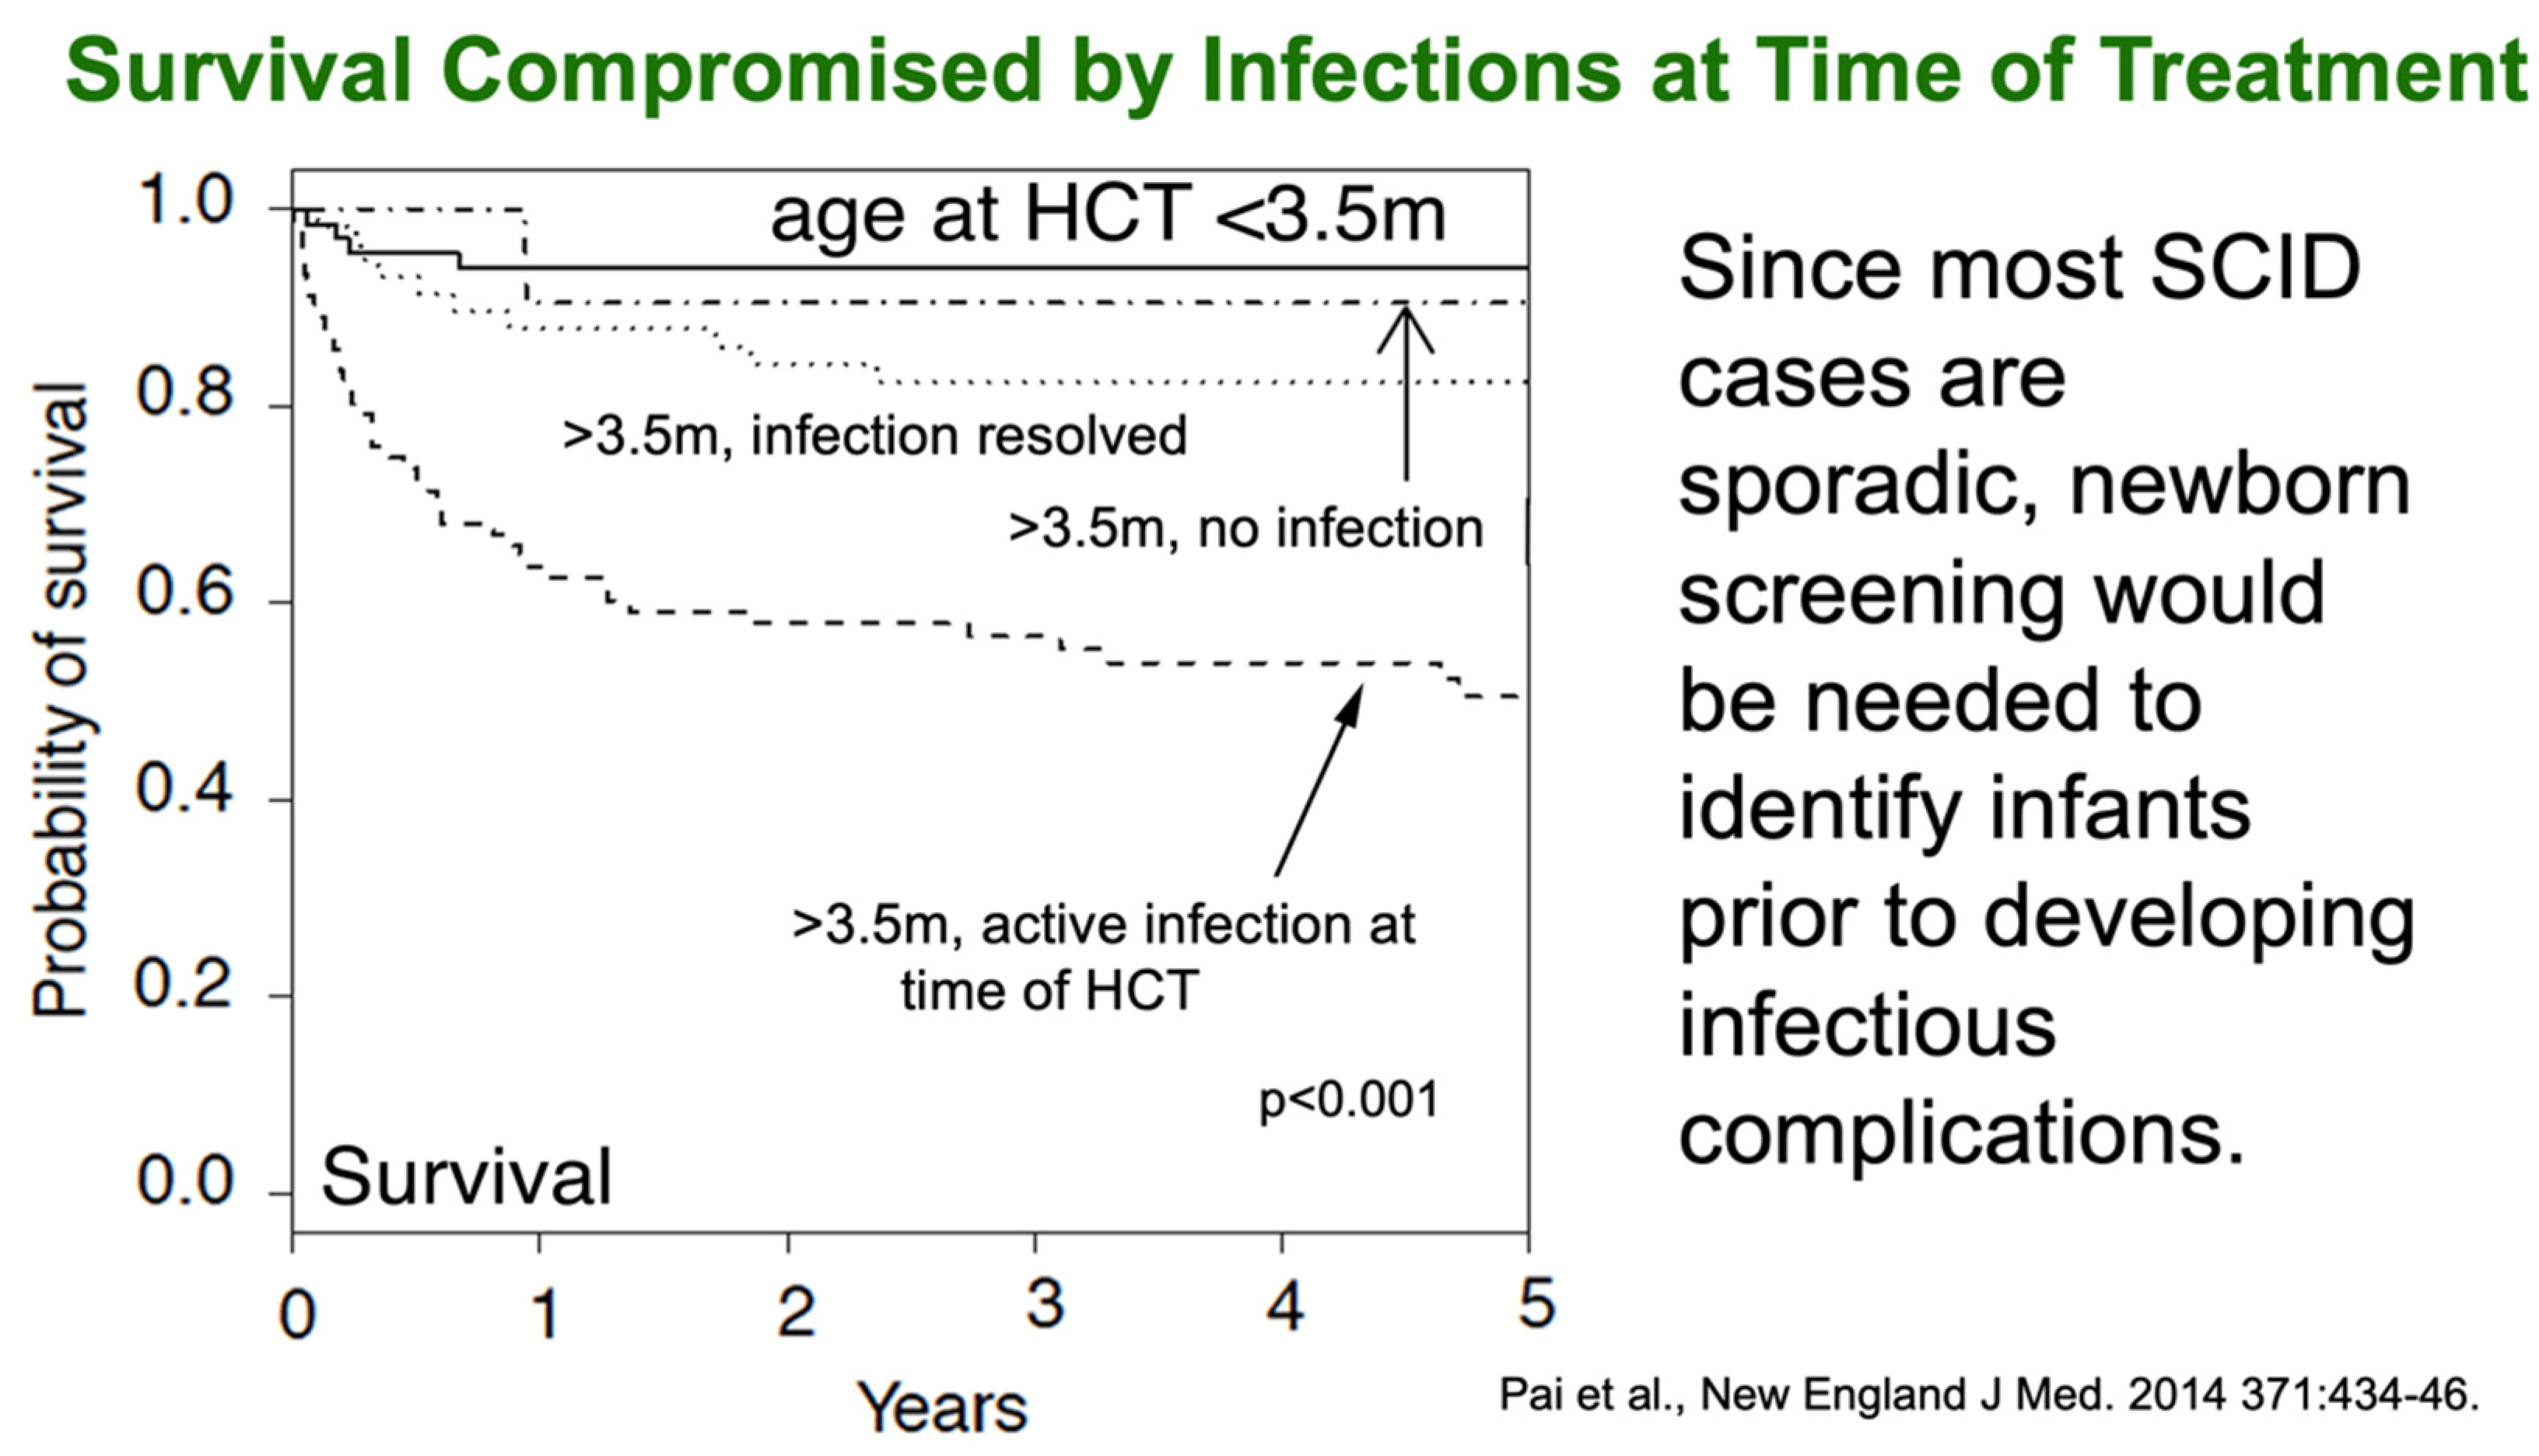
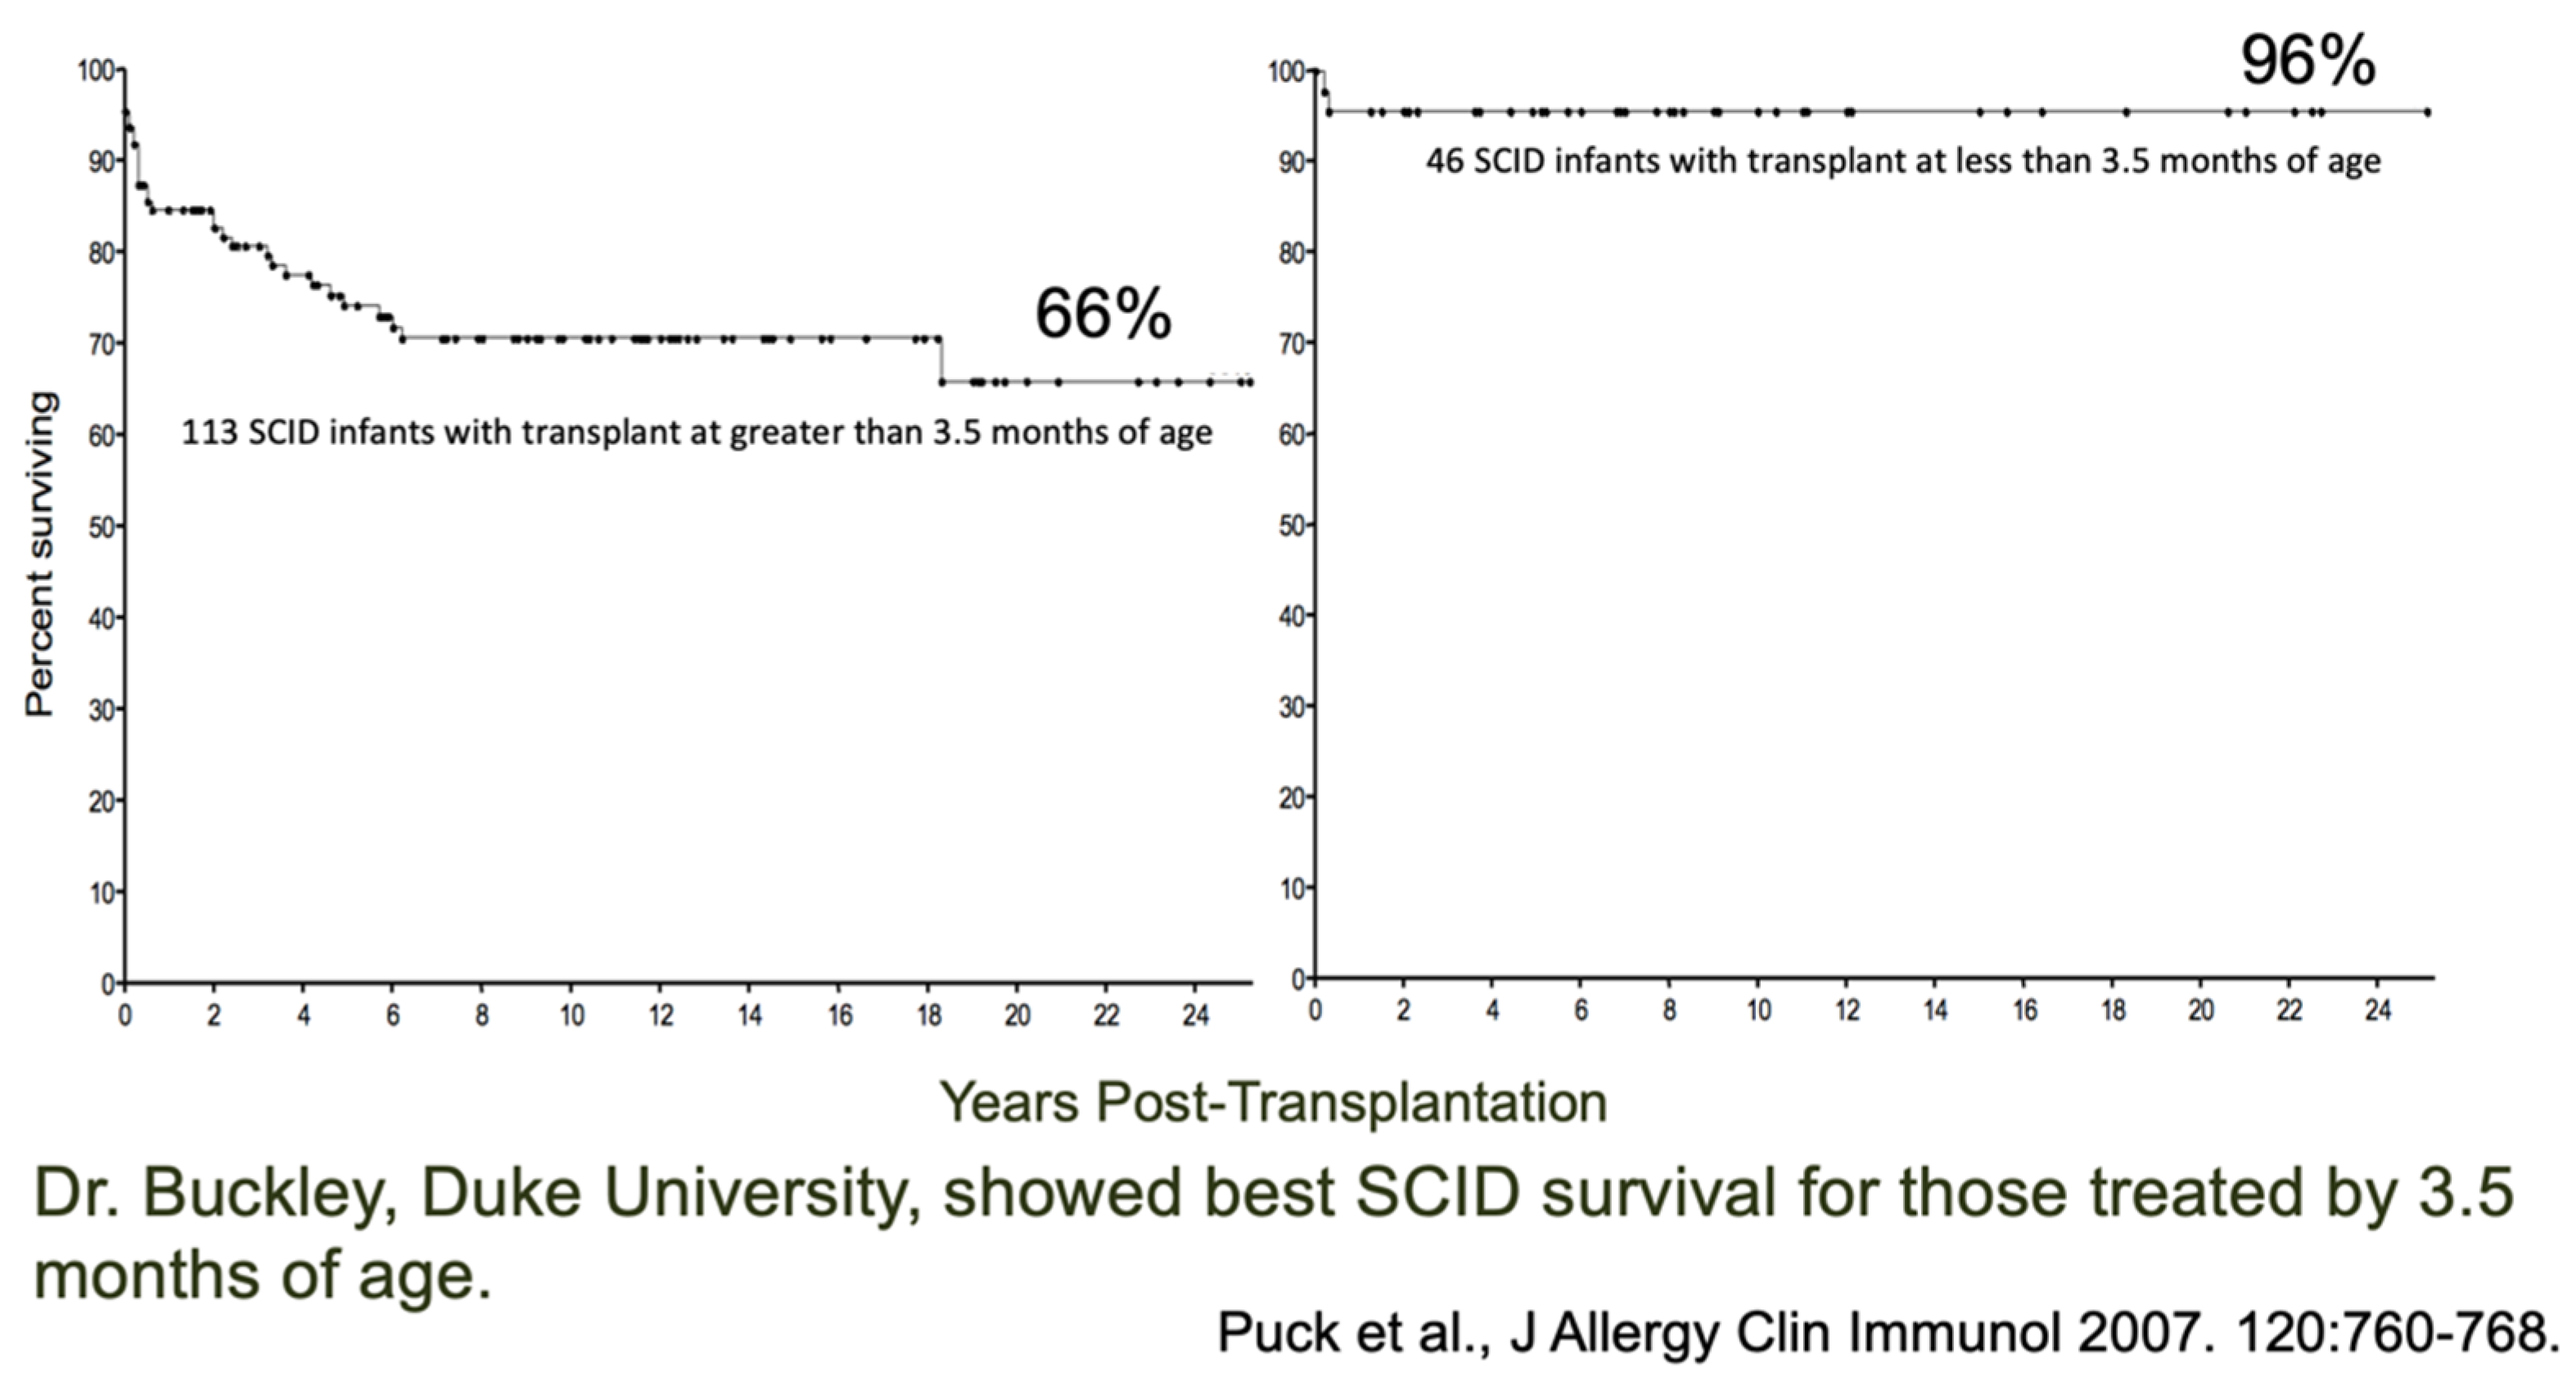
2. Justification for Performing Newborn Screening for SCID
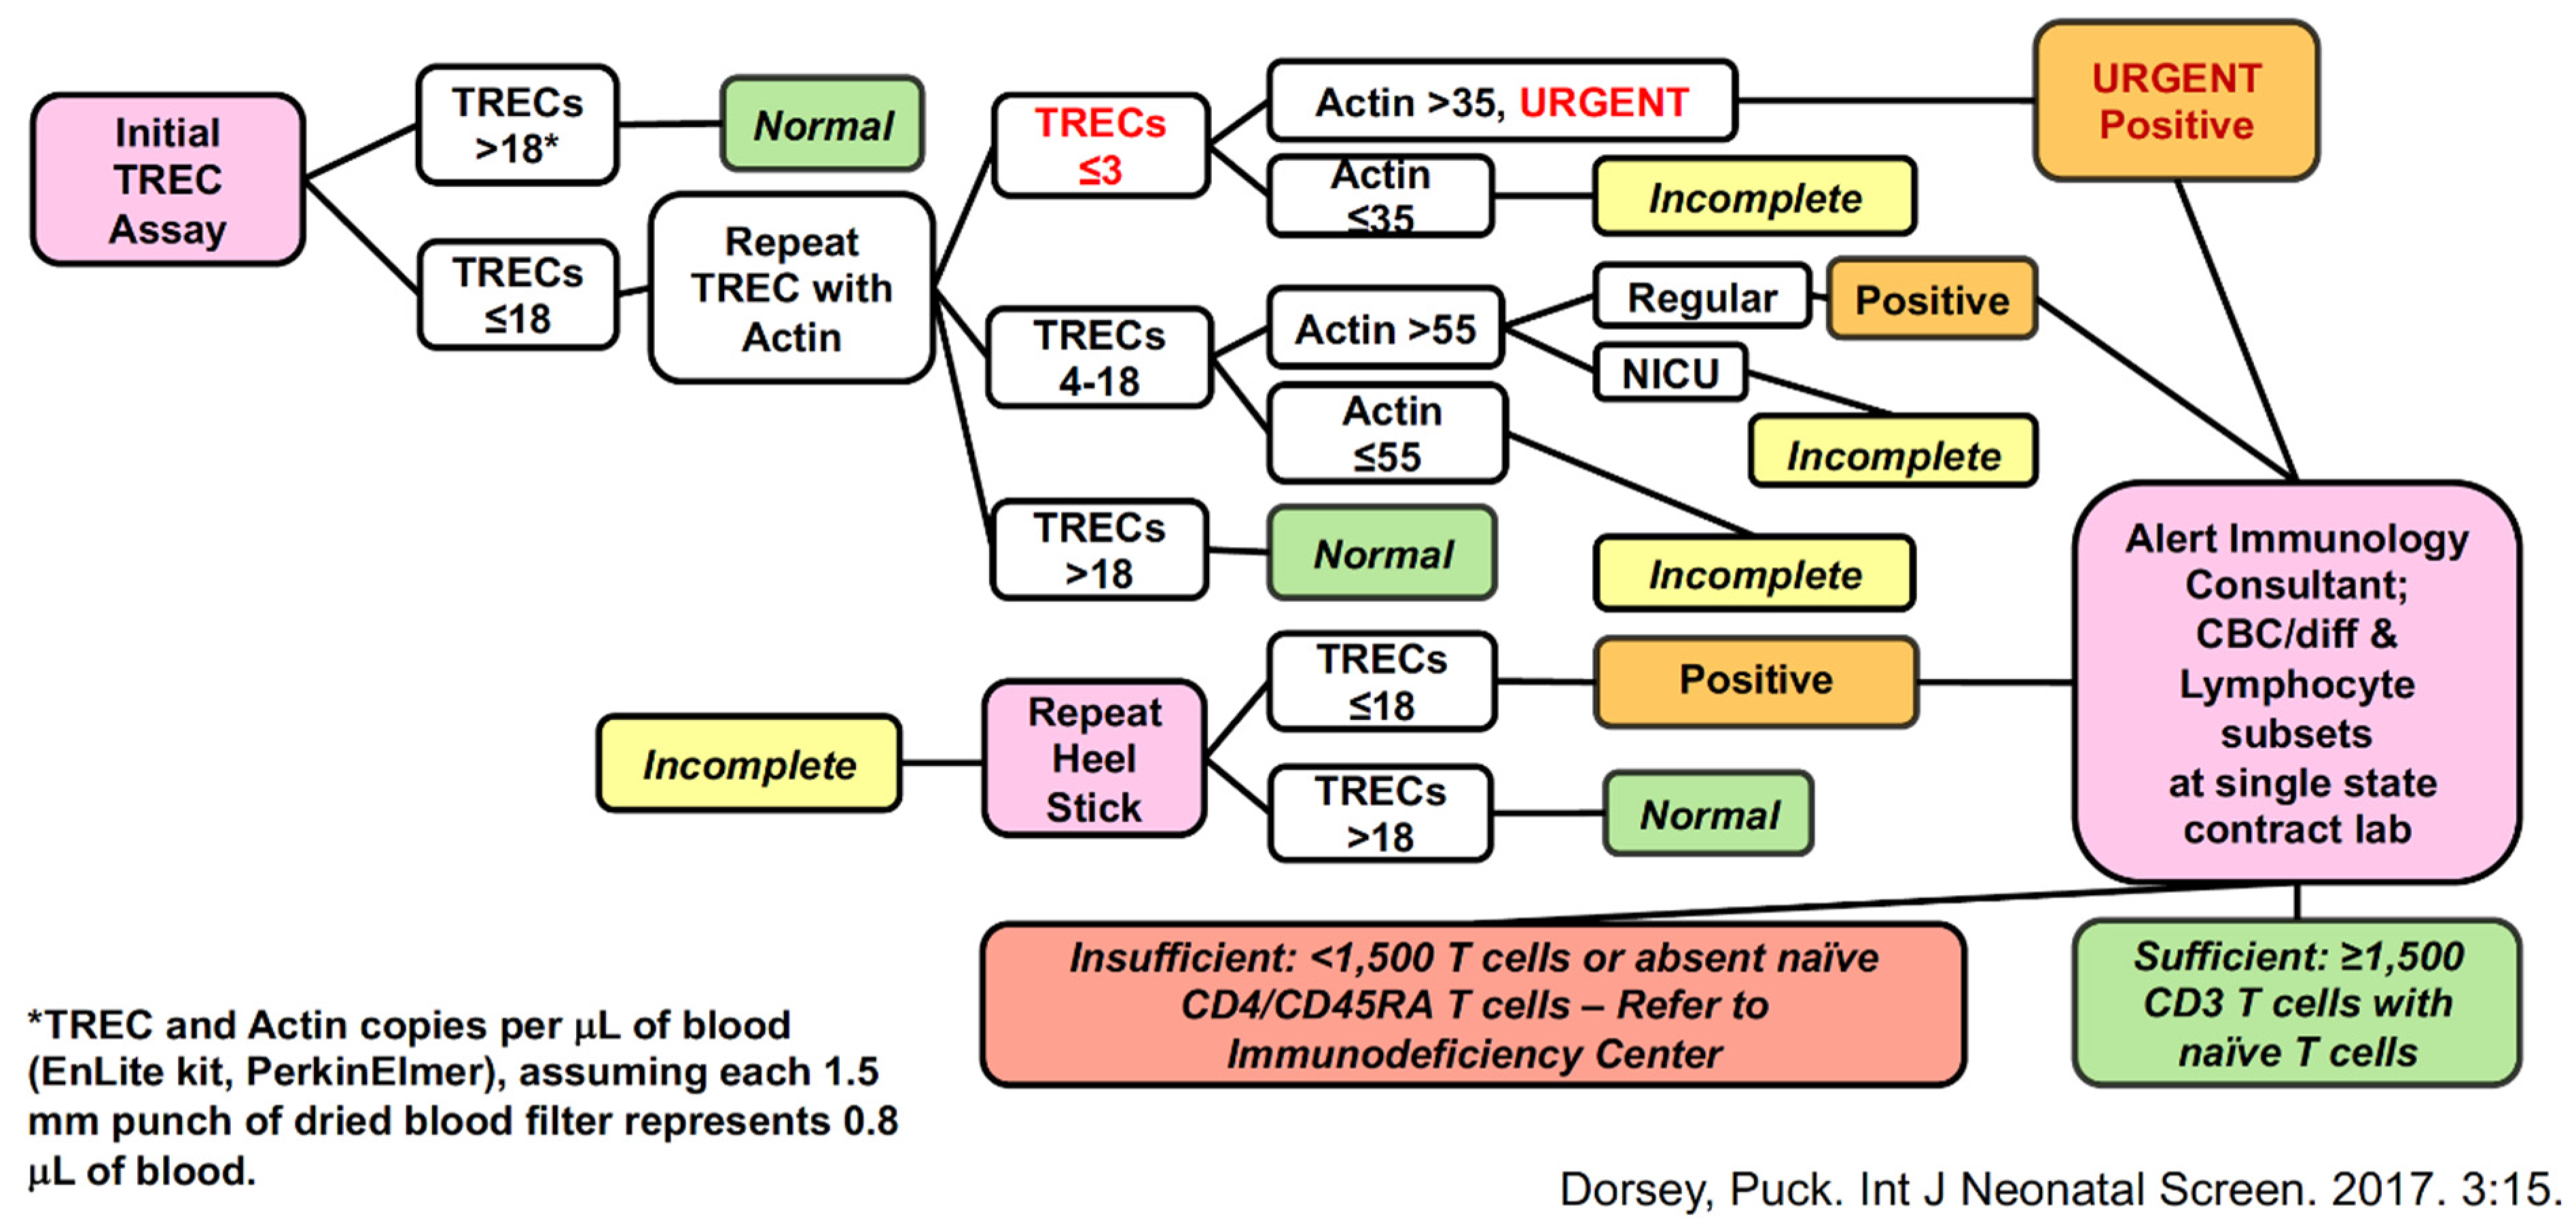
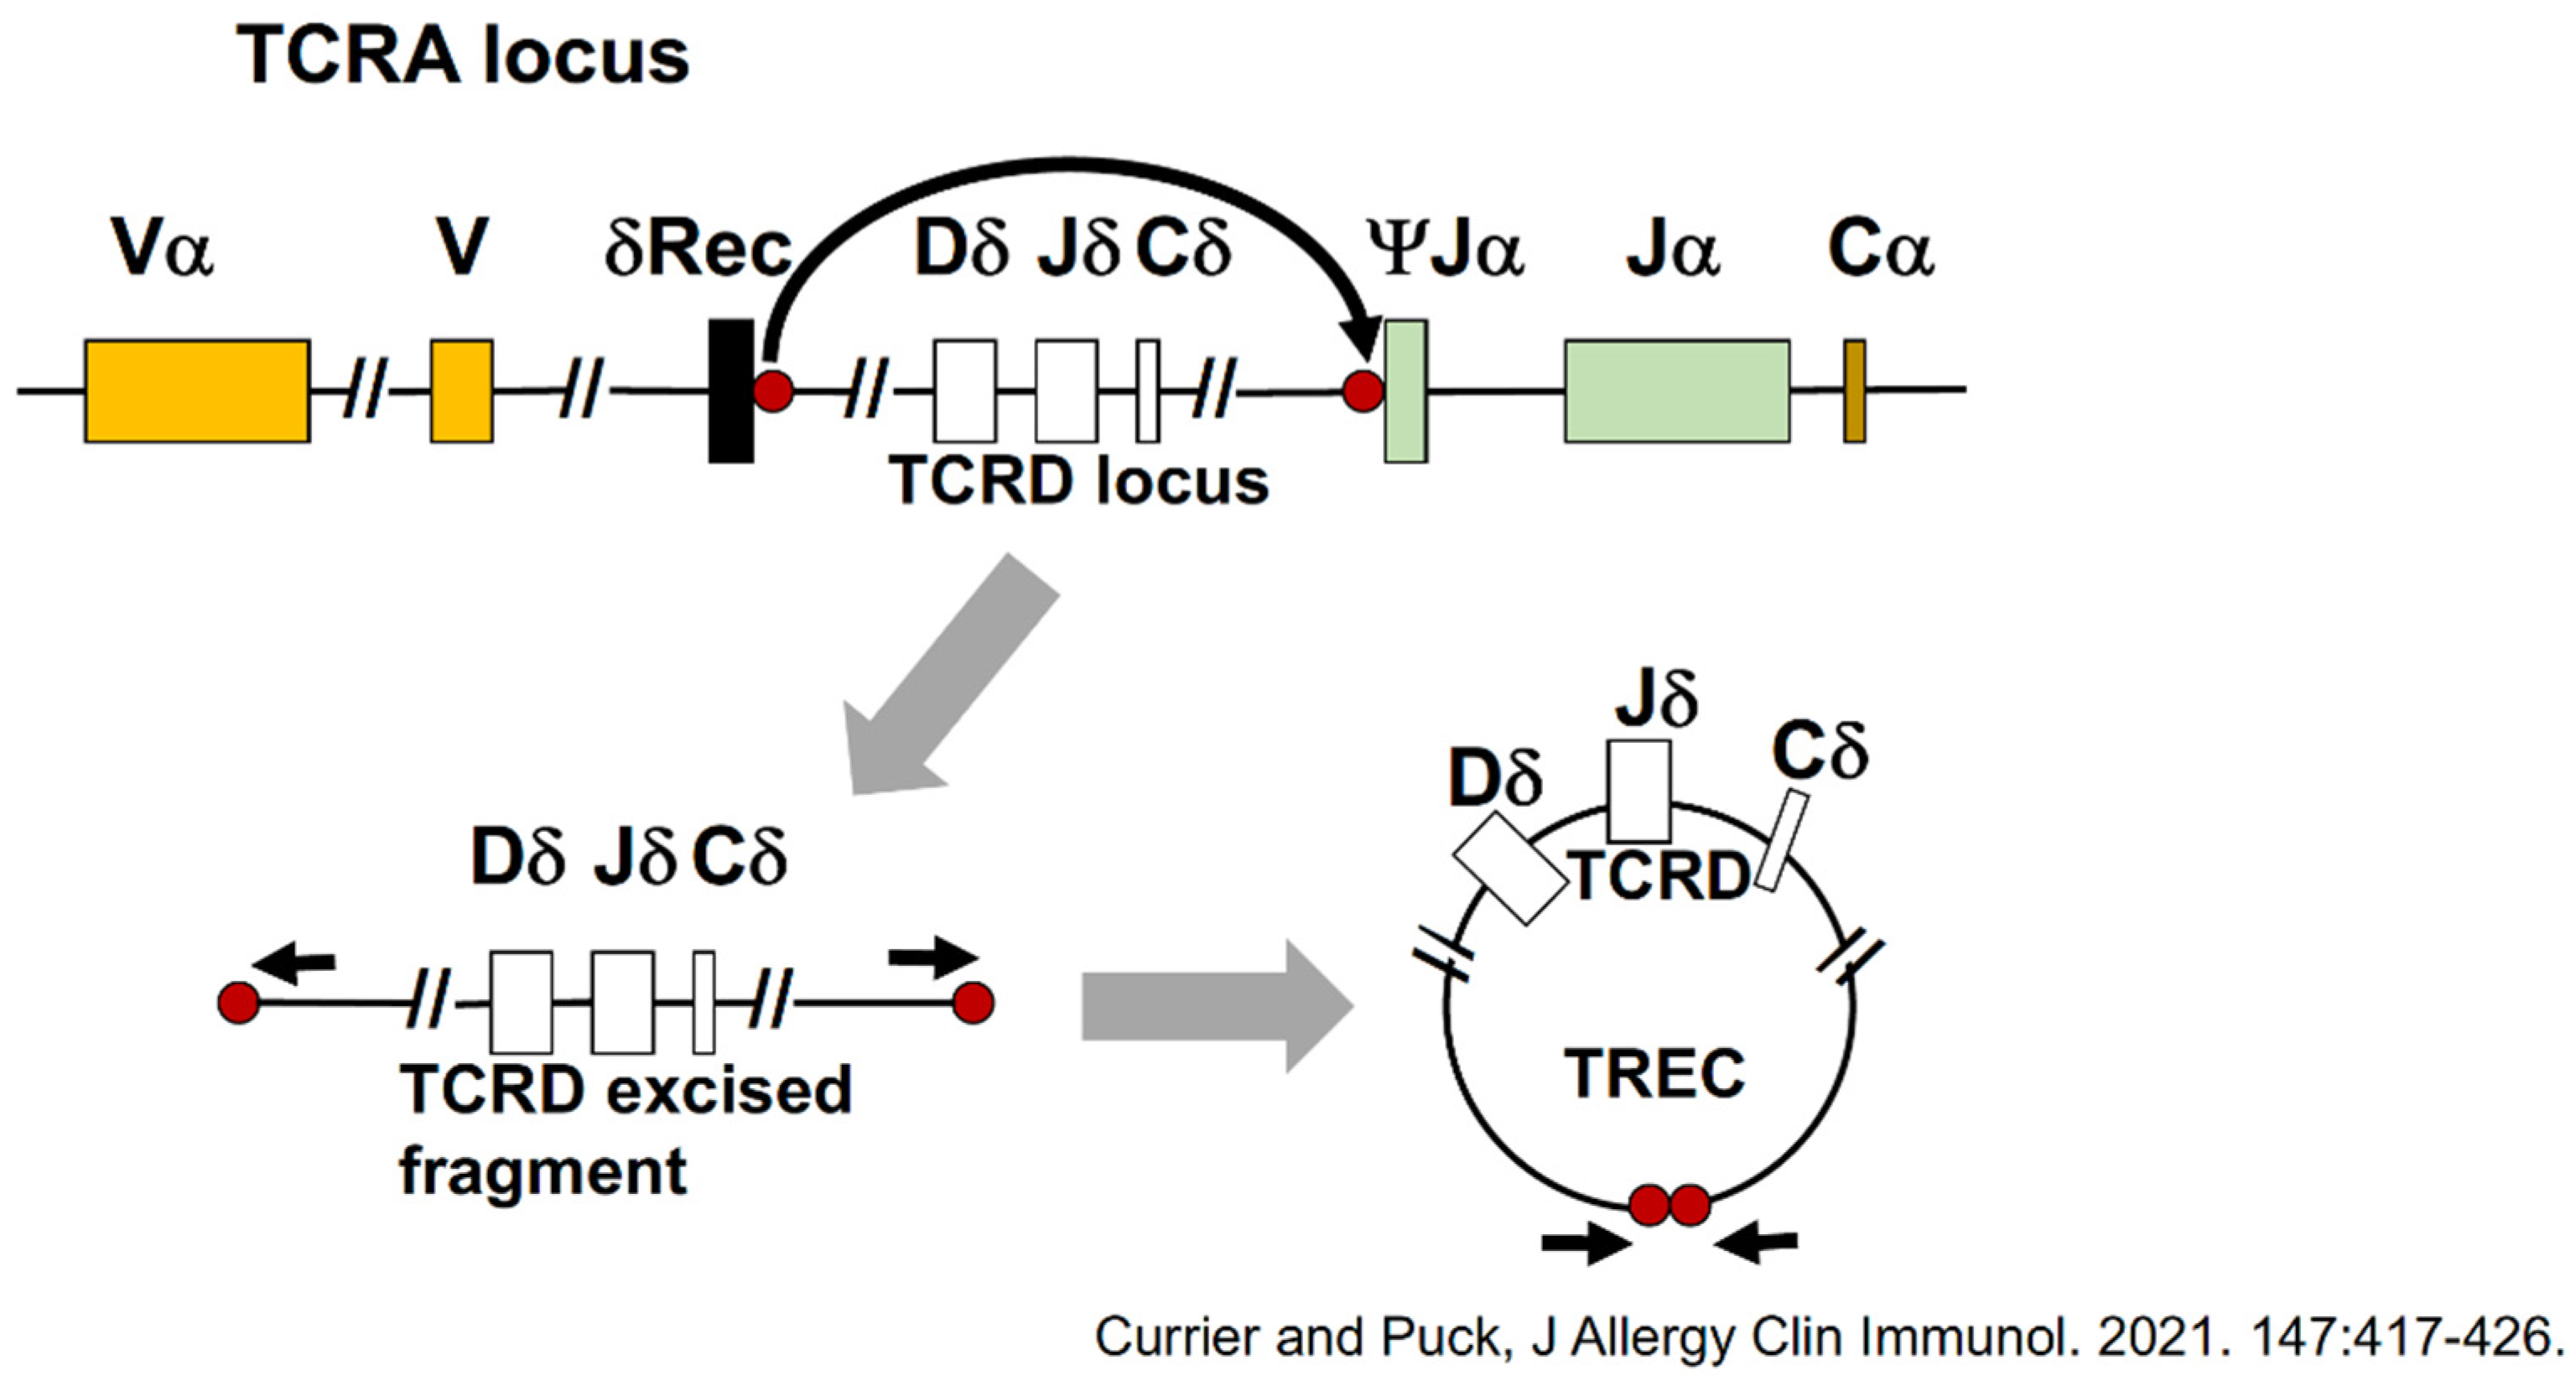
3. Screening Test to Detect SCID: T-Cell Receptor Excision Circles (TRECs)
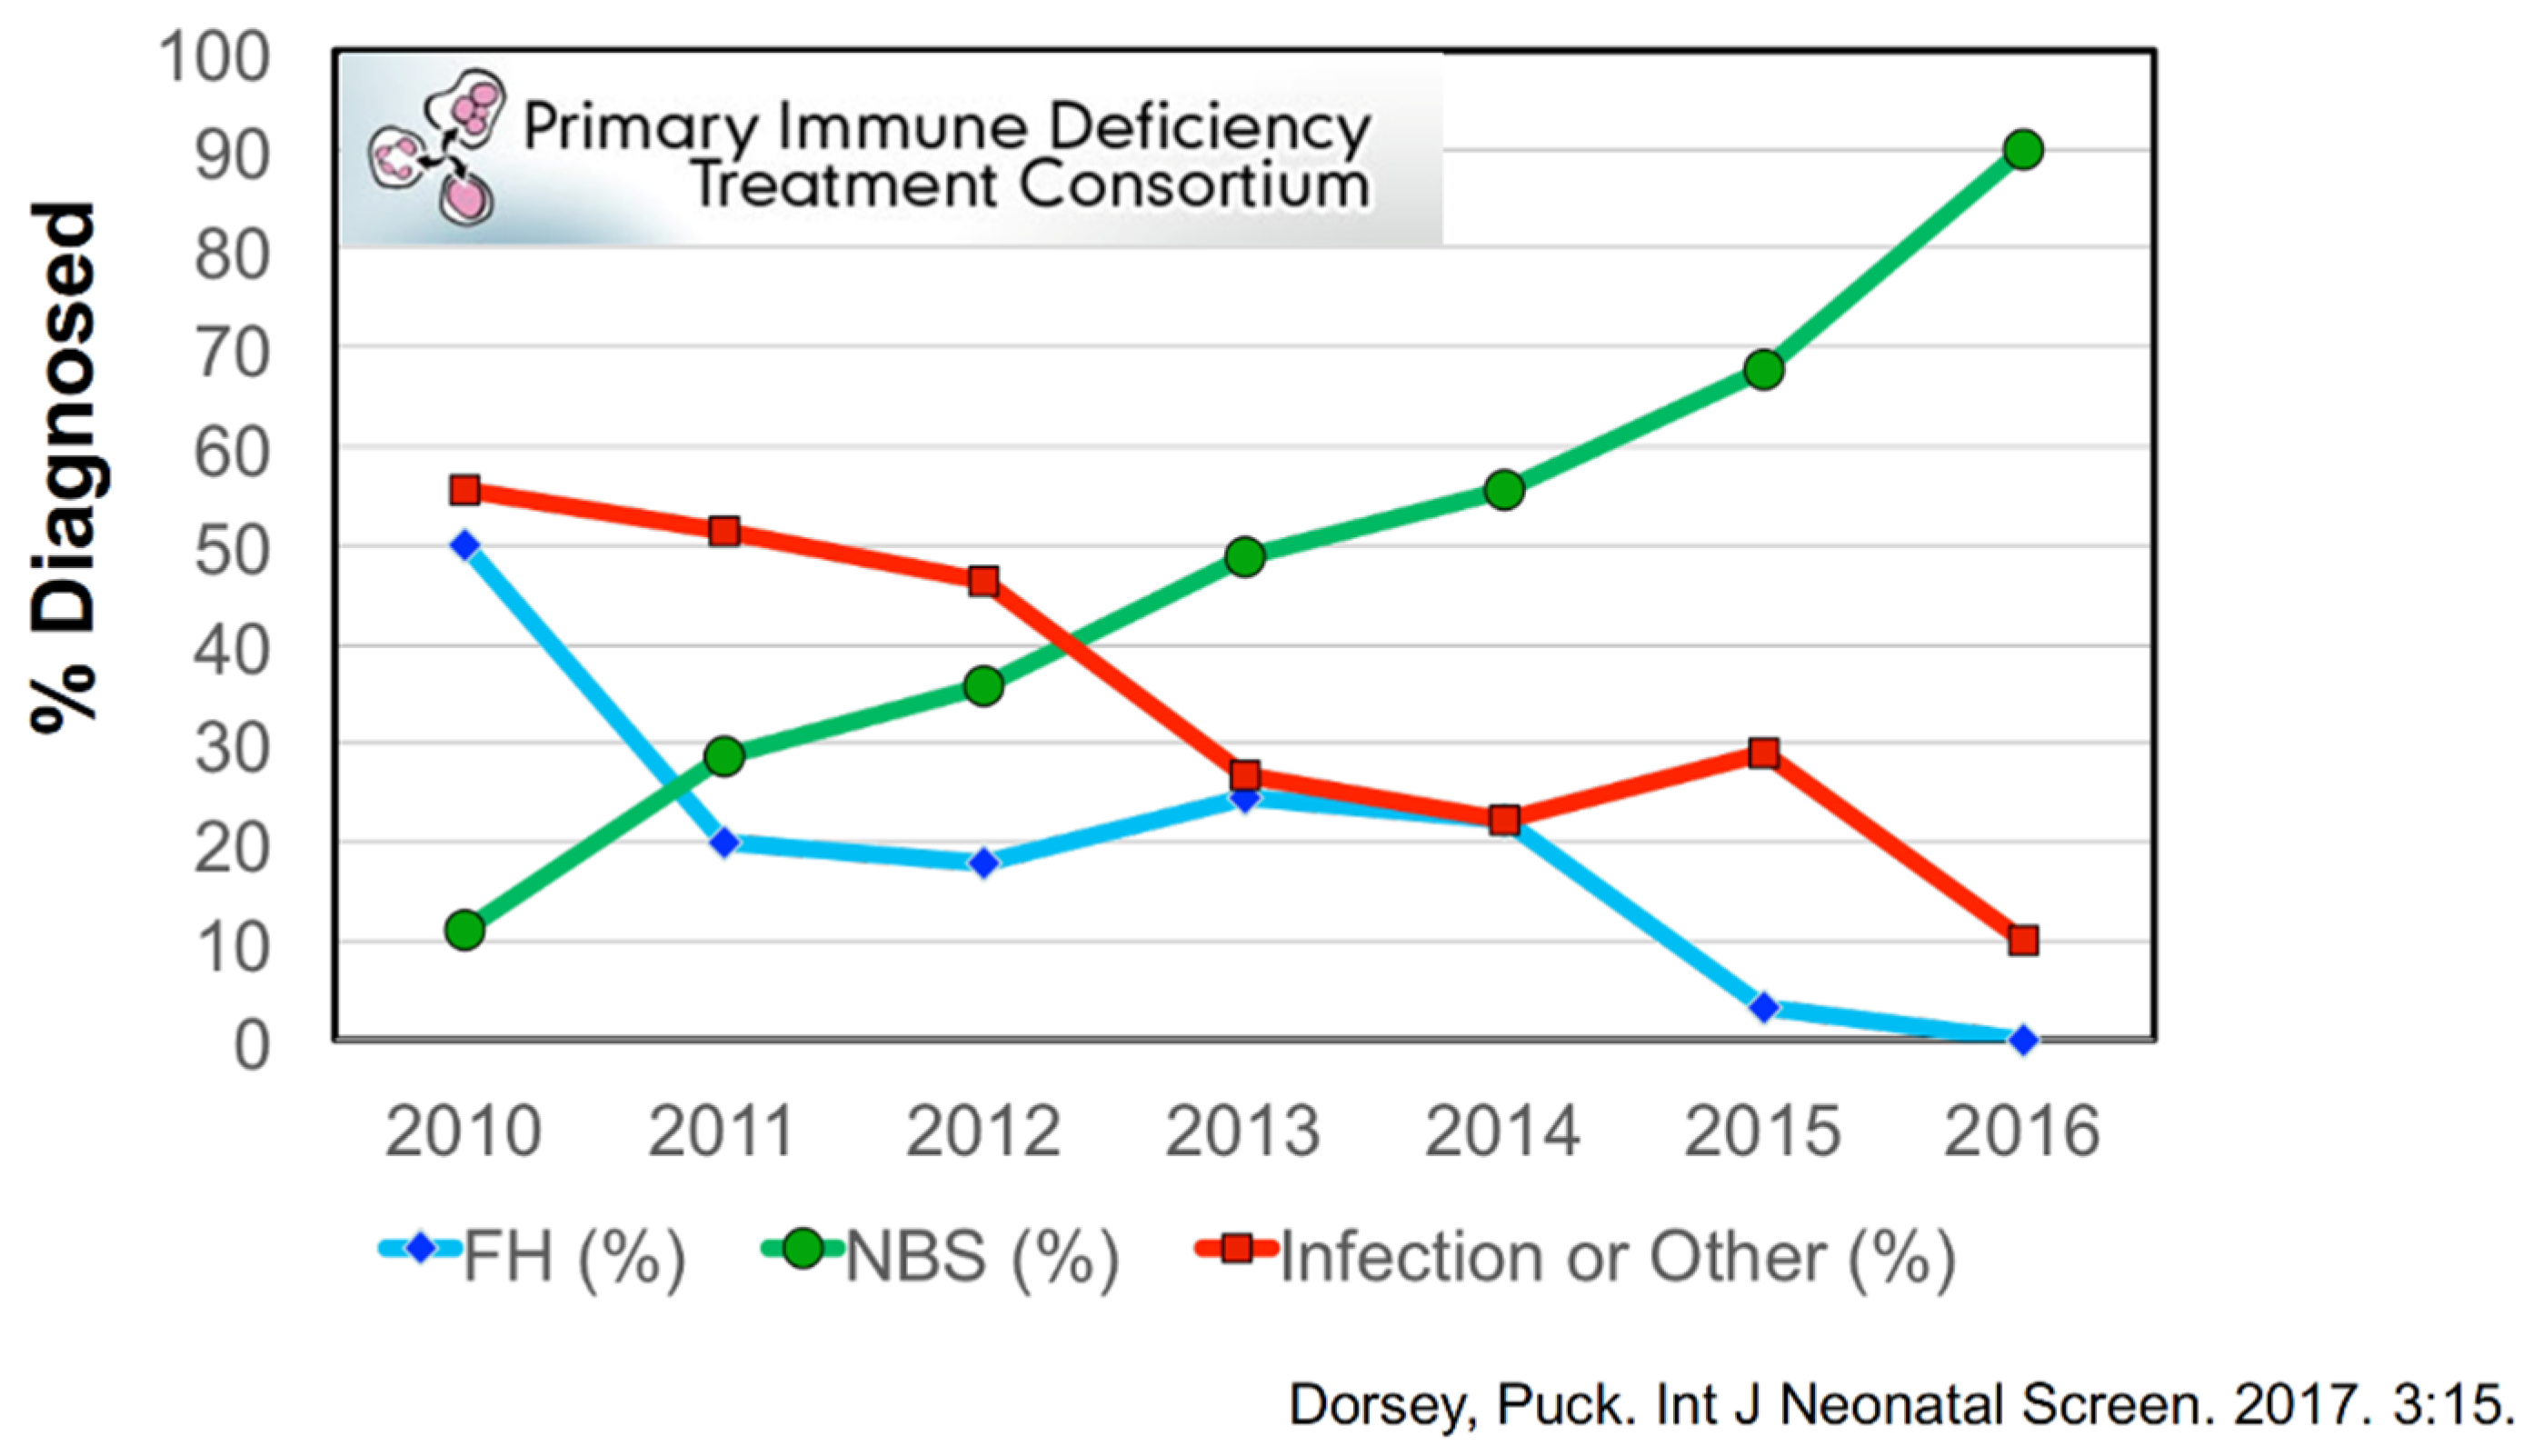
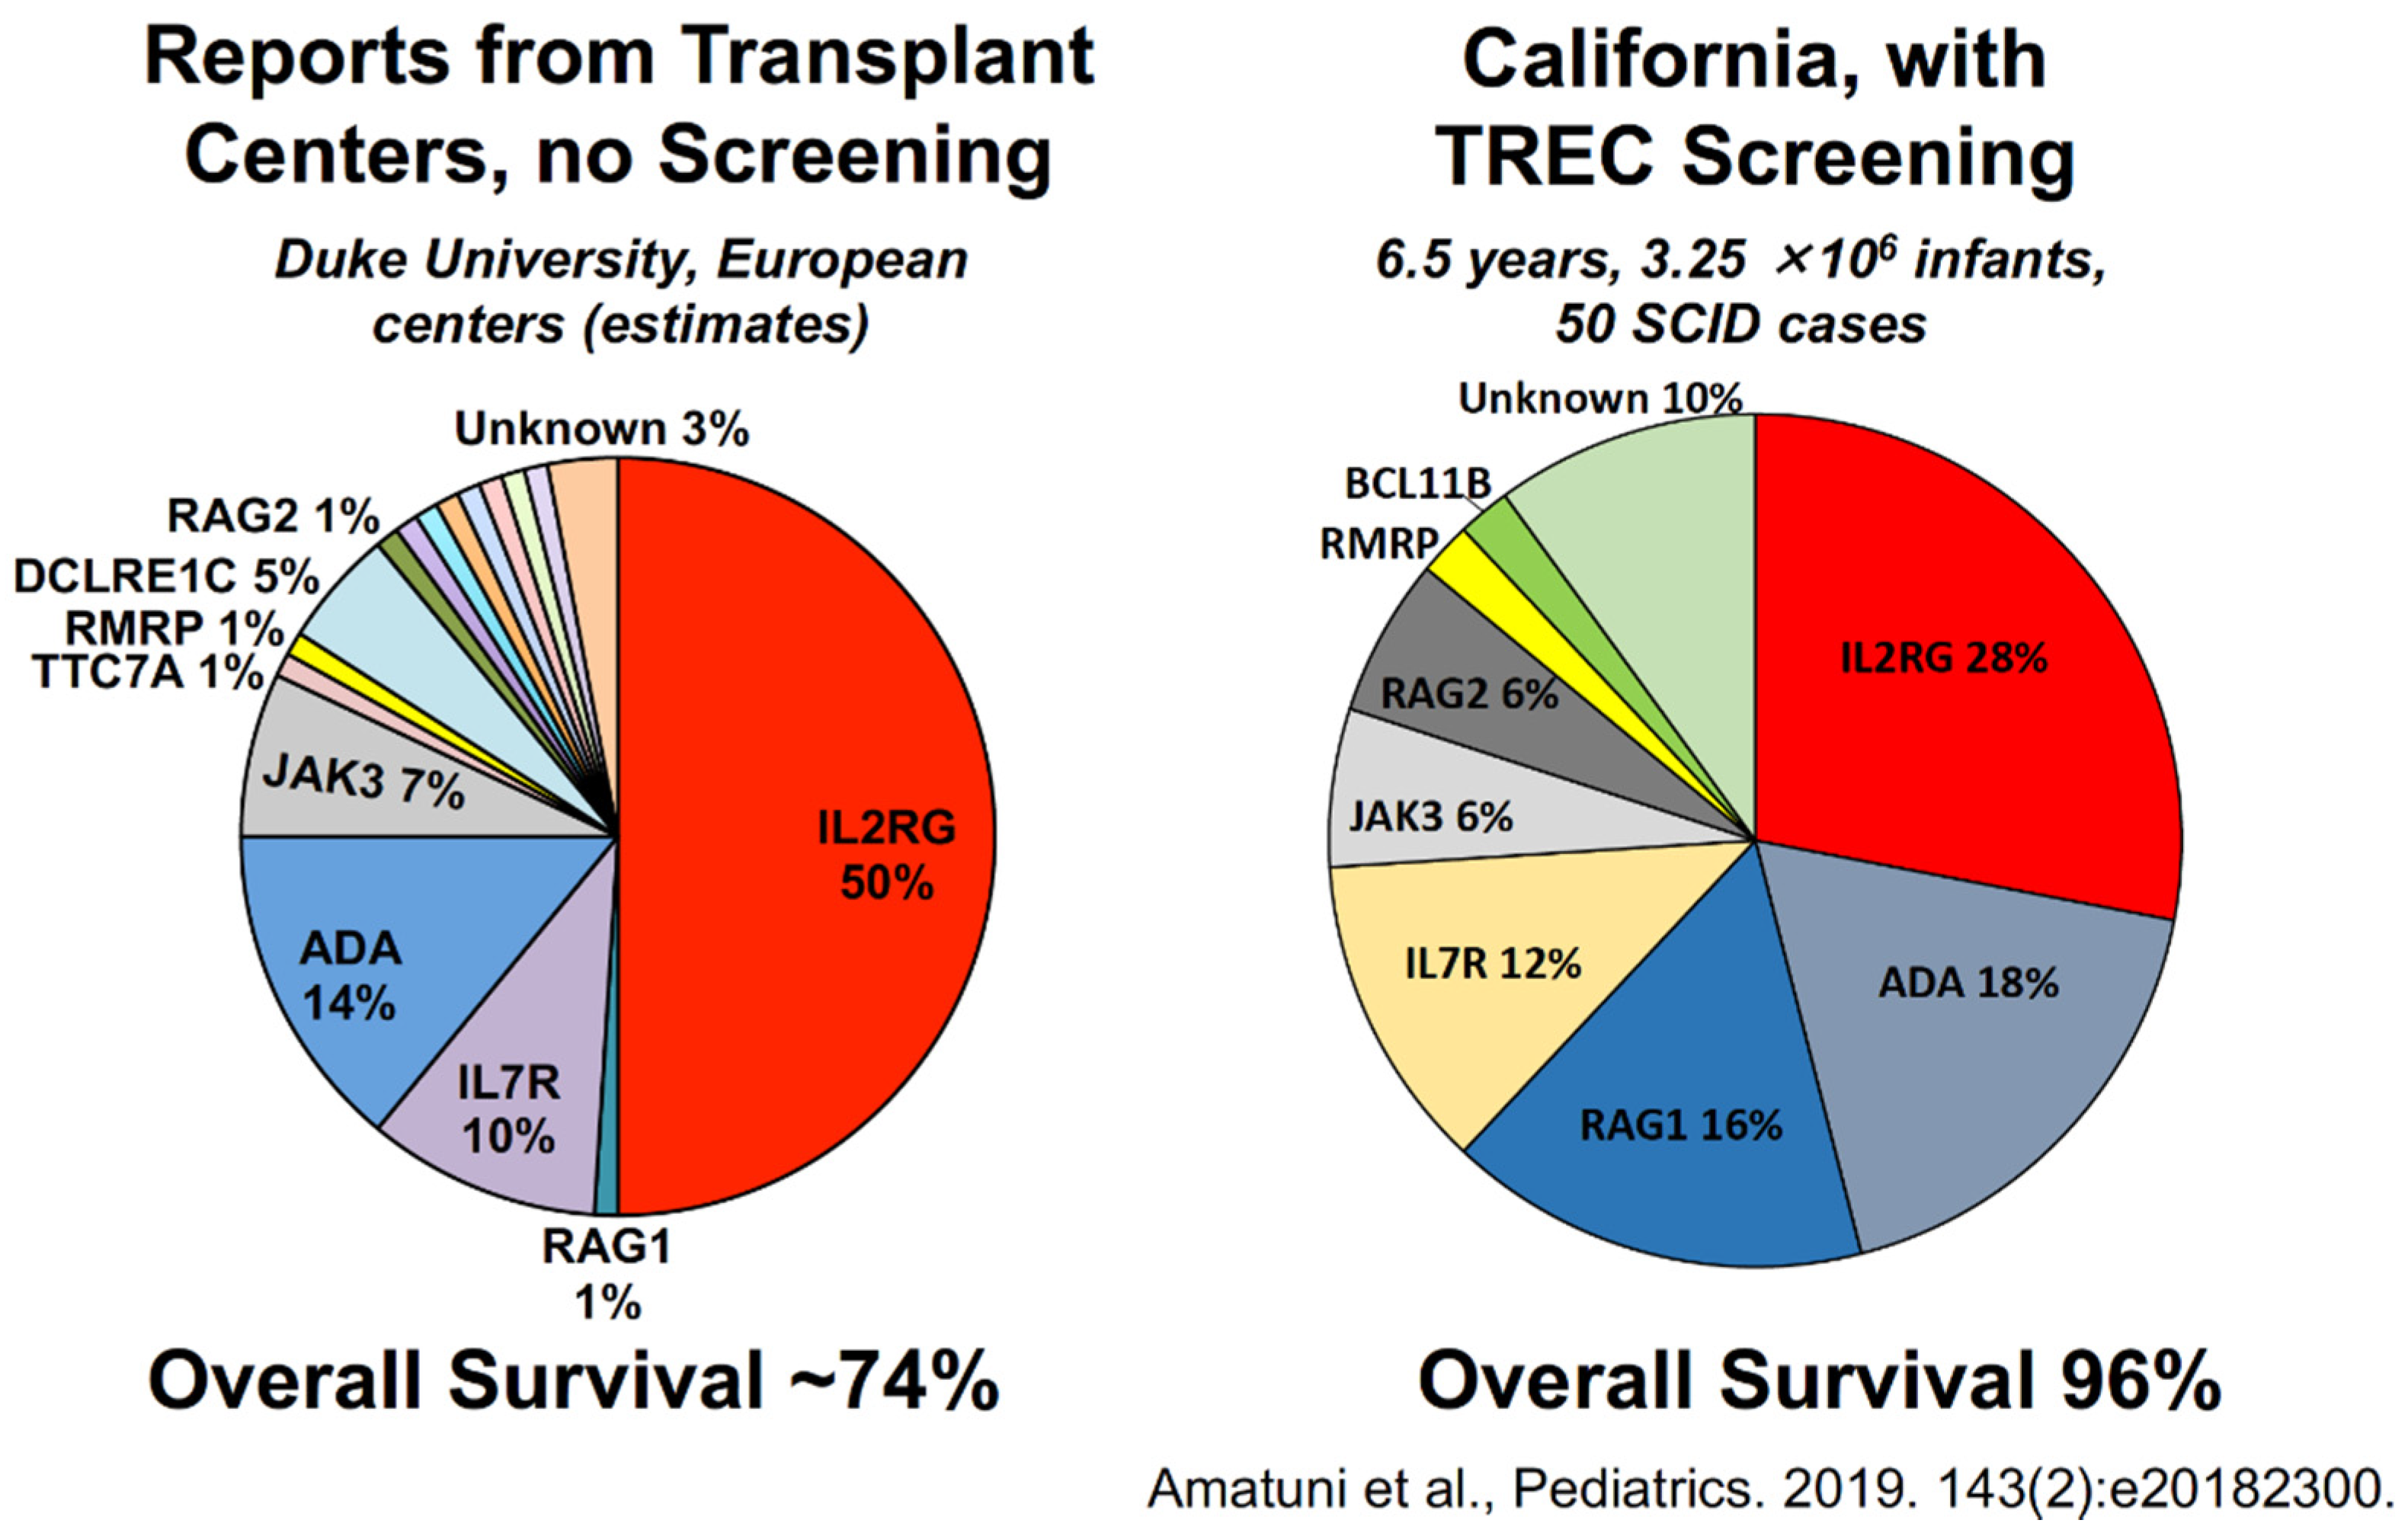
4. Outcomes of Newborn Screening Programs for SCID in the USA
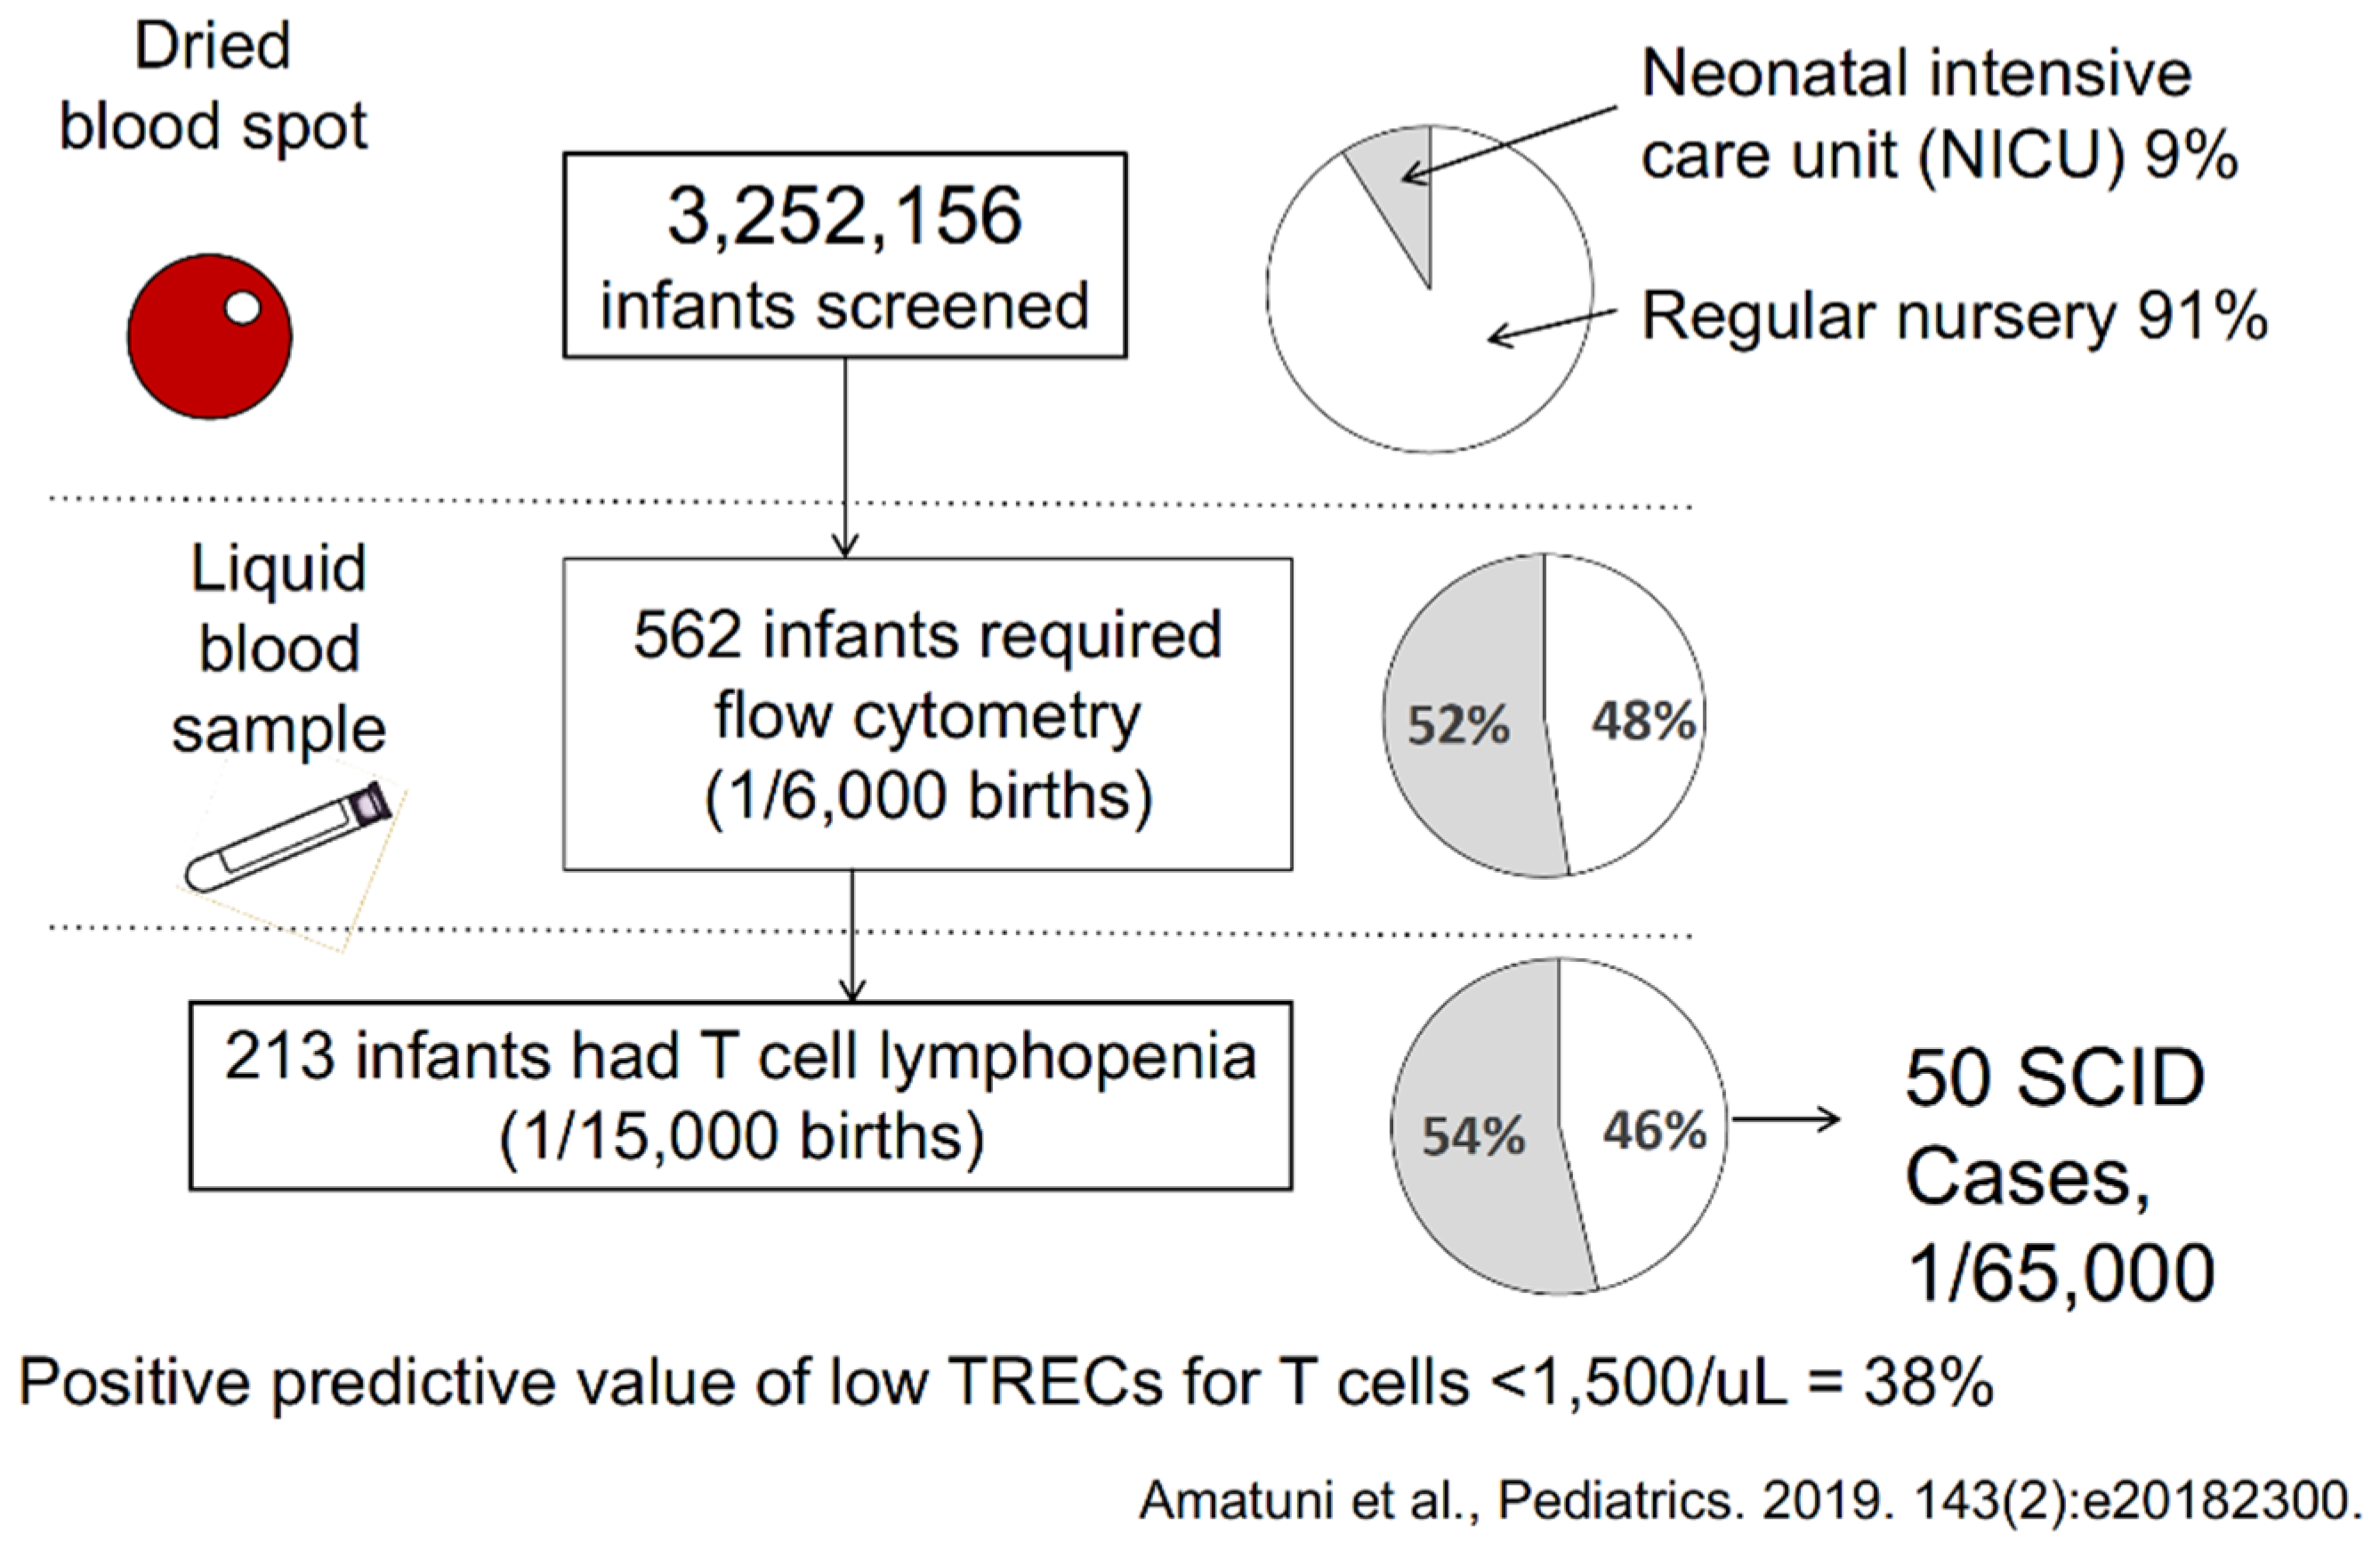
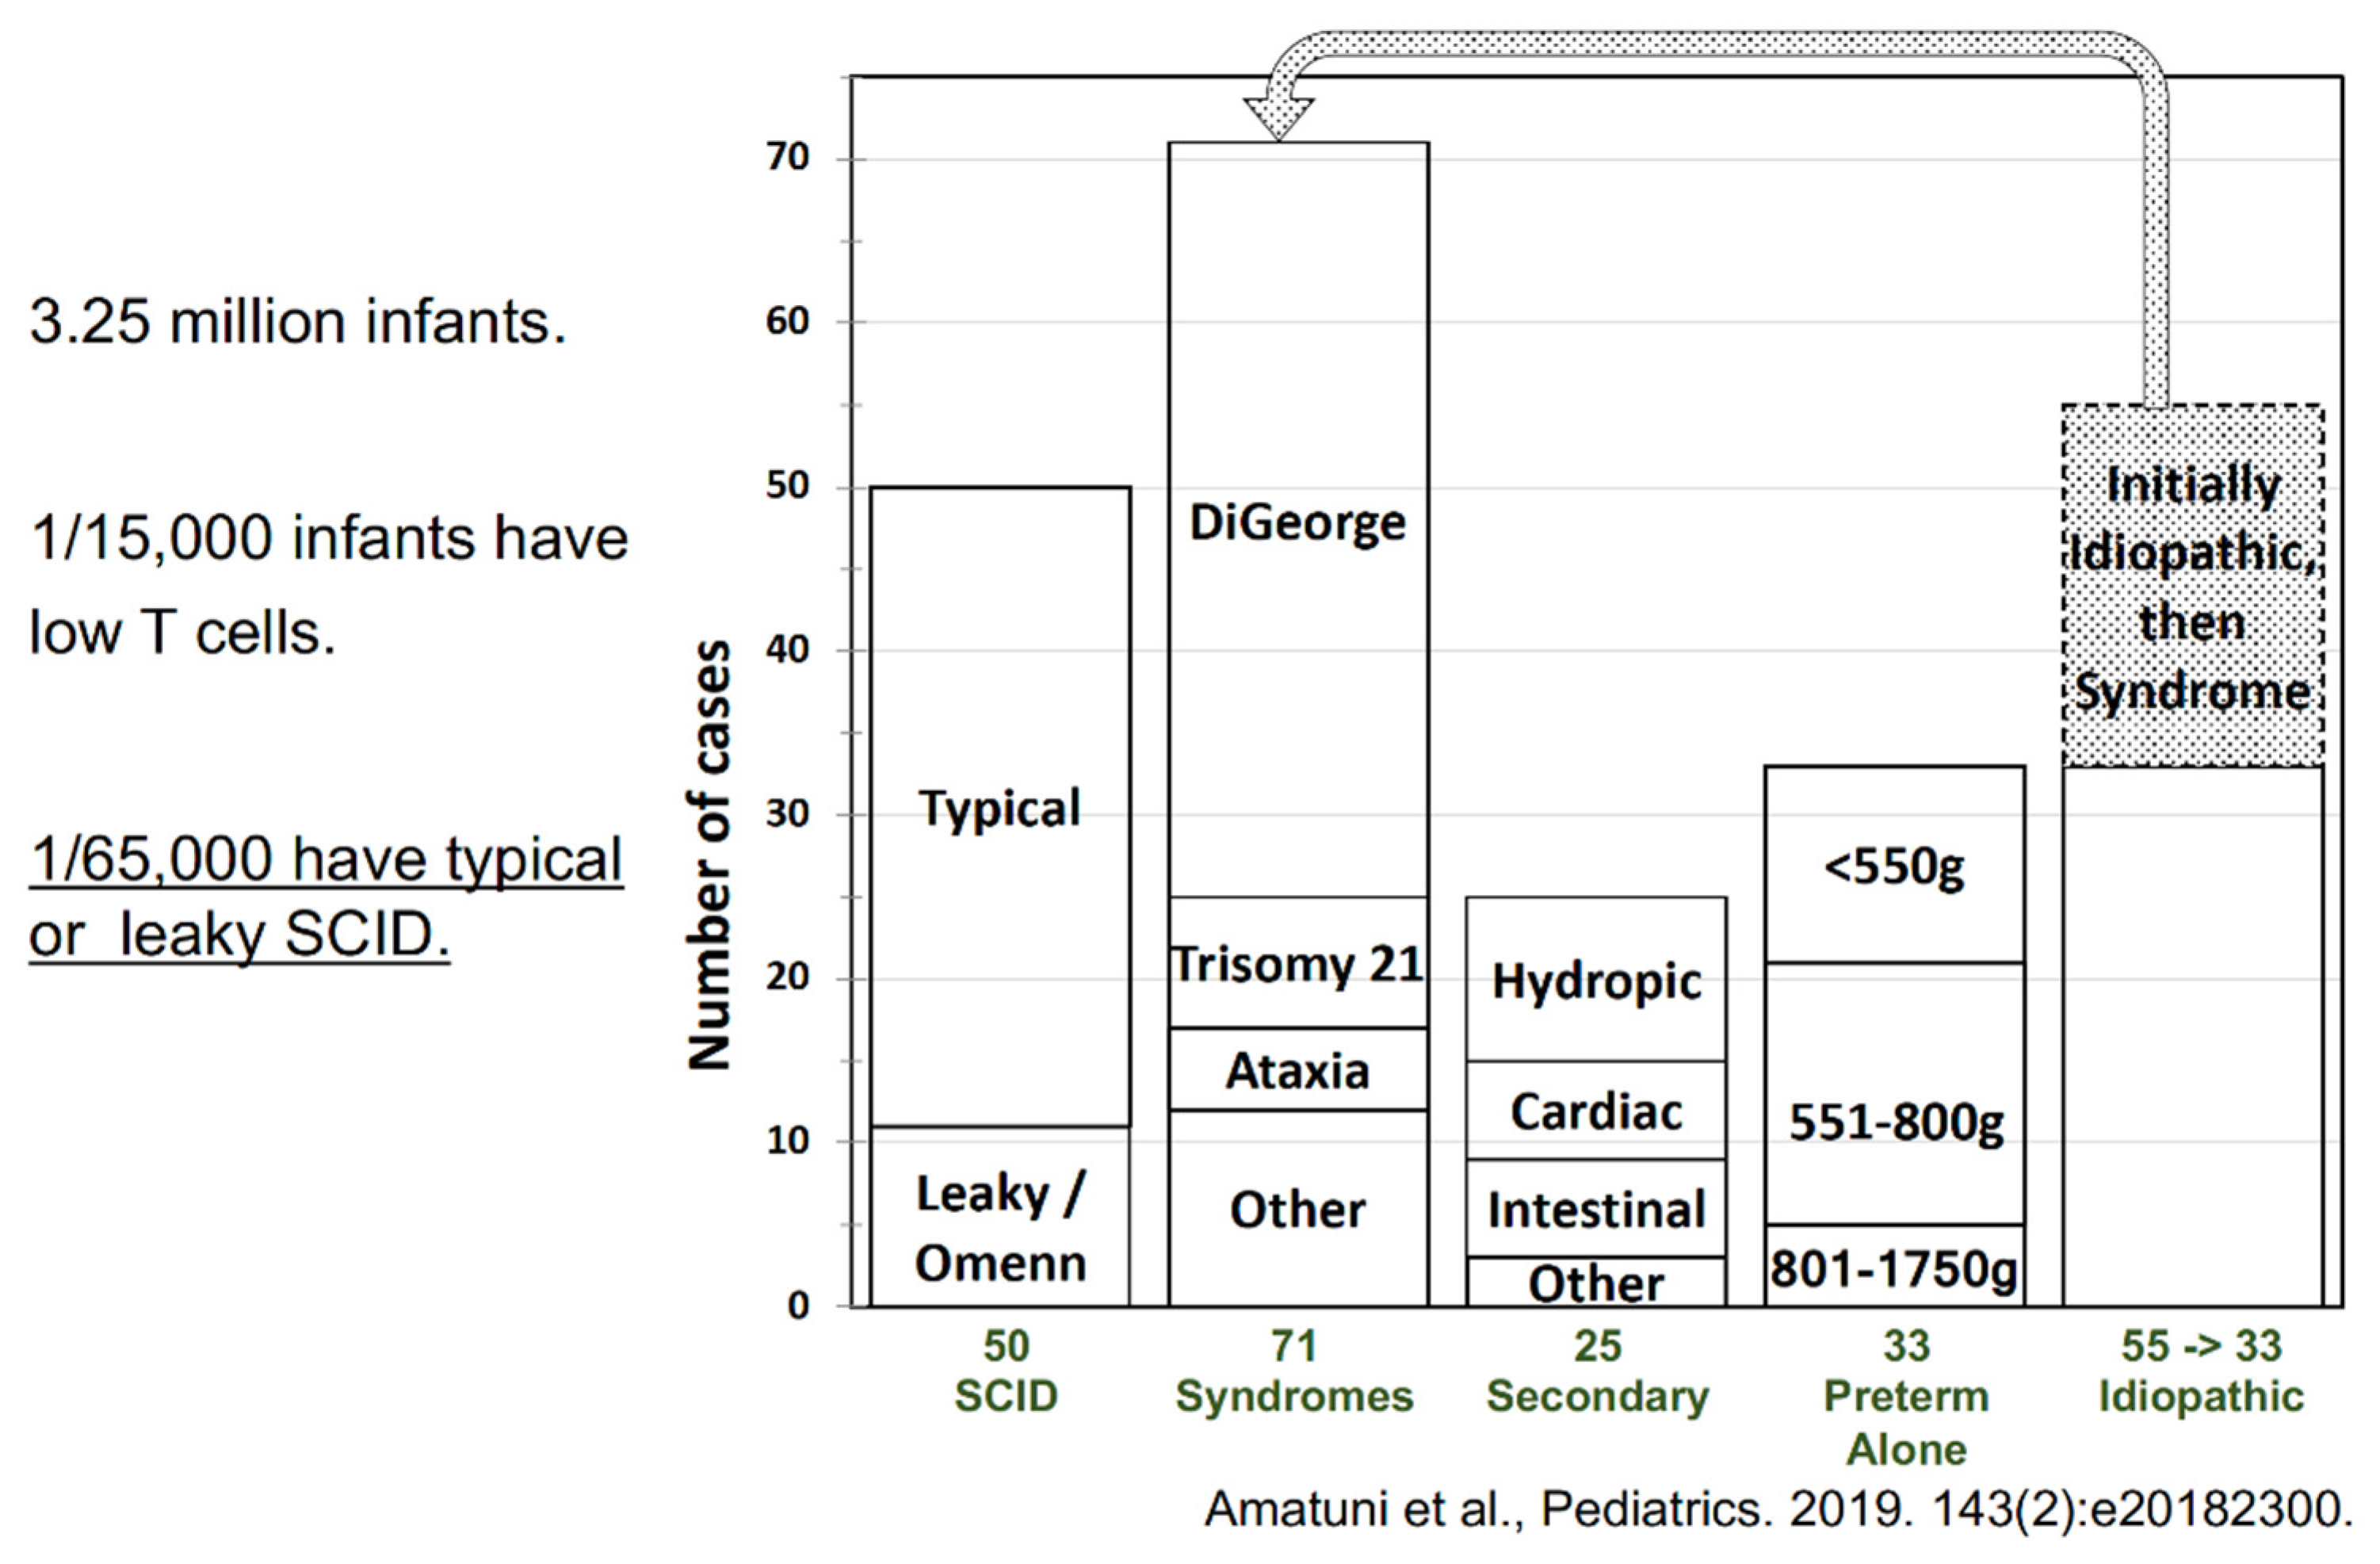
5. Experience with SCID Newborn Screening in California
Funding
Acknowledgments
Conflicts of Interest
References
- Tangye, S.G.; Al-Herz, W.; Bousfiha, A.; Chatila, T.; Cunningham-Rundles, C.; Etzioni, A.; Franco, J.L.; Holland, S.M.; Klein, C.; Morio, T.; et al. Human Inborn Errors of Immunity: 2019 Update on the Classification from the International Union of Immunological Societies Expert Committee. J. Clin. Immunol. 2020, 40, 24–64. [Google Scholar] [CrossRef] [PubMed] [Green Version]
- Puck, J.M.; The SCID Newborn Screening Working Group. Population-based newborn screening for severe com-bined immunodeficiency: Steps toward implementation. J. Allergy Clin. Immunol. 2007, 120, 760–768. [Google Scholar] [CrossRef] [PubMed]
- Pai, S.-Y.; Logan, B.R.; Griffith, L.M.; Buckley, R.H.; Parrott, R.E.; Dvorak, C.; Kapoor, N.; Hanson, I.C.; Filipovich, A.H.; Jyonouchi, S.; et al. Transplantation Outcomes for Severe Combined Immunodeficiency, 2000–2009. N. Engl. J. Med. 2014, 371, 434–446. [Google Scholar] [CrossRef] [PubMed] [Green Version]
- Amatuni, G.S.; Currier, R.J.; Church, J.A.; Bishop, T.; Grimbacher, E.; Nguyen, A.A.-C.; Agarwal-Hashmi, R.; Aznar, C.P.; Butte, M.J.; Cowan, M.J.; et al. Newborn screening for severe combined immunodeficiency and T-cell lymphopenia in California, 2010–2017. Pediatrics 2019, 143, e20182300. [Google Scholar] [CrossRef] [PubMed] [Green Version]
- Chan, K.; Puck, J.M. Development of population-based newborn screening for severe combined immunodeficiency. J. Allergy Clin. Immunol. 2005, 115, 391–398. [Google Scholar] [CrossRef] [PubMed] [Green Version]
- Puck, J.M. Laboratory technology for population-based screening for severe combined immunodeficiency in neonates: The winner is T-cell receptor excision circles. J. Allergy Clin. Immunol. 2012, 129, 607–616. [Google Scholar] [CrossRef] [PubMed] [Green Version]
- Currier, R.; Puck, J.M. SCID newborn screening: What we’ve learned. Clinical reviews in allergy and immunology. J. Allergy Clin. Immunol. 2021, 147, 417–426. [Google Scholar] [CrossRef] [PubMed]
- Kwan, A.; Abraham, R.S.; Currier, R.; Brower, A.; Andruszewski, K.; Abbott, J.; Baker, M.; Ballow, M.; Bartoshesky, L.E.; Bonilla, F.A.; et al. Newborn Screening for Severe Combined Immunodeficiency in 11 Screening Programs in the United States. J. Am. Med. Assoc. 2014, 312, 729–738. [Google Scholar] [CrossRef] [PubMed]
- Kwan, A.; Hu, D.; Song, M.; Gomes, H.; Brown, D.R.; Bourque, T.; Gonzalez-Espinosa, D.; Lin, Z.; Cowan, M.J.; Puck, J.M. Successful newborn screening for SCID in the Navajo Nation. Clin. Immunol. 2015, 158, 29–34. [Google Scholar] [CrossRef] [PubMed] [Green Version]
- Dorsey, M.; Puck, J. Newborn Screening for Severe Combined Immunodeficiency in the US: Current Status and Approach to Management. Int. J. Neonatal Screen. 2017, 3, 15. [Google Scholar] [CrossRef] [PubMed] [Green Version]
- Shearer, W.T.; Dunn, E.; Notarangelo, L.D.; Dvorak, C.; Puck, J.M.; Logan, B.R.; Griffith, L.M.; Kohn, D.; O’Reilly, R.J.; Fleisher, T.A.; et al. Establishing diagnostic criteria for severe combined immunodeficiency disease (SCID), leaky SCID, and Omenn syndrome: The Primary Immune Deficiency Treatment Consortium experience. J. Allergy Clin. Immunol. 2014, 133, 1092–1098. [Google Scholar] [CrossRef] [PubMed] [Green Version]
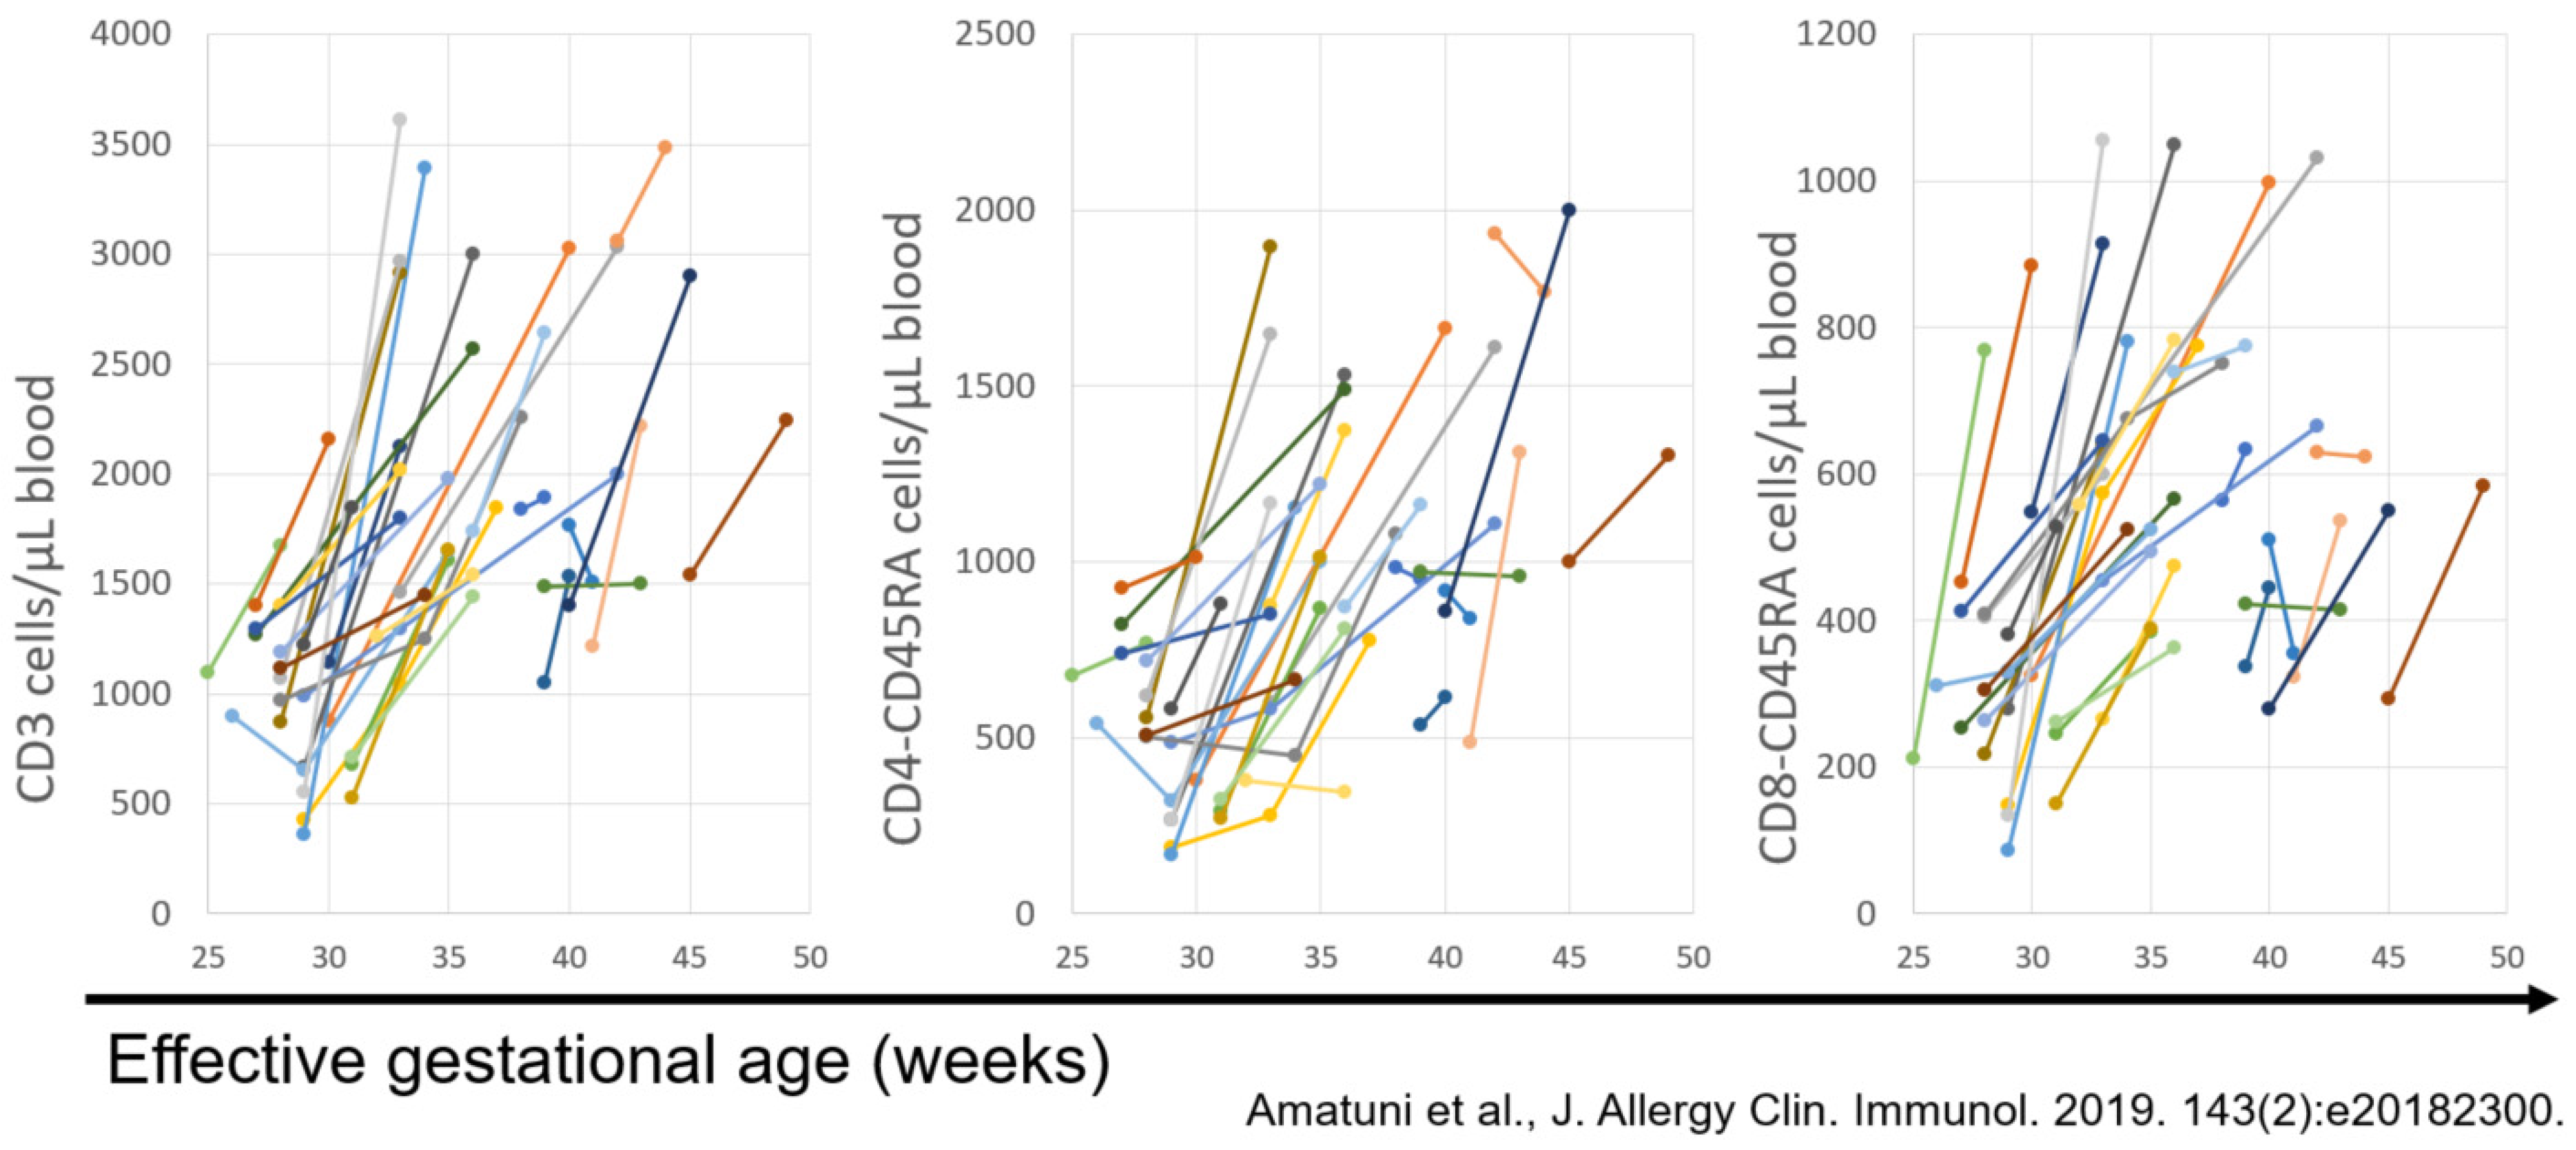
- Amatuni, G.S.; Sciortino, S.; Currier, R.J.; Naides, S.J.; Church, J.A.; Puck, J.M. Reference intervals for lymphocyte subsets in preterm and term neonates without immune defects. J. Allergy Clin. Immunol. 2019, 144, 1674–1683. [Google Scholar] [CrossRef] [PubMed] [Green Version]


| Gene (Disease Name) | T Cell Profile | B Cell Profile | Natural Killer Cell Profile |
|---|---|---|---|
| L2RG (common γ chain, X-linked) | T− | B+ | NK− |
| JAK3 (γ chain-associated Janus kinase) | T− | B+ | NK− |
| IL7R (IL-7 receptor α chain) | T− | B+ | NK+ |
| CD45 (membrane tyrosine kinase) | T− | B+ | NK+ |
| TCRD/E/Z (TCR CD3 δ, ε, and ξ chains) | T− | B+ | NK+ |
| RAG1/RAG2 | T− | B− | NK+ |
| DCLRE1C (Artemis) | T− | B− | NK+ |
| LIG4 (DNA ligase IV) | T− | B− | NK+ |
| PRKDC (DNA PKcs) | T− | B− | NK+ |
| ADA (adenosine deaminase) | T− | B− | NK− |
| AK2 (reticular dysgenesis, deafness) | T− | B+/− | NK+ |
| TTC7A (multiple bowel atresias) | T− | B+/− | NK+ |
| RMRP (cartilage hair hypoplasia) | T− | B+/− | NK+ |
| FOXN1 (nude mouse) | T− | B+ | NK+ |
| CORO1A (coronin 1A) | T− | B+/− | NK+ |
Publisher’s Note: MDPI stays neutral with regard to jurisdictional claims in published maps and institutional affiliations. |
© 2021 by the authors. Licensee MDPI, Basel, Switzerland. This article is an open access article distributed under the terms and conditions of the Creative Commons Attribution (CC BY) license (https://creativecommons.org/licenses/by/4.0/).
Share and Cite
Puck, J.M.; Gennery, A.R. Establishing Newborn Screening for SCID in the USA: Experience in California. Int. J. Neonatal Screen. 2021, 7, 72. https://doi.org/10.3390/ijns7040072
Puck JM, Gennery AR. Establishing Newborn Screening for SCID in the USA: Experience in California. International Journal of Neonatal Screening. 2021; 7(4):72. https://doi.org/10.3390/ijns7040072
Chicago/Turabian StylePuck, Jennifer M., and Andrew R. Gennery. 2021. "Establishing Newborn Screening for SCID in the USA: Experience in California" International Journal of Neonatal Screening 7, no. 4: 72. https://doi.org/10.3390/ijns7040072
APA StylePuck, J. M., & Gennery, A. R. (2021). Establishing Newborn Screening for SCID in the USA: Experience in California. International Journal of Neonatal Screening, 7(4), 72. https://doi.org/10.3390/ijns7040072