
Updated National Diagnostic Reference Levels and Achievable Doses for CT Protocols: A National Survey of Korean Hospitals

 , , ,
, , ,
Abstract
1. Introduction
2. Materials and Methods
3. Results
3.1. National DRLs and AD
3.2. Exposure Conditions
4. Discussion
5. Conclusions
Author Contributions
Funding
Institutional Review Board Statement
Informed Consent Statement
Data Availability Statement
Conflicts of Interest
References
- Hounsfield, G.N. Computerized transverse axial scanning (tomography): Part I. Description of system. Br. J. Radiol. 1973, 46, 1016–1022. [Google Scholar] [CrossRef] [PubMed]
- Crawford, C.R.; King, K.F. Computed tomography scanning with simultaneous patient translation. J. Med. Phys. 1990, 17, 967–982. [Google Scholar] [CrossRef] [PubMed]
- McCollough, C.H.; Zink, F.E. Performance evaluation of a multi-slice CT system. J. Med. Phys. 1999, 26, 2223–2230. [Google Scholar] [CrossRef] [PubMed]
- Mettler, F.A., Jr.; Mahesh, M.; Bhargavan-Chatfield, M.; Chambers, C.E.; Elee, J.G.; Frush, D.P.; Miller, D.L.; Royal, H.D.; Milano, M.T.; Spelic, D.C.; et al. Patient exposure from radiologic and nuclear mediciswne procedures in the United States: Procedure volume and effective dose for the period 2006–2016. Radiology 2020, 295, 418–427. [Google Scholar] [CrossRef] [PubMed]
- IAEA Safety Series No. 115/CD, International Basic Safety Standards for Protection against Ionizing Radiation and for the Safety of Radiation Sources (CD-ROM Edition, 2003), International Atomic Energy Agency (2003). Available online: https://www.iaea.org/publications/6900/international-basic-safety-standards-for-protection-against-ionizing-radiation-and-for-the-safety-of-radiation-sources-cd-rom-edition-2003 (accessed on 8 August 2022).
- ICRP Publication 60, Recommendation of the International Commission on Radiological Protection, International Commission on Radiological Protection. Available online: https://www.icrp.org/publication.asp?id=icrp%20publication%2060 (accessed on 8 August 2022).
- ICRP Publication 73, Radiological Protection and Safety in Medicine, International Commission on Radiological Protection. Available online: https://www.icrp.org/publication.asp?id=ICRP%20Publication%2073 (accessed on 8 August 2022).
- ICRP Publication 103, Ann. ICRP 37 (2-4), The 2007 Recommendations of the International Commission on Radiological Protection, International Commission on Radiological Protection. Available online: https://www.icrp.org/publication.asp?id=ICRP%20Publication%20103 (accessed on 8 August 2022).
- Vañó, E.; Miller, D.L.; Martin, C.J.; Rehani, M.M.; Kang, K.; Rosenstein, M.; Ortiz-López, P.; Mattsson, S.; Padovaniet, R.; Rogers, A.; et al. ICRP Publication 135: Diagnostic reference levels in medical imaging. Ann. ICRP 2017, 46, 1–144. [Google Scholar] [CrossRef] [PubMed]
- Kim, J.S.; Lee, S.K.; Kim, S.K.; Yoo, S.M.; Kim, J.M.; Yoon, S.W. National diagnostic reference levels and achievable doses for 13 adult CT protocols and a paediatric head CT protocol: National survey of Korean hospitals. Radiat. Prot. Dosim. 2019, 187, 220–229. [Google Scholar] [CrossRef] [PubMed]
- The 7th Korean Standards Body Size Analysis Data. Size Korea Web Site. Available online: https://sizekorea.kr/human-meas-search/human-data-search/meas-item (accessed on 11 September 2022).
- Kanal, K.M.; Butler, P.F.; Sengupta, D.; Bhargavan-Chatfield, M.; Coombs, L.P.; Morin, R.L.U.S. diagnostic reference levels and achievable doses for 10 adult CT examinations. Radiology 2017, 284, 120–133. [Google Scholar] [CrossRef] [PubMed]
- NCRP REPORT No. 172, Reference Levels and Achievable Doses in Medical and Dental Imaging: Recommendations for the United States, National Council on Radiation Protection and Measurements. Available online: https://ncrponline.org/shop/reports/report-no-172-reference-levels-and-achievable-doses-in-medical-and-dental-imaging-recommendations-for-the-united-states-2012/ (accessed on 10 August 2022).
- Kanda, R.; Akahane, M.; Koba, Y.; Chang, W.; Akahane, K.; Okuda, Y.; Hosono, M. Developing diagnostic reference levels in Japan. Jpn. J. Radiol. 2021, 39, 307–314. [Google Scholar] [CrossRef] [PubMed]
- Tsapaki, V.; Damilakis, J.; Paulo, G.; Schegerer, A.A.; Repussard, J.; Jaschke, W.; Frija, G. CT diagnostic reference levels based on clinical indications: Results of a large-scale European survey. Eur. Radiol. 2021, 31, 4459–4469. [Google Scholar] [CrossRef] [PubMed]
- Foley, S.J.; McEntee, M.F.; Rainford, L.A. Establishment of CT diagnostic reference levels in Ireland. Brit. J. Radiol. 2012, 85, 1390–1397. [Google Scholar] [CrossRef] [PubMed]
- Lee, K.L.; Beveridge, T.; Sanagou, M.; Thomas, P. Updated Australian diagnostic reference levels for adult CT. J. Med. Radiat. Sci. 2020, 67, 5–15. [Google Scholar] [CrossRef] [PubMed]
- Health Canada, Canadian Computed Tomography Survey—National Diagnostic Reference Levels. Available online: https://www.canada.ca/en/health-canada/services/publications/health-risks-safety/canadian-computed-tomography-survey-national-diagnostic-reference-levels.html (accessed on 11 August 2022).
- Nederlandse Commissie voor Stralingsdosimetrie, Diagnostische Referentieniveaus in Nederland, Rapport 21. Available online: https://radiationdosimetry.org/ncs/documents/ncs-21-drn-nl (accessed on 11 August 2022).
- Alashban, Y.; Shubayr, N. Establishing diagnostic reference levels for CT examinations in the south region of Saudi Arabia. Radiat. Phys. Chem. 2022, 201, 110407. [Google Scholar] [CrossRef]
- Eze, K.C.; Uduma, F.; Omidiji, O.A.; Ibekwe, N.K.; Ahidjo, A.; Ibinaiye, P.O.; Anas, I.; Itanyi, U.D.; Igbinedion, B.O.-E.; Ogbole, G.I.; et al. Diagnostic reference levels (DRLs) for chest radiography, non-contrast head computed tomography and mammography examinations in Nigeria: Review of national data. Chin. J. Acad. Radiol. 2022, 5, 99–106. [Google Scholar] [CrossRef]
- Kanal, K.M.; Butler, P.F.; Chatfield, M.B.; Wells, J.; Samei, E.; Simanowith, M.; Golden, D.; Gress, D.A.; Burleson, J.; Frush, D.; et al. U.S. diagnostic reference levels and achievable doses for 10 adult CT examinations. Radiology 2022, 302, 164–174. [Google Scholar] [CrossRef] [PubMed]
- Bouaoun, A.; Omrane, L.B.; Khomssi, W.D. Towards the establishment of national diagnostic reference levels in Tunisia: A multicentre survey in paediatric CT. J. Radiol. Prot. 2022, 42, 031503. [Google Scholar] [CrossRef] [PubMed]


| Region Name | Number of Installed CT | Surveyed Number of CT |
|---|---|---|
| Seoul and Gyeonggi area | 898 | 93 |
| Kang won area | 73 | 8 |
| Gyeongsang area | 574 | 79 |
| Jeolla and Jeju area | 283 | 26 |
| Chungcheong area | 202 | 19 |
| Total | 2030 | 225 |
| CT Protocol Name | Ages (Years) | Hight (cm) | Weight (kg) |
|---|---|---|---|
| Brain CT without contrast | 58.74 ± 18.14 | 164.80 ± 11.76 | 66.90 ± 14.04 |
| Intra-cranial CT angiography | 59.29 ± 14.33 | 164.06 ± 8.94 | 64.02 ± 12.13 |
| Cervical spine CT | 53.73 ± 16.90 | 166.86 ± 9.60 | 66.69 ± 12.40 |
| Lumber spine CT | 58.92 ± 17.26 | 165.90 ± 54.48 | 66.12 ± 12.95 |
| Neck CT with contrast | 53.82 ± 18.09 | 165.46 ± 8.50 | 64.88 ± 11.26 |
| Chest CT with contrast | 62.32 ± 16.21 | 164.59 ± 8.75 | 64.91 ± 37.67 |
| Low dose screening chest CT | 57.63 ± 15.13 | 165.07 ± 11.64 | 66.99 ± 35.90 |
| Abdomen-pelvis CT with contrast | 56.72 ± 18.91 | 163.75 ± 20.79 | 68.62 ± 75.56 |
| Abdomen 4 phase dynamic CT with contrast | 58.48 ± 14.16 | 175.27 ± 87.10 | 74.41 ± 83.01 |
| Abdomen-pelvis CT without contrast for urinary system | 59.66 ± 18.08 | 165.47 ± 18.84 | 68.00 ± 44.18 |
| Coronary artery CT angiography | 58.66 ± 15.82 | 165.96 ± 8.77 | 66.99 ± 11.21 |
| Coronary artery calcium score CT | 55.30 ± 13.31 | 166.77 ± 8.96 | 65.45 ± 11.08 |
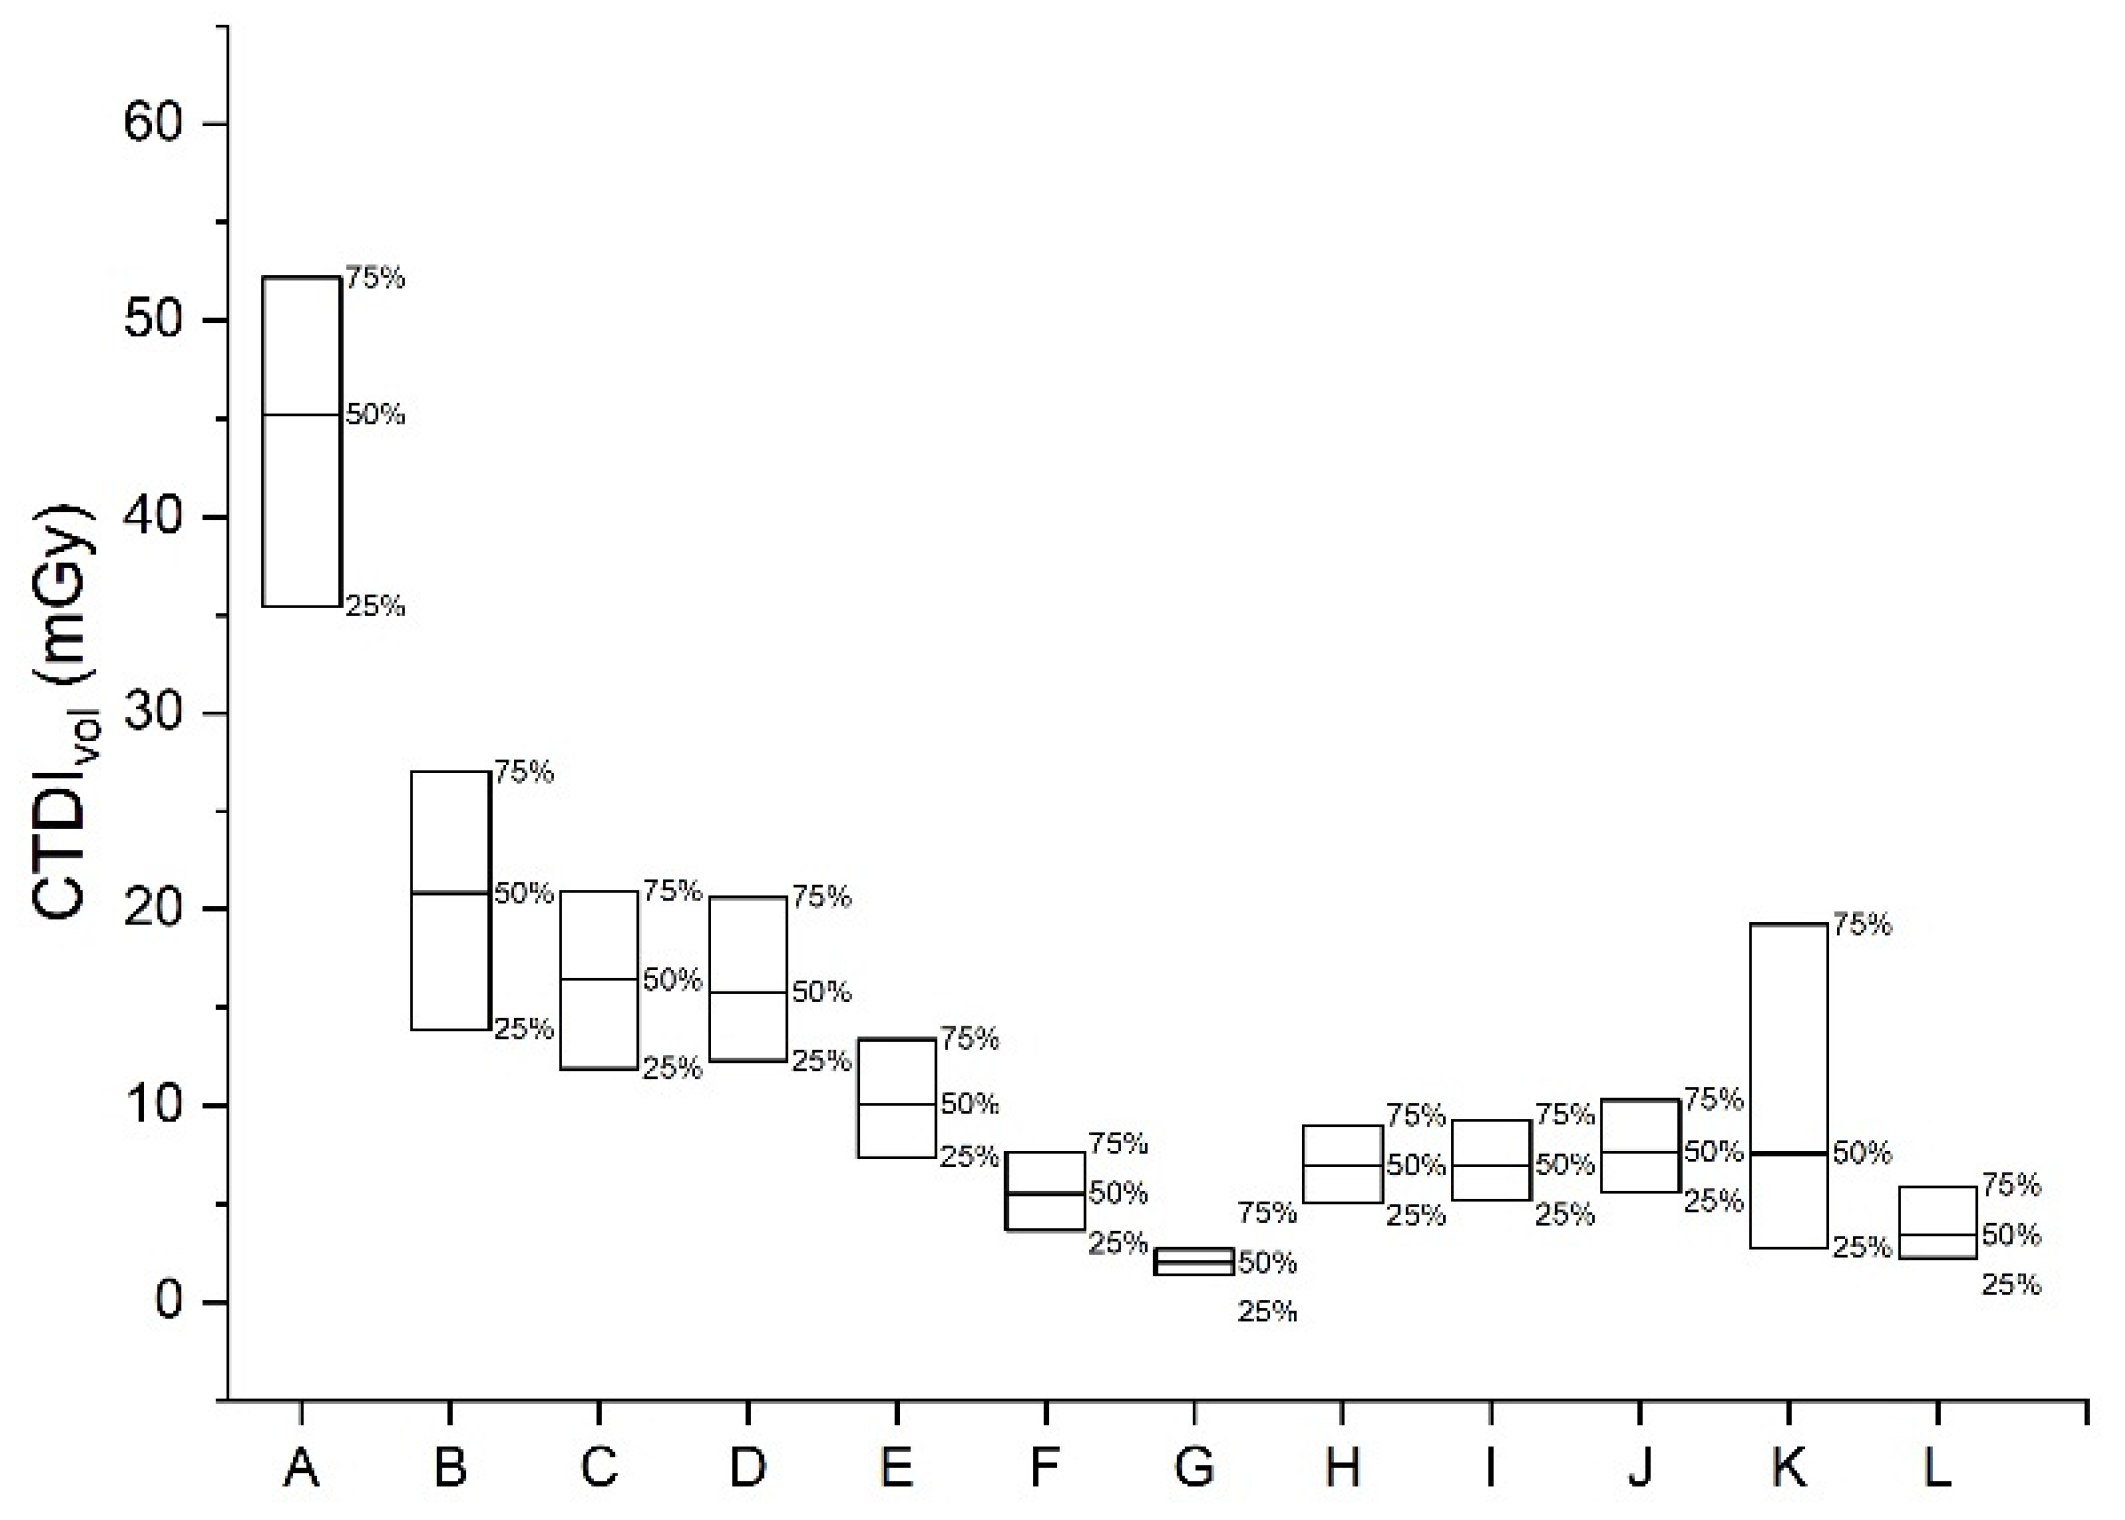
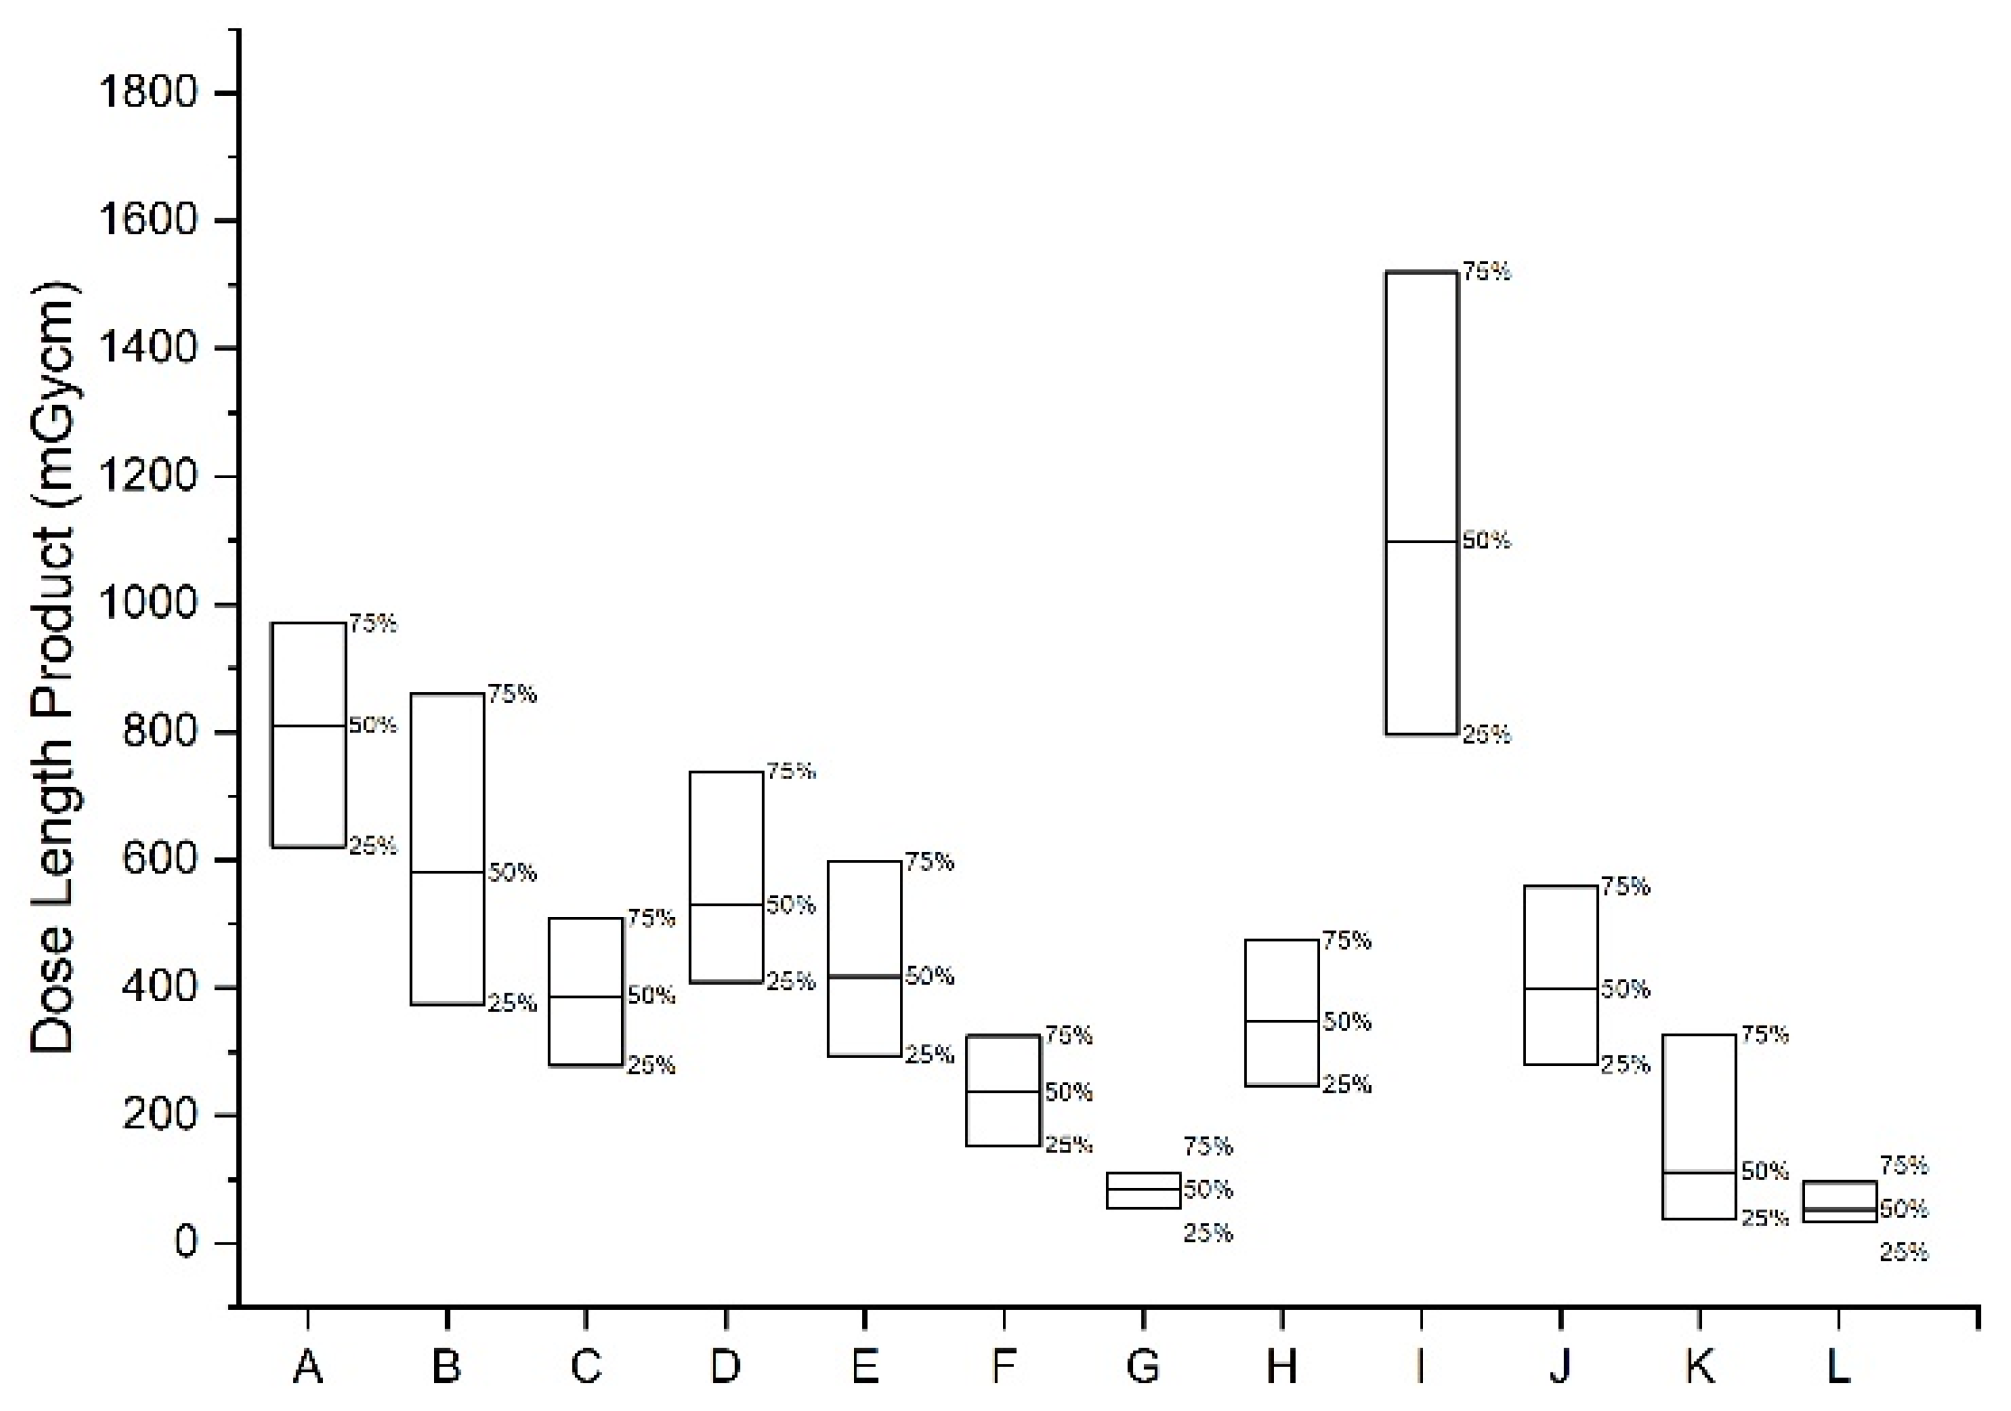
| Protocols | CTDIvol (mGy) | DLP (mGy·cm) | ||||
|---|---|---|---|---|---|---|
| 25th | AD | 75th | 25th | AD | 75th | |
| Brain CT without contrast | 35.4 | 45.2 | 52.2 | 621.0 | 811.0 | 969.8 |
| Intra-cranial CT angiography | 13.9 | 20.8 | 27.0 | 374.9 | 579.8 | 858.9 |
| Cervical spine CT | 11.9 | 16.4 | 20.9 | 278.0 | 387.0 | 508.7 |
| Lumber spine CT | 12.3 | 15.8 | 20.6 | 409.6 | 529.6 | 738.5 |
| Neck CT with contrast | 7.4 | 10.0 | 13.4 | 294.4 | 417.3 | 597.1 |
| Chest CT with contrast | 3.6 | 5.5 | 7.6 | 154.0 | 236.7 | 324.2 |
| Low dose screening chest CT | 1.4 | 2.0 | 2.7 | 54.0 | 84.4 | 109.5 |
| Abdomen-pelvis CT with contrast | 5.0 | 6.9 | 8.9 | 247.9 | 346.6 | 473.7 |
| Abdomen 4 phase dynamic CT with contrast | 5.2 | 7.0 | 9.3 | 796.0 | 1099.7 | 1521.8 |
| Abdomen-pelvis CT without contrast for urinary system | 5.6 | 7.6 | 10.3 | 280.0 | 398.2 | 558.5 |
| Coronary artery CT angiography | 2.8 | 7.6 | 19.2 | 38.5 | 112.2 | 326.9 |
| Coronary artery calcium score CT | 2.2 | 3.4 | 5.9 | 34.7 | 53.5 | 95.7 |
| Protocols | Age Group | CTDIvol (mGy) | DLP (mGy·cm) | ||||
|---|---|---|---|---|---|---|---|
| 25th | AD | 75th | 25th | AD | 75th | ||
| Pediatric brain CT without contrast | under 2 years | 15.5 | 19.7 | 23.5 | 236.9 | 323.8 | 429.3 |
| more than 2 years—under 5 years | 20.3 | 24.6 | 31.4 | 341.4 | 429.3 | 585.0 | |
| more than 5 years—under 10 years | 23.0 | 30.0 | 38.5 | 422.0 | 534.0 | 756.0 | |
| more than 10 years—under 15 years | 30.0 | 45.0 | 51.5 | 581.4 | 826.0 | 967.2 | |
| CT Protocol Name | Average Tube Voltage (kVp) | Average Tube Current Time Product (mAs) | Average Scan Length (mm) |
|---|---|---|---|
| Brain CT without contrast | 122.0 ± 7.8 | 289.1 ± 100.2 | 173.2 ± 30.9 |
| Intra-cranial CT angiography | 113.2 ± 12.7 | 171.9 ± 98.3 | 255.5 ± 102.2 |
| Cervical spine CT | 119.6 ± 10.6 | 216.5 ± 274.7 | 245.1 ± 64.3 |
| Lumber spine CT | 119.7 ± 7.7 | 298.6 ± 368.4 | 327.8 ± 149.4 |
| Neck CT with contrast | 114.8 ± 10.8 | 161.9 ± 143.6 | 303.2 ± 47.6 |
| Chest CT with contrast | 115.1 ± 10.0 | 113.9 ± 120.4 | 380.8 ± 18.0 |
| Low dose screening chest CT | 117.0 ± 7.5 | 45.0 ± 45.3 | 370.8 ± 62.5 |
| Abdomen-pelvis CT with contrast | 110.9 ± 11.2 | 183.7 ± 305.7 | 436.1 ± 91.2 |
| Abdomen 4 phase dynamic CT with contrast | 109.8 ± 11.9 | 194.1 ± 196.0 | 373.8 ± 102.4 |
| Abdomen-pelvis CT without contrast for urinary system | 112.1 ± 11.3 | 169.3 ± 179.7 | 428.1 ± 251.6 |
| Coronary artery CT angiography | 114.7 ± 10.7 | 139.9 ± 139.9 | 169.4 ± 75.8 |
| Coronary artery calcium score CT | 118.3 ± 7.0 | 79.4 ± 78.1 | 175.6 ± 84.9 |
| Body Part, Examination, and Parameter | ACR DIR (2017) [12] | NCRP (2012) [13] | Japan (2020) [14] | EU (2021) [15] | Ireland (2010) [16] | Australia (2020) [17] | Canada (2018) [18] | Netherlands (2012) [19] | Saudi Arabia (2022) [20] | Nigeria (2005–2019) [21] | Korea (2016) [10] | This Study (2021) |
|---|---|---|---|---|---|---|---|---|---|---|---|---|
| CT of head and brain without contrast material | ||||||||||||
| CTDIvol | 57 | 75 | 77 | 48 | 66/58 | 52 | 79 | 33.1 | 67 | 63 | 52.2 | |
| DLP | 1011 | 1350 | 1386 | 940 | 880 | 1302 | 655.74 | 1410 | 1119 | 969.8 | ||
| CT of intra-cranial angiography with contrast material | ||||||||||||
| CTDIvol | 22 | 27.0 | ||||||||||
| DLP | 836 | 858.9 | ||||||||||
| CT of neck with contrast material | ||||||||||||
| CTDIvol | 20 | 17 | 14 | 13.4 | ||||||||
| DLP | 572 | 450 | 442 | 597.1 | ||||||||
| CT of cervical spine without contrast material | ||||||||||||
| CTDIvol | 17 | 23 | 18 | 20.9 | ||||||||
| DLP | 495 | 470 | 434 | 508.7 | ||||||||
| CT of cervical spine with contrast material | ||||||||||||
| CTDIvol | 28 | 19 | ||||||||||
| DLP | 602 | 420 | ||||||||||
| CT of lumbar spine without contrast material | ||||||||||||
| CTDIvol | 26 | 18 | 20.6 | |||||||||
| DLP | 670 | 601 | 738.5 | |||||||||
| CT of chest without contrast material | ||||||||||||
| CTDIvol | 15 | 21 | 13 | 9 | 9 | 14 | 31.7 | |||||
| DLP | 545 | 510 | 364 | 390 | 521 | 637.01 | ||||||
| CT of chest with contrast material | ||||||||||||
| CTDIvol | 16 | 21 | 10 | 14 | 7 | 87.6 | ||||||
| DLP | 596 | 390 | 521 | 297 | 324.2 | |||||||
| CT of low dose screening Chest | ||||||||||||
| CTDIvol | 3 | 2.7 | ||||||||||
| DLP | 101 | 109.5 | ||||||||||
| CT of chest pulmonary arteries with contrast material | ||||||||||||
| CTDIvol | 18 | 8 | 13 | 10 | ||||||||
| DLP | 557 | 628 | 430 | 350 | ||||||||
| CT of abdomen and pelvis without contrast material | ||||||||||||
| CTDIvol | 20 | 25 | 20 | 9 | 12 | 18 | 15 | 32.17 | ||||
| DLP | 1004 | 880 | 874 | 600 | 874 | 700 | 645.93 | |||||
| CT of abdomen and pelvis with contrast material | ||||||||||||
| CTDIvol | 19 | 25 | 12 | 13 | 18 | 15 | 10 | 8.9 | ||||
| DLP | 995 | 600 | 600 | 874 | 700 | 472 | 473.7 | |||||
| CT of abdomen and pelvis dynamic with contrast material (4 phase) | ||||||||||||
| CTDIvol | 17 | 9 | 10 | 9.3 | ||||||||
| DLP | 2100 | 1273 | 1511 | 1521.8 | ||||||||
| CT of abdomen, pelvis, and kidney without contrast material | ||||||||||||
| CTDIvol | 18 | 8 | 13 | 9 | 10.3 | |||||||
| DLP | 877 | 480 | 600 | 460 | 558.5 | |||||||
| CT of Coronary Angiography | ||||||||||||
| CTDIvol | 66 | 25 | 30 | 19.2 | ||||||||
| DLP | 1300 | 459 | 447 | 326.9 | ||||||||
| CT of Calcium score | ||||||||||||
| CTDIvol | 4 | 5 | 5.9 | |||||||||
| DLP | 81 | 77 | 95.7 | |||||||||
| Age | US (2021) [22] | Australian (2020) [17] | Japan (2020) [14] | Canada (2018) [18] | Tunisia (2017–2019) [23] | Korea (2016) [10] | This Study (2021) | |||||||
|---|---|---|---|---|---|---|---|---|---|---|---|---|---|---|
| CTDIvol | DLP | CTDIvol | DLP | CTDIvol | DLP | CTDIvol | DLP | CTDIvol | DLP | CTDIvol | DLP | CTDIvol | DLP | |
| 0 | 23 | 344 | 30 | 470 | 30 | 480 | 37 | 578 | 26 | 384 | 20 | 298 | 24 | 429 |
| 1 | 27 | 440 | 40 | 660 | 38 | 664 | ||||||||
| 2 | ||||||||||||||
| 3 | 31 | 518 | 51 | 843 | 24 | 404 | 21 | 585 | ||||||
| 4 | ||||||||||||||
| 5 | 35 | 600 | 51 | 873 | ||||||||||
| 6 | 55 | 850 | 30 | 494 | 38 | 756 | ||||||||
| 7 | 55 | 910 | ||||||||||||
| 8 | 52 | 888 | ||||||||||||
| 9 | ||||||||||||||
| 10 | 51 | 978 | ||||||||||||
| 11 | 60 | 1000 | 63 | 1087 | 51 | 967 | ||||||||
| 12 | ||||||||||||||
| 13 | ||||||||||||||
| 14 | ||||||||||||||
| 15 | ||||||||||||||
| 16 | ||||||||||||||
| 17 | ||||||||||||||
| 18 | ||||||||||||||
| Examination | Clinic | Hospital | University Hospital | |||
|---|---|---|---|---|---|---|
| CTDIvol | DLP | CTDIvol | DLP | CTDIvol | DLP | |
| CT of head and brain without contrast material | 39.27 | 638.35 | 58.76 | 998.4 | 45.4 | 831.09 |
| CT of intra-cranial angiography with contrast material | 13.26 | 508.02 | 67.08 | 1114.03 | 23.39 | 653.15 |
| CT of cervical spine without contrast material | 17.4 | 369.01 | 20.62 | 467.56 | 19.45 | 413.31 |
| CT of Lumbar spine without contrast material | 17.9 | 565.6 | 41.86 | 698.35 | 16.7 | 576.08 |
| CT of low dose screening Chest | 1.34 | 54.04 | 2.52 | 103.3 | 2.21 | 85.9 |
| CT of chest with contrast material | 4.76 | 206.08 | 9.85 | 353.72 | 6.6 | 250.27 |
| CT of Coronary Angiography | 11.77 | 199.14 | 12.78 | 212.68 | 13.65 | 229.54 |
| CT of Calcium score | 3.18 | 47.12 | 4.74 | 73.6 | 4.71 | 74.87 |
| CT of abdomen and pelvis with contrast material | 3.57 | 156.78 | 9.9 | 507.38 | 7.26 | 372.23 |
| CT of abdomen, pelvis, and kidney without contrast material | 5.32 | 246.89 | 13.69 | 654.21 | 8.12 | 426.08 |
Publisher’s Note: MDPI stays neutral with regard to jurisdictional claims in published maps and institutional affiliations. |
© 2022 by the authors. Licensee MDPI, Basel, Switzerland. This article is an open access article distributed under the terms and conditions of the Creative Commons Attribution (CC BY) license (https://creativecommons.org/licenses/by/4.0/).
Share and Cite
Nam, S.; Park, H.; Kwon, S.; Cho, P.-k.; Yoon, Y.; Yoon, S.-w.; Kim, J. Updated National Diagnostic Reference Levels and Achievable Doses for CT Protocols: A National Survey of Korean Hospitals. Tomography 2022, 8, 2450-2459. https://doi.org/10.3390/tomography8050203
Nam S, Park H, Kwon S, Cho P-k, Yoon Y, Yoon S-w, Kim J. Updated National Diagnostic Reference Levels and Achievable Doses for CT Protocols: A National Survey of Korean Hospitals. Tomography. 2022; 8(5):2450-2459. https://doi.org/10.3390/tomography8050203
Chicago/Turabian StyleNam, Sora, Hyemin Park, Soonmu Kwon, Pyong-kon Cho, Yongsu Yoon, Sang-wook Yoon, and Jungsu Kim. 2022. "Updated National Diagnostic Reference Levels and Achievable Doses for CT Protocols: A National Survey of Korean Hospitals" Tomography 8, no. 5: 2450-2459. https://doi.org/10.3390/tomography8050203
APA StyleNam, S., Park, H., Kwon, S., Cho, P.-k., Yoon, Y., Yoon, S.-w., & Kim, J. (2022). Updated National Diagnostic Reference Levels and Achievable Doses for CT Protocols: A National Survey of Korean Hospitals. Tomography, 8(5), 2450-2459. https://doi.org/10.3390/tomography8050203