
Effect of Inter-Reader Variability on Diffusion-Weighted MRI Apparent Diffusion Coefficient Measurements and Prediction of Pathologic Complete Response for Breast Cancer

 , , , , and
Abstract
:1. Introduction
2. Materials and Methods
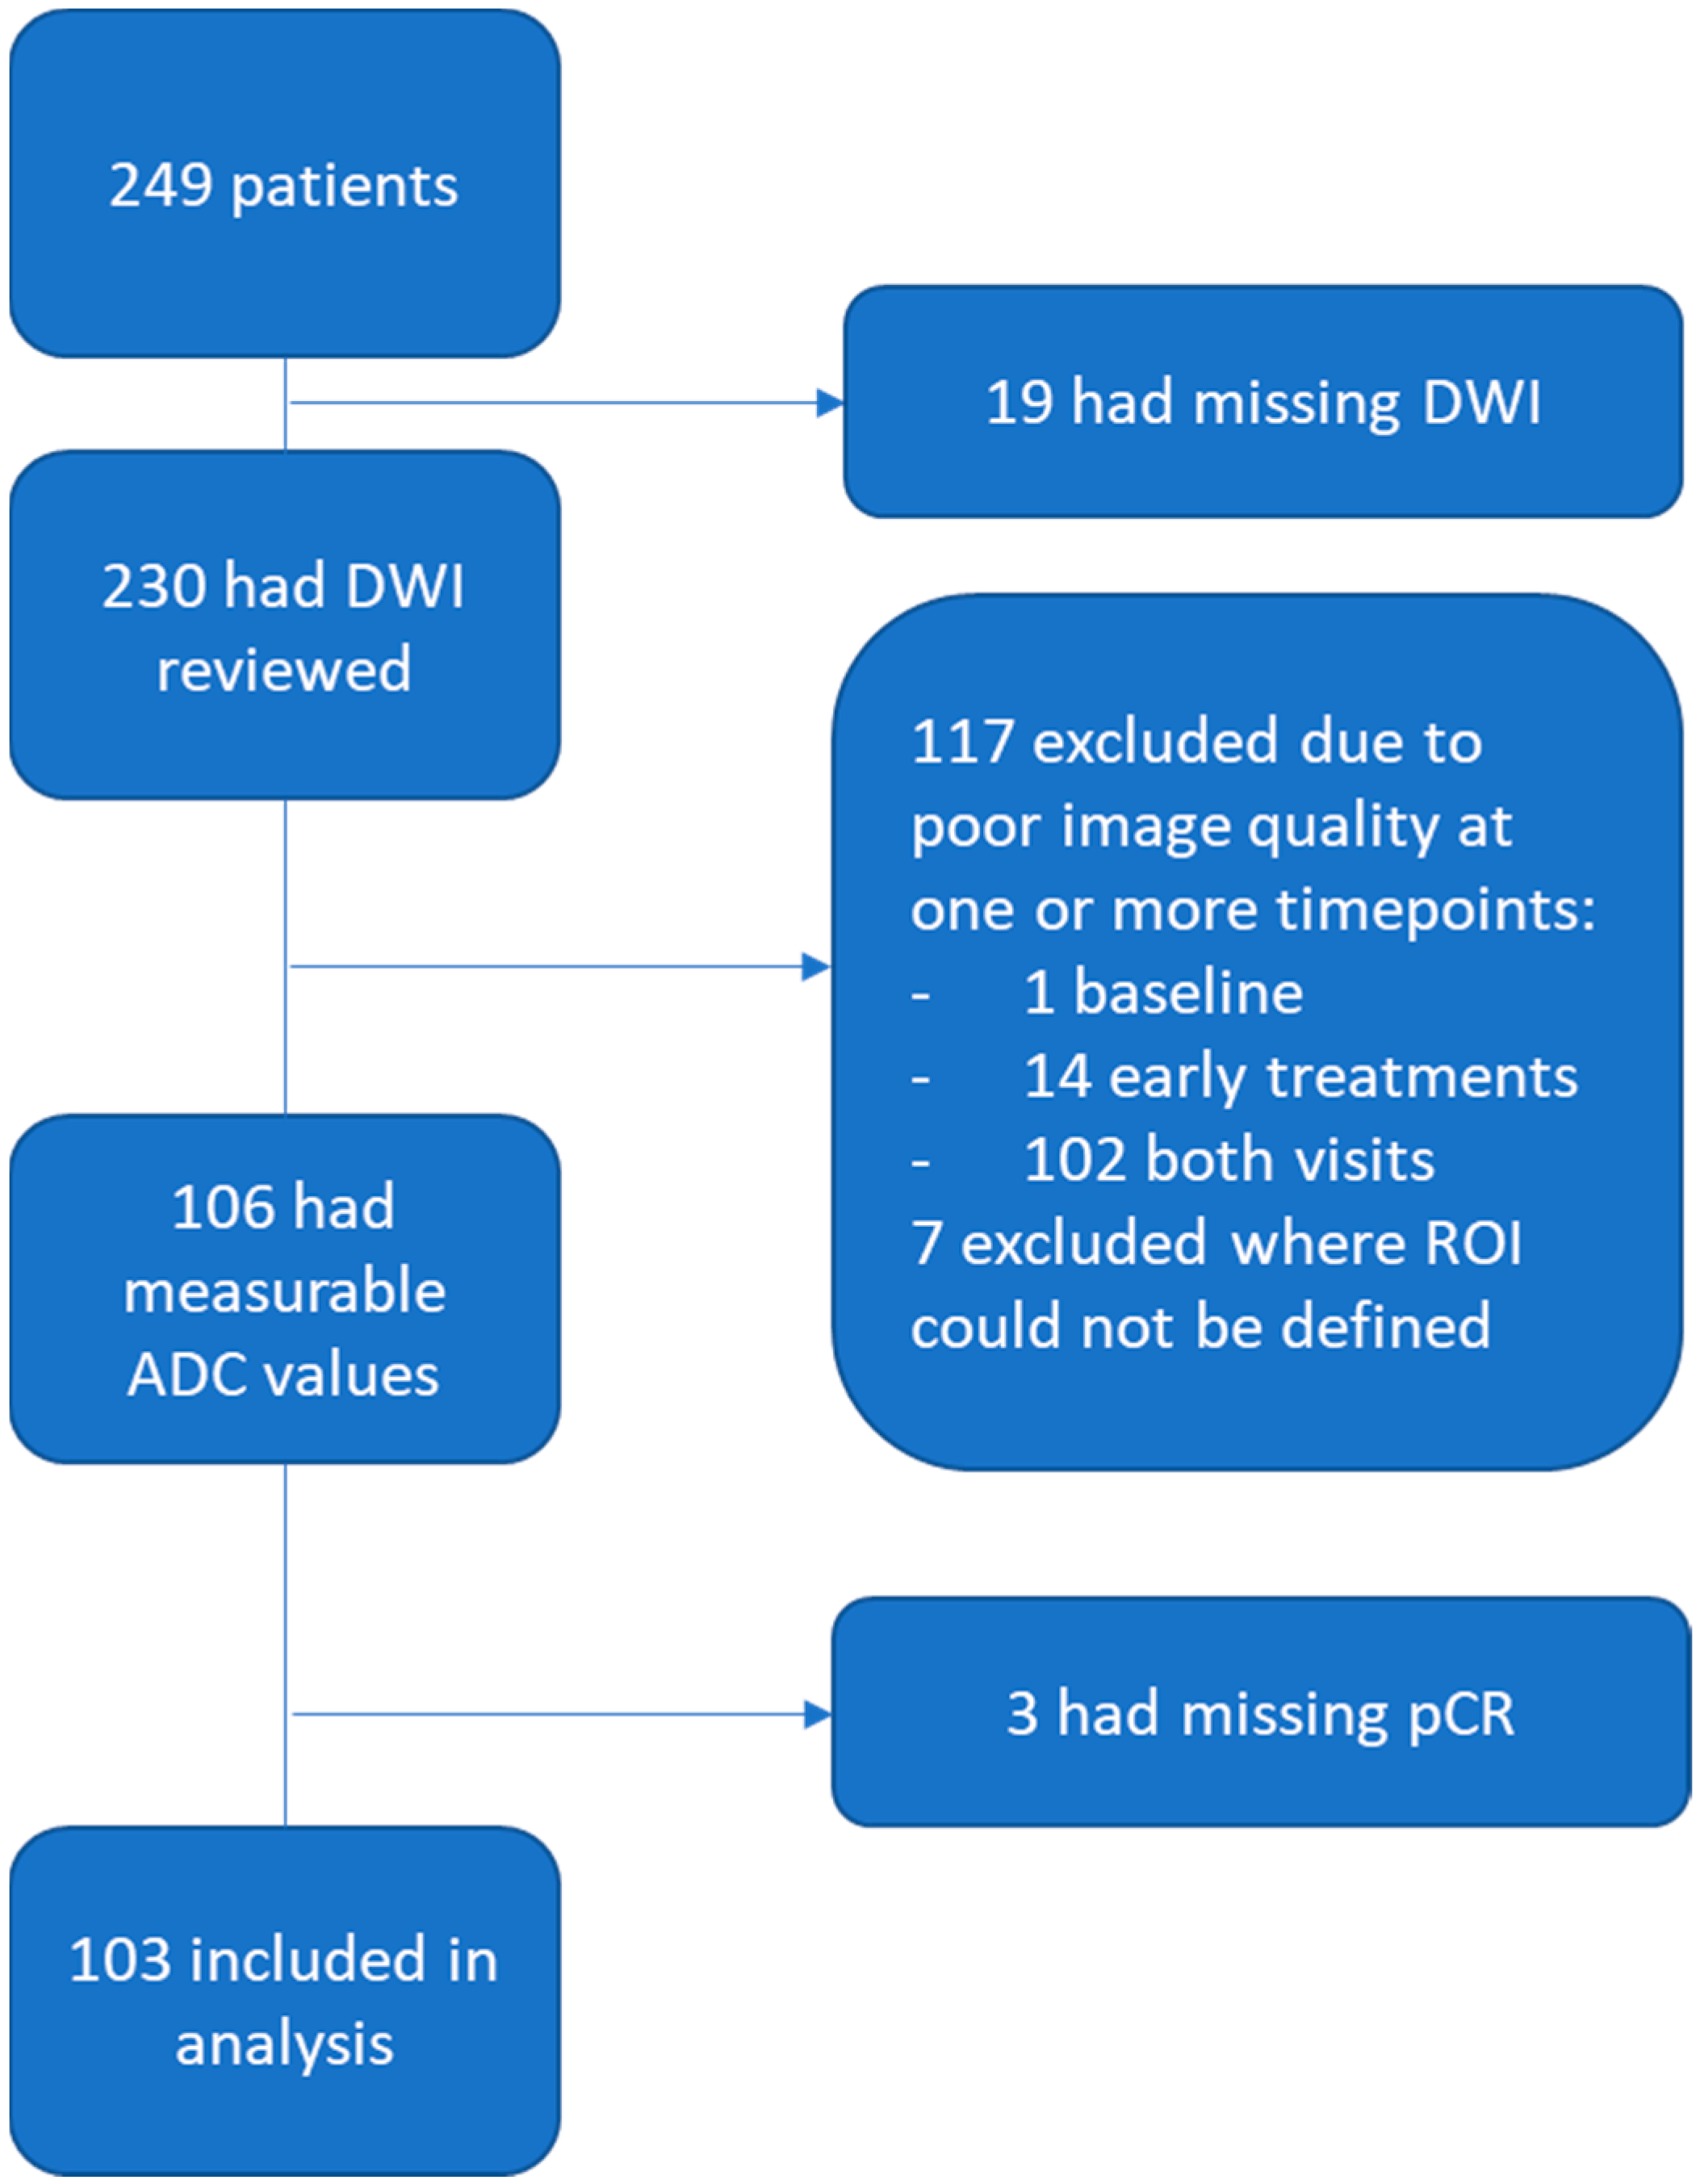
2.1. Patient Population
2.2. Imaging Acquisition
2.3. Image Analysis
2.4. Statistical Analysis
3. Results
3.1. Patient Characteristics
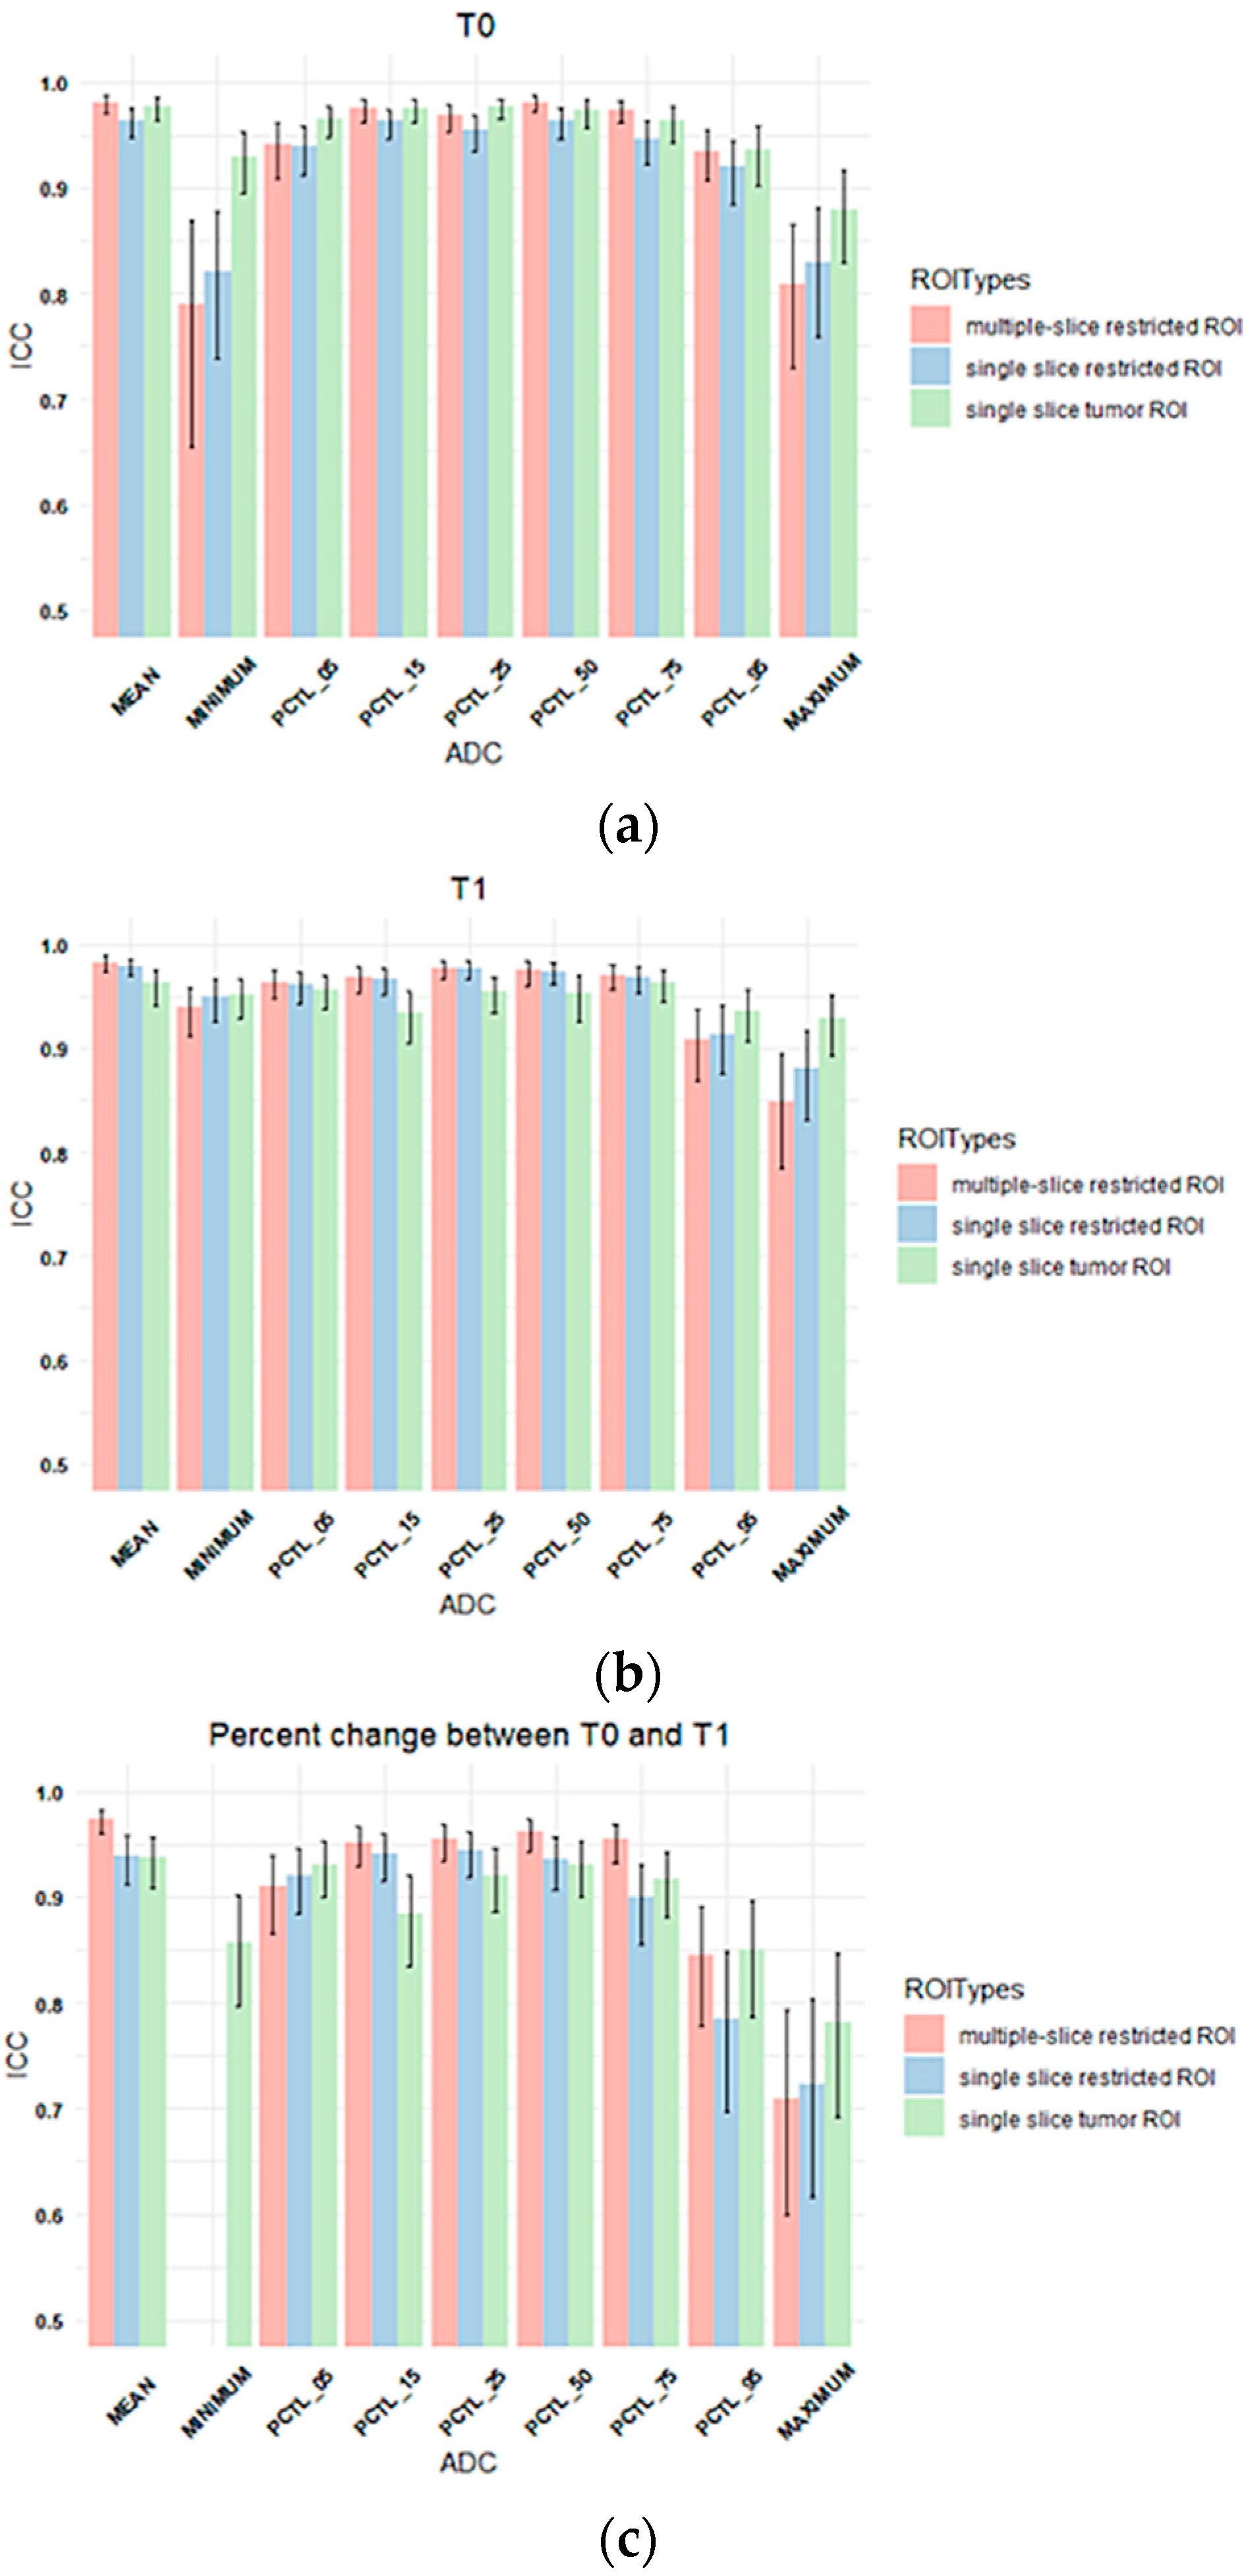
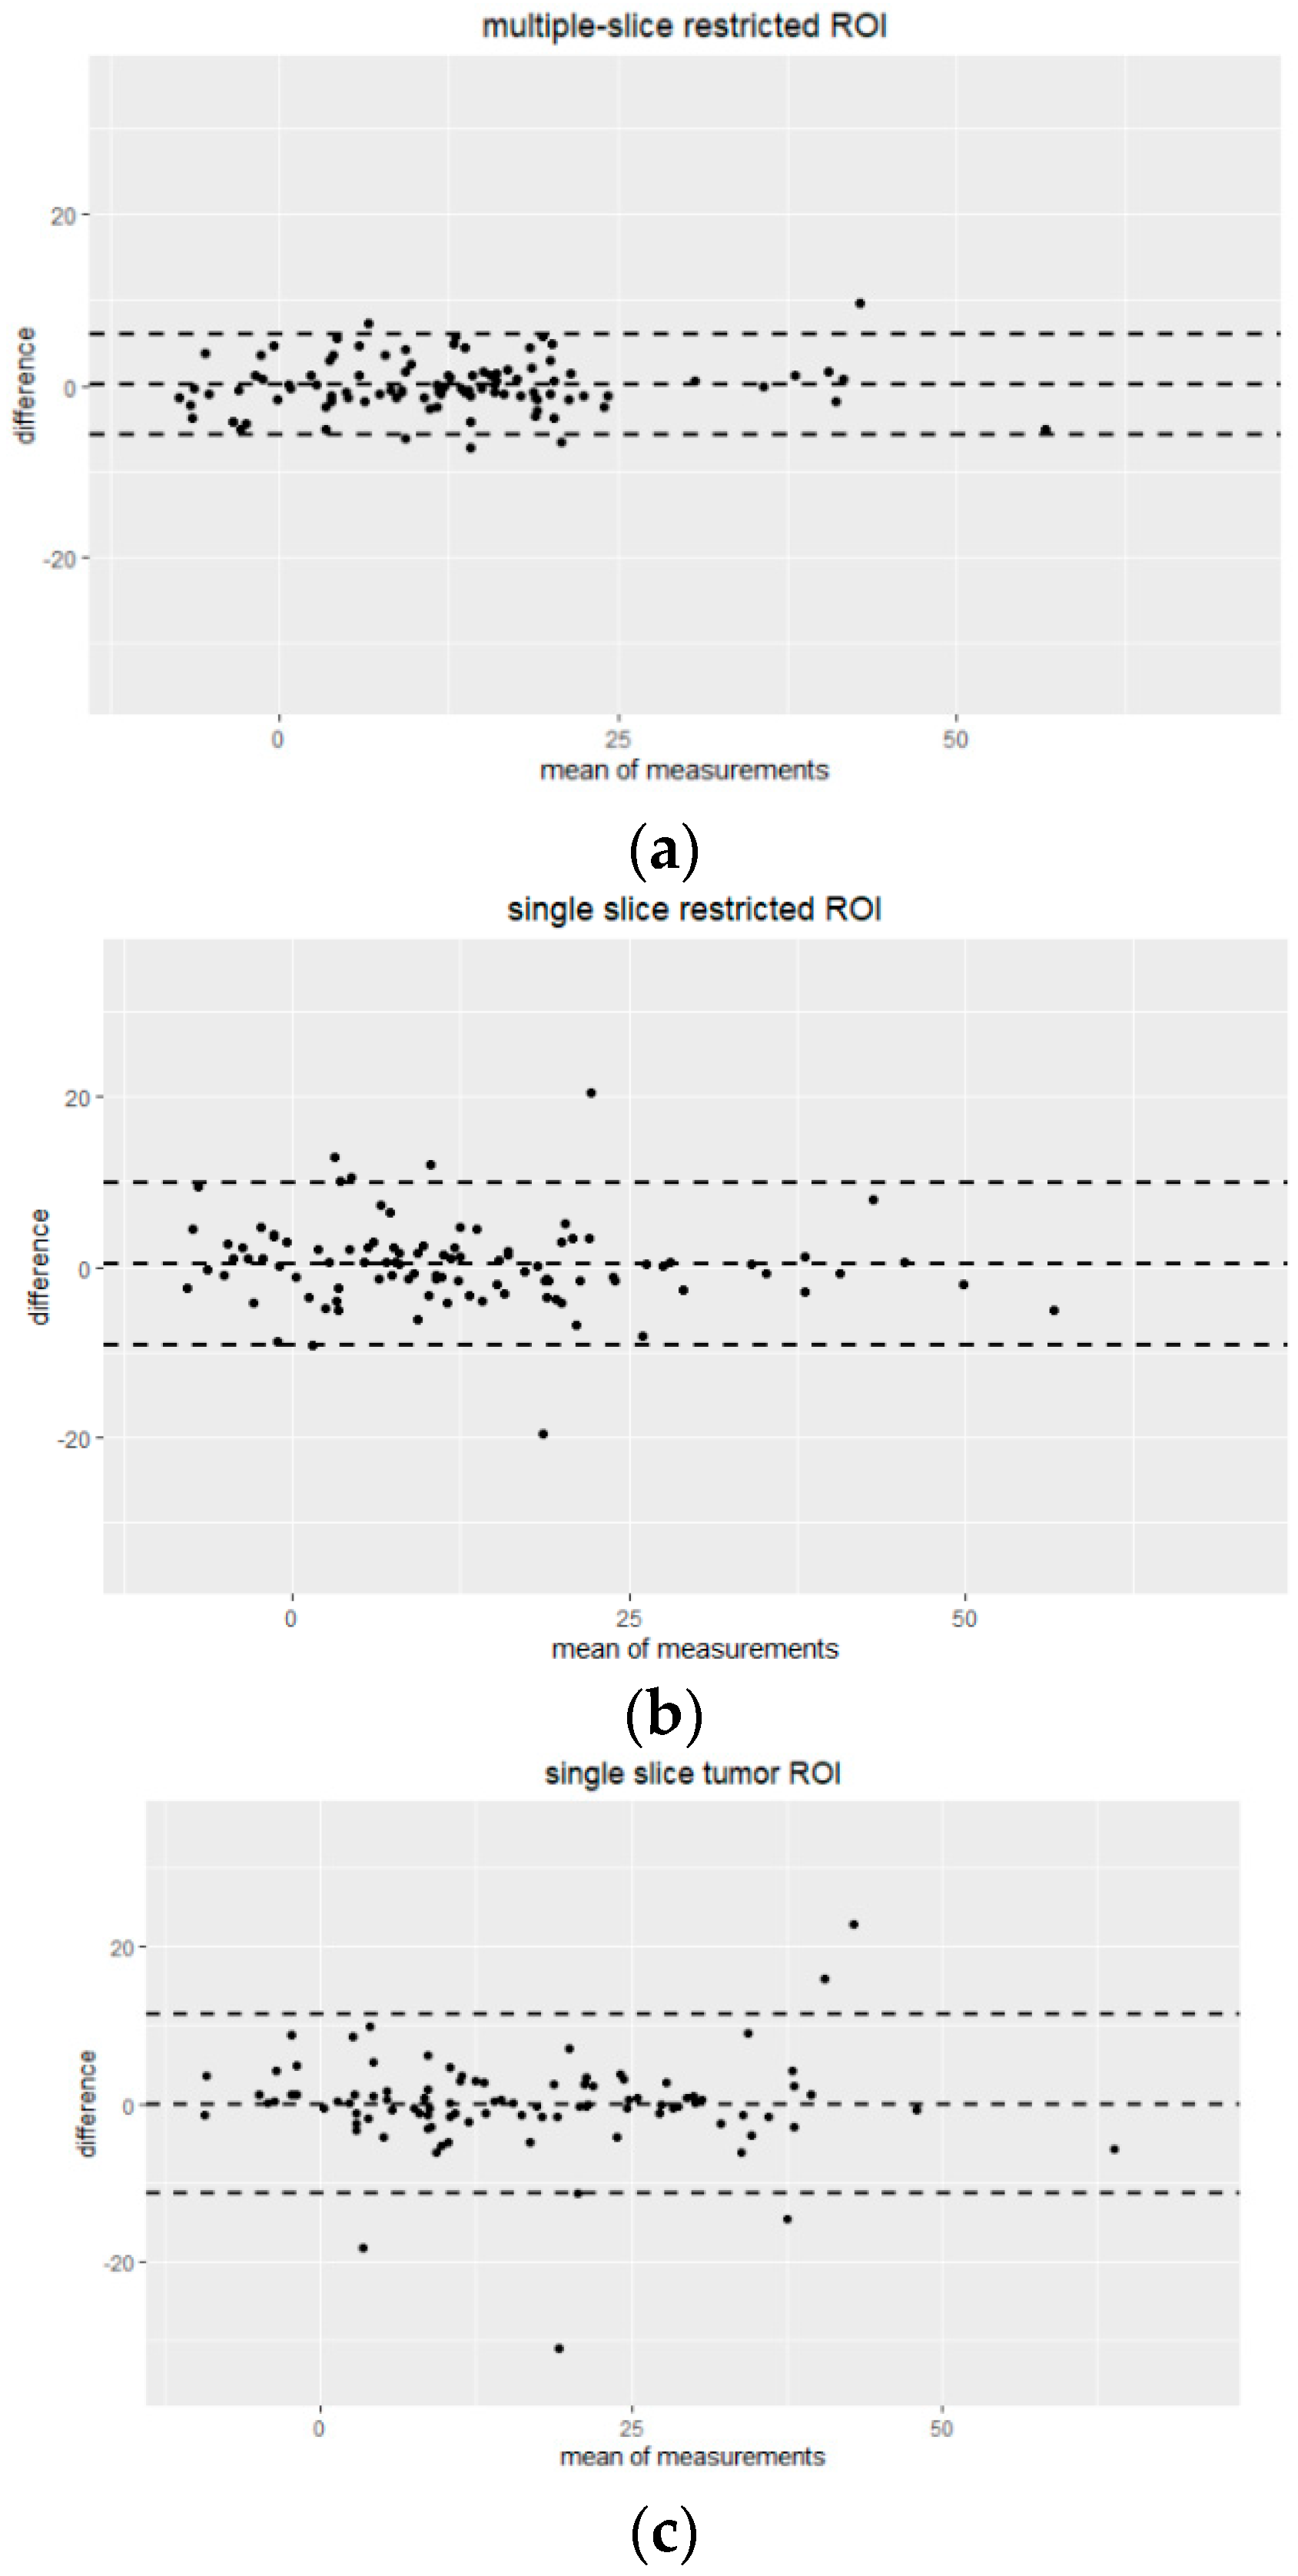
3.2. Inter-Reader Variability
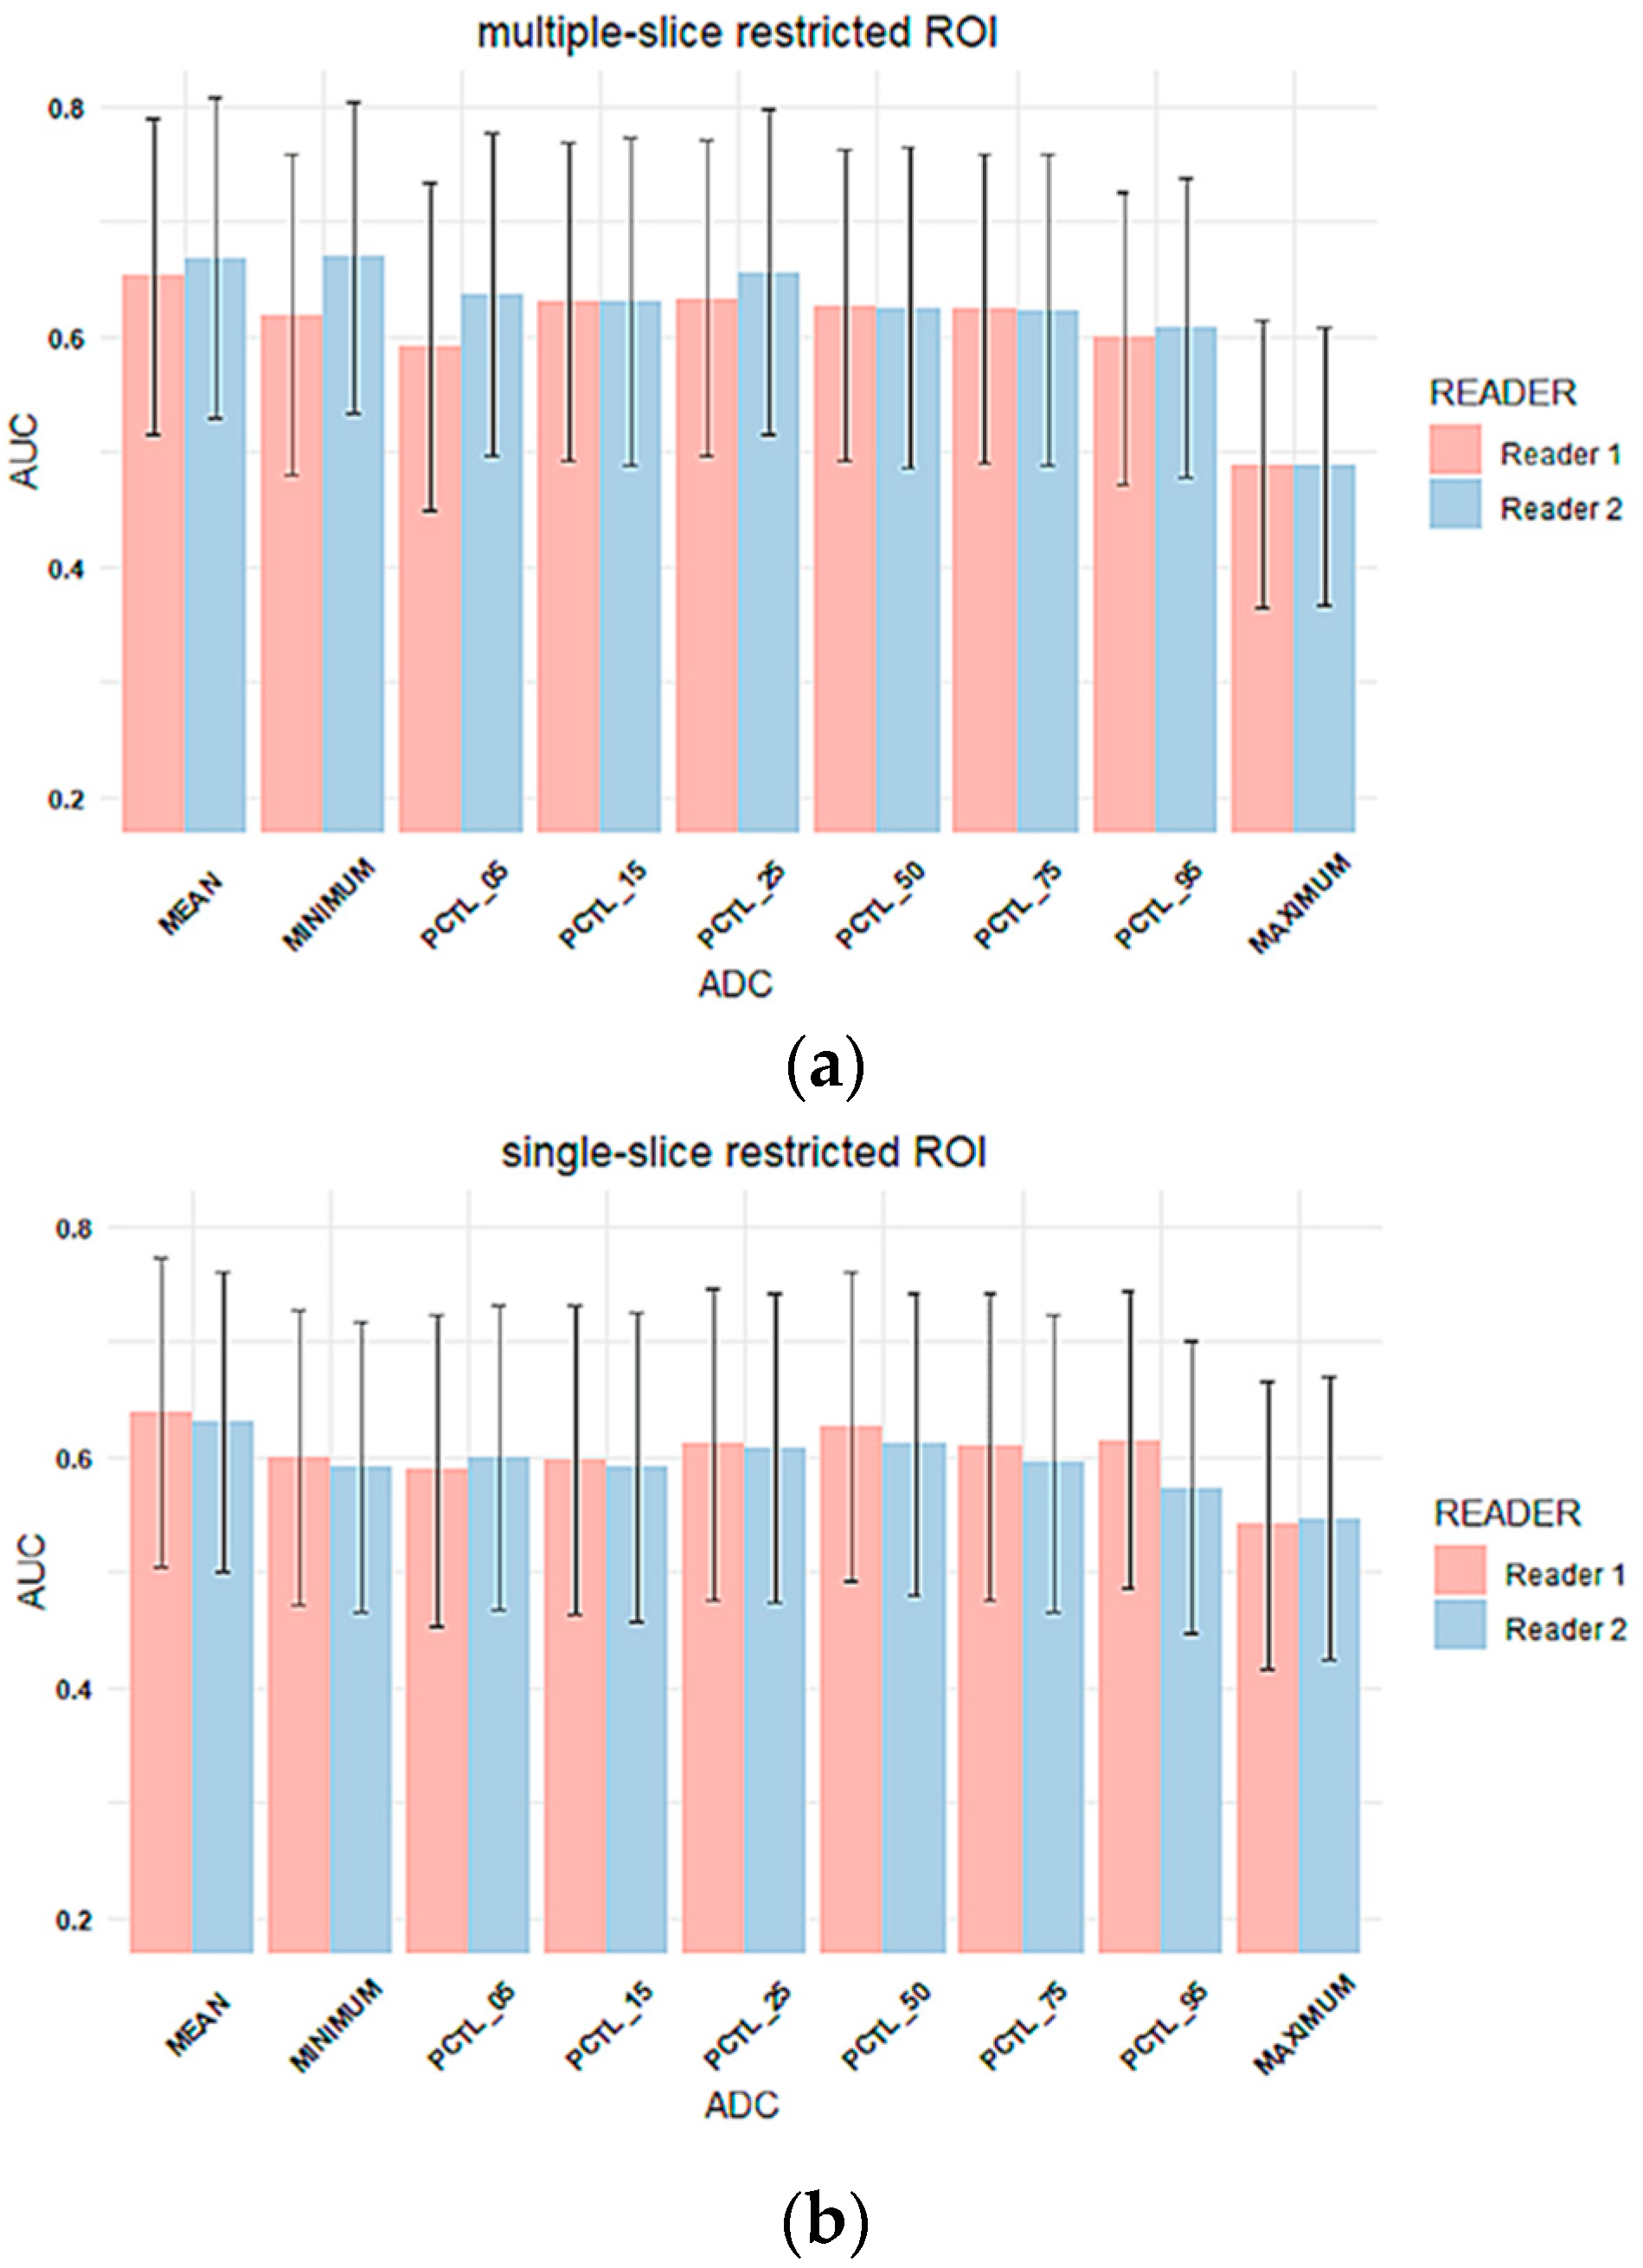
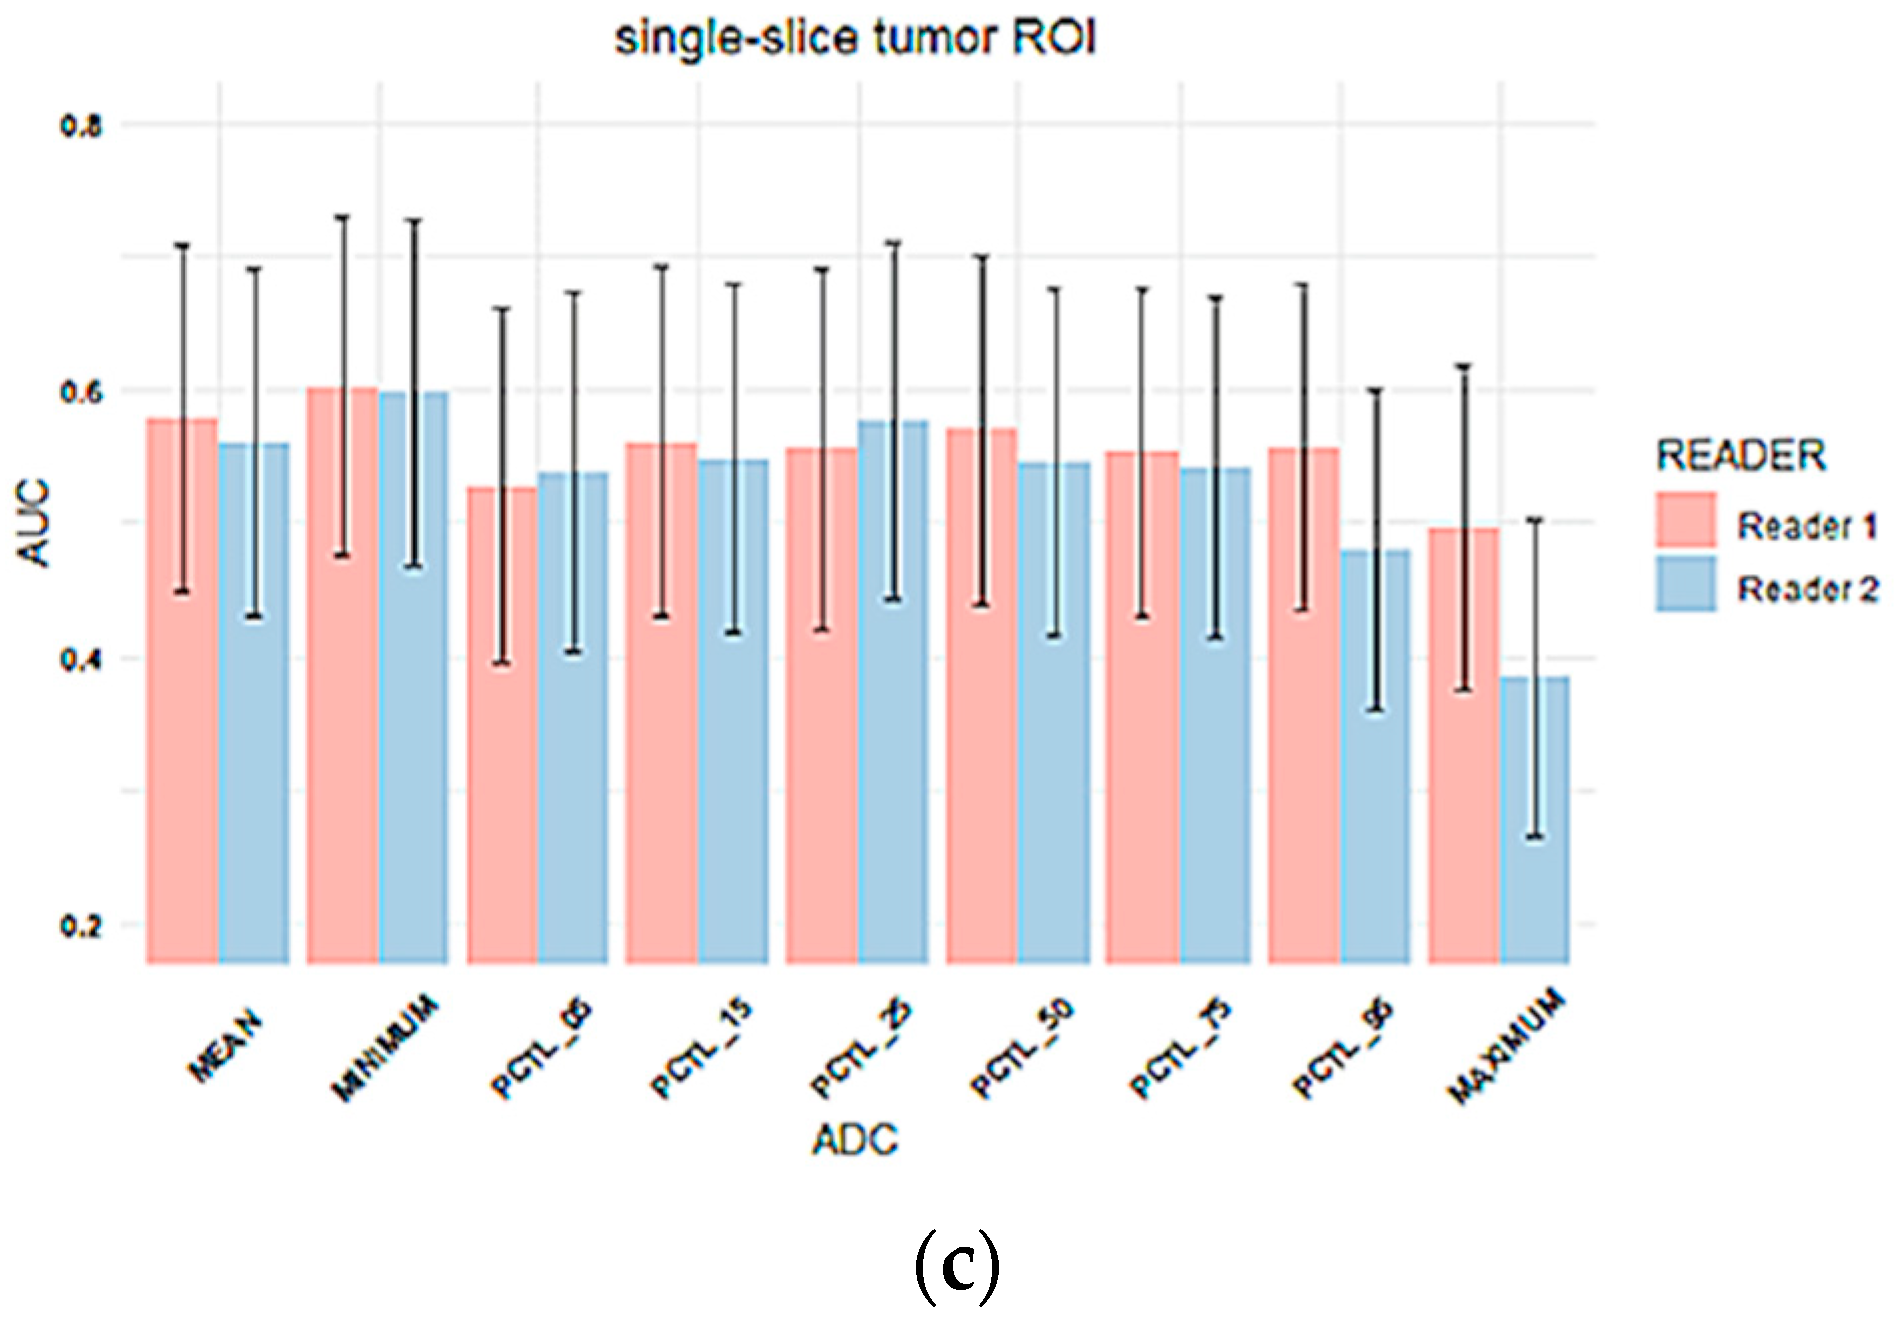
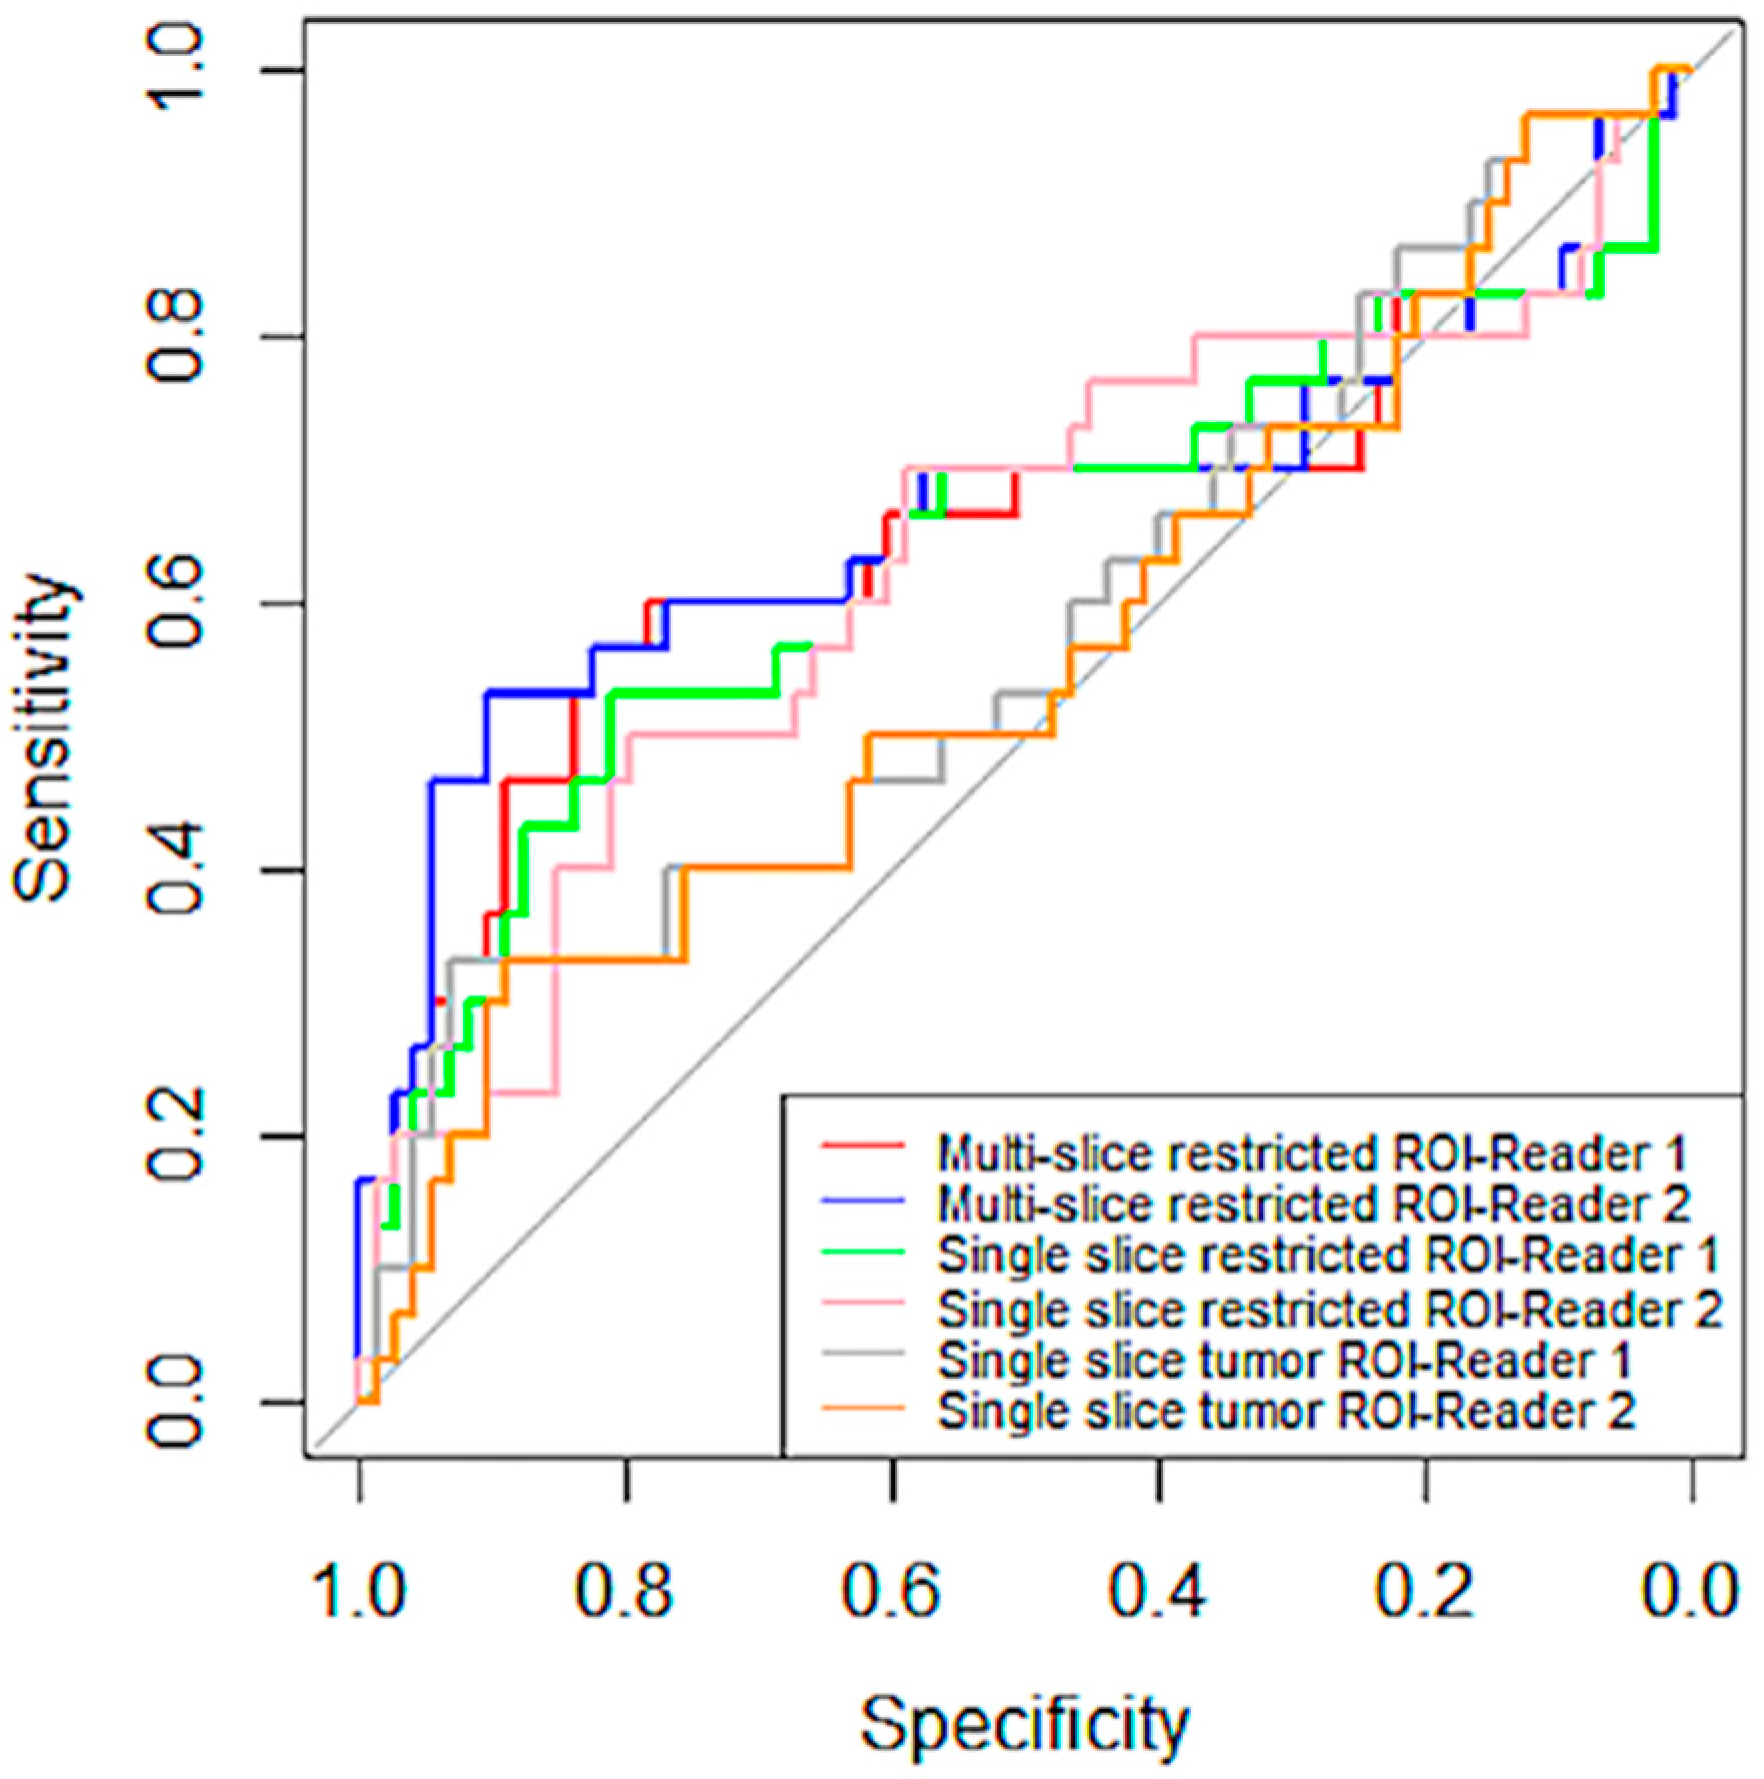
Inter-Reader Variability on Predicting Pathologic Complete Response
4. Discussion
5. Conclusions
Supplementary Materials
Author Contributions
Funding
Institutional Review Board Statement
Informed Consent Statement
Data Availability Statement
Acknowledgments
Conflicts of Interest
References
- Jensen, L.R.; Garzon, B.; Heldahl, M.G.; Bathen, T.F.; Lundgren, S.; Gribbestad, I.S. Diffusion-weighted and dynamic contrast-enhanced MRI in evaluation of early treatment effects during neoadjuvant chemotherapy in breast cancer patients. J. Magn. Reson. Imaging 2011, 34, 1099–1109. [Google Scholar] [CrossRef] [PubMed]
- Galbán, C.J.; Ma, B.; Malyarenko, D.; Pickles, M.D.; Heist, K.; Henry, N.L.; Schott, A.F.; Neal, C.H.; Hylton, N.M.; Rehemtulla, A.; et al. Multi-Site Clinical Evaluation of DW-MRI as a Treatment Response Metric for Breast Cancer Patients Undergoing Neoadjuvant Chemotherapy. PLoS ONE 2015, 10, e0122151. [Google Scholar] [CrossRef] [PubMed] [Green Version]
- Yuan, L.; Li, J.-J.; Li, C.-Q.; Yan, C.-G.; Cheng, Z.-L.; Wu, Y.-K.; Hao, P.; Lin, B.-Q.; Xu, Y.-K. Diffusion-weighted MR imaging of locally advanced breast carcinoma: The optimal time window of predicting the early response to neoadjuvant chemotherapy. Cancer Imaging 2018, 18, 38. [Google Scholar] [CrossRef] [PubMed] [Green Version]
- Hottat, N.A.; Badr, D.A.; Lecomte, S.; Besse-Hammer, T.; Jani, J.C.; Cannie, M.M. Value of diffusion-weighted MRI in predicting early response to neoadjuvant chemotherapy of breast cancer: Comparison between ROI-ADC and whole-lesion-ADC measurements. Eur. Radiol. 2022. [Google Scholar] [CrossRef]
- Partridge, S.C.; McDonald, E.S. Diffusion weighted magnetic resonance imaging of the breast: Protocol optimization, interpretation, and clinical applications. Magn. Reson. Imaging Clin. N. Am. 2013, 21, 601–624. [Google Scholar] [CrossRef] [Green Version]
- Partridge, S.C.; Zhang, Z.; Newitt, D.C.; Gibbs, J.E.; Chenevert, T.L.; Rosen, M.A.; Bolan, P.J.; Marques, H.S.; Romanoff, J.; Cimino, L.; et al. Diffusion-weighted MRI Findings Predict Pathologic Response in Neoadjuvant Treatment of Breast Cancer: The ACRIN 6698 Multicenter Trial. Radiology 2018, 289, 618–627. [Google Scholar] [CrossRef]
- Hylton, N.M.; Partridge, S.C.; Rosen, M.; Kim, E.; L’Heureux, D.Z.; Esseman, L. OT2-03-06: ACRIN 6698 MR Imaging Biomarkers for Assessment of Breast Cancer Response to Neoadjuvant Chemotherapy: A Sub-Study of the I-SPY 2 TRIAL (Investigation of Serial Studies to Predict Your Therapeutic Response with Imaging and moLecular Analysis). Cancer Res. 2011, 71, OT2-03–06. [Google Scholar] [CrossRef]
- Newitt, D.C.; Zhang, Z.; Gibbs, J.E.; Partridge, S.C.; Chenevert, T.L.; Rosen, M.A.; Bolan, P.J.; Marques, H.S.; Aliu, S.; Li, W.; et al. Test-retest repeatability and reproducibility of ADC measures by breast DWI: Results from the ACRIN 6698 trial. J. Magn. Reson. Imaging 2019, 49, 1617–1628. [Google Scholar] [CrossRef]
- Belli, P.; Costantini, M.; Ierardi, C.; Bufi, E.; Amato, D.; Mule’, A.; Nardone, L.; Terribile, D.; Bonomo, L. Diffusion-weighted imaging in evaluating the response to neoadjuvant breast cancer treatment. Breast J. 2011, 17, 610–619. [Google Scholar] [CrossRef]
- Pesapane, F.; Rotili, A.; Penco, S.; Montesano, M.; Agazzi, G.M.; Dominelli, V.; Trentin, C.; Pizzamiglio, M.; Cassano, E. Inter-Reader Agreement of Diffusion-Weighted Magnetic Resonance Imaging for Breast Cancer Detection: A Multi-Reader Retrospective Study. Cancers 2021, 13, 1978. [Google Scholar] [CrossRef]
- van Heeswijk, M.M.; Lambregts, D.M.J.; Maas, M.; Lahaye, M.J.; Ayas, Z.; Slenter, J.M.G.M.; Beets, G.L.; Bakers, F.C.H.; Beets-Tan, R.G.H. Measuring the apparent diffusion coefficient in primary rectal tumors: Is there a benefit in performing histogram analyses? Abdom. Radiol. 2017, 42, 1627–1636. [Google Scholar] [CrossRef] [PubMed] [Green Version]
- Jang, M.; Kim, S.M.; La Yun, B.; Ahn, H.S.; Kim, S.Y.; Kang, E.; Kim, S.-W. Reproducibility of Apparent Diffusion Coefficient Measurements in Malignant Breast Masses. J. Korean Med. Sci. 2015, 30, 1689–1697. [Google Scholar] [CrossRef] [PubMed] [Green Version]
- Lambregts, D.M.J.; Beets, G.L.; Maas, M.; Curvo-Semedo, L.; Kessels, A.G.H.; Thywissen, T.; Beets-Tan, R.G.H. Tumour ADC measurements in rectal cancer: Effect of ROI methods on ADC values and interobserver variability. Eur. Radiol. 2011, 21, 2567–2574. [Google Scholar] [CrossRef] [PubMed] [Green Version]
- Gity, M.; Moradi, B.; Arami, R.; Arabkheradmand, A.; Kazemi, M.A. Two Different Methods of Region-of-Interest Placement for Differentiation of Benign and Malignant Breast Lesions by Apparent Diffusion Coefficient Value. Asian Pac. J. Cancer Prev. 2018, 19, 2765–2770. [Google Scholar] [CrossRef] [PubMed]
- Bonarelli, C.; Teixeira, P.A.G.; Hossu, G.; Meyer, J.-B.; Chen, B.; Gay, F.; Blum, A. Impact of ROI Positioning and Lesion Morphology on Apparent Diffusion Coefficient Analysis for the Differentiation Between Benign and Malignant Nonfatty Soft-Tissue Lesions. Am. J. Roentgenol. 2015, 205, W106–W113. [Google Scholar] [CrossRef]
- Shrout, P.E.; Fleiss, J.L. Intraclass correlations: Uses in assessing rater reliability. Psychol. Bull. 1979, 86, 420–428. [Google Scholar] [CrossRef]
- R: The R Project for Statistical Computing. Available online: https://www.r-project.org/ (accessed on 30 September 2021).
- Robin, X.; Turck, N.; Hainard, A.; Tiberti, N.; Lisacek, F.; Sanchez, J.-C.; Müller, M. pROC: An open-source package for R and S+ to analyze and compare ROC curves. BMC Bioinform. 2011, 12, 77. [Google Scholar] [CrossRef]
- Bickel, H.; Pinker, K.; Polanec, S.; Magometschnigg, H.; Wengert, G.; Spick, C.; Bogner, W.; Bago-Horvath, Z.; Helbich, T.H.; Baltzer, P. Diffusion-weighted imaging of breast lesions: Region-of-interest placement and different ADC parameters influence apparent diffusion coefficient values. Eur. Radiol. 2017, 27, 1883–1892. [Google Scholar] [CrossRef]
- Spick, C.; Bickel, H.; Pinker, K.; Bernathova, M.; Kapetas, P.; Woitek, R.; Clauser, P.; Polanec, S.H.; Rudas, M.; Bartsch, R.; et al. Diffusion-weighted MRI of breast lesions: A prospective clinical investigation of the quantitative imaging biomarker characteristics of reproducibility, repeatability, and diagnostic accuracy. NMR Biomed. 2016, 29, 1445–1453. [Google Scholar] [CrossRef]
- Baltzer, P.; Mann, R.M.; Iima, M.; Sigmund, E.E.; Clauser, P.; Gilbert, F.J.; Martincich, L.; Partridge, S.C.; Patterson, A.; Pinker, K.; et al. Diffusion-weighted imaging of the breast-a consensus and mission statement from the EUSOBI International Breast Diffusion-Weighted Imaging working group. Eur. Radiol. 2020, 30, 1436–1450. [Google Scholar] [CrossRef] [Green Version]
- Nogueira, L.; Brandão, S.; Matos, E.; Nunes, R.G.; Ferreira, H.A.; Loureiro, J.; Ramos, I. Region of interest demarcation for quantification of the apparent diffusion coefficient in breast lesions and its interobserver variability. Diagn. Interv. Radiol. 2015, 21, 123–127. [Google Scholar] [CrossRef] [PubMed] [Green Version]

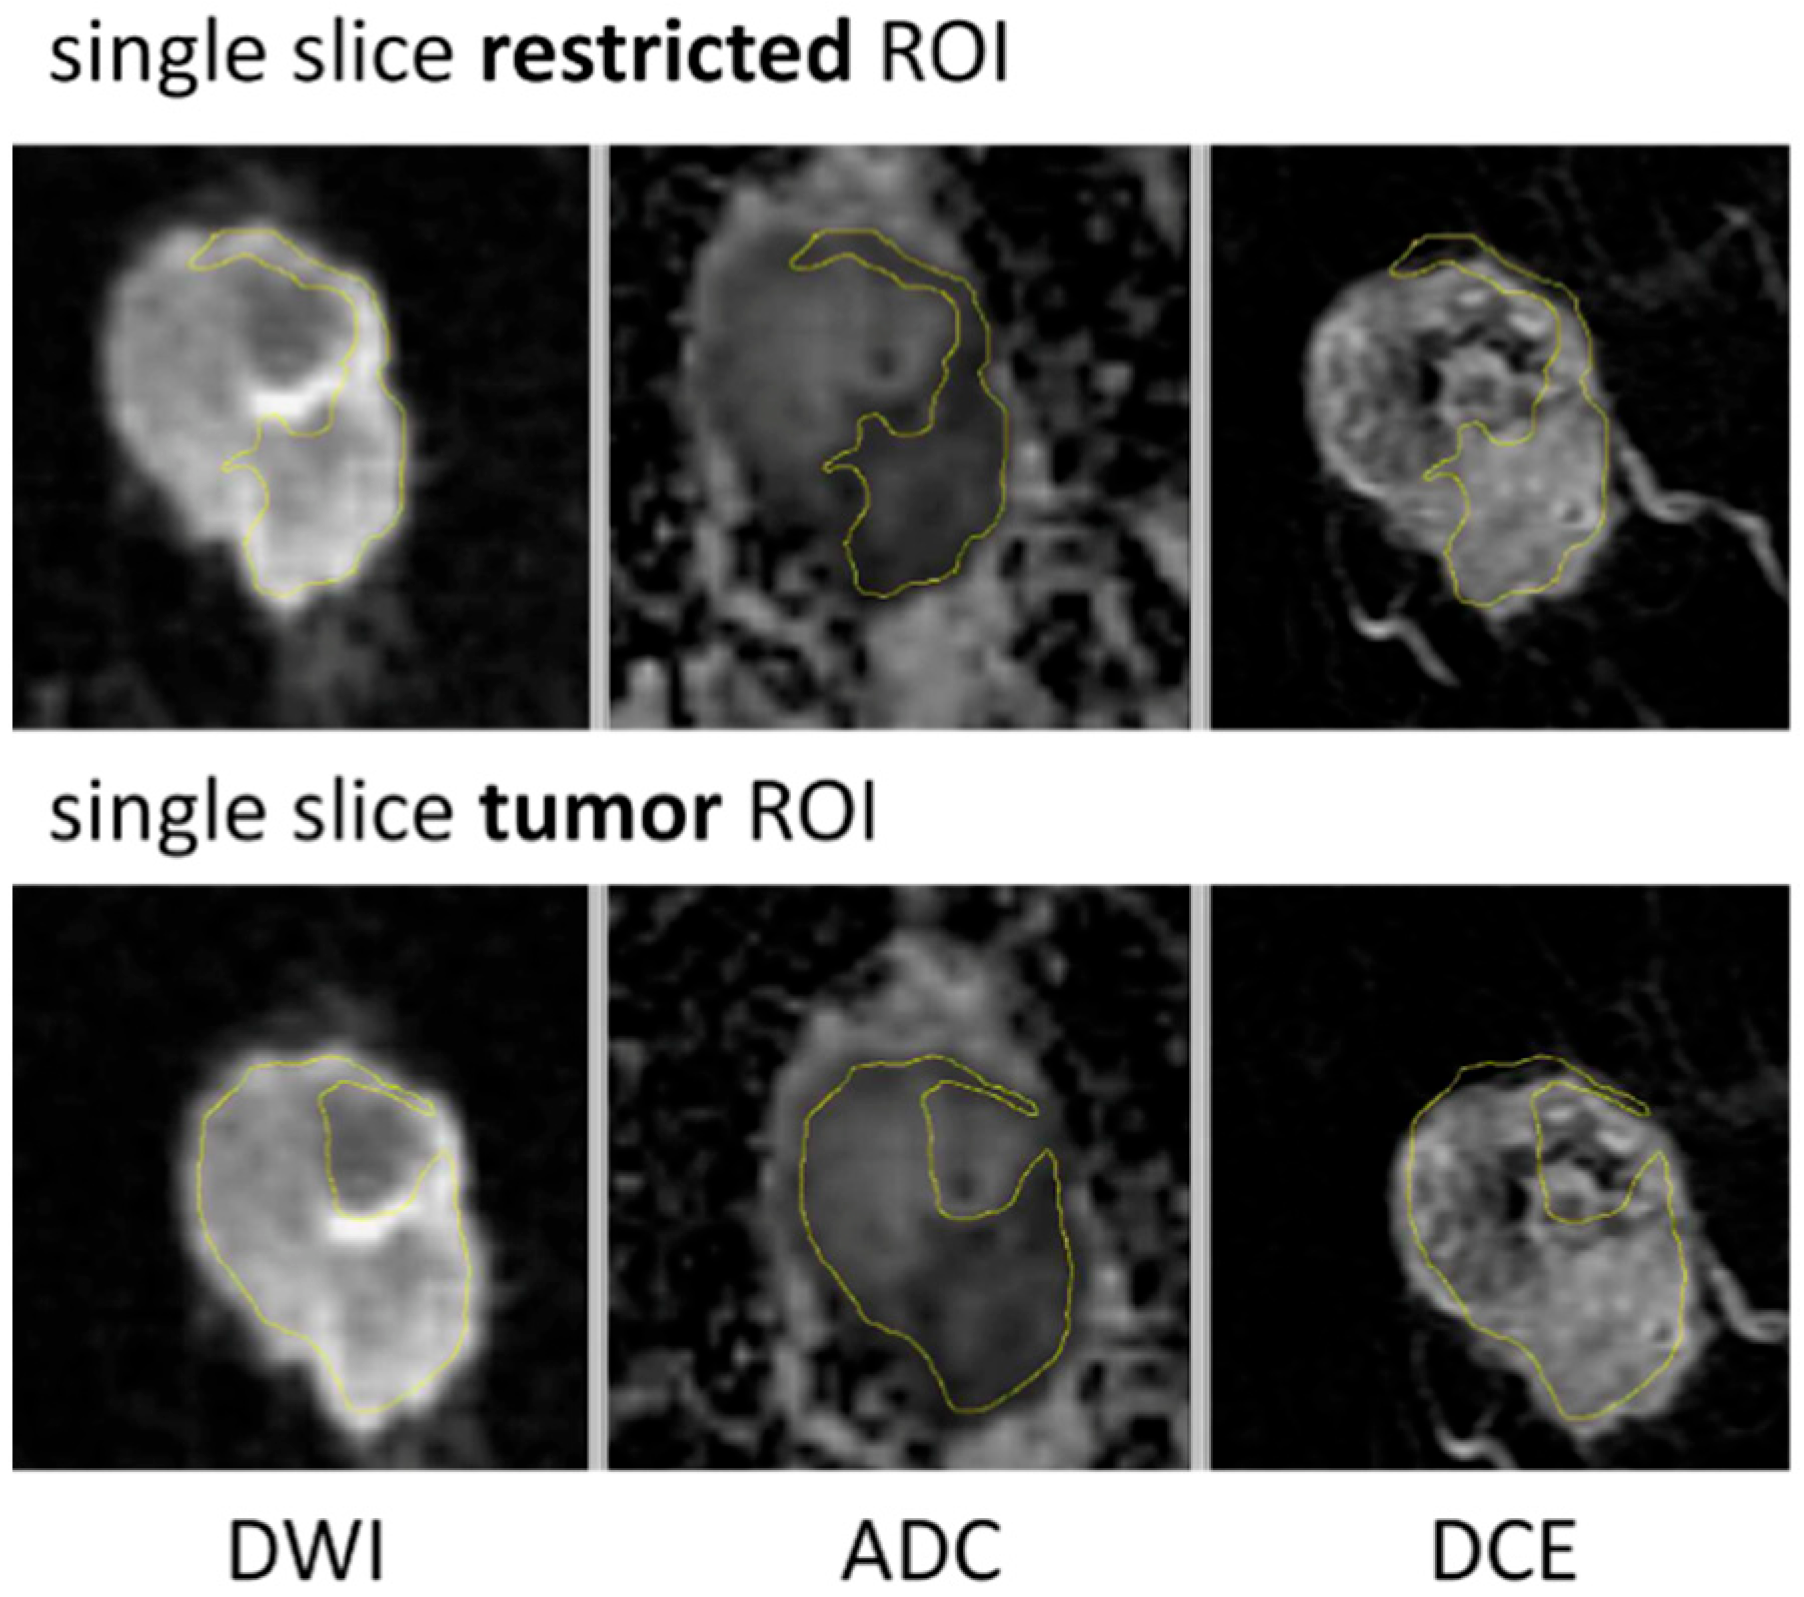
| ROI Type | Description |
|---|---|
| Multiple-slice restricted ROI | Manually sampled area with most restricted diffusion (low ADC) defined within tumor (contrast-enhanced on DCE) and covering all axial slices where tumor was seen |
| Single-slice restricted ROI | Single slice selected from the multiple-slice restricted ROI and matching level of single-slice tumor ROI |
| Single-slice tumor ROI | Manually sampled area corresponding to the full tumor seen on DCE-MRI, defined on the single axial slice with largest tumor area |
| Characteristics | Original Cohort (N = 249) | Analyzed Cohort (N = 103) |
|---|---|---|
| Age | 49 ± 11 | 46 ± 11 |
| Race | ||
| - White | 191 (77%) | 76 (74%) |
| - Black or African American | 32 (13%) | 15 (15%) |
| - Asian | 16 (6%) | 8 (8%) |
| - American Indian or Alaska Native | 4 (2%) | 0 (0%) |
| - Others | 5 (2%) | 3 (3%) |
| Cancer Subtype | ||
| - HR+/HER2- | 134 (54%) | 62 (60%) |
| - HR−/HER2- | 114 (46%) | 41 (40%) |
| Treatment | ||
| - Paclitaxel | 180 (72%) | 75 (73%) |
| - Paclitaxel + Pembrolizumab | 69 (28%) | 28 (27%) |
| Menopausal Status | ||
| - Premenopausal | 126 (51%) | 58 (56%) |
| - Postmenopausal | 72 (29%) | 26 (25%) |
| - Perimenopausal | 13 (5%) | 7 (7%) |
| - Others | 38 (15%) | 12 (12%) |
| Pathologic outcome | ||
| - pCR | 64 (26%) | 30 (29%) |
| - non-pCR | 174 (70%) | 73 (71%) |
| - Unknown | 11 (4%) | 0 (0%) |
| Timepoint | Multiple-Slice Restricted ROI | Single-Slice Restricted ROI | Single-Slice Tumor ROI | |||
|---|---|---|---|---|---|---|
| Reader 1 | Reader 2 | Reader 1 | Reader 2 | Reader 1 | Reader 2 | |
| T0 | 0.930 ± 0.109 | 0.935 ± 0.116 | 0.926 ± 0.112 | 0.932 ± 0.120 | 0.973 ± 0.156 | 0.984 ± 0.153 |
| T1 | 1.031 ± 0.148 | 1.037 ± 0.151 | 1.030 ± 0.159 | 1.033 ± 0.161 | 1.098 ± 0.192 | 1.114 ± 0.202 |
| ROI Types | Reader | Sensitivity | Specificity |
|---|---|---|---|
| Multiple-slice restricted ROI | 1 | 0.82 | 0.57 |
| 2 | 0.90 | 0.53 | |
| Single-slice restricted ROI | 1 | 0.81 | 0.53 |
| 2 | 0.80 | 0.50 | |
| Single-slice tumor ROI | 1 | 0.93 | 0.33 |
| 2 | 0.89 | 0.33 |
Publisher’s Note: MDPI stays neutral with regard to jurisdictional claims in published maps and institutional affiliations. |
© 2022 by the authors. Licensee MDPI, Basel, Switzerland. This article is an open access article distributed under the terms and conditions of the Creative Commons Attribution (CC BY) license (https://creativecommons.org/licenses/by/4.0/).
Share and Cite
Le, N.N.; Li, W.; Onishi, N.; Newitt, D.C.; Gibbs, J.E.; Wilmes, L.J.; Kornak, J.; Partridge, S.C.; LeStage, B.; Price, E.R.; et al. Effect of Inter-Reader Variability on Diffusion-Weighted MRI Apparent Diffusion Coefficient Measurements and Prediction of Pathologic Complete Response for Breast Cancer. Tomography 2022, 8, 1208-1220. https://doi.org/10.3390/tomography8030099
Le NN, Li W, Onishi N, Newitt DC, Gibbs JE, Wilmes LJ, Kornak J, Partridge SC, LeStage B, Price ER, et al. Effect of Inter-Reader Variability on Diffusion-Weighted MRI Apparent Diffusion Coefficient Measurements and Prediction of Pathologic Complete Response for Breast Cancer. Tomography. 2022; 8(3):1208-1220. https://doi.org/10.3390/tomography8030099
Chicago/Turabian StyleLe, Nu N., Wen Li, Natsuko Onishi, David C. Newitt, Jessica E. Gibbs, Lisa J. Wilmes, John Kornak, Savannah C. Partridge, Barbara LeStage, Elissa R. Price, and et al. 2022. "Effect of Inter-Reader Variability on Diffusion-Weighted MRI Apparent Diffusion Coefficient Measurements and Prediction of Pathologic Complete Response for Breast Cancer" Tomography 8, no. 3: 1208-1220. https://doi.org/10.3390/tomography8030099
APA StyleLe, N. N., Li, W., Onishi, N., Newitt, D. C., Gibbs, J. E., Wilmes, L. J., Kornak, J., Partridge, S. C., LeStage, B., Price, E. R., Joe, B. N., Esserman, L. J., & Hylton, N. M. (2022). Effect of Inter-Reader Variability on Diffusion-Weighted MRI Apparent Diffusion Coefficient Measurements and Prediction of Pathologic Complete Response for Breast Cancer. Tomography, 8(3), 1208-1220. https://doi.org/10.3390/tomography8030099