
Prognostic Accuracy of CTP Summary Maps in Patients with Large Vessel Occlusive Stroke and Poor Revascularization after Mechanical Thrombectomy—Comparison of Three Automated Perfusion Software Applications

 , , , , ,
Abstract
1. Introduction
2. Materials and Methods
2.1. Study Population
2.1.1. Imaging and Image Reconstruction
2.1.2. Imaging Analysis
2.1.3. Automated CT Perfusion Software
2.2. Statistical Analysis
3. Results
3.1. Baseline Clinical and Outcome Results
3.2. Perfusion Results
4. Discussion
Our Study Has Several Limitations
5. Conclusions
Author Contributions
Funding
Institutional Review Board Statement
Informed Consent Statement
Data Availability Statement
Conflicts of Interest
Abbreviations and Acronyms
| AIS | acute ischemic stroke |
| LVO | large vessel occlusion |
| TICI | Thrombolysis in cerebral infarction |
| MT | mechanical thrombectomy |
| HV | hypoperfusion volume |
| FIV | follow-up infarct volume |
| HIR | hypoperfusion intensity ratio |
| mRS | modified Rankin Scale |
| ASPECTS | Alberta Stroke Program Early CT Score |
| EVT | endovascular therapy |
| Tmax | time when the residue function reaches its maximum |
| CTP | computed tomography perfusion |
| NECT | non-enhanced computed tomography |
| VPCT | volume perfusion CT |
| CTA | computed tomography angiography |
| ICV | ischemic core volume |
| NIHSS | National Institutes of Health Stroke Scale |
| ICA | internal carotid artery |
References
- Berkhemer, O.A.; Fransen, P.S.S.; Beumer, D.; Berg, L.A.V.D.; Lingsma, H.F.; Yoo, A.J.; Schonewille, W.J.; Vos, J.A.; Nederkoorn, P.J.; Wermer, M.J.H.; et al. A randomized trial of intraarterial treatment for acute ischemic stroke. N. Engl. J. Med. 2015, 372, 11–20. [Google Scholar] [CrossRef] [PubMed]
- Cohen, J.E.; Rabinstein, A.A.; Ramirez-De-Noriega, F.; Gomori, J.M.; Itshayek, E.; Eichel, R.; Leker, R.R. Excellent rates of recanalization and good functional outcome after stent-based thrombectomy for acute middle cerebral artery occlusion. Is it time for a paradigm shift? J. Clin. Neurosc. 2013, 20, 1219–1223. [Google Scholar] [CrossRef] [PubMed]
- Goyal, M.; Demchuk, A.M.; Menon, B.K.; Eesa, M.; Rempel, J.L.; Thornton, J.; Roy, D.; Jovin, T.G.; Willinsky, R.A.; Sapkota, B.L.; et al. Randomized assessment of rapid endovascular treatment of ischemic stroke. N. Engl. J. Med. 2015, 372, 1019–1030. [Google Scholar] [CrossRef] [PubMed]
- Davis, S.M.; Chua, M.G.; Lichtenstein, M.; Rossiter, S.C.; Binns, D.; Hopper, J.L. Cerebral hypoperfusion in stroke prognosis and brain recovery. Stroke 1993, 24, 1691–1696. [Google Scholar] [CrossRef][Green Version]
- Bivard, A.; Levi, C.; Spratt, N.; Parsons, M. Perfusion CT in acute stroke: A comprehensive analysis of infarct and penumbra. Radiology 2013, 267, 543–550. [Google Scholar] [CrossRef]
- Dani, K.A.; Thomas, R.G.; Chappell, F.M.; Shuler, K.; MacLeod, M.J.; Muir, K.W.; Wardlaw, J.M. Computed tomography and magnetic resonance perfusion imaging in ischemic stroke: Definitions and thresholds. Translational Medicine Research Collaboration Multicentre Acute Stroke Imaging Study. Ann. Neurol. 2011, 70, 384–401. [Google Scholar] [CrossRef]
- Ermine, C.M.; Bivard, A.; Parsons, M.W.; Baron, J.-C. The ischemic penumbra: From concept to reality. Int. J. Stroke 2021, 16, 497–509. [Google Scholar] [CrossRef]
- Vagal, A.; Wintermark, M.; Nael, K.; Bivard, A.; Parsons, M.; Grossman, A.W.; Khatri, P. Automated CT perfusion imaging for acute ischemic stroke: Pearls and pitfalls for real-world use. Neurology 2019, 93, 888–898. [Google Scholar] [CrossRef]
- Austein, F.; Riedel, C.; Kerby, T.; Meyne, J.; Binder, A.; Lindner, T.; Huhndorf, M.; Wodarg, F.; Jansen, O. Comparison of Perfusion CT Software to Predict the Final Infarct Volume After Thrombectomy. Stroke 2016, 47, 2311–2317. [Google Scholar] [CrossRef]
- Xiong, Y.; Huang, C.C.; Fisher, M.; Hackney, D.B.; Bhadelia, R.A.; Selim, M.H. Comparison of Automated CT Perfusion Softwares in Evaluation of Acute Ischemic Stroke. J. Stroke Cerebrovasc. Dis. 2019, 28, 104392. [Google Scholar] [CrossRef]
- Muehlen, I.; Sprügel, M.; Hoelter, P.; Hock, S.; Knott, M.; Huttner, H.B.; Schwab, S.; Kallmünzer, B.; Doerfler, A. Comparison of Two Automated Computed Tomography Perfusion Applications to Predict the Final Infarct Volume After Thrombolysis in Cerebral Infarction 3 Recanalization. Stroke 2021, 7, 1657–1664. [Google Scholar] [CrossRef] [PubMed]
- Mokin, M.; Levy, E.I.; Saver, J.L.; Siddiqui, A.H.; Goyal, M.; Bonafé, A.; Cognard, C.; Jahan, R.; Albers, G.W. Predictive Value of RAPID Assessed Perfusion Thresholds on Final Infarct Volume in SWIFT PRIME (Solitaire with the Intention for Thrombectomy as Primary Endovascular Treatment). Stroke 2017, 48, 932–938. [Google Scholar] [CrossRef] [PubMed]
- Calamante, F.; Christensen, S.; Desmond, P.M.; Østergaard, L.; Davis, S.M.; Connelly, A. The physiological significance of the time-to-maximum (Tmax) parameter in perfusion MRI. Stroke 2010, 41, 1169–1174. [Google Scholar] [CrossRef] [PubMed]
- Olivot, J.-M.; Mlynash, M.; Thijs, V.N.; Kemp, S.; Lansberg, M.; Wechsler, L.; Bammer, R.; Marks, M.P.; Albers, G.W. Optimal Tmax threshold for predicting penumbral tissue in acute stroke. Stroke 2009, 40, 469–475. [Google Scholar] [CrossRef]
- Bang, O.Y.; Saver, J.L.; Alger, J.R.; Starkman, S.; Ovbiagele, B.; Liebeskind, D.S.; UCLA Collateral Investigators. Determinants of the distribution and severity of hypoperfusion in patients with ischemic stroke. Neurology 2008, 71, 1804–1811. [Google Scholar] [CrossRef]
- Keenan, K.J.; Christensen, S.; Inoue, M.; Mlynash, M.; Albers, G.W.; Smith, W.S. Validation and iteration of CT perfusion defined malignant profile thresholds for acute ischemic stroke. Int. J. Stroke. 2020, 15, 55–60. [Google Scholar] [CrossRef]
- Wang, C.-M.; Chang, Y.-M.; Sung, P.-S.; Chen, C.-H. Hypoperfusion Index Ratio as a Surrogate of Collateral Scoring on CT Angiogram in Large Vessel Stroke. J. Clin. Med. 2021, 10, 1296. [Google Scholar] [CrossRef]
- Olivot, J.M.; Mlynash, M.; Inoue, M.; Marks, M.P.; Wheeler, H.M.; Kemp, S.; Straka, M.; Zaharchuk, G.; Bammer, R.; Lansberg, M.; et al. Hypoperfusion intensity ratio predicts infarct progression and functional outcome in the DEFUSE 2 Cohort. Stroke 2014, 45, 1018–1023. [Google Scholar] [CrossRef]
- Kauw, F.; Heit, J.J.; Martin, B.W.; van Ommen, F.; Kappelle, L.J.; Velthuis, B.K.; De Jong, H.W.; Dankbaar, J.W.; Wintermark, M. Computed Tomography Perfusion Data for Acute Ischemic Stroke Evaluation Using Rapid Software: Pitfalls of Automated Postprocessing. J. Comput. Assist. Tomogr. 2020, 44, 75–77. [Google Scholar] [CrossRef]
- Rao, V.L.; Mlynash, M.; Christensen, S.; Yennu, A.; Kemp, S.; Zaharchuk, G.; Heit, J.J.; Marks, M.P.; Lansberg, M.G.; Albers, G.W. Collateral status contributes to differences between observed and predicted 24-h infarct volumes in DEFUSE 3. J. Cereb. Blood Flow Metab. 2020, 40, 1966–1974. [Google Scholar] [CrossRef]
- Guenego, A.; Mlynash, M.; Christensen, S.; Bs, S.K.; Heit, J.J.; Lansberg, M.G.; Albers, G.W. Hypoperfusion ratio predicts infarct growth during transfer for thrombectomy. Ann. Neurol. 2018, 84, 616–620. [Google Scholar] [CrossRef]
- Guenego, A.; Fahed, R.; Albers, G.W.; Kuraitis, G.; Sussman, E.S.; Martin, B.W.; Marcellus, D.G.; Olivot, J.; Marks, M.P.; Lansberg, M.G.; et al. Hypoperfusion intensity ratio correlates with angiographic collaterals in acute ischaemic stroke with M1 occlusion. Eur. J. Neurol. 2020, 27, 864–870. [Google Scholar] [CrossRef] [PubMed]
- Lyndon, D.; Broek, M.V.D.; Niu, B.; Yip, S.; Rohr, A.; Settecase, F. Hypoperfusion Intensity Ratio Correlates with CTA Collateral Status in Large-Vessel Occlusion Acute Ischemic Stroke. Am. J. Neuroradiol. 2021, 42, 1380–1386. [Google Scholar] [CrossRef] [PubMed]
- Baek, J.-H.; Kim, Y.; Lee, K.; Choi, J.; Baik, M.; Kim, B.; Kim, D.; Heo, J.; Nam, H. Low Hypoperfusion Intensity Ratio Is Associated with a Favorable Outcome Even in Large Ischemic Core and Delayed Recanalization Time. J. Clin. Med. 2021, 10, 1869. [Google Scholar] [CrossRef]
- Guenego, A.; Marcellus, D.G.; Martin, B.W.; Christensen, S.; Albers, G.W.; Lansberg, M.G.; Marks, M.P.; Wintermark, M.; Heit, J.J. Hypoperfusion Intensity Ratio Is Correlated with Patient Eligibility for Thrombectomy. Stroke 2019, 50, 917–922. [Google Scholar] [CrossRef] [PubMed]
- Monteiro, A.; Cortez, G.M.; Greco, E.; Aghaebrahim, A.; Sauvageau, E.; Hanel, R.A. Hypoperfusion intensity ratio for refinement of elderly patient selection for endovascular thrombectomy. J. NeuroInterv. Surg. 2022, 14, 242–247. [Google Scholar] [CrossRef] [PubMed]
- Murray, N.M.; Culbertson, C.J.; Wolman, D.N.; Mlynash, M.; Lansberg, M.G. Hypoperfusion Intensity Ratio Predicts Malignant Edema and Functional Outcome in Large-Vessel Occlusive Stroke with Poor Revascularization. Neurocrit. Care 2021, 35, 79–86. [Google Scholar] [CrossRef] [PubMed]


| Patient Demographics | |
|---|---|
| Number of patients, n | 39 |
| Age, mean (SD), [years] | 76 (±11) |
| Female, n (%) | 23 (59) |
| Clinical characteristics | |
| Hypertonus, n (%) | 29 (74.3) |
| Diabetes, n (%) | 10 (25.6) |
| Hypercholesterolemia, n (%) | 16 (41) |
| Arterial fibrillation, n (%) | 19 (48.7) |
| Smoking, n (%) | 4 (10.3) |
| Admission National Institutes of Health Stroke Scale (NIHSS) score, median (IQR) | 17 (13–20) |
| Onset-to-imaging time, mean (SD), [min] | 240 (±228) |
| Prestroke modified Rankin Scale (mRS), median (IQR) | 0 (0-3) |
| Imaging characteristics | |
| Location of occlusion in left hemisphere, n (%) | 20 (51.3) |
| Site of occlusion, n (%) | |
| Internal Carotid Artery (ICA) | 5 (12.8) |
| Carotid T | 13 (33.3) |
| M1 segment | 14 (35.9) |
| M2 segment | 7 (18) |
| Clot Burden Score (CBS), median (IQR) | 5 (3–7) |
| ICA stenosis, n (%) | 5 (12.8) |
| Admission Alberta Stroke Program Early CT Score (ASPECTS), median | |
| (IQR) | 8 (7–10) |
| Treatment characteristics | |
| Bridging therapy with intravenous tPA, n (%) | 29 (74.4) |
| General anesthesia, n (%) | 33 (84.6) |
| procedure time, mean (SD), [min] | 146 (±108) |
| time interval from CTP to the end of the procedure, mean (SD), [min] | 194 (±113) |
| recanalization attempts, median (IQR) | 4 (2–6) |
| ICA stenting, n (%) | 3 (7.8) |
| recanalization technique, n (%) | |
| Stent retriever | 8 (20.5) |
| aspiration | 2 (5.1) |
| combination of both | 29 (74.4) |
| thrombus reached, n (%) | 34 (87.2) |
| thrombus passed, n (%) | 22 (56.4) |
| Outcome characteristics | |
| TICI, n (%) | |
| 0 | 25 (64.1) |
| 1 | 4 (10.3) |
| 2a | 10 (25.6) |
| Follow-up infarct volume, median (IQR), [mL] | 180 (90–248) |
| Follow-up ASPECTS, median (IQR) | 3 (1–5) |
| 3-month mRS, median (IQR) | 5 (4–6) |
| RAPID | Brainomix | Syngo | |
|---|---|---|---|
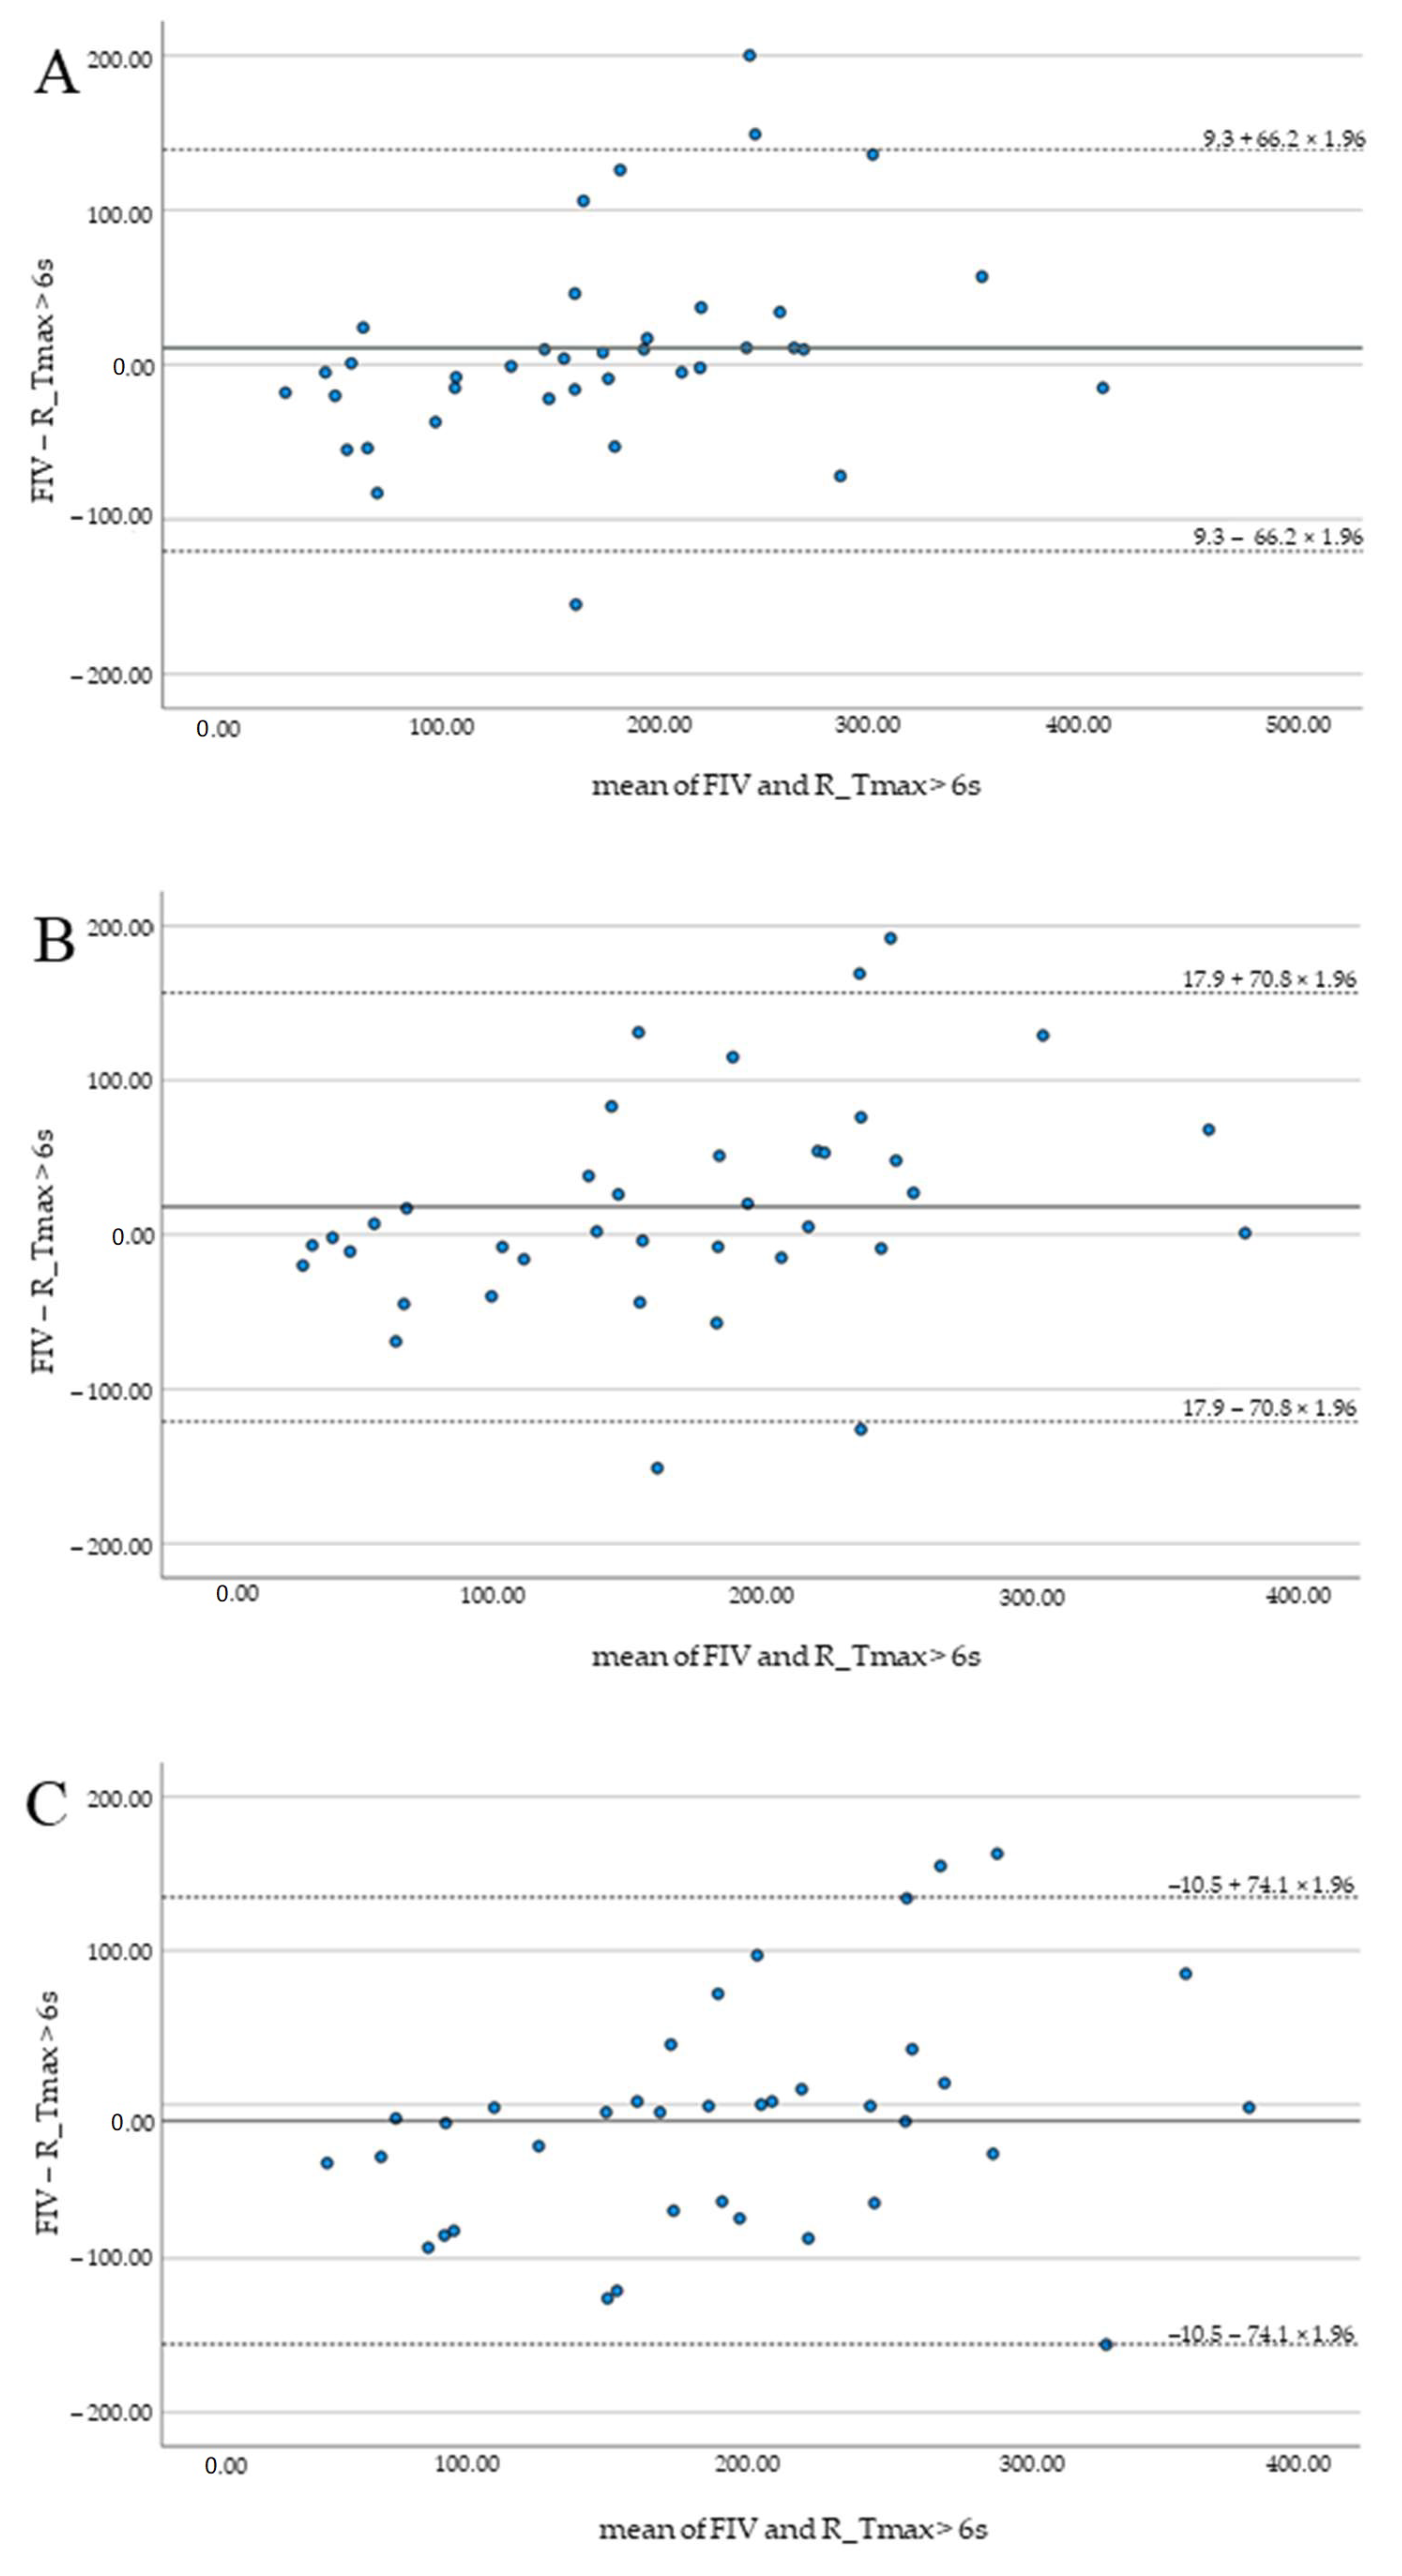
| Mean difference (SD) of FIV and HV (mL) | 9.3 (66.2) | 17.9 (70.8) | −10.5 (74.1) |
| Pearson correlation (r) of FIV and HV | 0.78 | 0.74 | 0.70 |
Publisher’s Note: MDPI stays neutral with regard to jurisdictional claims in published maps and institutional affiliations. |
© 2022 by the authors. Licensee MDPI, Basel, Switzerland. This article is an open access article distributed under the terms and conditions of the Creative Commons Attribution (CC BY) license (https://creativecommons.org/licenses/by/4.0/).
Share and Cite
Muehlen, I.; Borutta, M.; Siedler, G.; Engelhorn, T.; Hock, S.; Knott, M.; Hoelter, P.; Volbers, B.; Schwab, S.; Doerfler, A. Prognostic Accuracy of CTP Summary Maps in Patients with Large Vessel Occlusive Stroke and Poor Revascularization after Mechanical Thrombectomy—Comparison of Three Automated Perfusion Software Applications. Tomography 2022, 8, 1350-1362. https://doi.org/10.3390/tomography8030109
Muehlen I, Borutta M, Siedler G, Engelhorn T, Hock S, Knott M, Hoelter P, Volbers B, Schwab S, Doerfler A. Prognostic Accuracy of CTP Summary Maps in Patients with Large Vessel Occlusive Stroke and Poor Revascularization after Mechanical Thrombectomy—Comparison of Three Automated Perfusion Software Applications. Tomography. 2022; 8(3):1350-1362. https://doi.org/10.3390/tomography8030109
Chicago/Turabian StyleMuehlen, Iris, Matthias Borutta, Gabriela Siedler, Tobias Engelhorn, Stefan Hock, Michael Knott, Philip Hoelter, Bastian Volbers, Stefan Schwab, and Arnd Doerfler. 2022. "Prognostic Accuracy of CTP Summary Maps in Patients with Large Vessel Occlusive Stroke and Poor Revascularization after Mechanical Thrombectomy—Comparison of Three Automated Perfusion Software Applications" Tomography 8, no. 3: 1350-1362. https://doi.org/10.3390/tomography8030109
APA StyleMuehlen, I., Borutta, M., Siedler, G., Engelhorn, T., Hock, S., Knott, M., Hoelter, P., Volbers, B., Schwab, S., & Doerfler, A. (2022). Prognostic Accuracy of CTP Summary Maps in Patients with Large Vessel Occlusive Stroke and Poor Revascularization after Mechanical Thrombectomy—Comparison of Three Automated Perfusion Software Applications. Tomography, 8(3), 1350-1362. https://doi.org/10.3390/tomography8030109