
MDCT Imaging of Non-Traumatic Thoracic Aortic Emergencies and Its Impact on Diagnosis and Management—A Reappraisal

 ,
,  , , , and
Abstract
1. Introduction
1.1. Thoracic Aorta Anatomy: Key Points of Imaging

|
|
|
|
|
|
|
|
|
|
|
|
|
|
1.2. CTA Technique
- (1)
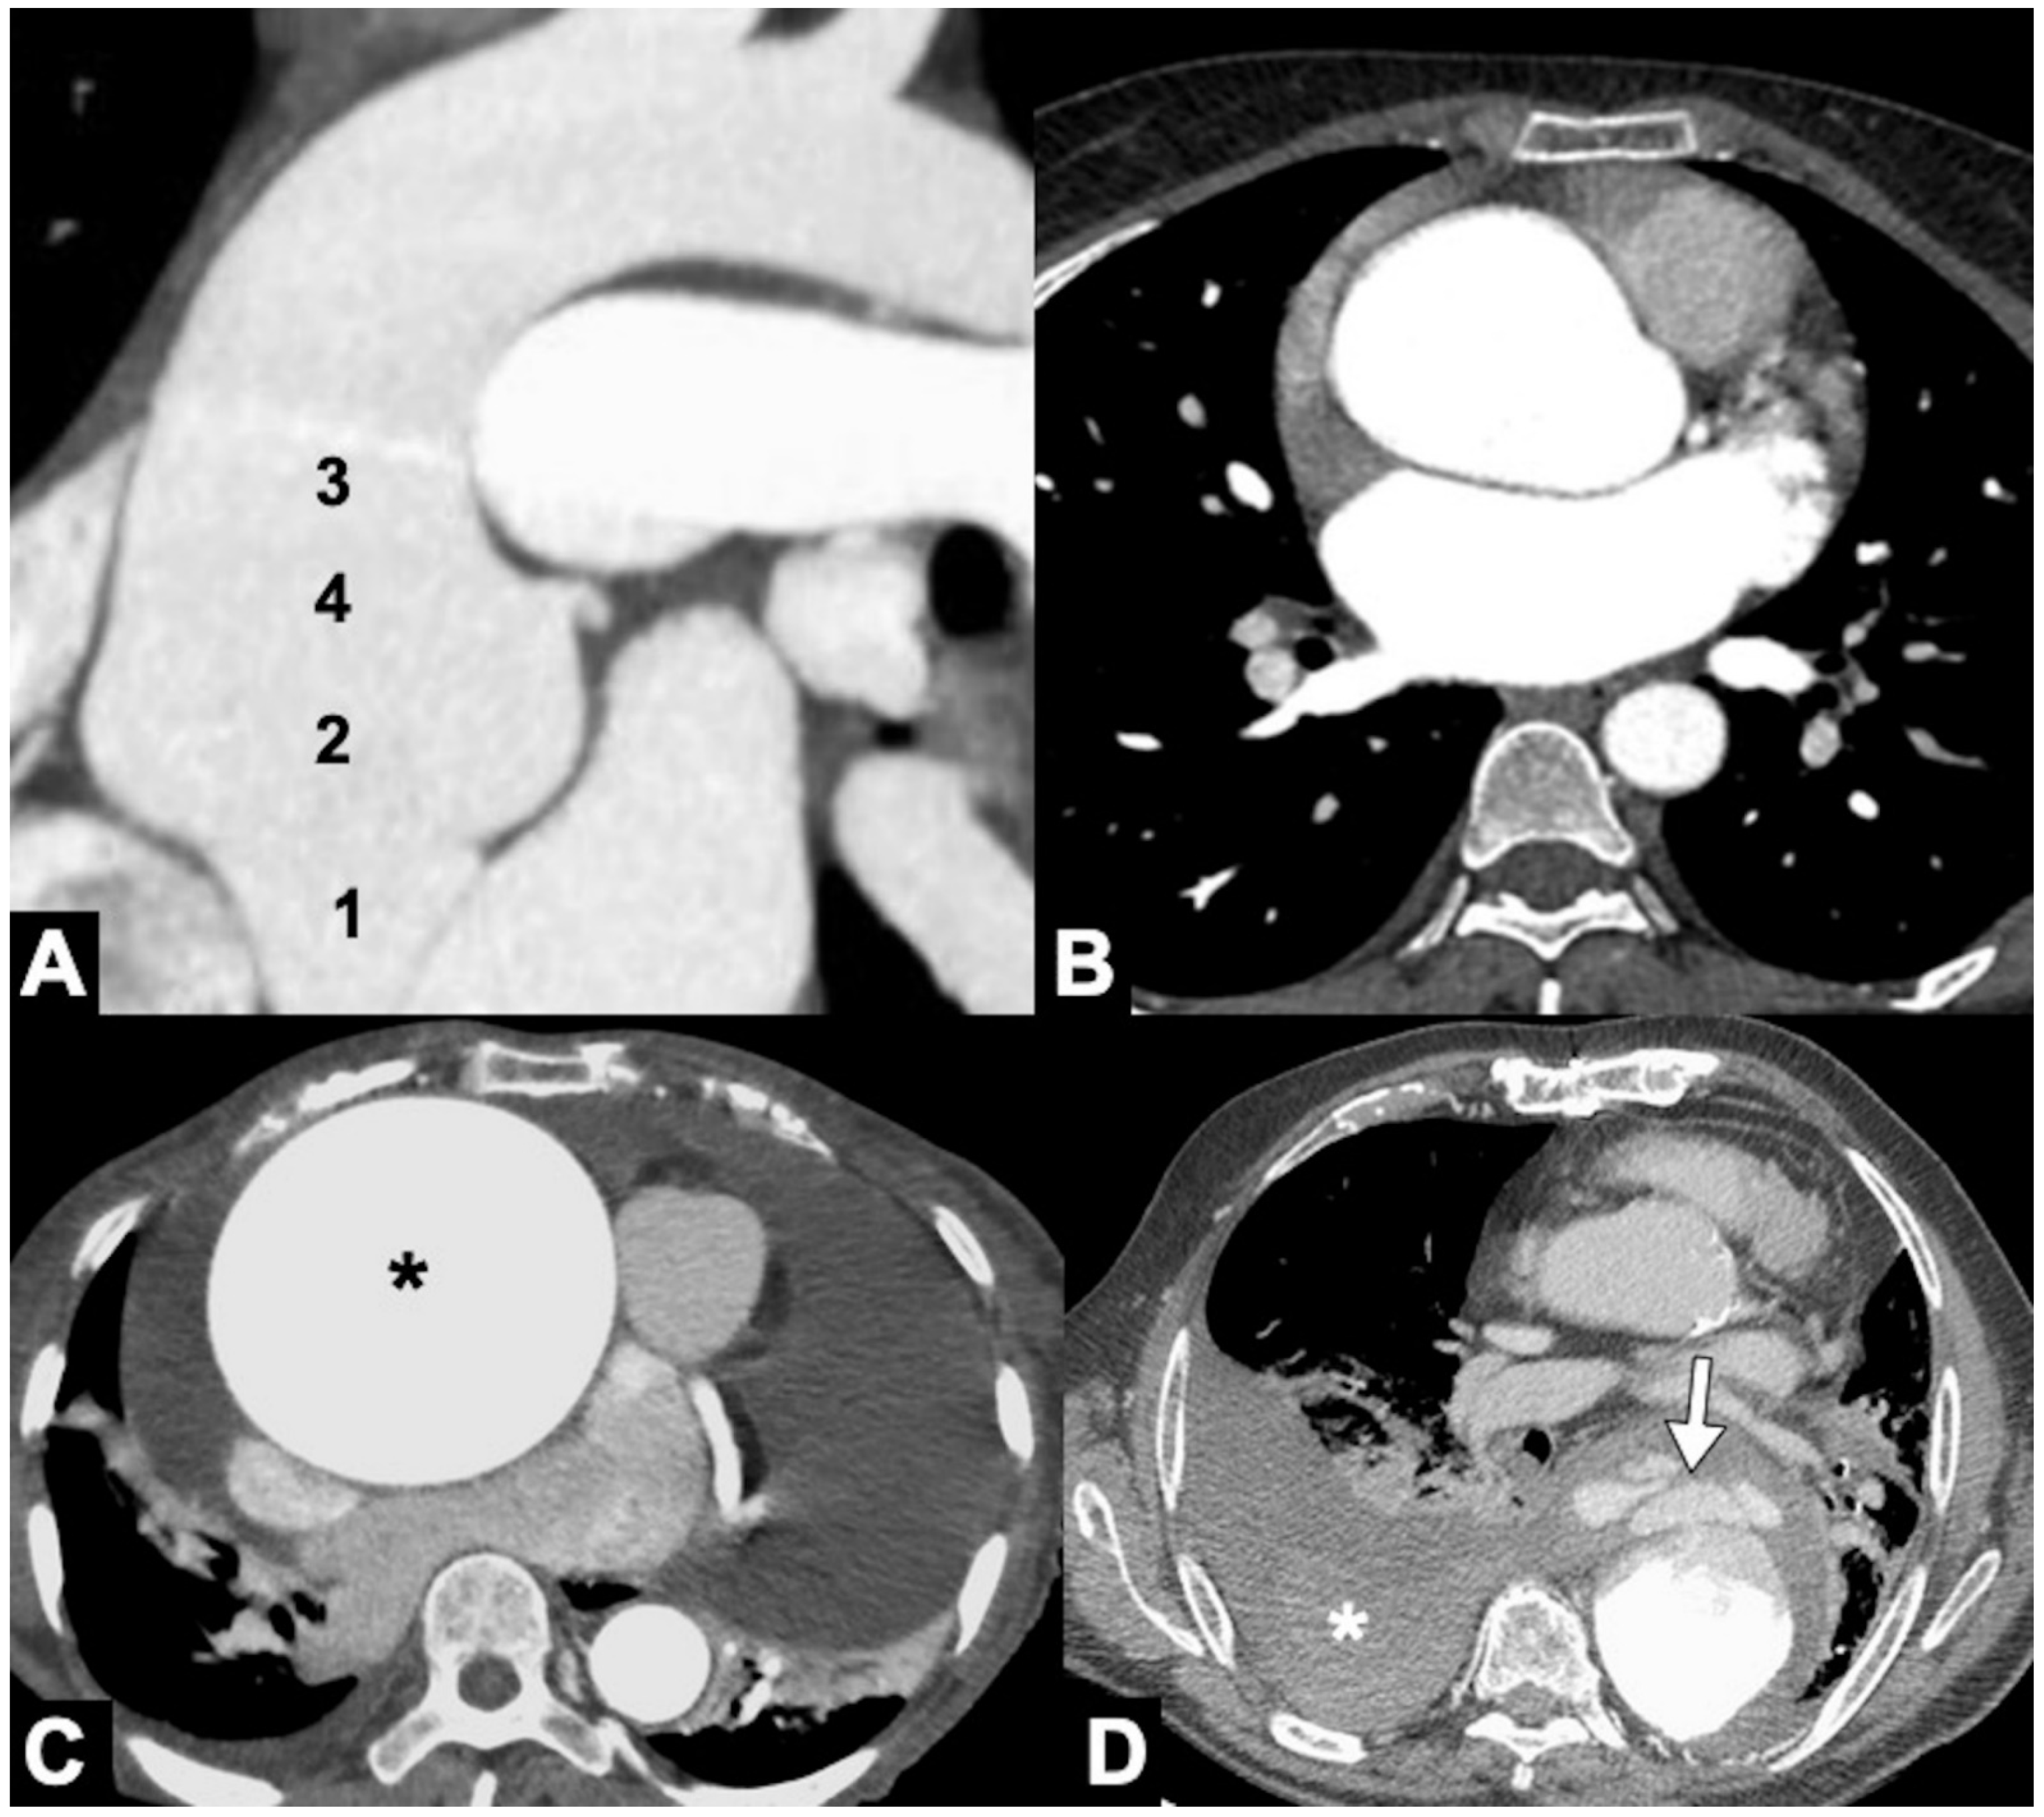
- A low-dose, non-gated, non-contrast phase, with coverage from the lung apex to the lower abdomen, which is useful to evaluate the presence of aortic intramural hematoma, displaced intimal calcification, surgical material, and high-density pericardial, pleural, or mediastinal blood (Figure 2). The radiation dose of the non-contrast phase should be kept low by using wider collimation and low tube potential with concomitant reduction in the tube current. Nowadays, dual-source technology provides a virtual non-contrast phase obviating the need to acquire a non-enhanced phase.
- (2)
- An ECG-gated arterial (or alternatively ultra-high pitch) scan-acquisition using automated 80–110 mL of 370 mg I/mL iodinated contrast material (CM) or 60–80 mL of 400 mg I/mL iodinated contrast according to the patient body weight, by pump injectors delivered at a rate between 3.5 and 5 mL/s to achieve a target opacification of the aorta of 250 HU. It may be performed with bolus tracking or utilization of a timing bolus to ensure optimal enhancement of the great vessels. Particularly by using retrospective-gating, the CT scanner is acquiring during the entire cardiac cycle; therefore, it is possible to correct dysrhythmias or cardiac motion artifacts. Since retrospective ECG-gating is associated with a significant increase in radiation dose, various dose-reduction techniques may be used, such as prospective ECG triggering, ECG-based tube current modulation, automatic exposure control, lower peak kilovoltage, and iterative/deep-learning reconstruction algorithms.
- (3)
- A non-gated delayed phase (about 70 s delay) obtained to assess for late filling of a false lumen (FL), to clearly depict abdominal organ malperfusion, contrast extravasation due to aortic rupture and to evaluate peri-adventitial enhancement indicating acute aortitis.
2. Acute Aortic Syndrome (AAS): Dissection and Variants
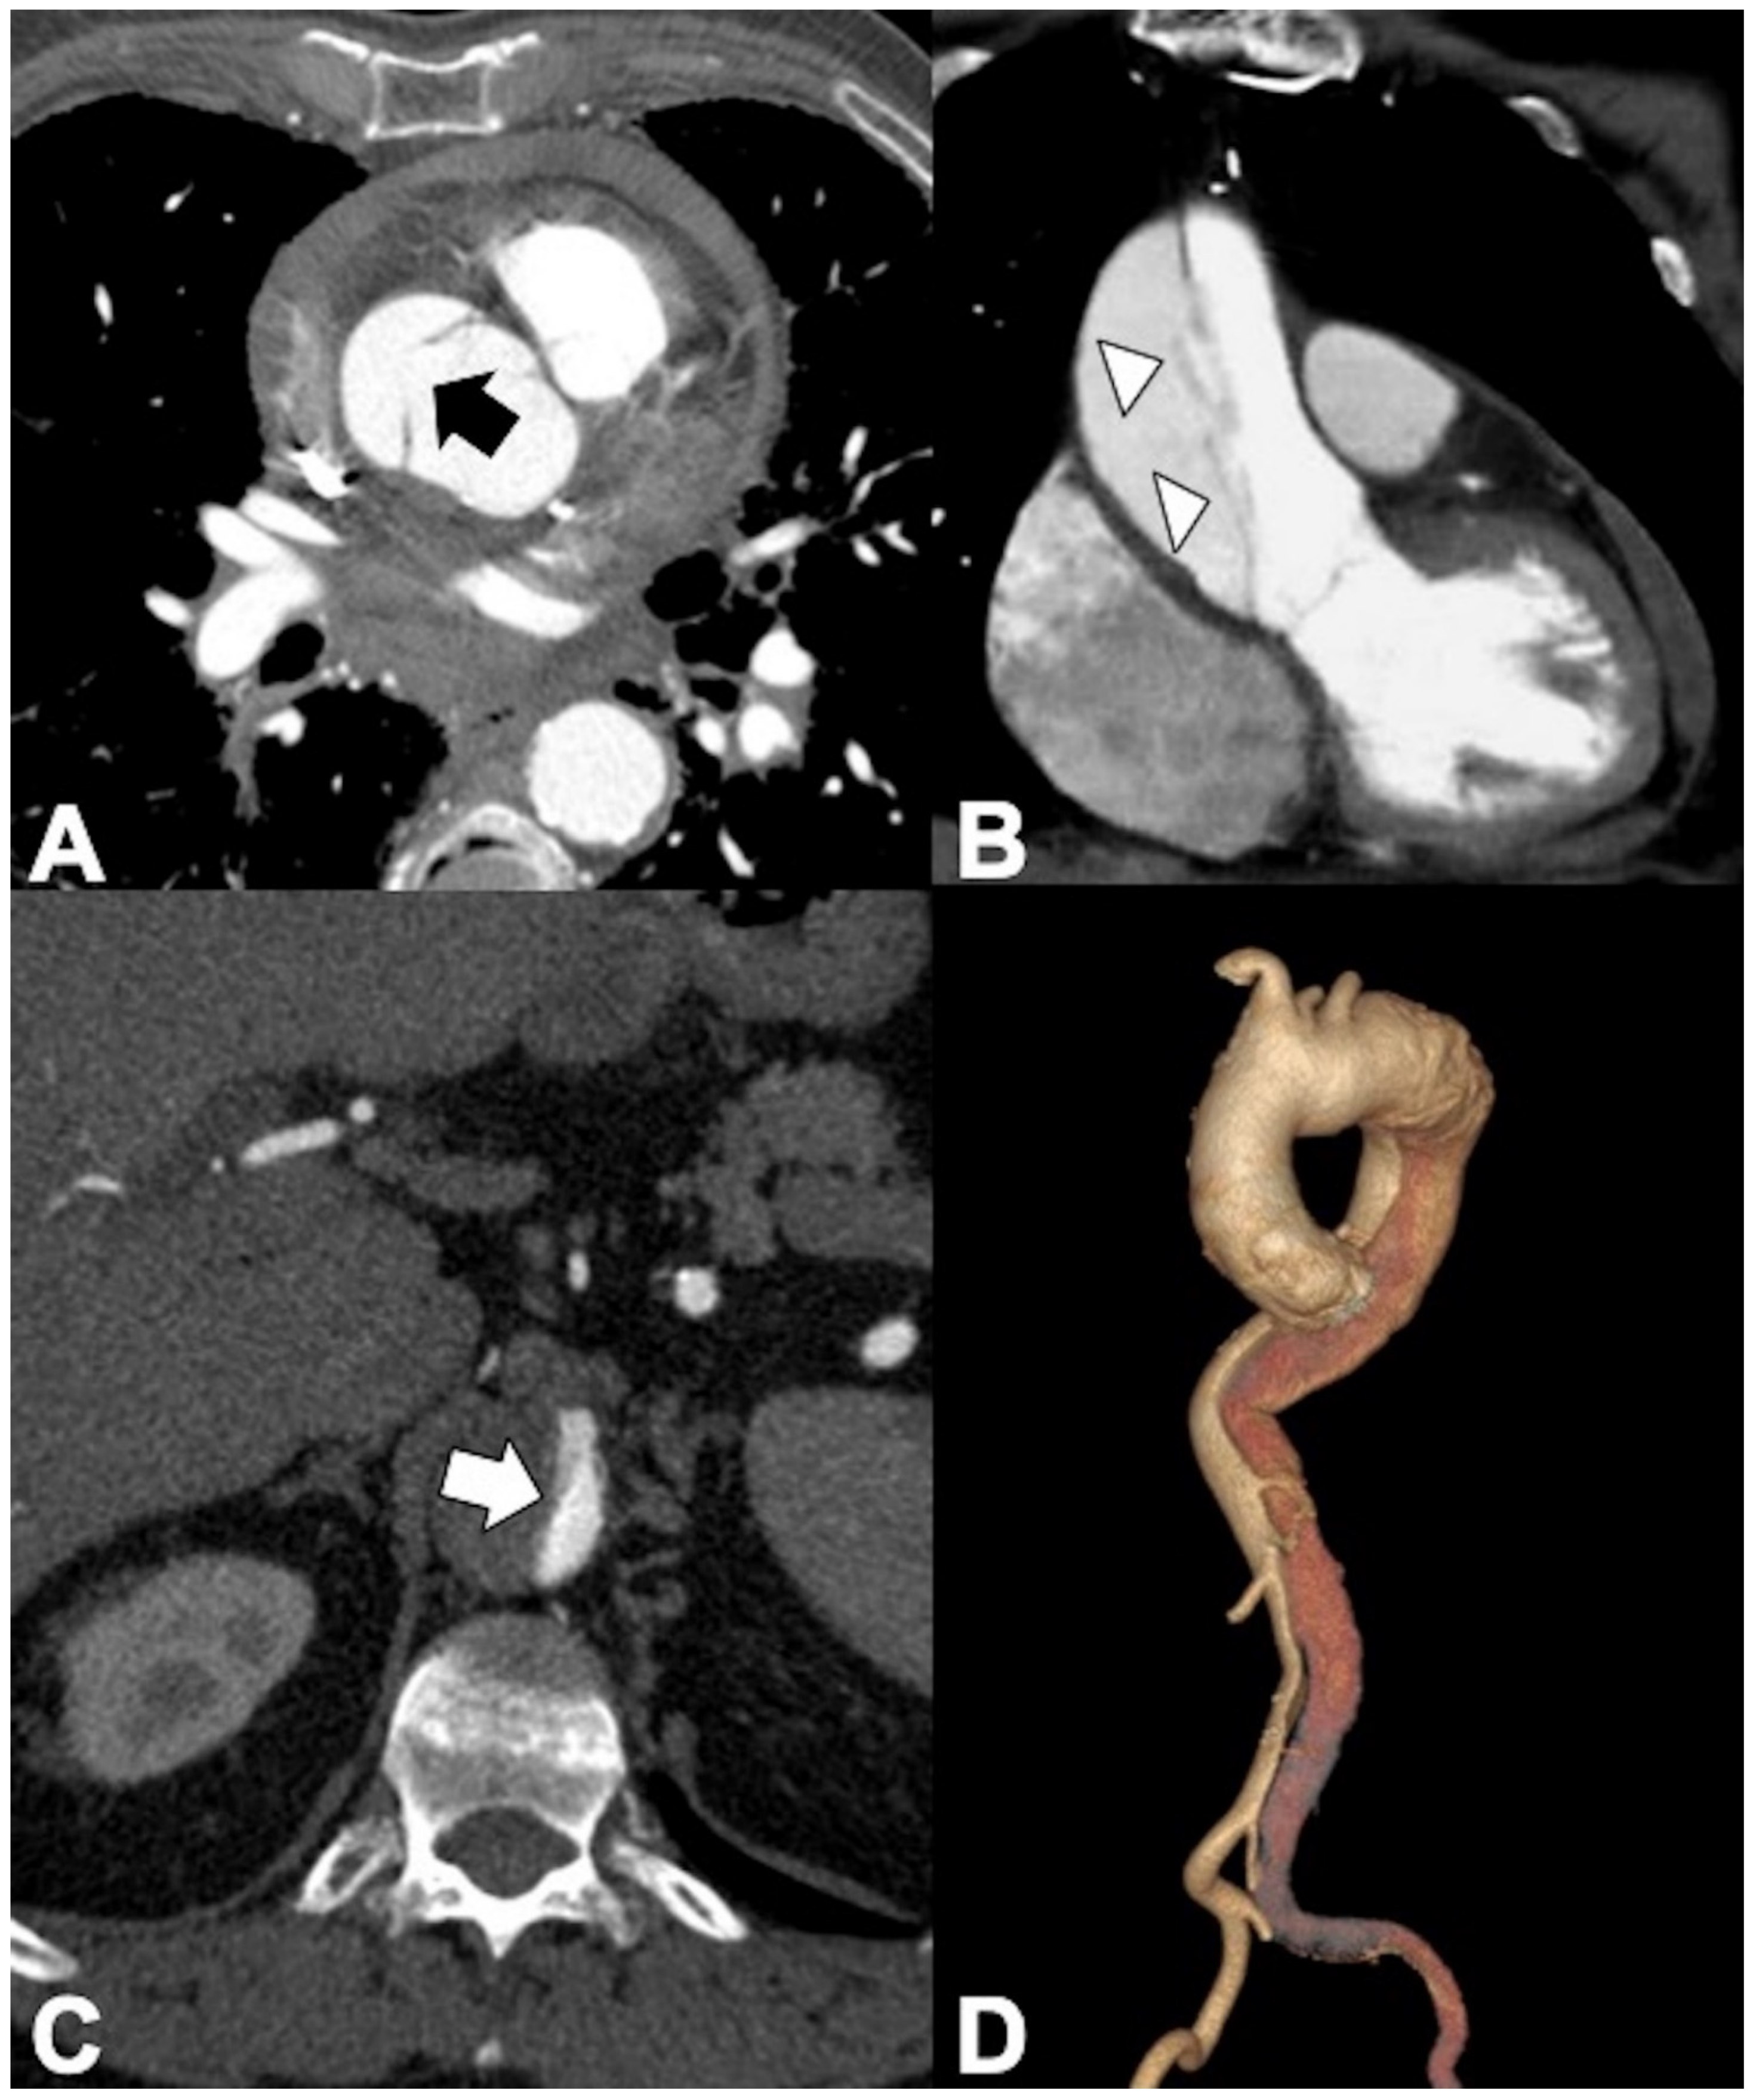
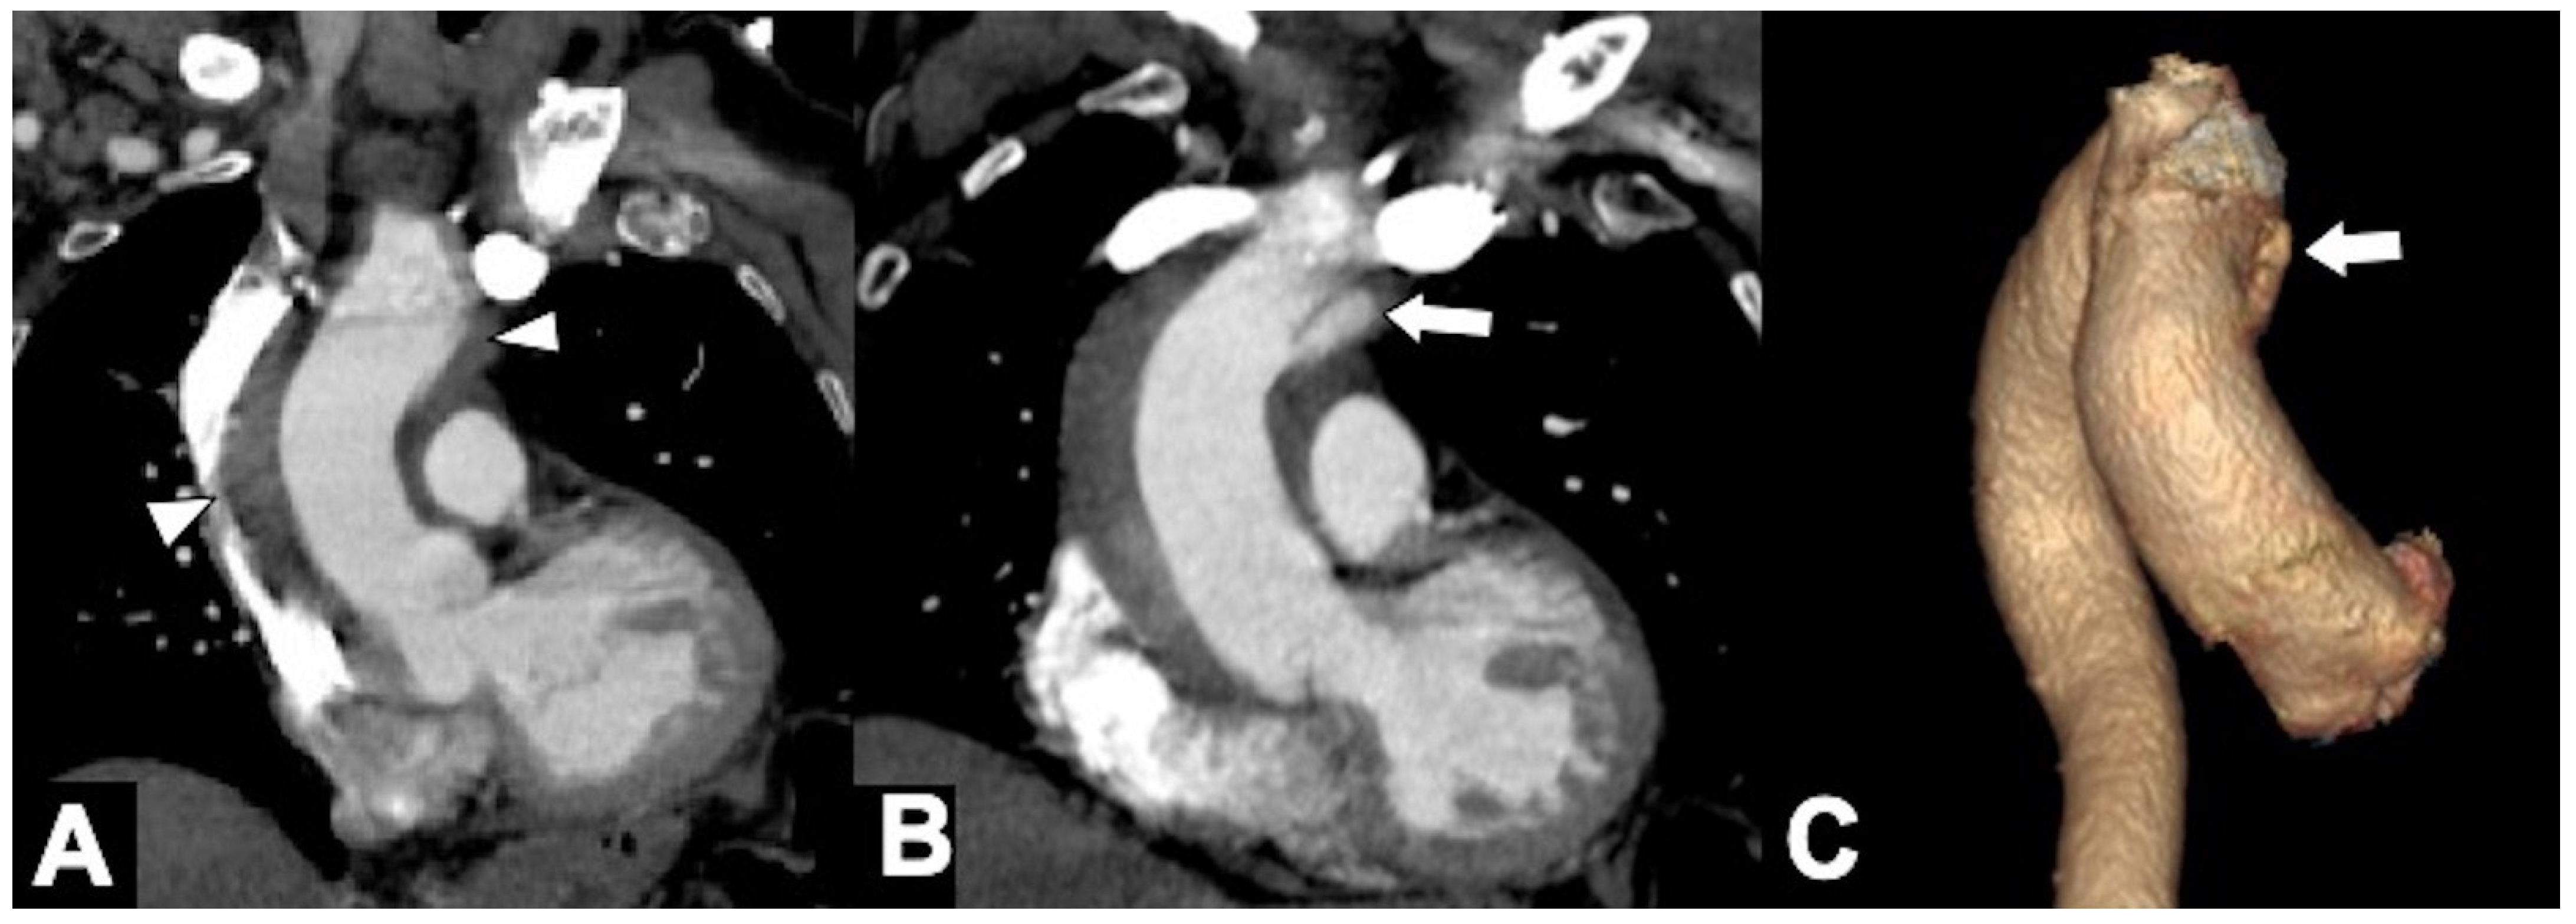
2.1. Classic Acute Aortic Dissection (AD): Pathology and Typical and Atypical Imaging Findings
2.2. AD: Classifications, Predictors of Mortality, and Management Options
2.2.1. Type A (TAAD)
2.2.2. Type B (TBAD)
2.2.3. Type Non-A/Non-B AD
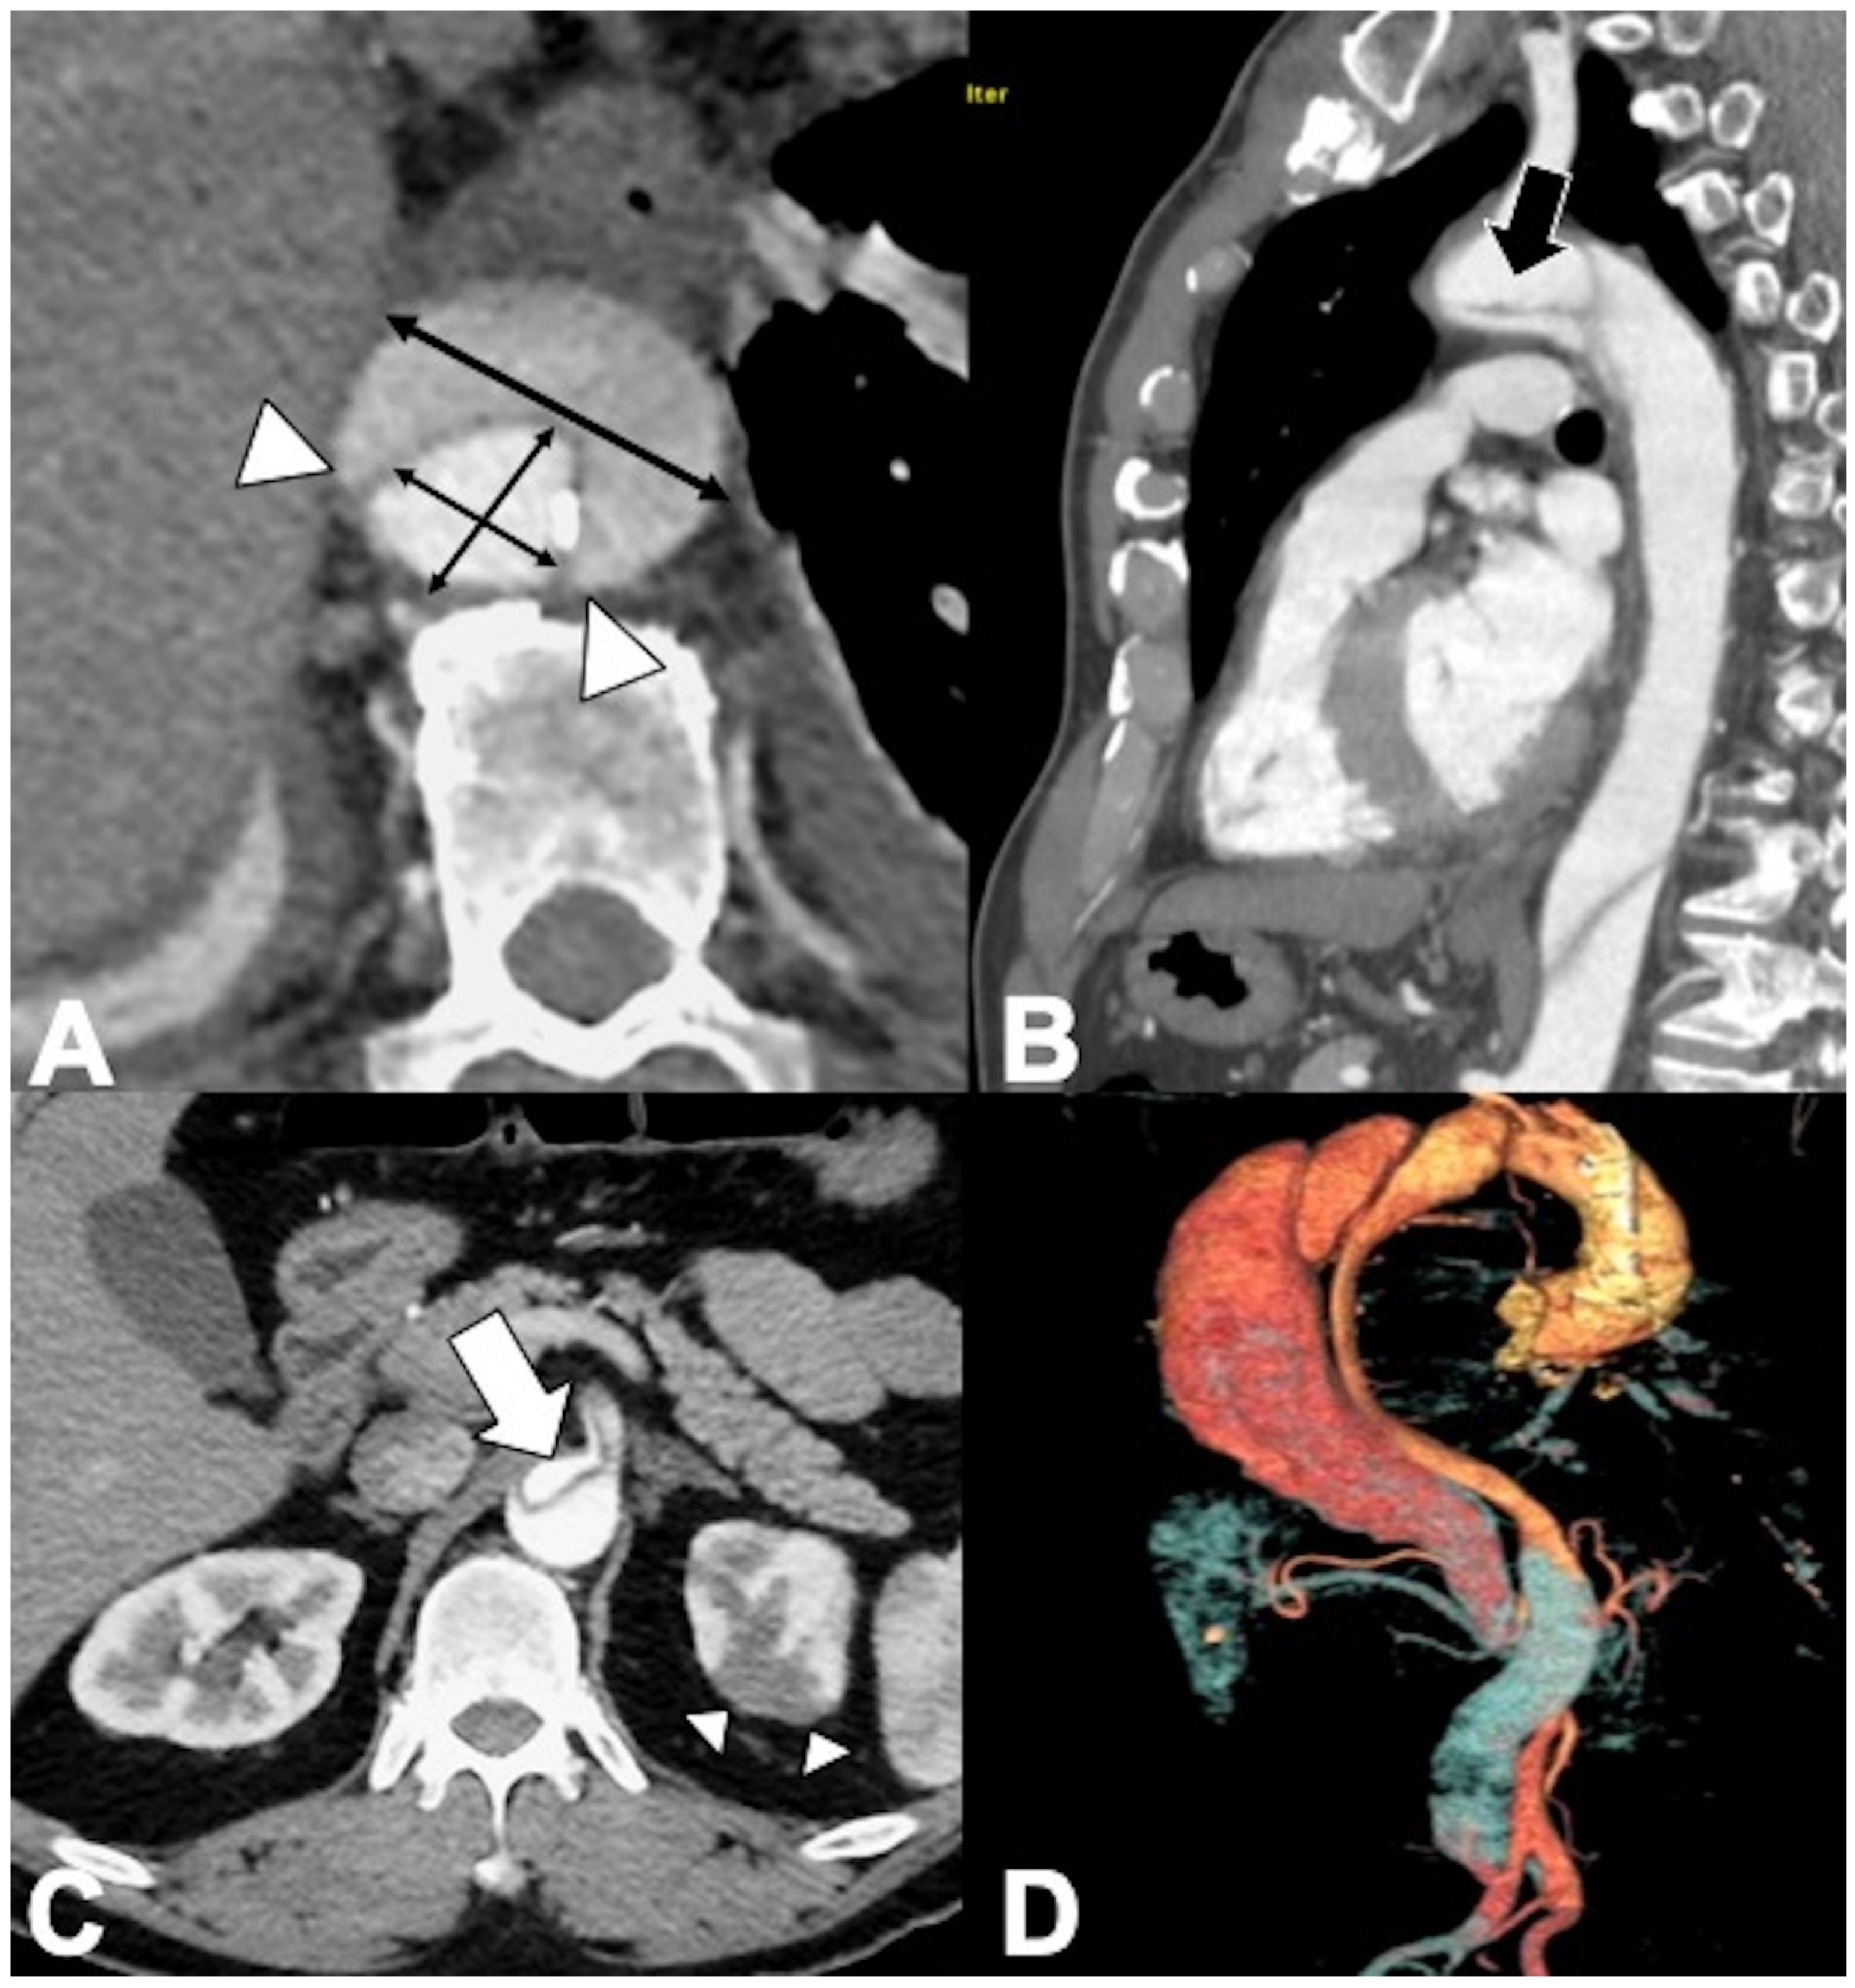
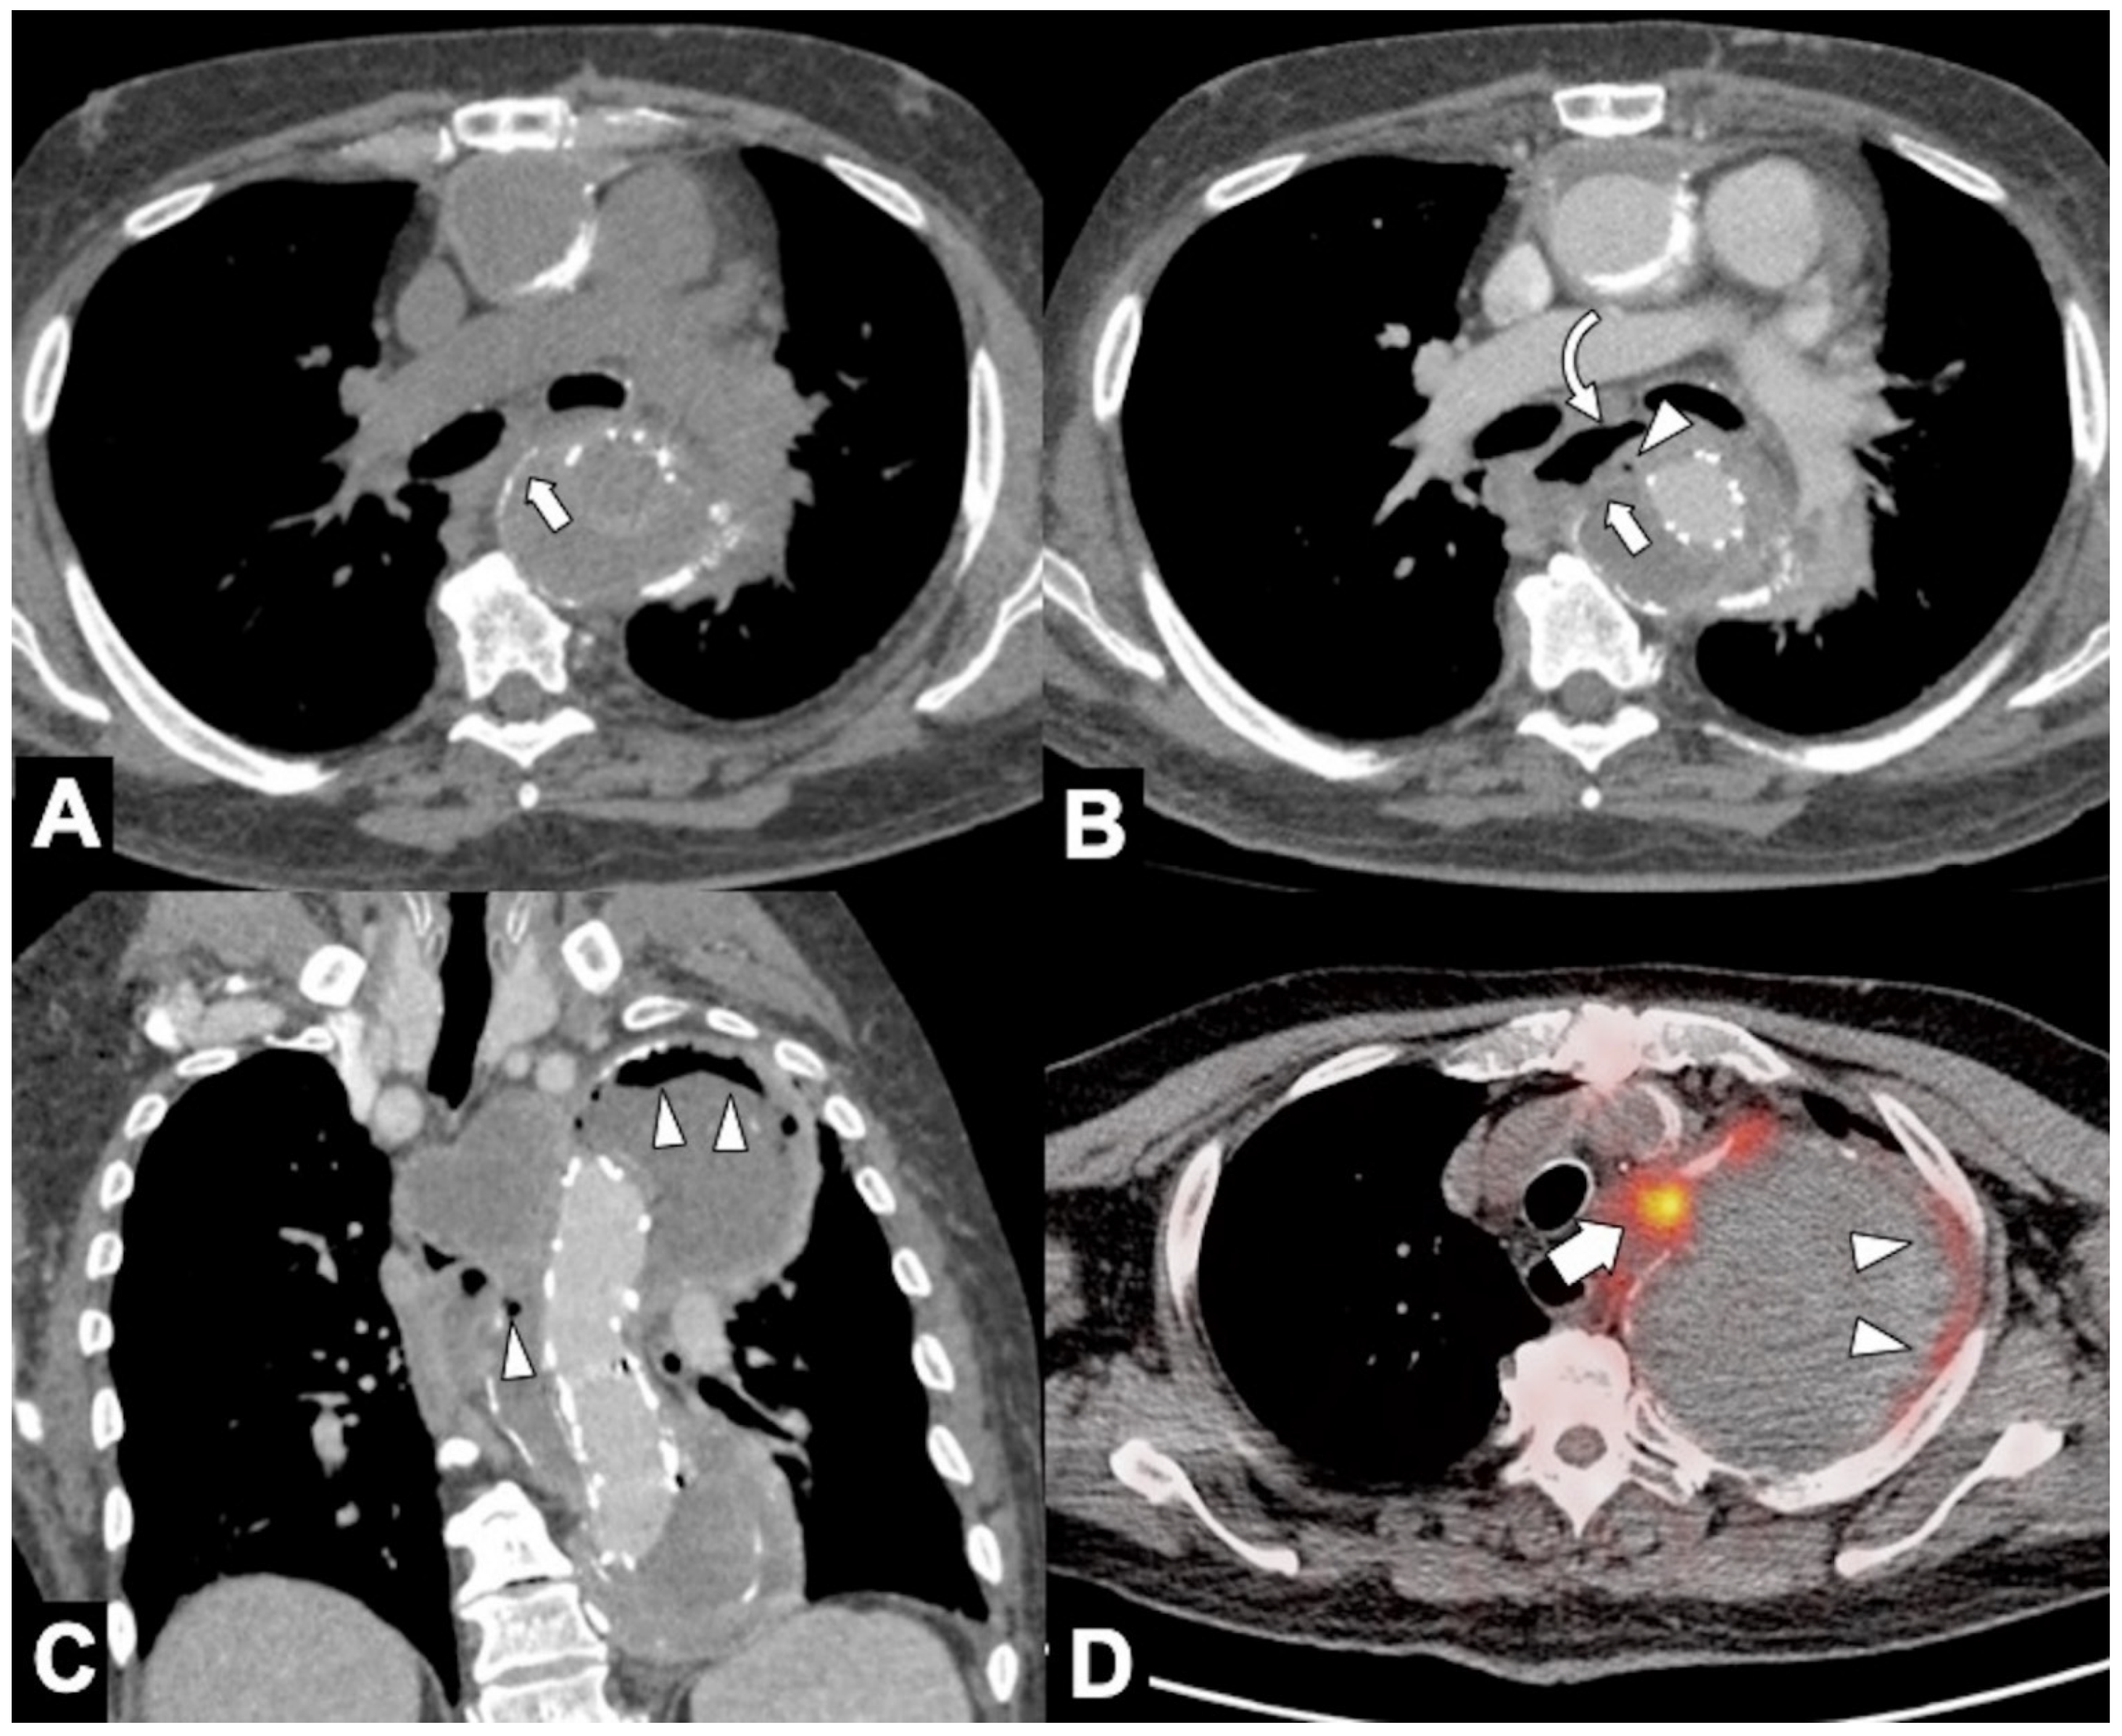
2.3. Acute Intramural Hematoma (IMH)
2.4. Penetrating Atherosclerotic Ulcer (PAU)
2.5. Limited AD (Class 3 Dissection Variant)
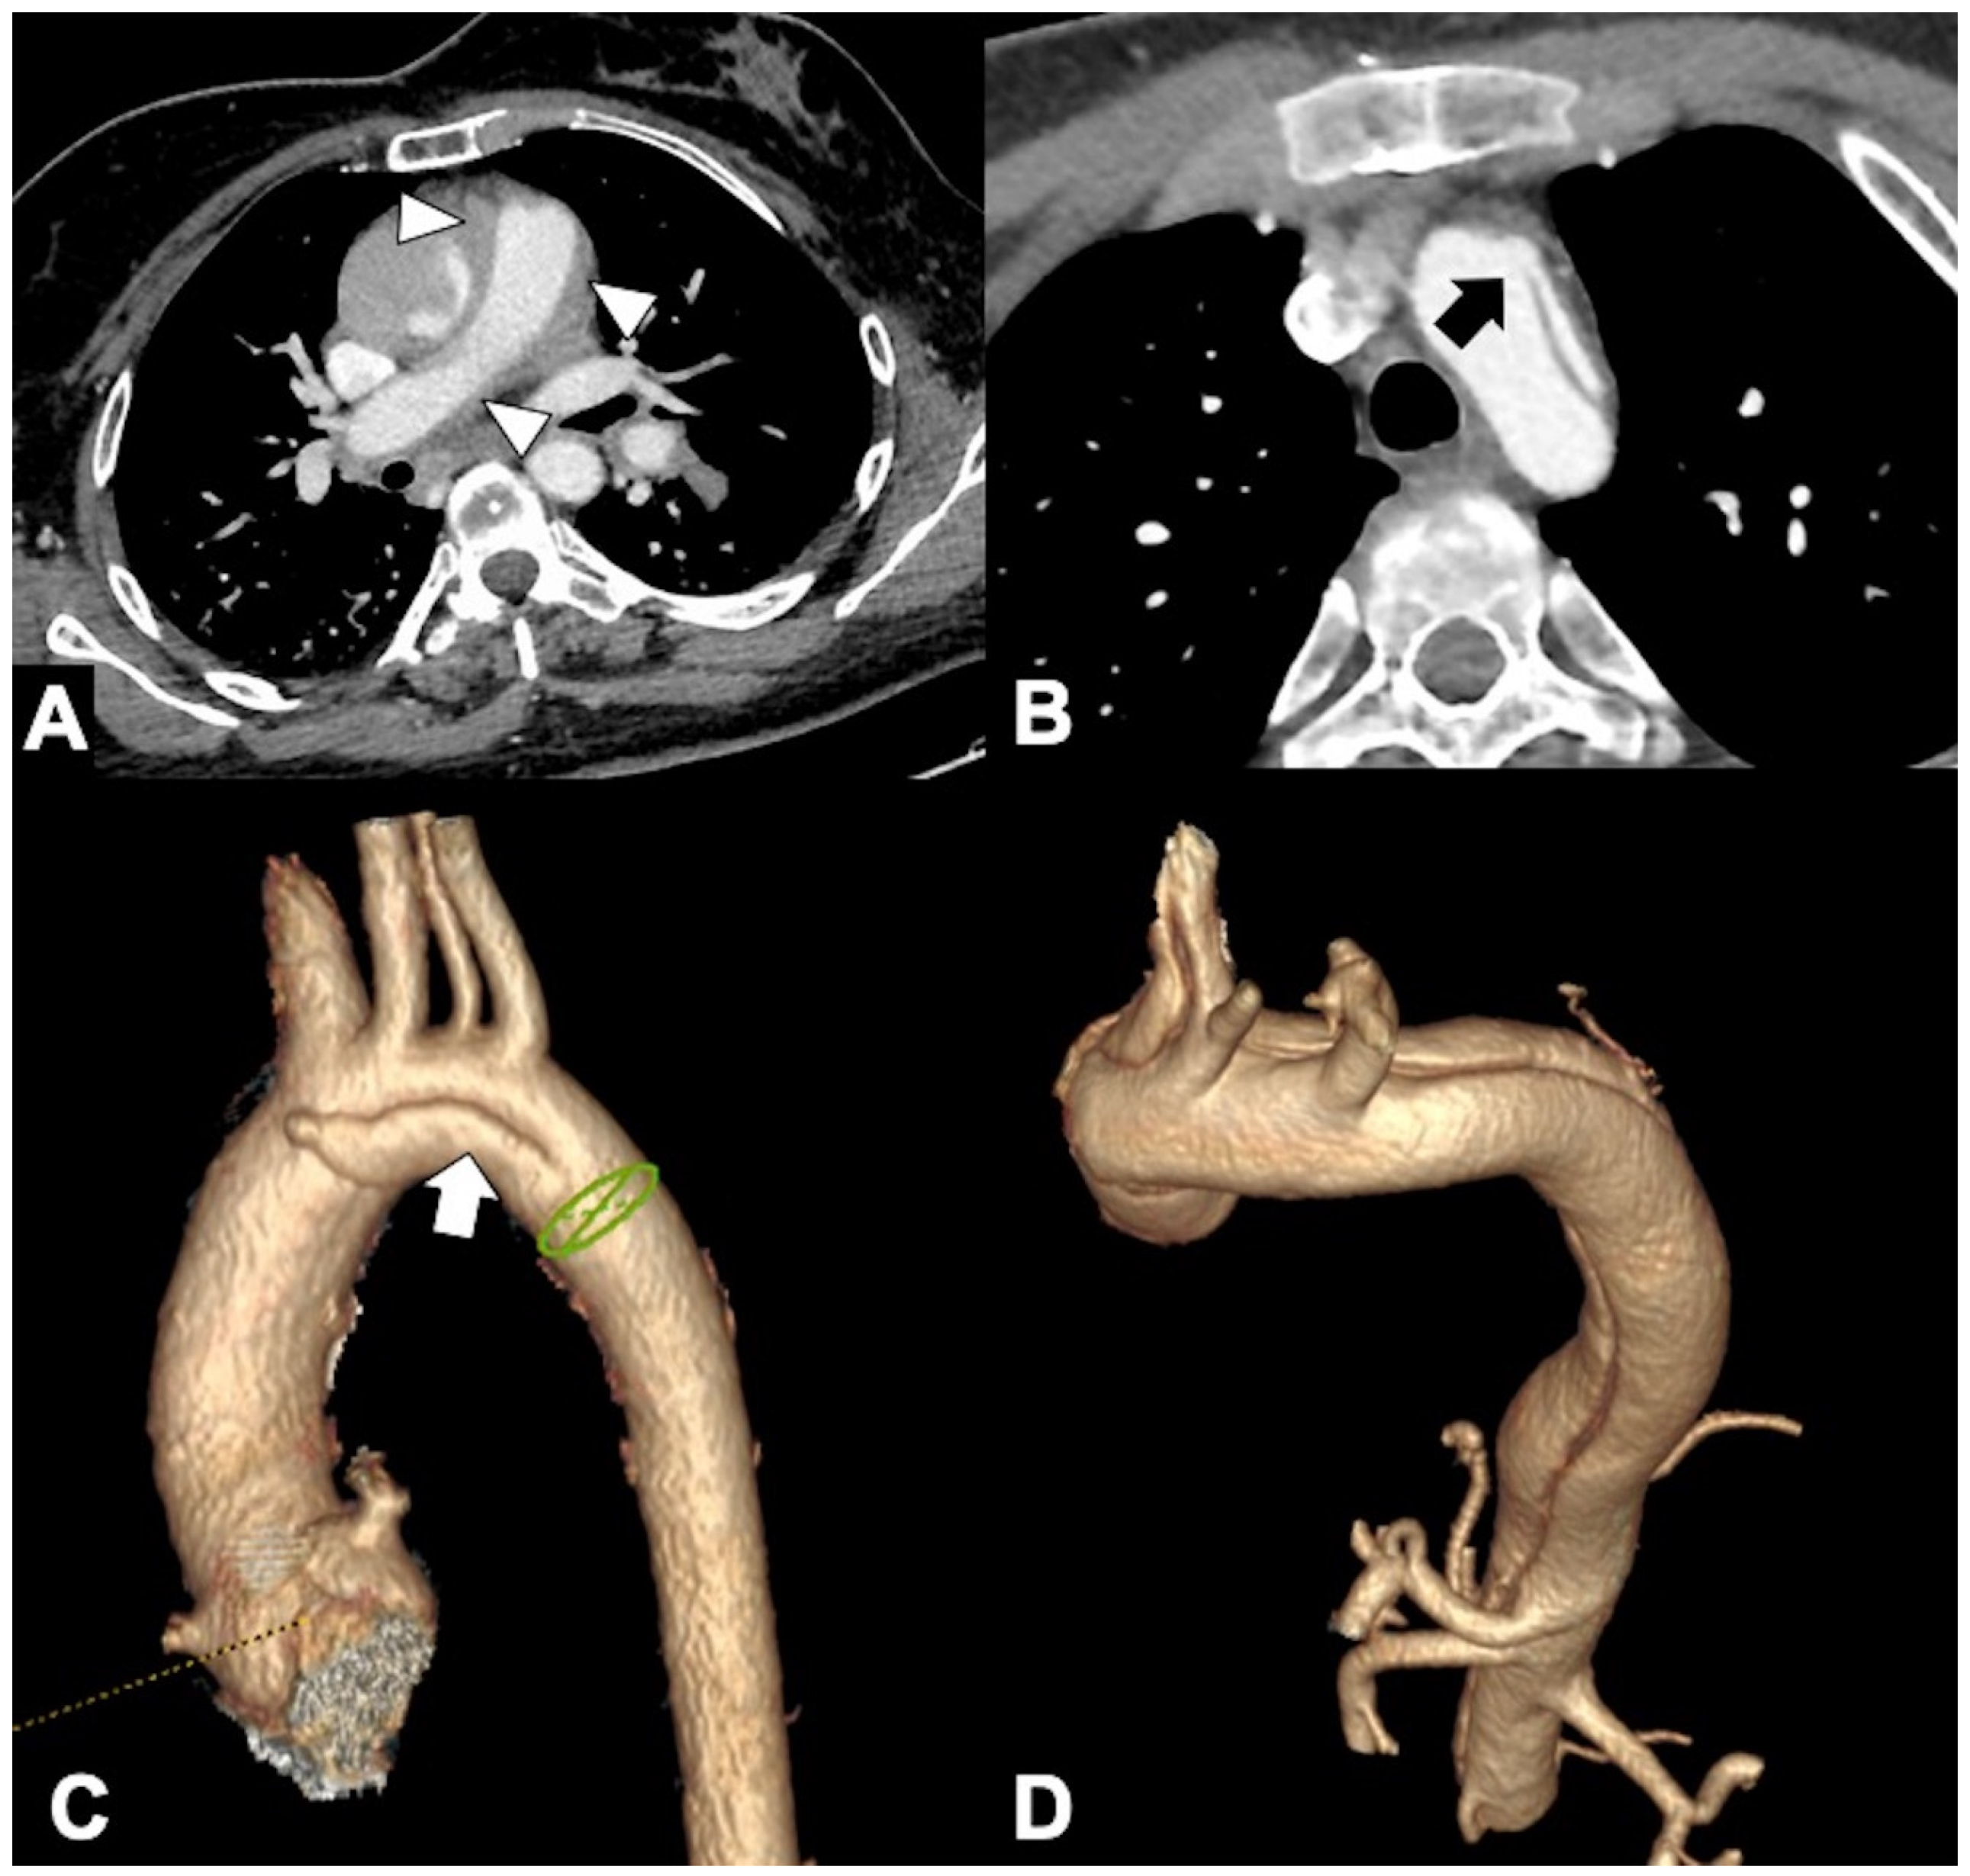
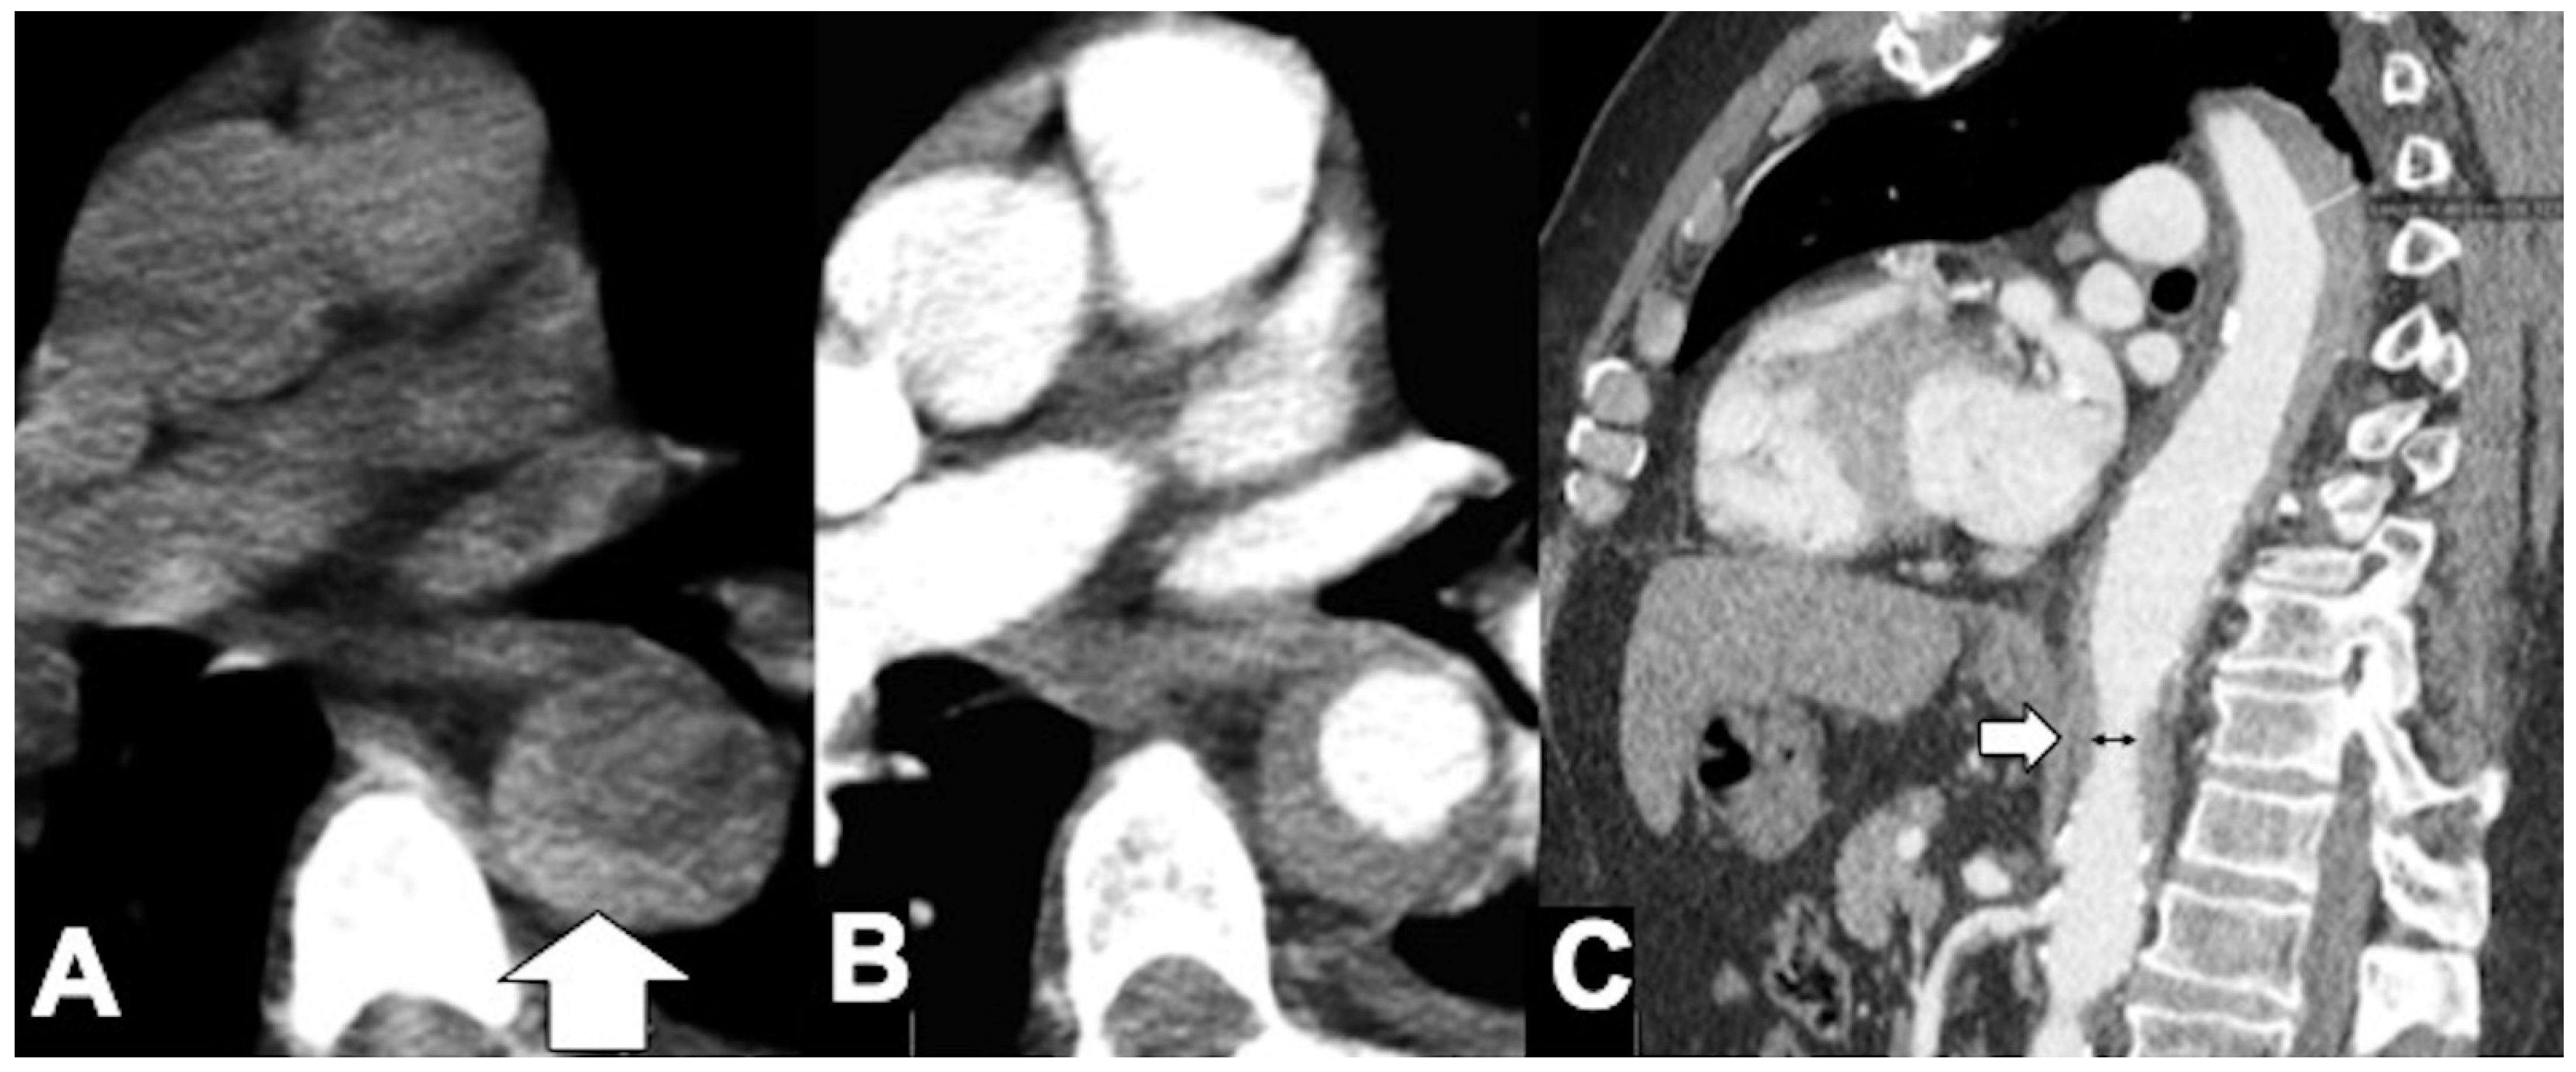
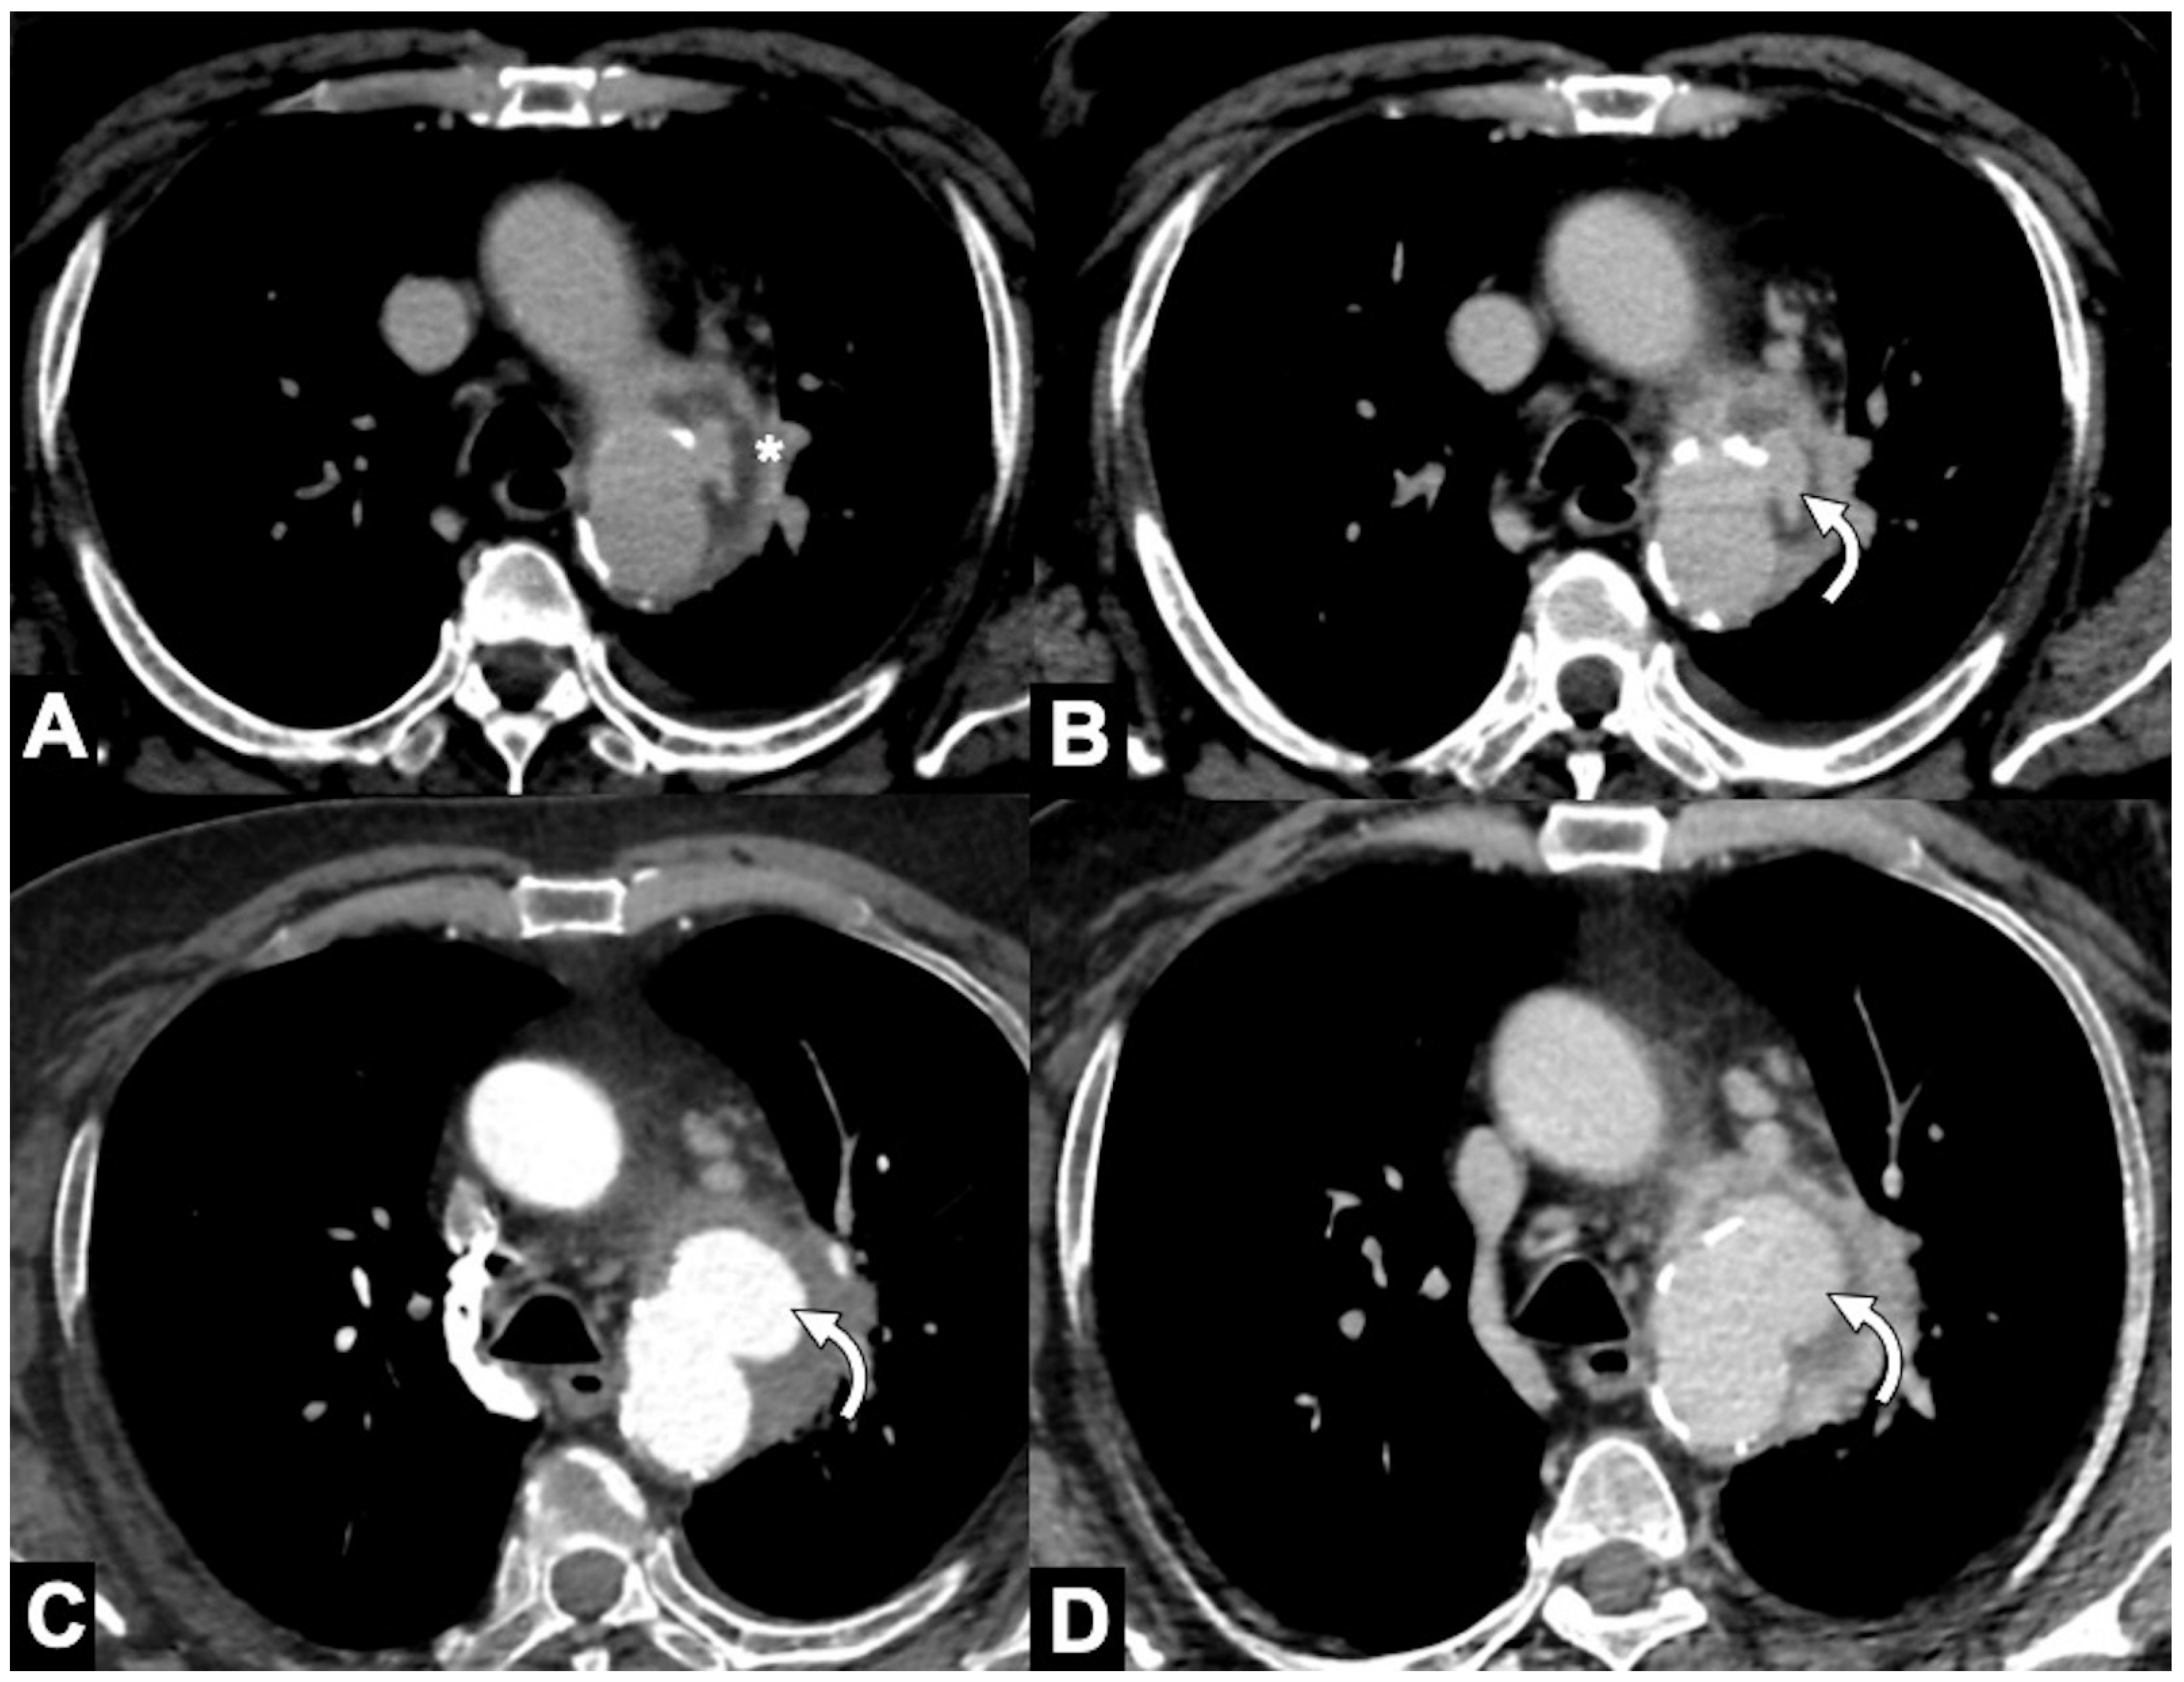
3. Unstable and Impending Rupture of Thoracic Aorta Aneurysm (TAA)
4. Thoracic Aorta Fistulas
5. Pseudoaneurysms (PSA), Infectious (Mycotic), and Noninfectious Aneurysms
5.1. Infectious Aortitis
5.2. Non-Infectious Aortitis
6. Aortic Acute Occlusive Disease (And Shaggy Aorta)
7. Conclusions
Author Contributions
Funding
Institutional Review Board Statement
Informed Consent Statement
Data Availability Statement
Conflicts of Interest
Abbreviations
References
- Jen, J.P.; Malik, A.; Lewis, G.; Holloway, B. Non-traumatic thoracic aortic emergencies: Imaging diagnosis and management. Br. J. Hosp. Med. 2020, 81, 1–12. [Google Scholar] [CrossRef]
- Voitle, E.; Hofmann, W.; Cejna, M. Aortic emergencies-diagnosis and treatment: A pictorial review. Insights Imaging 2015, 6, 17–32. [Google Scholar] [CrossRef]
- Lai, V.; Tsang, W.K.; Chan, W.C.; Yeung, T.W. Diagnostic accuracy of mediastinal width measurement on posteroanterior and anteroposterior chest radiographs in the depiction of acute nontraumatic thoracic aortic dissection. Emerg. Radiol. 2012, 19, 309–315. [Google Scholar] [CrossRef]
- von Kodolitsch, Y.; Nienaber, C.A.; Dieckmann, C.; Schwartz, A.G.; Hofmann, T.; Brekenfeld, C. Chest radiography for the diagnosis of acute aortic syndrome. Am. J. Med. 2004, 116, 73–77. [Google Scholar] [CrossRef]
- Chawla, A.; Rajendran, S.; Yung, W.H.; Babu, S.B.; Peh, W.C. Chest radiography in acute aortic syndrome: Pearls and pitfalls. Emerg. Radiol. 2016, 23, 405–412. [Google Scholar] [CrossRef]
- Hagan, P.G.; Nienaber, C.A.; Isselbacher, E.M.; Bruckman, D.; Karavite, D.J.; Russman, P.L.; Evangelista, A.; Fattori, R.; Suzuki, T.; Oh, J.K.; et al. The International Registry of Acute Aortic Dissection (IRAD): New insights into an old disease. JAMA 2000, 283, 897–903. [Google Scholar] [CrossRef]
- Fleischmann, D.; Mitchell, R.S.; Miller, D.C. Acute Aortic Syndromes: New Insights from Electrocardiographically Gated Computed Tomography. Semin. Thorac. Cardiovasc. Surg. 2009, 20, 340–347. [Google Scholar] [CrossRef]
- Sathiadoss, P.; Haroon, M.; Wongwaisayawan, S.; Krishna, S.; Sheikh, A.M. Multidetector Computed Tomography in Traumatic and Nontraumatic Aortic Emergencies: Emphasis on Acute Aortic Syndromes. Can. Assoc. Radiol. J. 2020, 71, 322–334. [Google Scholar] [CrossRef] [PubMed]
- Morello, F.; Santoro, M.; Fargion, A.T.; Grifoni, S.; Nazerian, P. Diagnosis and management of acute aortic syndromes in the emergency department. Intern. Emerg. Med. 2020, 16, 171–181. [Google Scholar] [CrossRef] [PubMed]
- Zamorano, J.L.; De Isla, L.P.; González, R.; Almería, C.; Rodrigo, J.L. Imaging diagnosis in acute aortic syndromes. Rev. Esp. Cardiol. 2003, 56, 498–508. [Google Scholar] [CrossRef] [PubMed]
- Murillo, H.; Lane, M.J.; Punn, R.; Fleischmann, D.; Restrepo, C.S. Imaging of the Aorta: Embryology and Anatomy. Semin. Ultrasound CT MRI 2012, 33, 169–190. [Google Scholar] [CrossRef] [PubMed]
- Mei, C.C.; Zhang, J.; Jing, H.X. Fluid mechanics of Windkessel effect. Med. Biol. Eng. Comput. 2018, 56, 1357–1366. [Google Scholar] [CrossRef]
- Elefteriades, J.A. Thoracic Aortic Aneurysm: Reading the Enemy’s Playbook. Yale J. Boil. Med. 2008, 81, 175–186. [Google Scholar] [CrossRef] [PubMed]
- Ishimaru, S. Endografting of the aortic arch. J. Endovasc. Ther. 2004, 11, II62–II71. [Google Scholar] [CrossRef]
- Criado, F.J. Mapping the Aorta: A New Look at Vascular Anatomy in the Era of Endograft Repair. J. Endovasc. Ther. 2010, 17, 68–72. [Google Scholar] [CrossRef] [PubMed]
- Hutchinson, S.J. Aortic Physiology and Function: Anatomic and Histologic Considerations. In Aortic Diseases Clinical Diagnostic Imaging Atlas, 1st ed.; Saunders Elsevier: Philadelphia, PA, USA, 2009; pp. 1–15. [Google Scholar]
- Ko, J.P.; Goldstein, J.M.; Latson, L.A., Jr.; Azour, L.; Gozansky, E.K.; Moore, W.; Patel, S.; Hutchinson, B.; Chest, C.T. Angiography for Acute Aortic Pathologic Conditions: Pearls and Pitfalls. RadioGraphics 2021, 41, 399–424. [Google Scholar] [CrossRef]
- Kalisz, K.; Halliburton, S.; Abbara, S.; Leipsic, J.A.; Albrecht, M.H.; Schoepf, U.J.; Rajiah, P. Update on Cardiovascular Applica-tions of Multienergy CT. RadioGraphics 2017, 37, 1955–1974. [Google Scholar] [CrossRef]
- Smettei, O.A.; Sayed, S.; Al Habib, A.M.; Alharbi, F.; Abazid, R.M. Ultra-fast, low dose high-pitch (FLASH) versus prospectively-gated coronary computed tomography angiography: Comparison of image quality and patient radiation exposure. J. Saudi Heart Assoc. 2018, 30, 165–171. [Google Scholar] [CrossRef]
- Rajiah, P. Updates in Vascular Computed Tomography. Radiol. Clin. N. Am. 2020, 58, 671–691. [Google Scholar] [CrossRef]
- Baliyan, V.; Shaqdan, K.; Hedgire, S.; Ghoshhajra, B. Vascular computed tomography angiography technique and indications. Cardiovasc. Diagn. Ther. 2019, 9, S14–S27. [Google Scholar] [CrossRef]
- Valente, T.; Rossi, G.; Lassandro, F.; Rea, G.; Marino, M.; Muto, M.; Molino, A.; Scaglione, M. MDCT evaluation of acute aortic syndrome (AAS). Br. J. Radiol. 2016, 89, 20150825. [Google Scholar] [CrossRef]
- Vilacosta, I.; Roman, J.A. Acute aortic syndrome. Heart 2001, 85, 365–368. [Google Scholar] [CrossRef]
- Erbel, R.; Aboyans, V.; Boileau, C.; Bossone, E.; Bartolomeo, R.D.; Eggebrecht, H.; Evangelista, A.; Falk, V.; Frank, H.; Gaemperli, O.; et al. 2014 ESC Guidelines on the diagnosis and treatment of aortic diseases: Document covering acute and chronic aortic diseases of the thoracic and abdominal aorta of the adult. The task force for the diagnosis and treatment of Aortic diseases of the European Society of Cardiology (ESC). Eur. Heart J. 2014, 35, 2873–2926. [Google Scholar]
- Hiratzka, L.F.; Bakris, G.L.; Beckman, J.A.; Bersin, R.M.; Carr, V.F.; Casey, D.E., Jr.; Eagle, K.A.; Hermann, L.K.; Isselbacher, E.M.; Kazerooni, E.A.; et al. ACCF/AHA/AATS/ACR/ASA/SCA/SCAI/SIR/STS/SVM guidelines for the diagnosis and management of patients with Thoracic Aortic Disease: A report of the American College of Cardiology Foundation/American Heart Association Task Force on Practice Guidelines, American Association for Thoracic Surgery, American College of Radiology, American Stroke Association, Society of Cardiovascular Anesthesiologists, Society for Cardiovascular Angiography and Interventions, Society of Interventional Radiology, Society of Thoracic Surgeons, and Society for Vascular Medicine. Circulation 2010, 121, e266–e369. [Google Scholar] [PubMed]
- Svensson, L.G.; Labib, S.B.; Eisenhauer, A.C.; Butterly, J.R. Intimal tear without hematoma: An important variant of aortic dissection that can elude current imaging techniques. Circulation 1999, 99, 1331–1336. [Google Scholar] [CrossRef] [PubMed]
- Grist, T.M.; Rubin, G.D. Imaging of Acute Aortic Syndromes. In Diseases of the Chest, Breast, Heart and Vessels 2019–2022; Hodler, J., Kubik-Huch, R.A., von Schulthess, G.K., Eds.; Springer: Cham, Switzerland; pp. 207–214.
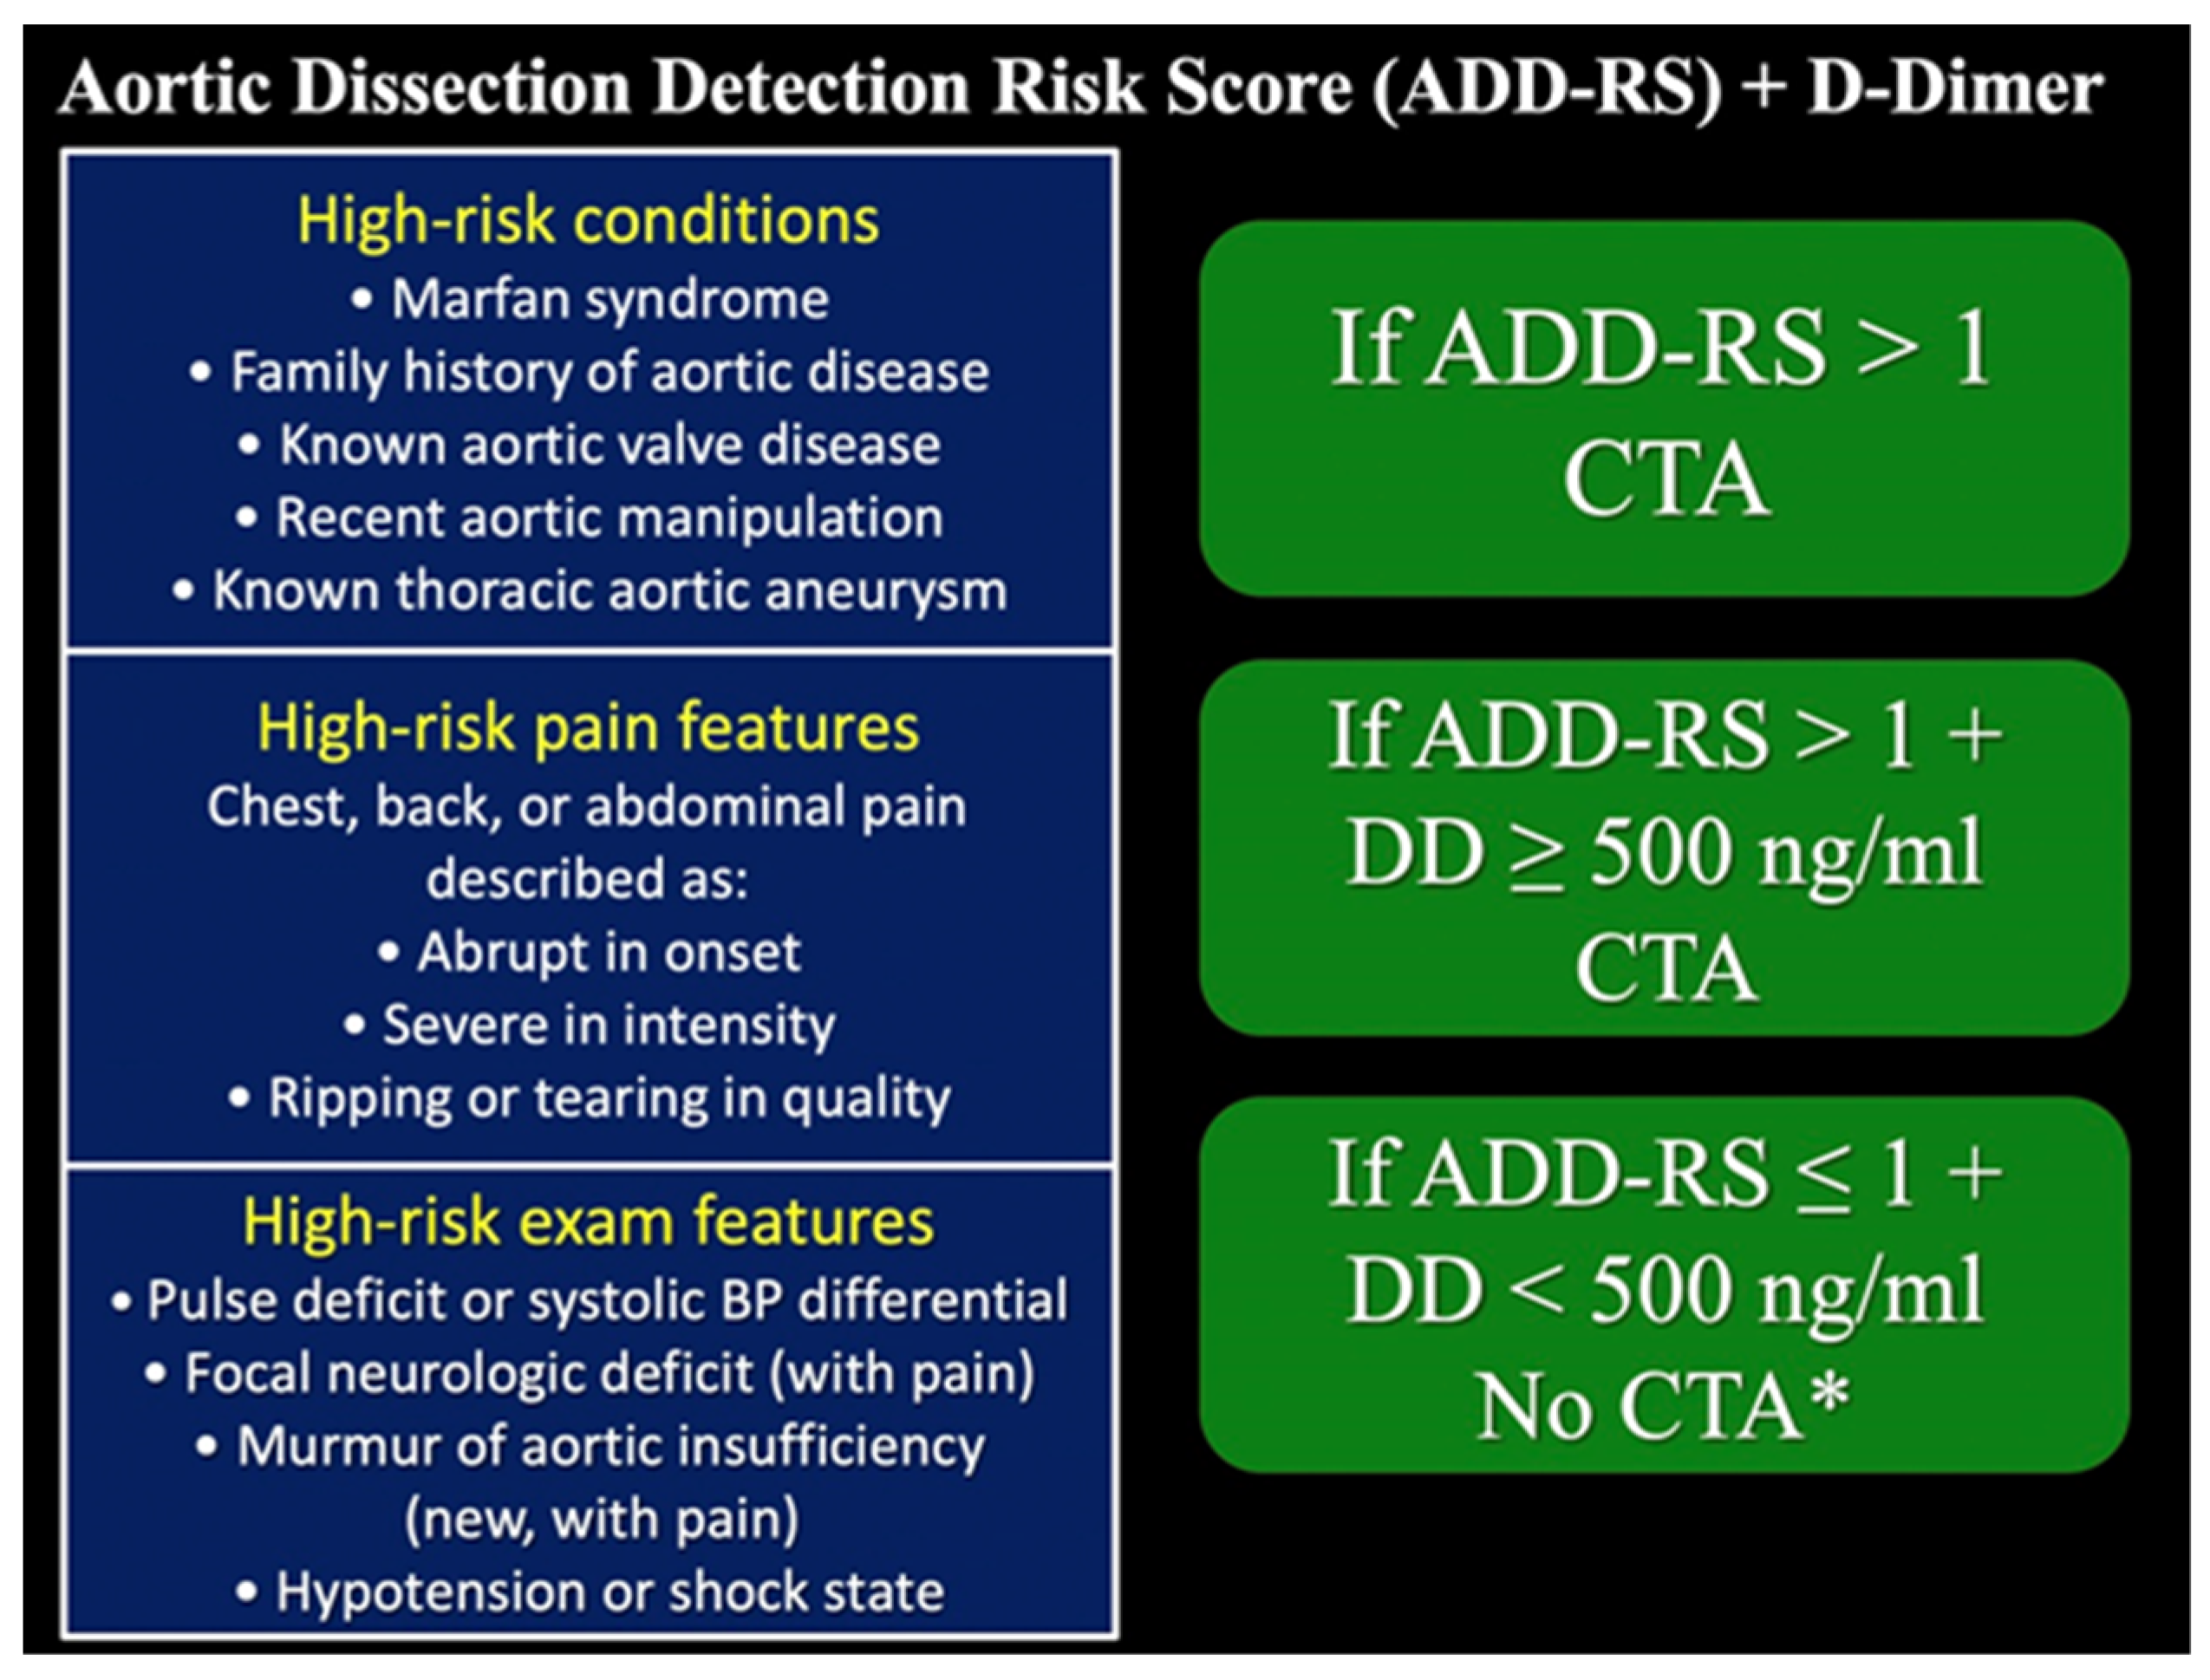
- Nazerian, P.; Mueller, C.; de Matos Soeiro, A.; Leidel, B.A.; Salvadeo, S.A.T.; Giachino, F.; Vanni, S.; Grimm, K.; Oliveira, M.T., Jr.; Pivetta, E.; et al. Diagnostic Accuracy of the Aortic Dissection Detection Risk Score Plus D-Dimer for Acute Aortic Syndromes: The ADvISED Prospective Multicenter Study. Circulation 2018, 137, 250–258. [Google Scholar] [CrossRef] [PubMed]
- Tsutsumi, Y.; Tsujimoto, Y.; Takahashi, S.; Tsuchiya, A.; Fukuma, S.; Yamamoto, Y.; Fukuhara, S. Accuracy of aortic dissection detection risk score alone or with D-dimer: A systematic review and meta-analysis. Eur. Hear. J. Acute Cardiovasc. Care 2020, 9, S32–S39. [Google Scholar] [CrossRef] [PubMed]
- Kelly, A.-M. Why the aortic dissection detection risk score is problematic in emergency departments. Explor. Med. 2021, 2, 348–351. [Google Scholar] [CrossRef]
- Myrmel, T.; Larsen, M.; Bartnes, K. The International Registry of Acute Aortic Dissections (IRAD)—Experiences from the first 20 years, Scand. Cardiovasc. J. 2016, 50, 329–333. [Google Scholar]
- Pepper, J. Differential aspects of the disease and treatment of thoracic acute aortic dissection (TAAD)—The European experience. Ann. Cardiothorac. Surg. 2016, 5, 360–367. [Google Scholar] [CrossRef]
- Rylski, B.; Pacini, D.; Beyersdorf, F.; Quintana, E.; Schachner, T.; Tsagakis, K.; Ronchey, S.; Durko, A.; De Paulis, R.; Siepe, M.; et al. Standards of reporting in open and endovascular aortic surgery (STORAGE guidelines). Eur. J. Cardio-Thoracic Surg. 2019, 56, 10–20. [Google Scholar] [CrossRef] [PubMed]
- Kapoor, V.; Ferris, J.V.; Fuhrman, C.R. Intimomedial Rupture: A New CT Finding to Distinguish True from False Lumen in Aortic Dissection. Am. J. Roentgenol. 2004, 183, 109–112. [Google Scholar] [CrossRef] [PubMed]
- Castañer, E.; Andreu, M.; Gallardo, X.; Mata, J.M.; Cabezuelo, M.A.; Pallardo, Y. CT in nontraumatic acute thoracic aortic disease: Typical and atypical features and complications. Radiographics 2003, 23, S93–S110. [Google Scholar] [CrossRef] [PubMed]
- McMahon, M.A.; Squirrell, C.A. Multidetector CT of Aortic Dissection: A Pictorial Review. RadioGraphics 2010, 30, 445–460. [Google Scholar] [CrossRef] [PubMed]
- Maddu, K.K.; Shuaib, W.; Tellería, J.; Johnson, J.-O.; Khosa, F. Nontraumatic Acute Aortic Emergencies: Part 1, Acute Aortic Syndrome. Am. J. Roentgenol. 2014, 202, 656–665. [Google Scholar] [CrossRef] [PubMed]
- Litmanovich, D.; Bankier, A.A.; Cantin, L.; Raptopoulos, V.; Boiselle, P.M. CT and MRI in Diseases of the Aorta. Am. J. Roentgenol. 2009, 193, 928–940. [Google Scholar] [CrossRef]
- LePage, M.A.; Quint, L.E.; Sonnad, S.S.; Deeb, G.M.; Williams, D.M. Aortic dissection: CT features that distinguish true lumen from false lumen. AJR Am. J. Roentgenol. 2001, 177, 207–211. [Google Scholar] [CrossRef] [PubMed]
- Moullet, P.; Mann, H. Beak sign. J. Thorac. Imaging 2014, 29, W90. [Google Scholar] [CrossRef]
- Han, J.; Xiang, H.; Ridley, W.E.; Ridley, L.J. Aortic webs and cobwebs: Aortic dissection and arteriopathies. J. Med. Imaging Radiat. Oncol. 2018, 62, 15–16. [Google Scholar] [CrossRef]
- Qanadli, S.D.; Malekzadeh, S.; Villard, N.; Jouannic, A.-M.; Bodenmann, D.; Tozzi, P.; Rotzinger, D.C. A New Clinically Driven Classification for Acute Aortic Dissection. Front. Surg. 2020, 7, 37. [Google Scholar] [CrossRef]
- de Farias, L.P.G.; Santos, J.M.M.M.; Teles, G.B.D.S.; Baptista, L.P.S. Intimointimal Intussusception in Acute Aortic Dissection. Radiol. Cardiothorac. Imaging 2020, 27, e200023. [Google Scholar] [CrossRef]
- Shin, M.S.; Zorn, G.L.; Ho, K.J. Computed tomography manifestation of a triple-barreled aortic dissection: The Mercedes-Benz mark sign. J. Comput. Tomogr. 1988, 12, 140–143. [Google Scholar] [CrossRef]
- Daily, P.O.; Trueblood, H.W.; Stinson, E.B.; Wuerflein, R.D.; Shumway, N.E. Management of Acute Aortic Dissections. Ann. Thorac. Surg. 1970, 10, 237–247. [Google Scholar] [CrossRef]
- DeBakey, M.E.; Henly, W.S.; Cooley, D.A.; Morris, G.C., Jr.; Crawford, E.S.; Beall, A.C., Jr. Surgical management of dissecting aneurysm of the aorta. J. Thorac. Cardiovasc. Surg. 1965, 49, 130–149. [Google Scholar] [CrossRef]
- Rylski, B.; Pérez, M.; Beyersdorf, F.; Reser, D.; Kari, F.A.; Siepe, M.; Czerny, M. Acute non-A non-B aortic dissection: Incidence, treatment and outcome. Eur. J. Cardio-Thoracic Surg. 2017, 52, 1111–1117. [Google Scholar] [CrossRef]
- Carino, D.; Singh, M.; Molardi, A.; Agostinelli, A.; Goldoni, M.; Pacini, D.; Nicolini, F. Non-A non-B aortic dissection: A systematic review and meta-analysis. Eur. J. Cardiothorac. Surg. 2019, 55, 653–659. [Google Scholar] [CrossRef]
- Sievers, H.-H.; Rylski, B.; Czerny, M.; Baier, A.L.M.; Kreibich, M.; Siepe, M.; Beyersdorf, F. Aortic dissection reconsidered: Type, entry site, malperfusion classification adding clarity and enabling outcome prediction. Interact. Cardiovasc. Thorac. Surg. 2019, 30, 451–457. [Google Scholar] [CrossRef]
- Evangelista, A.; Isselbacher, E.M.; Bossone, E.; Gleason, T.G.; DI Eusanio, M.; Sechtem, U.; Ehrlich, M.P.; Trimarchi, S.; Braverman, A.C.; Myrmel, T.; et al. Insights From the International Registry of Acute Aortic Dissection. Circulation 2018, 137, 1846–1860. [Google Scholar] [CrossRef] [PubMed]
- Rampoldi, V.; Trimarchi, S.; Eagle, K.A.; Nienaber, C.A.; Oh, J.K.; Bossone, E.; Myrmel, T.; Sangiorgi, G.; De Vincentiis, C.; Cooper, J.V.; et al. Simple Risk Models to Predict Surgical Mortality in Acute Type A Aortic Dissection: The International Registry of Acute Aortic Dissection Score. Ann. Thorac. Surg. 2007, 83, 55–61. [Google Scholar] [CrossRef] [PubMed]
- Nauta, F.J.; Tolenaar, J.L.; Patel, H.J.; Appoo, J.J.; Tsai, T.T.; Desai, N.D.; Montgomery, D.G.; Mussa, F.F.; Upchurch, G.R.; Fattori, R.; et al. Impact of Retrograde Arch Extension in Acute Type B Aortic Dissection on Management and Outcomes. Ann. Thorac. Surg. 2016, 102, 2036–2043. [Google Scholar] [CrossRef] [PubMed]
- Marchand, P. The Anatomy and Applied Anatomy of the Mediastinal Fascia. Thorax 1951, 6, 359–368. [Google Scholar] [CrossRef]
- Panicek, D.M.; Ewing, D.K.; Markarian, B.; Heitzman, E.R. Interstitial pulmonary hemorrhage from mediastinal hematoma secondary to aortic rupture. Radiology 1987, 162, 165–166. [Google Scholar] [CrossRef]
- Sueyoshi, E.; Sakamoto, I.; Uetani, M.; Matsuoka, Y.; Suenaga, E. CT Findings of Ruptured Intramural Hematoma of the Aorta Extending Along the Pulmonary Artery. Cardiovasc. Interv. Radiol. 2007, 30, 321–323. [Google Scholar] [CrossRef]
- Sueyoshi, E.; Matsuoka, Y.; Sakamoto, I.; Uetani, M. CT and clinical features of hemorrhage extending along the pulmonary artery due to ruptured aortic dissection. Eur. Radiol. 2009, 19, 1166–1174. [Google Scholar] [CrossRef] [PubMed]
- Cao, D.B.; Yang, S.R.; Tong, Q.; Zheng, Y. Interstitial pulmonary hemorrhage along the pulmonary artery secondary to ruptured aortic dissection. Intern. Med. 2010, 49, 1681–1682. [Google Scholar] [CrossRef] [PubMed]
- Guilmette, J.; Semionov, A.; Dennie, C.; Gahide, G.; Pressacco, J.; Fraser, R.; Cordeau, M.-P.; Chartrand-Lefebvre, C. Hemorrhagic infiltration of the aortopulmonary adventitia: A complication of acute aortic dissection. Eur. J. Radiol. 2016, 85, 239–247. [Google Scholar] [CrossRef]
- Lee, K.-C.; Lee, J.W.; Yong, H.S.; Kang, E.-Y. Different CT Findings of Aortic Hemorrhage Extending to Pulmonary Artery from Stanford Type A Aortic Dissection. Iran. J. Radiol. 2018, 15, e13653. [Google Scholar] [CrossRef]
- de Farias, L.P.G.; Favaretto, A.C.; Baptista, L.P.S.; Teles, G.B.S. Pulmonary Arterial Intramural Hematoma Due to Acute Aortic Dissection. Arq. Bras. Cardiol. 2021, 116, 1169–1171. [Google Scholar] [CrossRef]
- Fattori, R.; Tsai, T.T.; Myrmel, T.; Evangelista, A.; Cooper, J.V.; Trimarchi, S.; Li, J.; Lovato, L.; Kische, S.; Eagle, K.A.; et al. Complicated Acute Type B Dissection: Is Surgery Still the Best Option? A Report From the International Registry of Acute Aortic Dissection. JACC Cardiovasc. Interv. 2008, 1, 395–402. [Google Scholar] [CrossRef]
- Ray, H.M.; Durham, C.A.; Ocazionez, D.; Charlton-Ouw, K.M.; Estrera, A.L.; Miller, C.C., 3rd; Safi, H.J.; Azizzadeh, A. Predictors of intervention and mortality in patients with uncomplicated acute type B aortic dissection. J. Vasc. Surg. 2016, 64, 1560–1568. [Google Scholar] [CrossRef] [PubMed]
- Fattori, R.; Cao, P.; De Rango, P.; Czerny, M.; Evangelista, A.; Nienaber, C.; Rousseau, H.; Schepens, M. Interdisciplinary Expert Consensus Document on Management of Type B Aortic Dissection. J. Am. Coll. Cardiol. 2013, 61, 1661–1678. [Google Scholar] [CrossRef] [PubMed]
- Luebke, T.; Brunkwall, J. Type B Aortic Dissection: A Review of Prognostic Factors and Meta-analysis of Treatment Options. Aorta 2014, 2, 265–278. [Google Scholar] [CrossRef] [PubMed]
- Nauta, F.J.; Trimarchi, S.; Kamman, A.V.; Moll, F.L.; van Herwaarden, J.A.; Patel, H.J.; Figueroa, C.A.; Eagle, K.A.; Froehlich, J.B. Up-date in the management of type B aortic dissection. Vasc. Med. 2016, 21, 251–263. [Google Scholar] [CrossRef] [PubMed]
- Kaji, S. Update on the Therapeutic Strategy of Type B Aortic Dissection. J. Atheroscler. Thromb. 2018, 25, 203–212. [Google Scholar] [CrossRef] [PubMed]
- Tsai, T.T.; Isselbacher, E.M.; Trimarchi, S.; Bossone, E.; Pape, L.; Januzzi, J.L.; Evangelista, A.; Oh, J.K.; Llovet, A.; Beckman, J.; et al. Acute type B aortic dissection: Does aortic arch involvement affect management and outcomes? Insights from the International Registry of Acute Aortic Dissection (IRAD). Circulation 2007, 116, I150–I156. [Google Scholar] [CrossRef] [PubMed]
- Valentine, R.J.; Boll, J.M.; Hocking, K.; Curci, J.A.; Garrard, C.L.; Brophy, C.M.; Naslund, T.C. Aortic arch involvement worsens the prognosis of type B aortic dissections. J. Vasc. Surg. 2016, 64, e1212–e1218. [Google Scholar] [CrossRef]
- Czerny, M.; Schmidli, J.; Adler, S.; van den Berg, J.C.; Bertoglio, L.; Carrel, T.; Chiesa, R.; Clough, R.E.; Eberle, B.; Etz, C.; et al. Editor’s Choice—Current Options and Recommendations for the Treatment of Thoracic Aortic Pathologies Involving the Aortic Arch: An Expert Consensus Document of the European Association for Cardio-Thoracic Surgery (EACTS) & the European Society for Vascular Surgery (ESVS). Eur. J. Vasc. Endovasc. Surg. 2019, 57, 165–198. [Google Scholar]
- Nienaber, C.A.; Sievers, H.H. Intramural hematoma in acute aortic syndrome—More than one variant of dissection? Circulation 2002, 106, 284–285. [Google Scholar] [CrossRef]
- Ganaha, F.; Craig Miller, D.; Sugimoto, K.; Do, Y.S.; Minamiguchi, H.M.D.; Saito, H.; Scott Mitchell, R.; Dake, M.D. Prognosis of Aortic Intramural Hematoma With and Without Penetrating Atherosclerotic Ulcer. Circulation 2002, 106, 342–348. [Google Scholar] [CrossRef]
- Harris, K.M.; Braverman, A.C.; Eagle, K.A.; Woznicki, E.M.; Pyeritz, R.E.; Myrmel, T.; Peterson, M.D.; Voehringer, M.; Fattori, R.; Januzzi, J.L.; et al. Acute aortic intramural hematoma: An analysis from the International Registry of Acute Aortic Dissection. Circulation 2012, 126, S91–S96. [Google Scholar] [CrossRef]
- Krukenberg, E. Beitrage zur Frage des Aneurisms dissecans. Beitr. Pathol. Anat. Allg. Pathol. 1920, 67, 329–351. [Google Scholar]
- Kitai, T.; Kaji, S.; Yamamuro, A.; Tani, T.; Kinoshita, M.; Ehara, N.; Kobori, A.; Kim, K.; Kita, T.; Furukawa, Y. Detection of Intimal Defect by 64-Row Multidetector Computed Tomography in Patients With Acute Aortic Intramural Hematoma. Circulation 2011, 124, S174–S178. [Google Scholar] [CrossRef] [PubMed]
- Mussa, F.F.; Horton, J.D.; Moridzadeh, R.; Nicholson, J.; Trimarchi, S.; Eagle, K.A. Acute aortic dissection and intramural hematoma: A systematic review. JAMA 2016, 316, 754–763. [Google Scholar] [CrossRef] [PubMed]
- Maslow, A.; Atalay, M.K.; Sodha, N. Intramural Hematoma. J. Cardiothorac. Vasc. Anesth. 2018, 32, 1341–1362. [Google Scholar] [CrossRef] [PubMed]
- Sueyoshi, E.; Matsuoka, Y.; Sakamoto, I.; Uetani, M.; Hayashi, K.; Narimatsu, M. Fate of Intramural Hematoma of the Aorta: CT Evaluation. J. Comput. Assist. Tomogr. 1997, 21, 931–938. [Google Scholar] [CrossRef] [PubMed]
- Lee, Y.K.; Seo, J.B.; Jang, Y.M.; Do, K.H.; Kim, S.S.; Lee, J.S.; Song, K.S.; Song, J.W.; Han, H.; Kim, S.S.; et al. Acute and chronic complications of aortic intramural hematoma on follow-up computed tomography: Incidence and predictor analysis. J. Comput. Assist. Tomogr. 2007, 31, 435–440. [Google Scholar] [CrossRef] [PubMed]
- Ferrera, C.; Vilacosta, I.; Cabeza, B.; Cobiella, J.; Martínez, I.; Sanz, M.S.-P.; Bustos, A.; Serrano, F.J.; Maroto, L. Diagnosing Aortic Intramural Hematoma: Current Perspectives. Vasc. Health Risk Manag. 2020, 16, 203–213. [Google Scholar] [CrossRef] [PubMed]
- Oderich, G.S.; Kärkkäinen, J.M.; Reed, N.R.; Tenorio, E.; Sandri, G.A. Penetrating Aortic Ulcer and Intramural Hematoma. Cardiovasc. Interv. Radiol. 2018, 42, 321–334. [Google Scholar] [CrossRef]
- Murillo, H.; Molvin, L.A.; Chin, S.; Fleischmann, D. Aortic Dissection and Other Acute Aortic Syndromes: Diagnostic Imaging Findings from Acute to Chronic Longitudinal Progression. RadioGraphics 2021, 41, 425–446. [Google Scholar] [CrossRef]
- Evangelista, A.; Dominguez, R.; Sebastia, C.; Salas, A.; Permanyer-Miralda, G.; Avegliano, G.; Gomez-Bosh, Z.; Gonzalez-Alujas, T.; Garcia del Castillo, H.; Soler-Soler, J. Prognostic value of clinical and morphologic findings in short-term evolution of aortic intramural hematoma. Eur. Heart J. 2004, 25, 81–87. [Google Scholar] [CrossRef] [PubMed]
- Vilacosta, I.; Román, J.A.S.; Ferreirós, J.; Aragoncillo, P.; Méndez, R.; Castillo, J.A.; Rollán, M.J.; Batlle, E.; Peral, V.; Sánchez-Harguindey, L. Natural history and serial morphology of aortic intramural hematoma: A novel variant of aortic dissection. Am. Heart J. 1997, 134, 495–507. [Google Scholar] [CrossRef]
- Schlatter, T.; Auriol, J.; Marcheix, B.; Lebbadi, M.; Marachet, M.A.; Dang-Tran, K.D.; Tran, M.; Honton, B.; Gardette, V.; Rousseau, H. Type B Intramural Hematoma of the Aorta: Evolution and Prognostic Value of Intimal Erosion. J. Vasc. Interv. Radiol. 2011, 22, 533–541. [Google Scholar] [CrossRef] [PubMed]
- Kitai, T.; Kaji, S.; Yamamuro, A.; Tani, T.; Kinoshita, M.; Ehara, N.; Kobori, A.; Kita, T.; Furukawa, Y. Impact of New Development of Ulcer-Like Projection on Clinical Outcomes in Patients With Type B Aortic Dissection With Closed and Thrombosed False Lumen. Circulation 2010, 122, S74–S80. [Google Scholar] [CrossRef] [PubMed]
- Sueyoshi, E.; Matsuoka, Y.; Imada, T.; Okimoto, T.; Sakamoto, I.; Hayashi, K. New Development of an Ulcerlike Projection in Aortic Intramural Hematoma: CT Evaluation. Radiology 2002, 224, 536–541. [Google Scholar] [CrossRef] [PubMed]
- Evangelista, A.; Moral, S. Penetrating atherosclerotic ulcer. Curr. Opin. Cardiol. 2020, 35, 620–626. [Google Scholar] [CrossRef] [PubMed]
- Nathan, D.P.; Boonn, W.; Lai, E.; Wang, G.J.; Desai, N.; Woo, E.Y.; Fairman, R.M.; Jackson, B.M. Presentation, complications, and natural history of penetrating atherosclerotic ulcer disease. J. Vasc. Surg. 2012, 55, 10–15. [Google Scholar] [CrossRef]
- Bansal, S.; Singhania, N.; Yadav, M.; Singhania, G. A Penetrating Aortic Ulcer. J. Emerg. Med. 2020, 59, e25–e26. [Google Scholar] [CrossRef]
- Roldan, C.J. Penetrating atherosclerotic ulcerative disease of the aorta: Do emergency physicians need to worry? J. Emerg. Med. 2012, 43, 196–203. [Google Scholar] [CrossRef]
- El Hassani, I.; Van Damme, H.; Creemers, E.; Boesmans, E.; Defraigne, J.O. Penetrating atherosclerosis aortic ulcer: A re-appraisal. Acta Chir. Belg. 2017, 117, 1–7. [Google Scholar] [CrossRef]
- Svensson, L.G. Limited Intimal Aorta Tears. J. Am. Coll. Cardiol. 2018, 71, 2786–2789. [Google Scholar] [CrossRef]
- Chirillo, F.; Salvador, L.; Bacchion, F.; Grisolia, E.F.; Valfrè, C.; Olivari, Z. Clinical and Anatomical Characteristics of Subtle-Discrete Dissection of the Ascending Aorta. Am. J. Cardiol. 2007, 100, 1314–1319. [Google Scholar] [CrossRef]
- La Canna, G.; Formisano, T.; Monti, L.; Torracca, L.; Scarfò, I. A Subtle Clinical Phenotype of Aortic Limited Intimal Tear without Hematoma. JACC Cardiovasc. Imaging 2019, 12, 1572–1577. [Google Scholar] [CrossRef] [PubMed]
- Ruiz Carazo, E.; Láinez Ramos-Bossini, A.J.; Pérez García, C.; López Milena, G. Aortic dissection class 3: A little-known entity. Presentation of 4 cases. Radiologia 2020, 62, 78–84. [Google Scholar] [CrossRef]
- Ueda, T.; Chin, A.; Petrovitch, I.; Fleischmann, D. A pictorial review of acute aortic syndrome: Discriminating and overlapping features as revealed by ECG-gated multidetector-row CT angiography. Insights Imaging 2012, 3, 561–571. [Google Scholar] [CrossRef] [PubMed]
- Chin, A.S.; Willemink, M.J.; Kino, A.; Hinostroza, V.; Sailer, A.M.; Fischbein, M.P.; Mitchell, R.S.; Berry, G.J.; Miller, D.C.; Fleischmann, D. Acute Limited Intimal Tears of the Thoracic Aorta. J. Am. Coll. Cardiol. 2018, 71, 2773–2785. [Google Scholar] [CrossRef] [PubMed]
- Valente, T.; Rossi, G.; Lassandro, F.; Rea, G.; Marino, M.; Urciuolo, S.; Tortora, G.; Muto, M. MDCT distinguishing features of focal aortic projections (FAP) in acute clinical settings. Radiol. Med. 2015, 120, 50–72. [Google Scholar] [CrossRef]
- Gouveia, E.; Melo, R.; Silva Duarte, G.; Lopes, A.; Alves, M.; Caldeira, D.; Fernandes, E.; Fernandes, R.; Mendes Pedro, L. Incidence and prevalence of thoracic aortic aneurysms: A systematic review and meta- analysis of population-based studies. Semin. Thorac. Cardiovasc. Surg. 2021, 8. [Google Scholar] [CrossRef]
- Mao, S.S.; Ahmadi, N.; Shah, B.; Beckmann, D.; Chen, A.; Ngo, L.; Flores, F.R.; Gao, Y.L.; Budoff, M.J. Normal thoracic aorta diameter on cardiac computed tomography in healthy asymptomatic adults. Acad. Radiol. 2008, 15, 827–834. [Google Scholar] [CrossRef] [PubMed]
- Elefteriades, J.A.; Mukherjee, S.K.; Mojibian, H. Discrepancies in measurement of the thoracic aorta: JACC review topic of the week. J. Am. Coll. Cardiol. 2020, 76, 201–217. [Google Scholar] [CrossRef] [PubMed]
- Obel, L.M.; Diederichsen, A.C.; Steffensen, F.H.; Frost, L.; Lambrechtsen, J.; Busk, M.; Urbonaviciene, G.; Egstrup, K.; Karon, M.; Rasmussen, L.M.; et al. Population-Based Risk Factors for Ascending, Arch, Descending, and Abdominal Aortic Dilations for 60-74-Year-Old Individuals. J. Am. Coll. Cardiol. 2021, 78, 201–211. [Google Scholar] [CrossRef]
- Gaudry, M.; Barral, P.-A.; Blanchard, A.; Palazzolo, S.; Bolomey, S.; Omnes, V.; De Masi, M.; Carcopino-Tusoli, M.; Meyrignac, O.; Rousseau, H.; et al. Prevalence of Thoracic Aortic Aneurysms in Patients with Degenerative Abdominal Aortic Aneurysms: Results from the Prospective ACTA Study. Eur. J. Vasc. Endovasc. Surg. 2021, 61, 930–937. [Google Scholar] [CrossRef] [PubMed]
- Safi, H.J.; Miller, C.C., 3rd. Spinal cord protection in descending thoracic and thoracoabdominal aortic repair. Ann. Thorac. Surg. 1999, 67, 1937–1939. [Google Scholar] [CrossRef]
- Boules, T.N.; Compton, C.N.; Stanziale, S.F.; Sheehan, M.K.; Dillavou, E.D.; Gupta, N.; Tzeng, E.; Makaroun, M.S. Can computed tomography scan findings predict ‘‘impending’’ aneurysm rupture? Vasc. Endovasc. Surg. 2006, 40, 41–47. [Google Scholar] [CrossRef]
- Schwartz, S.A.; Taljanovic, M.S.; Smyth, S.; O’Brien, M.J.; Rogers, L.F. CT findings of rupture, impending rupture, and contained rupture of abdominal aortic aneurysms. AJR Am. J. Roentgenol. 2007, 188, W57–W62. [Google Scholar] [CrossRef]
- Kumar, Y.; Hooda, K.; Li, S.; Goyal, P.; Gupta, N.; Adeb, M. Abdominal aortic aneurysm: Pictorial review of common appearances and complications. Ann. Transl. Med. 2017, 5, 256. [Google Scholar] [CrossRef] [PubMed]
- Gish, D.S.; Baer, J.A.; Crabtree, G.S.; Shaikh, B.; Fareedy, S.B. Impending aortic aneurysm rupture—A case report and review of the warning signs. J. Community Hosp. Intern. Med. Perspect. 2016, 6, 32217. [Google Scholar] [CrossRef][Green Version]
- Kang, E.-J.; Lee, K.-N.; Lee, J. Acute Aortic Syndrome: Recent Trends in Imaging Assessment Using Computed Tomography Angiograph. Cardiovasc. Imaging Asia 2017, 1, 211–221. [Google Scholar] [CrossRef]
- Rakita, D.; Newatia, A.; Hines, J.J.; Siegel, D.N.; Friedman, B. Spectrum of CT Findings in Rupture and Impending Rupture of Abdominal Aortic Aneurysms. RadioGraphics 2007, 27, 497–507. [Google Scholar] [CrossRef]
- Roy, J.; Labruto, F.; Beckman, M.O.; Danielson, J.; Johansson, G.; Swedenborg, J. Bleeding into the intraluminal thrombus in abdominal aortic aneurysms is associated with rupture. J. Vasc. Surg. 2008, 48, 1108–1113. [Google Scholar] [CrossRef]
- Antunes, B.F.F.; Tachibana, A.; de Almeida Mendes, C.; Lembrança, L.; Silva, M.J.; Teivelis, M.P.; Wolosker, N. Signs of impending rupture in abdominal aortic and iliac artery aneurysms by computed tomography: Outcomes in 41 patients. Clinics 2021, 8, e2455. [Google Scholar] [CrossRef]
- Corrêa, I.B.; Alves, B.L.T.; Sobrinho, T.A.D.O.; Ramos, L.F.M.; Diniz, R.L.F.C.; Ribeiro, M.A. Abdominal aortic aneurysms that have ruptured or are at imminent risk of rupture. Radiol. Bras. 2019, 52, 182–186. [Google Scholar] [CrossRef]
- Ueda, T.; Hayashi, H.; Ando, T.; Iwata, K.; Saito, H.; Kumita, S.I. Computed Tomography Attenuation Values of the High-Attenuating Crescent Sign Can Discriminate Between Rupture, Impending Rupture, and Non-Rupture of Aortic Aneurysms. Circ. J. 2021, 85, 2184–2190. [Google Scholar] [CrossRef]
- Yuan, S.M. Aortobronchial fistula. Gen. Thorac. Cardiovasc. Surg. 2020, 68, 93–101. [Google Scholar]
- Hui, D.S.; Stoeckel, D.A.; Kaufman, E.E.; Jacobs, D.L. Massive Hemoptysis From an Aortobronchial Fistula Secondary to BCG-Related Mycotic Thoracic Aortic Aneurysm. Ann. Thorac. Surg. 2016, 101, 350–352. [Google Scholar] [CrossRef] [PubMed]
- Tigkiropoulos, K.; Stavridis, K.; Lazaridis, I.; Saratzis, N. Endovascular repair of aortobronchial fistula due to saccular aneurysm of thoracic aorta. Case Rep. Vasc. Med. 2017, 2017, 3158693. [Google Scholar] [CrossRef]
- Yang, Y.; Hu, D.; Peng, D. Primary aortoesophageal fistula: A fatal outcome. Am. J. Emerg. Med. 2018, 36, 343.e1–343.e3. [Google Scholar] [CrossRef] [PubMed]
- Andrade, L.C.; Felix-Morais, R.; Gil-Agostinho, A.; Caseiro-Alves, F. Aorto-oesophageal fistula treated with emergent thoracic endovascular repair. BMJ Case Rep. 2014, 14, bcr2014204254. [Google Scholar] [CrossRef]
- Agarwal, P.P.; Chughtai, A.; Matzinger, F.R.K.; Kazerooni, E.A. Multidetector CT of Thoracic Aortic Aneurysms. RadioGraphics 2009, 29, 537–552. [Google Scholar] [CrossRef] [PubMed]
- Chao, C.P.; Walker, T.G.; Kalva, S.P. Natural History and CT Appearances of Aortic Intramural Hematoma. RadioGraphics 2009, 29, 791–804. [Google Scholar] [CrossRef]
- Hartlage, G.R.; Palios, J.; Barron, B.J.; Stillman, A.E.; Bossone, E.; Clements, S.D.; Lerakis, S. Multimodality Imaging of Aortitis. JACC Cardiovasc. Imaging 2014, 7, 605–619. [Google Scholar] [CrossRef]
- Grollman, J.H., Jr. Aortic or ductus diverticulum? AJR Am. J. Roentgenol. 1995, 165, 487–488. [Google Scholar] [CrossRef][Green Version]
- Katabathina, V.S.; Restrepo, C.S. Infectious and Noninfectious Aortitis: Cross-Sectional Imaging Findings. Semin. Ultrasound CT MRI 2012, 33, 207–221. [Google Scholar] [CrossRef] [PubMed]
- Murphy, D.J.; Keraliya, A.R.; Agrawal, M.D.; Aghayev, A.; Steigner, M.L. Cross-sectional imaging of aortic infections. Insights Imaging 2016, 7, 801–818. [Google Scholar] [CrossRef] [PubMed]
- Holm, P.W.; Sandovici, M.; Slart, R.H.; Glaudemans, A.; Rutgers, A.; Brouwer, E. Vessel involvement in giant cell arteritis: An imaging approach. J. Cardiovasc. Surg. 2016, 57, 127–136. [Google Scholar]
- Weinrich, J.M.; Lenz, A.; Adam, G.; François, C.J.; Bannas, P. Radiologic Imaging in Large and Medium Vessel Vasculitis. Radiol. Clin. N. Am. 2020, 58, 765–779. [Google Scholar] [CrossRef] [PubMed]
- Kang, E.J.; Kim, S.M.; Choe, Y.H.; Lee, G.Y.; Lee, K.N.; Kim, D.K. Takayasu arteritis: Assessment of coronary arterial abnormalities with 128-section dual-source CT angiography of the coronary arteries and aorta. Radiology 2014, 270, 74–81. [Google Scholar] [CrossRef] [PubMed]
- Husmann, L.; Huellner, M.W.; Ledergerber, B.; Eberhard, N.; Kaelin, M.B.; Anagnostopoulos, A.; Kudura, K.; Burger, I.A.; Mestres, C.-A.; Rancic, Z.; et al. Diagnostic Accuracy of PET/CT and Contrast Enhanced CT in Patients With Suspected Infected Aortic Aneurysms. Eur. J. Vasc. Endovasc. Surg. 2020, 59, 972–981. [Google Scholar] [CrossRef]
- Stone, J.R.; Bruneval, P.; Angelini, A.; Bartoloni, G.; Basso, C.; Batoroeva, L.; Buja, L.M.; Butany, J.; d’Amati, G.; Fallon, J.T.; et al. Consensus statement on surgical pathology of the aorta from the Society for Cardiovascular Pathology and the Association for European Cardiovascular Pathology: I. Inflammatory diseases. Cardiovasc. Pathol. 2015, 24, 267–278. [Google Scholar] [CrossRef]
- Pérez-García, C.N.; Olmos, C.; Vivas, D.; Ferrera, C.; García-Arribas, D.; Enríquez-Vázquez, D.; Carnero-Alcázar, M.; Maroto, L.; Candil, A.O.; Sanz, M.S.-P.; et al. IgG4-aortitis among thoracic aortic aneurysms. Heart 2019, 105, 1583–1589. [Google Scholar] [CrossRef]
- Hollier, L.H.; Kazmier, F.J.; Ochsner, J.; Bowen, J.C.; Procter, C.D. “Shaggy” Aorta Syndrome with Atheromatous Embolization to Visceral Vessels. Ann. Vasc. Surg. 1991, 5, 439–444. [Google Scholar] [CrossRef]
- Fukuda, I.; Daitoku, K.; Minakawa, M.; Fukuda, W. Shaggy and calcified aorta: Surgical implications. Gen. Thorac. Cardiovasc. Surg. 2013, 61, 301–313. [Google Scholar] [CrossRef]
- Serra, R.; Bracale, U.M.; Jiritano, F.; Ielapi, N.; Licastro, N.; Provenzano, M.; Andreucci, M.; Pingitore, A.; de Franciscis, S.; Mastroroberto, P.; et al. The Shaggy Aorta Syndrome: An Updated Review. Ann. Vasc. Surg. 2020, 70, 528–541. [Google Scholar] [CrossRef]
- Patel, S.D.; Constantinou, J.; Hamilton, H.; Davis, M.; Ivancev, K. Editor’s choice- A shaggy aorta is associated with mesenteric embolization in patients undergoing fenestrated endografts to treat paravisceral aortic aneurysms. Eur. J. Vasc. Endovasc. Surg. 2014, 47, 374–379. [Google Scholar] [CrossRef][Green Version]
- Kwon, H.; Han, Y.; Noh, M.; Gwon, J.G.; Cho, Y.P.; Kwon, T.W. Impact of shaggy aorta in patients with abdominal aortic aneurysm following open or endovascular aneurysm repair. Eur. J. Vasc. Endovasc. Surg. 2016, 52, 613–619. [Google Scholar] [CrossRef] [PubMed]
- Gomez-Arbelaez, D.; Ibarra-Sanchez, G.; Garcia-Gutierrez, A.; Comanges-Yeboles, A.; Ansuategui-Vicente, M.; Gonzalez-Fajardo, J.A. COVID-19-Related Aortic Thrombosis: A Report of Four Cases. Ann. Vasc. Surg. 2020, 67, 10–13. [Google Scholar] [CrossRef] [PubMed]
- Maeda, K.; Ohki, T.; Kanaoka, Y.; Shukuzawa, K.; Baba, T.; Momose, M. A Novel Shaggy Aorta Scoring System to Predict Embolic Complications Following Thoracic Endovascular Aneurysm Repair. Eur. J. Vasc. Endovasc. Surg. 2020, 60, 57–66. [Google Scholar] [CrossRef] [PubMed]
- Belczak, S.Q.; Sincos, I.R.; Aun, R.; Costa, K.V.; Araujo, E.A. Coral reef aorta, emergency surgical: Case report and literature review. Einstein 2014, 12, 237–241. [Google Scholar] [CrossRef]
- Kloth, C.; Schmidt, S.A. Coral-reef-aorta. Abdom. Radiol. 2019, 44, 383–384. [Google Scholar] [CrossRef] [PubMed]


|
|
|
|
|
|
|
|
|
| 1 | Comparison with prior examinations, if available. |
| 2 | Visualization of intimal flap and its extent according to the aortic anatomic segmentation. |
| 3 | The aortic root including coronary artery perfusion and valve function (regurgitation!) and morphology (tricuspid versus bicuspid). |
| 4 | Site, size, and number of the entry tear(s) and all other distally appearing tears including re-entry tears and type and hemodynamic conditions of all side-branch involvement (static or dynamic flow impairment; no flow/low flow). |
| 5 | Diameter, length, course, and CT findings of the false lumen; the aortic maximum diameter, localization, and extent of aortic wall thickening; IMH co-existence. |
| 6 | Patency of all aortic side branches up to the Circle of Willis and caudad to the femoral bifurcation. |
| 7 | Angulation, tortuosity, and precise caliber measurement of all segments of the aorta and iliac arteries; presence of PAU (localization, length, and depth). |
| 8 | Morphologic or hemodynamic signs of organ malperfusion. |
| 9 | Pericardial effusion/tamponade; pleural/extrapleural effusion/hemorrhage; mediastinal hematoma. |
| 10 | Signs of contained (peri-aortic bleeding) or free rupture. |
| True Lumen | False Lumen |
|---|---|
| Surrounded by calcifications (if present) | Delayed enhancement, slower flow |
| Hyperdense in early arterial phase | Hyperdense in the venous phase |
| Smaller than a false lumen | Larger than a true lumen |
| Continuity with an undissected aorta | Not connected to the unaffected aorta |
| Intima displaced inwards | Beak-sign, Cobwebs sign |
| Calcification along the intimal flap | Circular configuration |
| Outer wall calcification/s | Lack of outer wall calcification/s |
| Usually origin of CT, SMA, and RRA 1 | Usually origin of LRA 2 |
| Inner lumen in aortic arch | Partial thrombus formation |
| Wrapped around the false lumen | Wrapped around the true lumen |
| › Ascending aorta involved (type A IMH). |
| › Aortic diameter > 5 cm (a greater stress on the dilated aortic wall implies a greater risk of rupture). |
| › Hematoma thickness (HT) > 11 mm. |
| › Luminal compression ratio (minimum/maximum transverse luminal diameters at the site of the maximal HT). |
| › Associated penetrating atherosclerotic ulcer (PAU) diameter > 20 mm and depth > 10 mm. |
| › Temporal aortic enlargement on serial imaging (rapid aortic diameter growth during hospital stay). |
| › Periaortic, pleural, or pericardial effusions, particularly if large or temporally progressive. |
| › Persistent pain or hemodynamic instability, or both. |
| Location | CTA Findings | Complete Rupture | Impending Rupture |
|---|---|---|---|
| Intramural | Increased aneurysm (>5.5 cm) | - | + |
| Rapid enlargement rate (>4 mm/year) | - | + | |
| Focal wall irregularity | + | + | |
| Hyperattenuating crescent sign | - | + | |
| Thrombus fissuration | - | + | |
| Draped Aorta sign | - | + | |
| Missing calcium sign | - | + | |
| Tangential calcium sign | - | + | |
| Luminal | Aortoesophageal fistula | + | - |
| Aortobronchial fistula | + | - | |
| Periaortic stranding | - | + | |
| Extraluminal | Contrast extravasation | + | - |
| Mediastinal hematoma | + | - | |
| Pleural hematoma | + | - | |
| Pericardial hematoma | + | ± |
Publisher’s Note: MDPI stays neutral with regard to jurisdictional claims in published maps and institutional affiliations. |
© 2022 by the authors. Licensee MDPI, Basel, Switzerland. This article is an open access article distributed under the terms and conditions of the Creative Commons Attribution (CC BY) license (https://creativecommons.org/licenses/by/4.0/).
Share and Cite
Valente, T.; Sica, G.; Bocchini, G.; Romano, F.; Lassandro, F.; Rea, G.; Muto, E.; Pinto, A.; Iacobellis, F.; Crivelli, P.; et al. MDCT Imaging of Non-Traumatic Thoracic Aortic Emergencies and Its Impact on Diagnosis and Management—A Reappraisal. Tomography 2022, 8, 200-228. https://doi.org/10.3390/tomography8010017
Valente T, Sica G, Bocchini G, Romano F, Lassandro F, Rea G, Muto E, Pinto A, Iacobellis F, Crivelli P, et al. MDCT Imaging of Non-Traumatic Thoracic Aortic Emergencies and Its Impact on Diagnosis and Management—A Reappraisal. Tomography. 2022; 8(1):200-228. https://doi.org/10.3390/tomography8010017
Chicago/Turabian StyleValente, Tullio, Giacomo Sica, Giorgio Bocchini, Federica Romano, Francesco Lassandro, Gaetano Rea, Emanuele Muto, Antonio Pinto, Francesca Iacobellis, Paola Crivelli, and et al. 2022. "MDCT Imaging of Non-Traumatic Thoracic Aortic Emergencies and Its Impact on Diagnosis and Management—A Reappraisal" Tomography 8, no. 1: 200-228. https://doi.org/10.3390/tomography8010017
APA StyleValente, T., Sica, G., Bocchini, G., Romano, F., Lassandro, F., Rea, G., Muto, E., Pinto, A., Iacobellis, F., Crivelli, P., Abu-Omar, A., & Scaglione, M. (2022). MDCT Imaging of Non-Traumatic Thoracic Aortic Emergencies and Its Impact on Diagnosis and Management—A Reappraisal. Tomography, 8(1), 200-228. https://doi.org/10.3390/tomography8010017