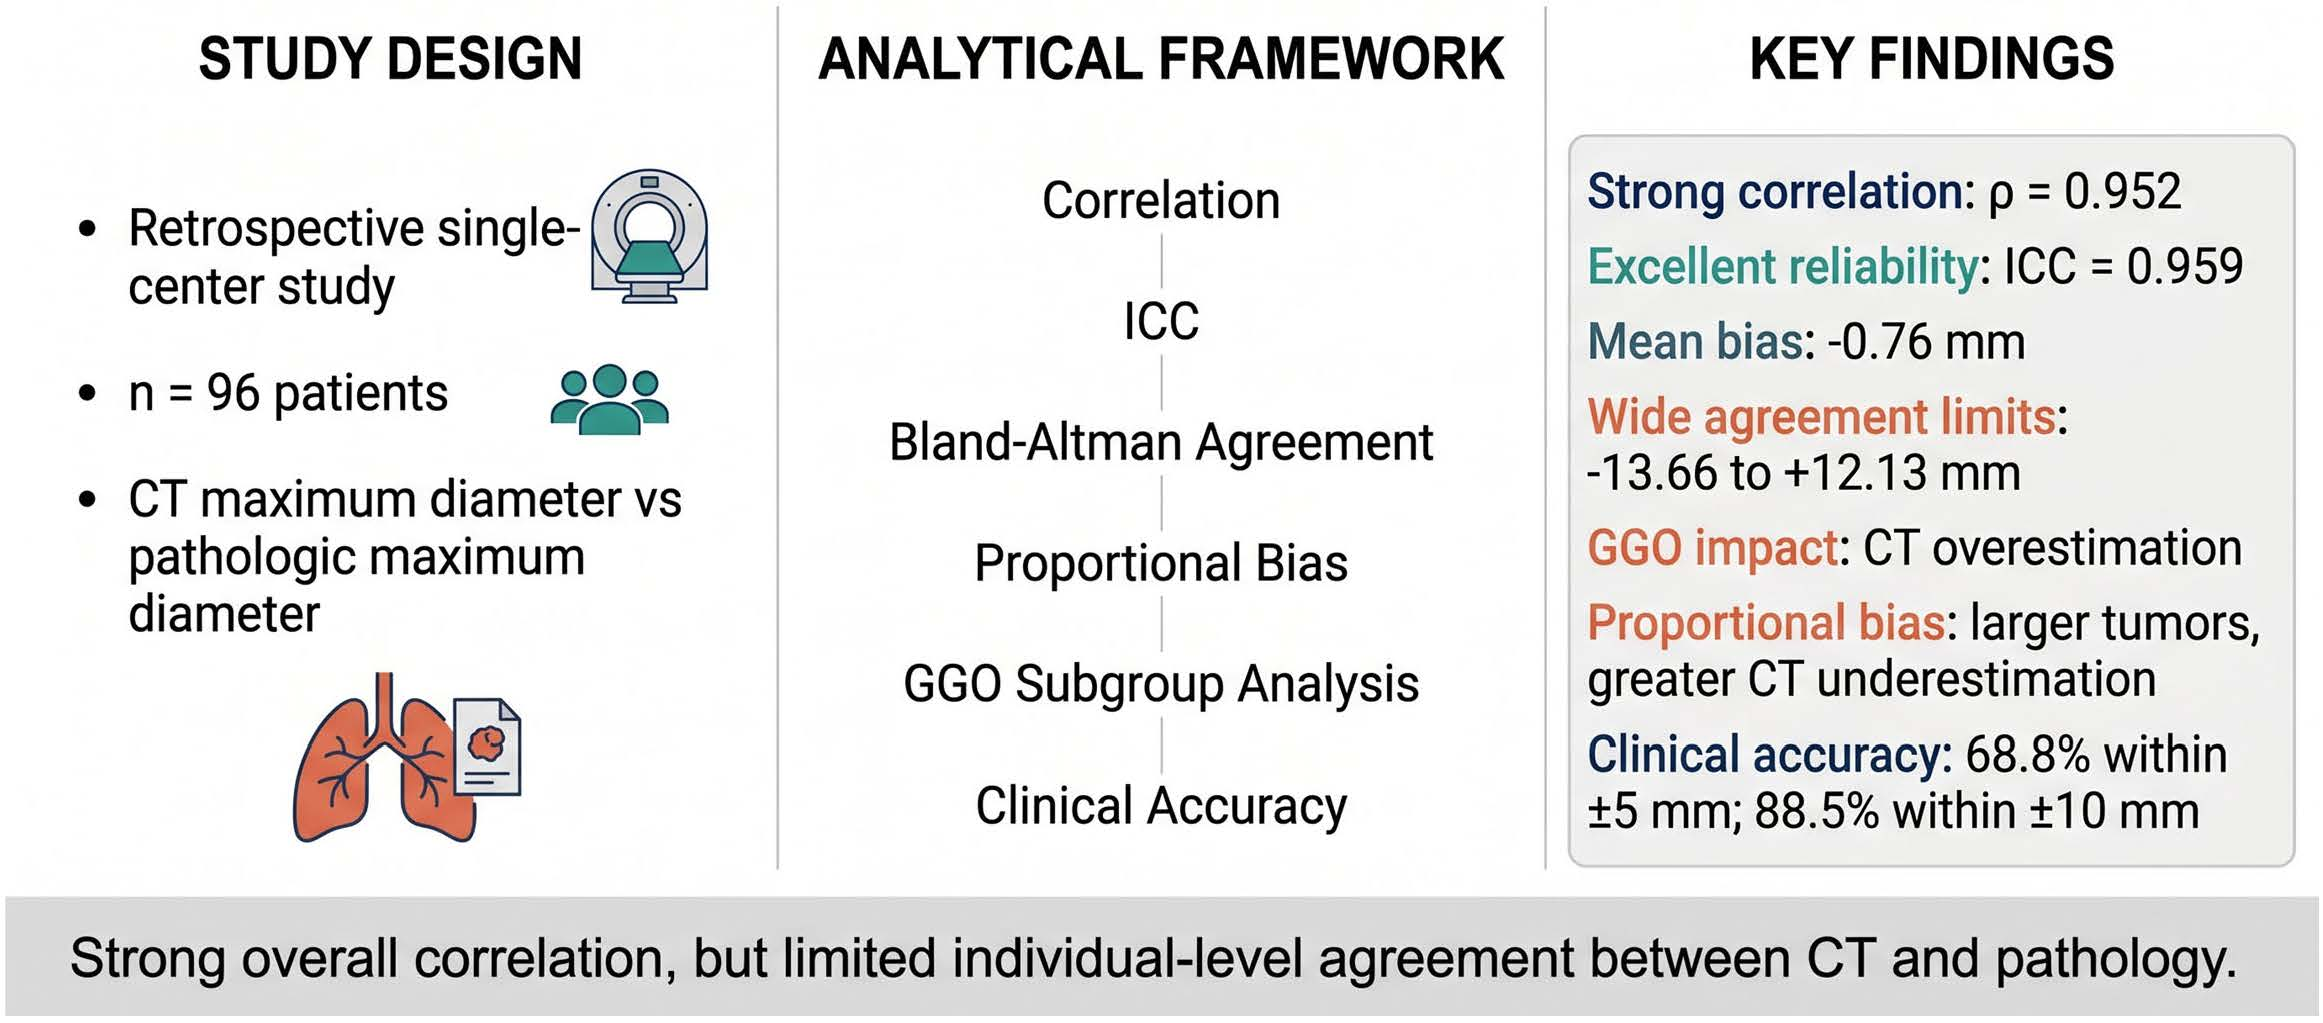
Computed Tomography Versus Pathologic Tumor Size in Resected Lung Tumors: High Correlation, Limited Agreement, and the Impact of Ground-Glass Opacity


Simple Summary
Abstract
1. Introduction
2. Materials and Methods
2.1. Study Design and Patient Cohort
2.2. Measurement Definitions
2.3. Study Variables
2.4. Statistical Analysis
3. Results
3.1. Cohort Characteristics
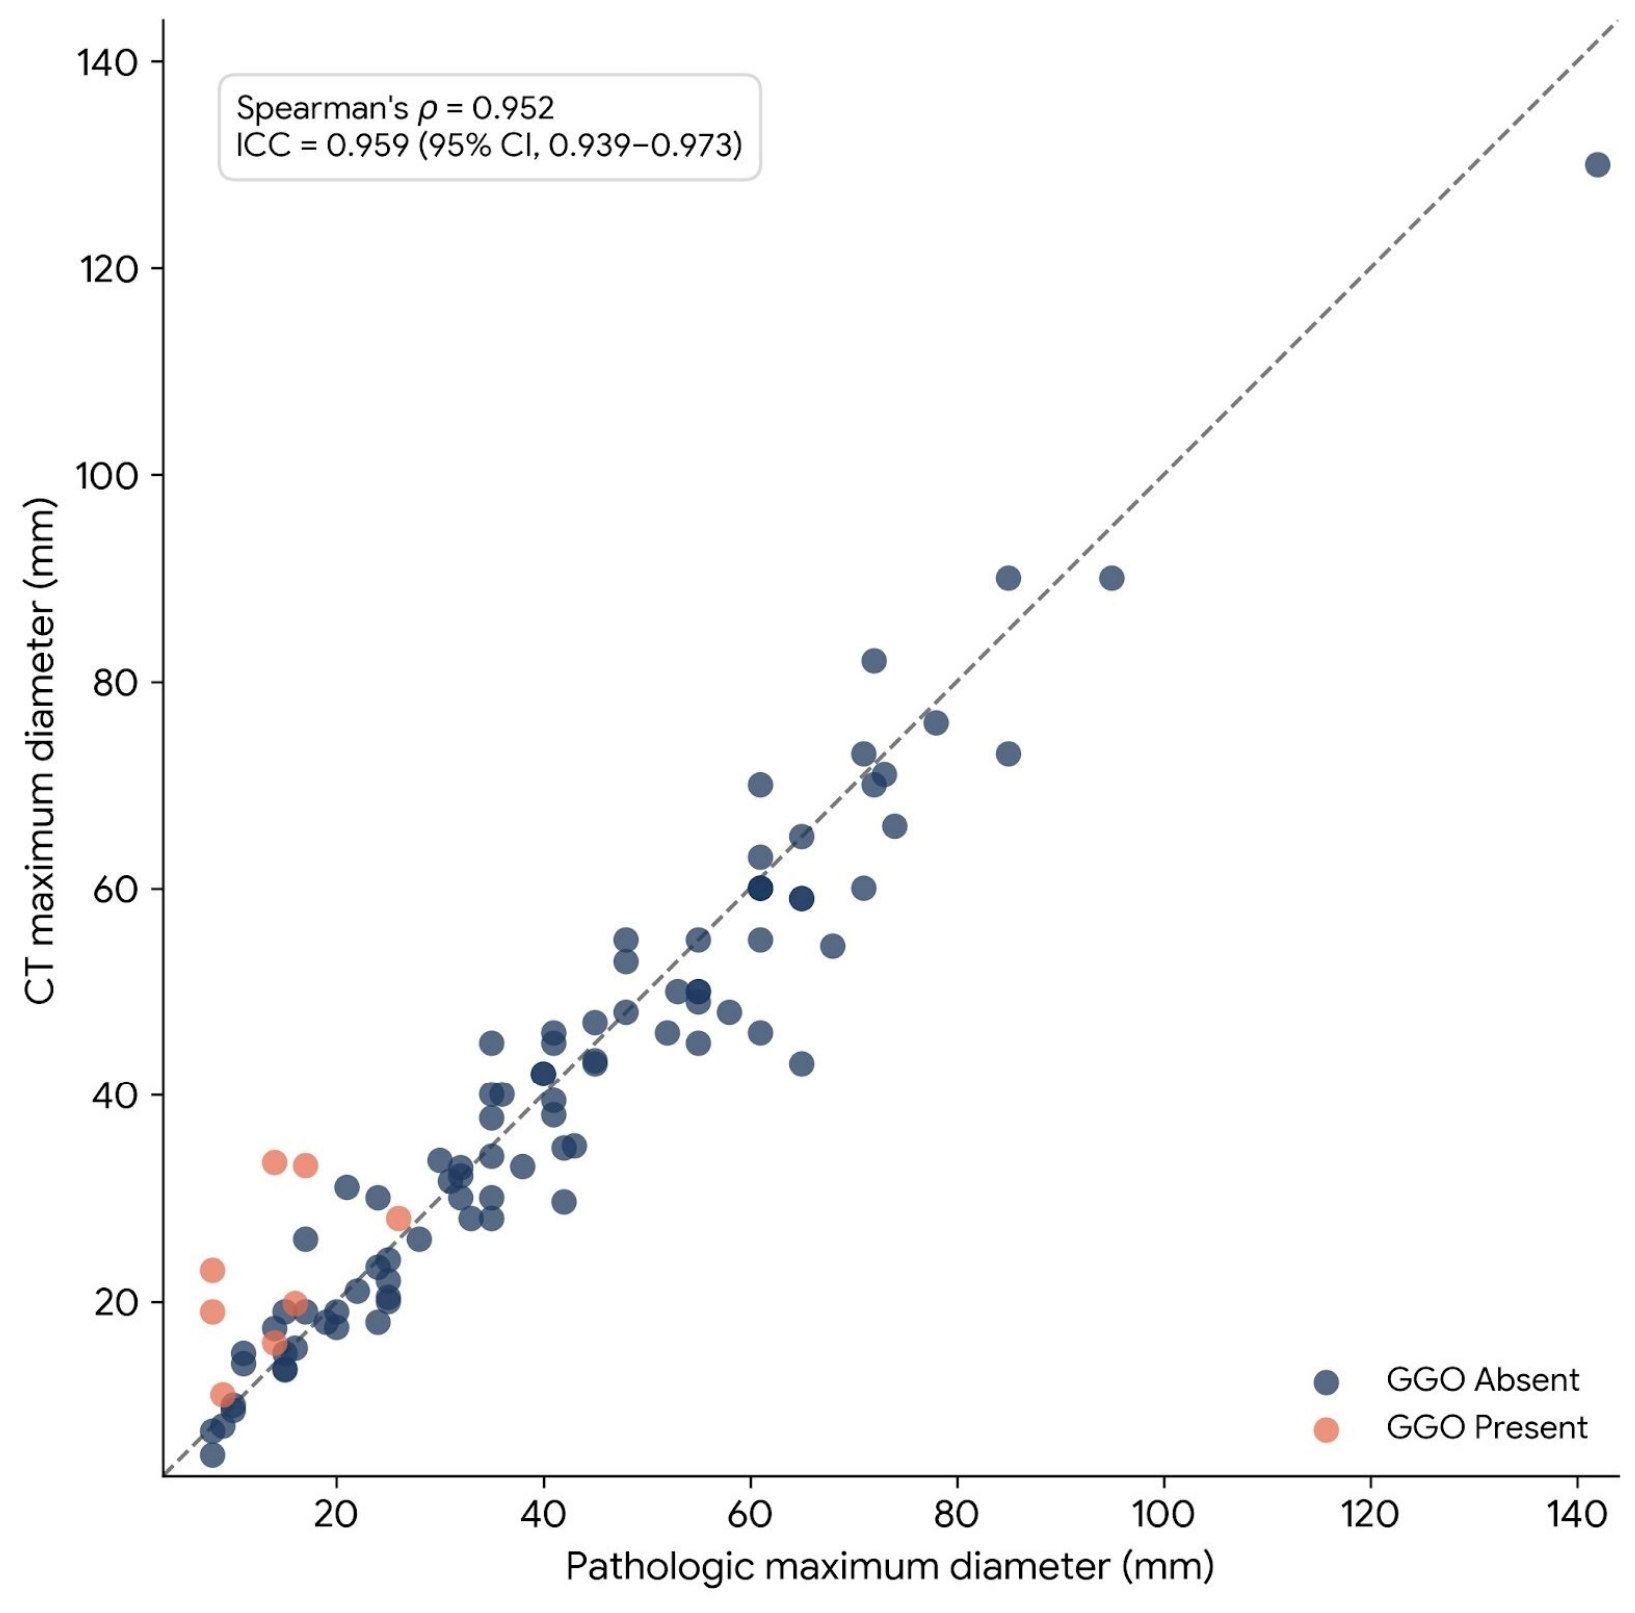
3.2. Correlation and Reliability
3.3. Secondary Volumetric Analysis
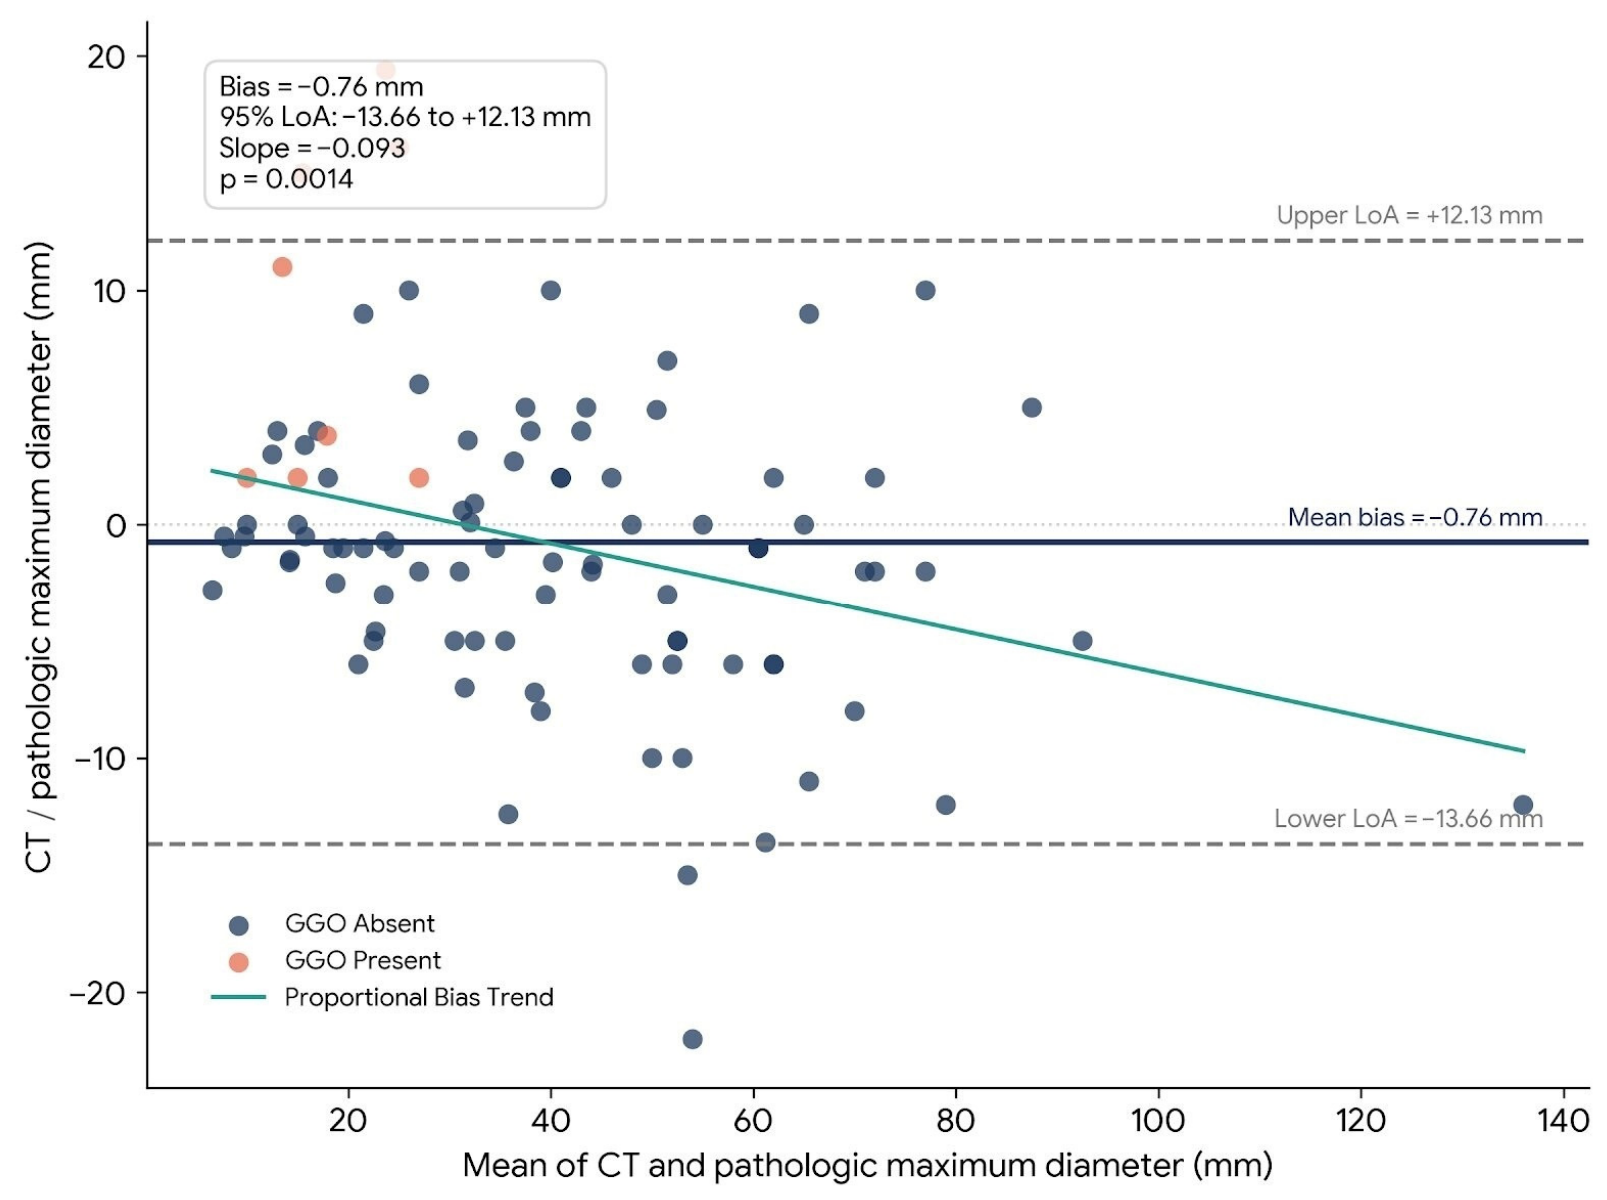
3.4. Paired Comparison and Agreement Analysis
3.5. Proportional Bias
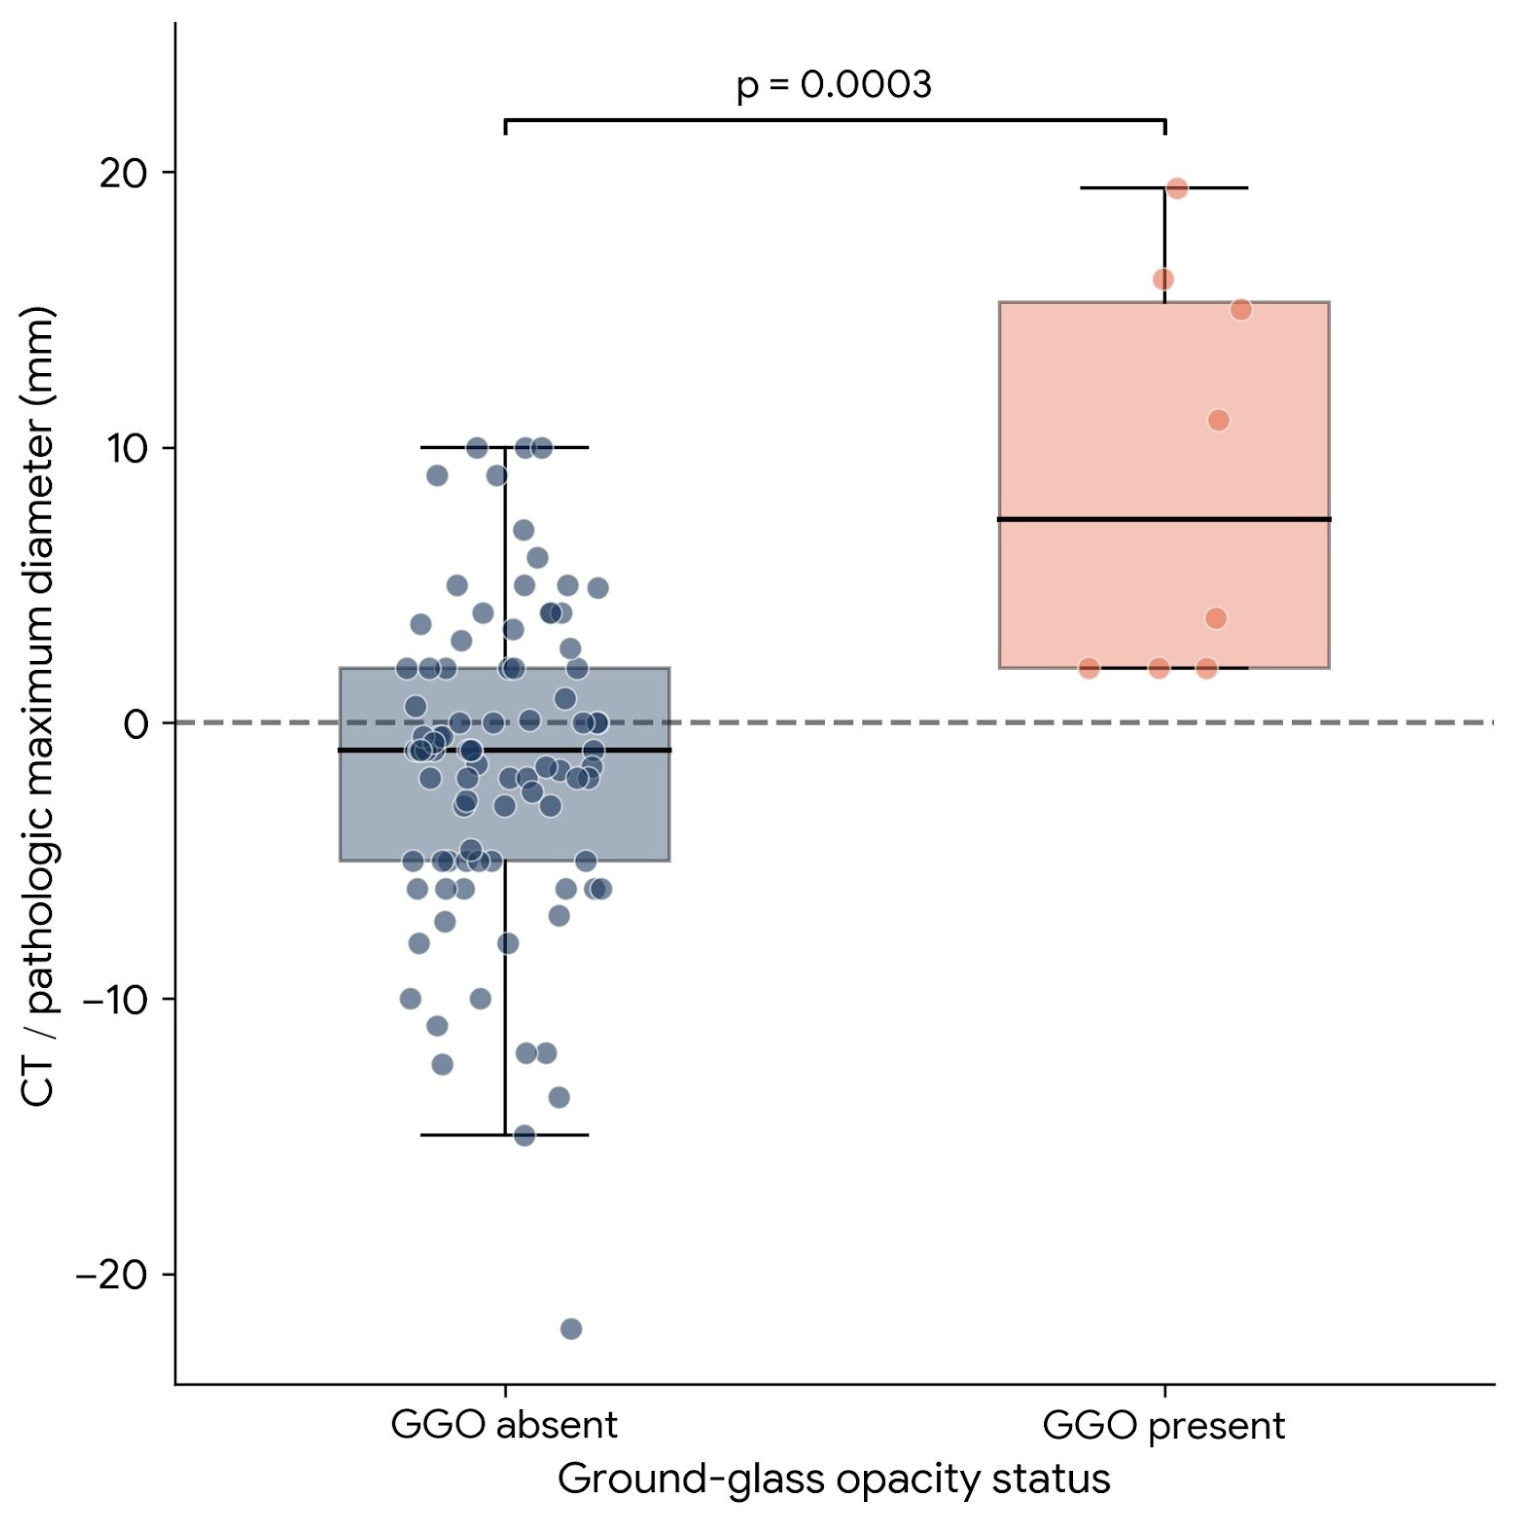
3.6. GGO Subgroup Analysis
3.7. Tumor Size and Absolute Error
3.8. Clinical Accuracy
3.9. Size-Based T-Category Concordance Analysis
4. Discussion
5. Conclusions
Author Contributions
Funding
Institutional Review Board Statement
Informed Consent Statement
Data Availability Statement
Acknowledgments
Conflicts of Interest
Abbreviations
| CT | Computed tomography |
| GGO | Ground-glass opacity |
| ICC | Intraclass correlation coefficient |
| LoA | Limits of agreement |
| SD | Standard deviation |
| IQR | Interquartile range |
| CI | Confidence interval |
| TNM | Tumor, node, metastasis |
References
- Rami-Porta, R.; Bolejack, V.; Crowley, J.; Ball, D.; Kim, J.; Lyons, G.; Rice, T.; Suzuki, K.; Thomas, C.F.; Travis, W.D.; et al. The IASLC lung cancer staging project: Proposals for the revisions of the T descriptors in the forthcoming eighth edition of the TNM classification for lung cancer. J. Thorac. Oncol. 2015, 10, 990–1003. [Google Scholar] [CrossRef] [Scilit]
- Detterbeck, F.C.; Woodard, G.A.; Bader, A.S.; Dacic, S.; Grant, M.J.; Park, H.S.; Tanoue, L.T. The proposed ninth edition TNM classification of lung cancer. Chest 2024, 166, 882–895. [Google Scholar] [CrossRef] [Scilit]
- Isaka, T.; Yokose, T.; Ito, H.; Imamura, N.; Watanabe, M.; Imai, K.; Nishii, T.; Woo, T.; Yamada, K.; Nakayama, H.; et al. Comparison between CT tumor size and pathological tumor size in frozen section examinations of lung adenocarcinoma. Lung Cancer 2014, 85, 40–46. [Google Scholar] [CrossRef] [Scilit] [PubMed]
- Nagano, T.; Takamori, S.; Hashinokuchi, A.; Matsydo, K.; Kohno, M.; Miura, N.; Takenaka, T.; Kamitani, T.; Shimokawa, M.; Ishigami, K.; et al. Comparison of radiological and pathological tumor sizes in resected non-small cell lung cancer. Gen. Thorac. Cardiovasc. Surg. 2023, 71, 708–714. [Google Scholar] [CrossRef] [Scilit]
- Bland, J.M.; Altman, D.G. Statistical methods for assessing agreement between two methods of clinical measurement. Lancet 1986, 1, 307–310. [Google Scholar] [CrossRef] [Scilit] [PubMed]
- Giavarina, D. Understanding Bland Altman analysis. Biochem. Medica 2015, 25, 141–151. [Google Scholar] [CrossRef] [Scilit]
- Erasmus, L.T.; Strange, T.A.; Agrawal, R.; Strange, C.D.; Ahuja, J.; Shroff, G.S.; Truong, M.T. Lung cancer staging: Imaging and potential pitfalls. Diagnostics 2023, 13, 3359. [Google Scholar] [CrossRef] [Scilit]
- McGraw, K.O.; Wong, S.P. Forming inferences about some intraclass correlation coefficients. Psychol. Methods 1996, 1, 30–46, Correction in Psychol. Methods 2001, 6, 390. [Google Scholar] [CrossRef]
- Koo, T.K.; Li, M.Y. A guideline of selecting and reporting intraclass correlation coefficients for reliability research. J. Chiropr. Med. 2016, 15, 155–163, Correction in J. Chiropr. Med. 2017, 16, 346. [Google Scholar] [CrossRef] [Scilit]
- Kamigaichi, A.; Tsutani, Y.; Mimae, T.; Miyata, Y.; Adachi, H.; Shimada, Y.; Takeshima, Y.; Ito, H.; Ikeda, N.; Okada, M. Discrepancy between radiological and pathological tumor size in early-stage non-small cell lung cancer: A multicenter study. Semin. Thorac. Cardiovasc. Surg. 2024, 36, 273–281. [Google Scholar] [CrossRef] [Scilit]
- Lampen-Sachar, K.; Zhao, B.; Zheng, J.; Moskowitz, C.S.; Schwartz, L.H.; Zakowski, M.F.; Rizvi, N.A.; Kris, M.G.; Ginsberg, M.S. Correlation between tumor measurement on computed tomography and resected specimen size in lung adenocarcinomas. Lung Cancer 2012, 75, 332–335. [Google Scholar] [CrossRef] [Scilit]
- Anderson, K.R.; Heidinger, B.H.; Chen, Y.; Bankier, A.A.; VanderLaan, P.A. Measurement bias of gross pathologic compared with radiologic tumor size of resected lung adenocarcinomas. Am. J. Clin. Pathol. 2017, 147, 641–648. [Google Scholar] [CrossRef] [Scilit]
- Hsu, P.K.; Huang, H.C.; Hsieh, C.C.; Hsu, H.S.; Wu, Y.C.; Huang, M.H.; Hsu, W.-H. Effect of formalin fixation on tumor size determination in stage I non-small cell lung cancer. Ann. Thorac. Surg. 2007, 84, 1825–1829. [Google Scholar] [CrossRef] [Scilit] [PubMed]
- Aokage, K.; Miyoshi, T.; Ishii, G.; Kusumoto, M.; Nomura, S.; Katsumata, S.; Sekihara, K.; Hishida, T.; Tsuboi, M. Clinical and pathological staging validation in the eighth edition of the TNM classification for lung cancer: Correlation between solid size on thin-section computed tomography and invasive size in pathological findings in the new T classification. J. Thorac. Oncol. 2017, 12, 1403–1412. [Google Scholar] [CrossRef] [Scilit]
- Heidinger, B.H.; Anderson, K.R.; Moriarty, E.M.; Costa, D.B.; Gangadharan, S.P.; VanderLaan, P.A.; Bankier, A.A. Size measurement and T-staging of lung adenocarcinomas manifesting as solid nodules ≤30 mm on CT. Acad. Radiol. 2017, 24, 851–859. [Google Scholar] [CrossRef] [Scilit]
- Lee, K.H.; Goo, J.M.; Park, S.J.; Wi, J.Y.; Chung, D.H.; Go, H.; Park, H.S.; Park, C.M.; Lee, S.M. Correlation between the size of the solid component on thin-section CT and the invasive component on pathology in small lung adenocarcinomas manifesting as ground-glass nodules. J. Thorac. Oncol. 2014, 9, 74–82. [Google Scholar] [CrossRef] [Scilit]
- Yanagawa, M.; Kusumoto, M.; Johkoh, T.; Noguchi, M.; Minami, Y.; Sakai, F.; Asamura, H.; Tomiyama, N.; Awai, K.; Minami, M.; et al. Radiologic-pathologic correlation of solid portions on thin-section CT images in lung adenocarcinoma: A multicenter study. Clin. Lung Cancer 2018, 19, e303–e312. [Google Scholar] [CrossRef] [Scilit] [PubMed]
- Ye, T.; Shen, X.; Wang, S.; Wu, H.; Wang, Y.; Hu, H.; Zhang, Y.; Huang, Q.; Wang, Z.; Gu, Y.; et al. Study of the radiologic and pathologic correlations for subsolid lung adenocarcinoma with the application of whole-mount sections (ECTOP1011). Transl. Lung Cancer Res. 2025, 14, 341–352. [Google Scholar] [CrossRef] [Scilit]
- Heidinger, B.H.; Anderson, K.R.; Nemec, U.; Costa, D.B.; Gangadharan, S.P.; VanderLaan, P.A.; Bankier, A.A. Lung adenocarcinoma manifesting as pure ground-glass nodules: Correlating CT size, volume, density, and roundness with histopathologic invasion and size. J. Thorac. Oncol. 2017, 12, 1288–1298. [Google Scholar] [CrossRef] [Scilit] [PubMed]
- Sayan, M.; Kankoc, A.; Aslan, M.T.; Akarsu, I.; Kurul, İ.C.; Celik, A. Recommendation for clinical T staging in patients with non-small cell lung cancer: Volumetric measurement: A retrospective study from Turkey. J. Chest Surg. 2025, 58, 51–57. [Google Scholar] [CrossRef] [Scilit]
- Süer, H.; Erus, S.; Cesur, E.E.; Yavuz, Ö.; Ağcaoğlu, O.; Bulutay, P.; Önder, T.T.; Tanju, S.; Dilege, Ş. Combination of CEACAM5, EpCAM and CK19 gene expressions in mediastinal lymph node micrometastasis is a prognostic factor for non-small cell lung cancer. J. Cardiothorac. Surg. 2023, 18, 189. [Google Scholar] [CrossRef] [Scilit] [PubMed]
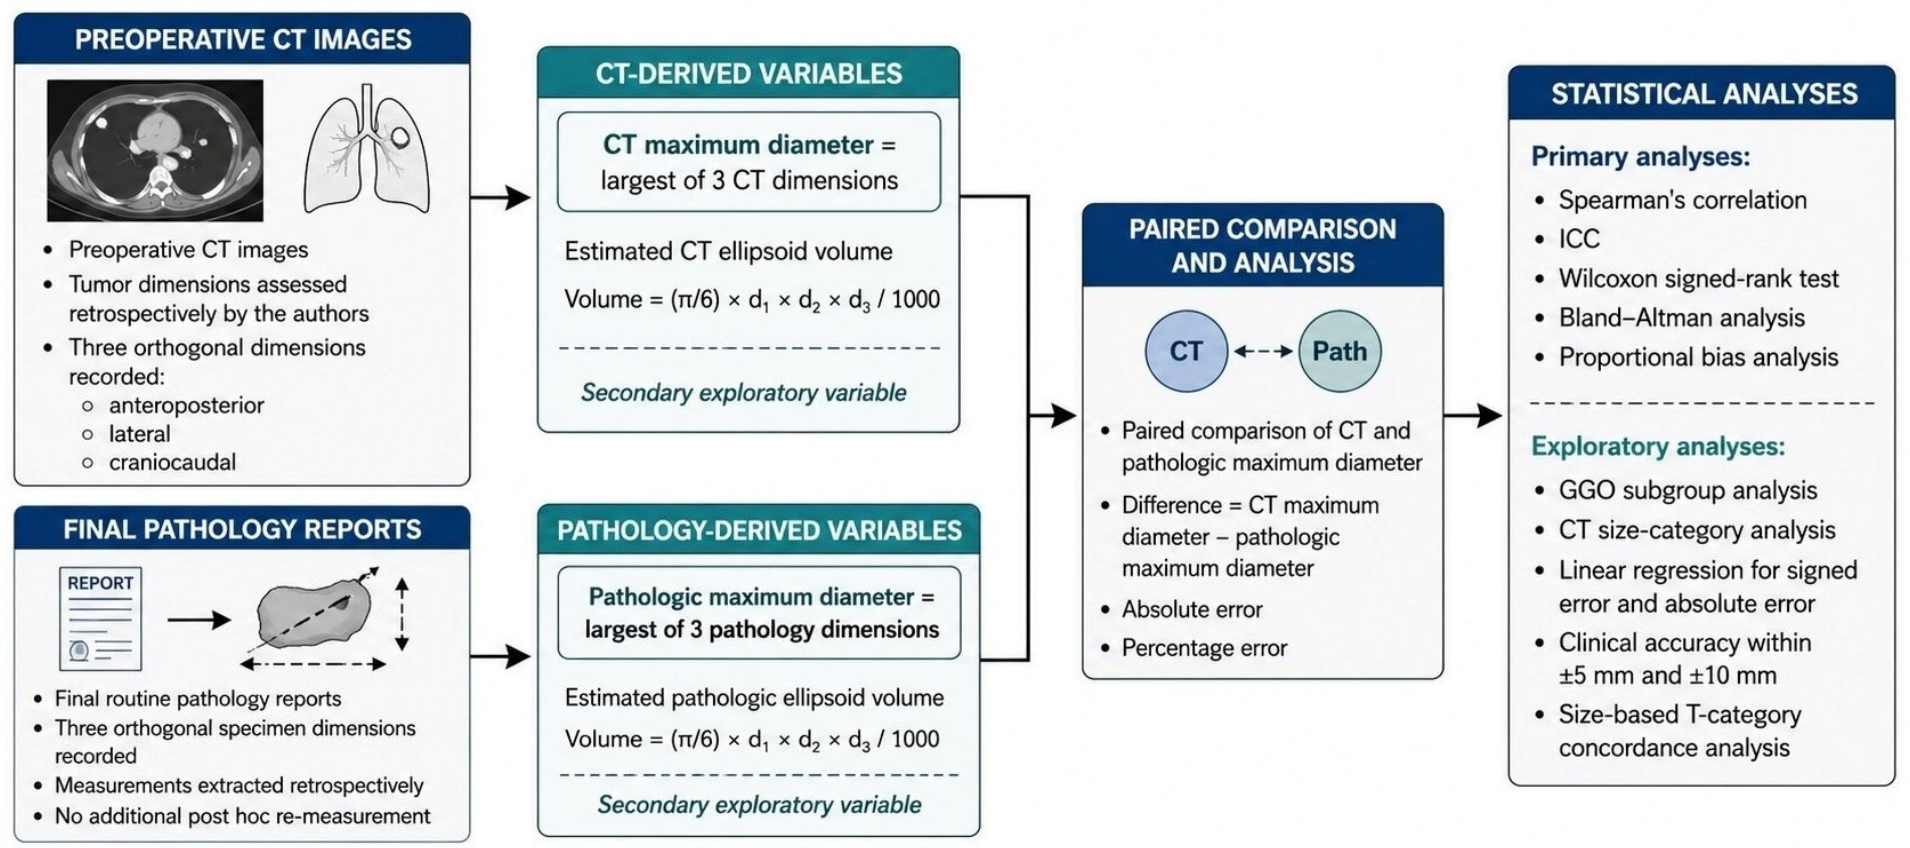



| Variable | n | Mean ± SD | Median (IQR) | Min | Max |
|---|---|---|---|---|---|
| CT maximum diameter, mm | 96 | 39.24 ± 21.94 | 34.90 (20.85–50.73) | 5.2 | 130.0 |
| Pathologic maximum diameter, mm | 96 | 40.00 ± 24.03 | 35.50 (20.00–55.75) | 8.0 | 142.0 |
| Estimated CT volume, cm3 | 96 | 36.01 ± 55.42 | 13.84 (2.57–45.58) | 0.06 | 259.4 |
| Estimated pathologic volume, cm3 | 96 | 35.89 ± 54.96 | 10.52 (1.88–50.43) | 0.05 | 267.7 |
| CT pathology difference, mm | 96 | −0.76 ± 6.58 | −1.00 (−5.00 to 2.18) | −22.0 | 19.4 |
| Absolute error, mm | 96 | 4.82 ± 4.52 | 3.50 (1.68–6.00) | 0.0 | 22.0 |
| Percentage error, % | 96 | 4.68 ± 32.99 | −2.89 (−10.70 to 9.87) | −35.0 | 187.5 |
| Categorical variables | |||||
| Variable | Value | ||||
| GGO absent, n (%) | 88 (91.7) | ||||
| GGO present, n (%) | 8 (8.3) |
| Outcome | Metric | Value |
|---|---|---|
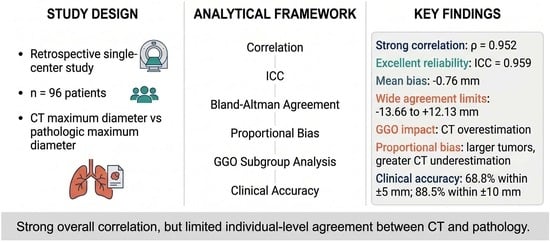
| Primary diameter analysis | Spearman’s ρ | 0.952 |
| ICC (95% CI) | 0.959 (0.939–0.973) | |
| Wilcoxon signed-rank p value | 0.175 | |
| Mean bias, mm | −0.76 | |
| SD of differences, mm | 6.58 | |
| Lower 95% limit of agreement, mm | −13.66 | |
| Upper 95% limit of agreement, mm | 12.13 | |
| Width of limits of agreement, mm | 25.79 | |
| Proportional bias slope | −0.093 | |
| Correlation between difference and mean, r | −0.321 | |
| Proportional bias p value | 0.0014 | |
| Accuracy within ±5 mm, n (%) | 66/96 (68.8) | |
| Accuracy within ±10 mm, n (%) | 85/96 (88.5) | |
| Secondary exploratory volume analysis | Spearman’s ρ | 0.968 |
| ICC (95% CI) | 0.971 (0.957–0.981) |
| (A) | ||||
| Variable | GGO Absent (n = 88) | GGO Present (n = 8) | p Value | |
| CT pathology difference, mean ± SD, mm | −1.64 ± 5.80 | 8.91 ± 7.30 | 0.0003 | |
| CT pathology difference, median, mm | −1.00 | 7.40 | 0.0003 | |
| Absolute error, mean ± SD, mm | 4.44 ± 4.04 | 8.91 ± 7.30 | 0.087 | |
| Accuracy within ±5 mm, n (%) | 62/88 (70.5) | 4/8 (50.0) | — | |
| Accuracy within ±10 mm, n (%) | 81/88 (92.0) | 4/8 (50.0) | — | |
| (B) | ||||
| CT maximum diameter category | n | CT pathology difference, mean ± SD, mm | Median difference, mm | Absolute error, mean ± SD, mm |
| ≤20 mm | 23 | 0.49 ± 3.56 | −0.50 | 2.57 ± 2.84 |
| 20–50 mm | 49 | −0.73 ± 7.59 | −1.00 | 5.60 ± 5.17 |
| >50 mm | 24 | −2.03 ± 6.57 | −1.50 | 5.35 ± 4.46 |
| Comparison | Statistic | p value | ||
| Difference across size categories | Kruskal–Wallis H = 2.57 | 0.276 | ||
| Absolute error across size categories | Kruskal–Wallis H = 8.58 | 0.014 | ||
| (C) | ||||
| Model | Predictor | β coefficient | p value | |
| Signed error model | CT maximum diameter | −0.026 | 0.362 | |
| GGO present | 10.091 | <0.0001 | ||
| Absolute error model | CT maximum diameter | 0.065 | 0.002 | |
| GGO present | 5.625 | 0.001 | ||
| Outcome | n (%) |
|---|---|
| Concordant size-based T-category | 60 (62.5%) |
| Pathology-based upstaging | 23 (24.0%) |
| Pathology-based downstaging | 13 (13.5%) |
| Total | 96 (100.0%) |
Disclaimer/Publisher’s Note: The statements, opinions and data contained in all publications are solely those of the individual author(s) and contributor(s) and not of MDPI and/or the editor(s). MDPI and/or the editor(s) disclaim responsibility for any injury to people or property resulting from any ideas, methods, instructions or products referred to in the content. |
© 2026 by the authors. Licensee MDPI, Basel, Switzerland. This article is an open access article distributed under the terms and conditions of the Creative Commons Attribution (CC BY) license.
Share and Cite
Yavuz, O.; Ertan, R.; Kertmen, M.; Iscan, M. Computed Tomography Versus Pathologic Tumor Size in Resected Lung Tumors: High Correlation, Limited Agreement, and the Impact of Ground-Glass Opacity. Tomography 2026, 12, 67. https://doi.org/10.3390/tomography12050067
Yavuz O, Ertan R, Kertmen M, Iscan M. Computed Tomography Versus Pathologic Tumor Size in Resected Lung Tumors: High Correlation, Limited Agreement, and the Impact of Ground-Glass Opacity. Tomography. 2026; 12(5):67. https://doi.org/10.3390/tomography12050067
Chicago/Turabian StyleYavuz, Omer, Reyhan Ertan, Muhammet Kertmen, and Mehlika Iscan. 2026. "Computed Tomography Versus Pathologic Tumor Size in Resected Lung Tumors: High Correlation, Limited Agreement, and the Impact of Ground-Glass Opacity" Tomography 12, no. 5: 67. https://doi.org/10.3390/tomography12050067
APA StyleYavuz, O., Ertan, R., Kertmen, M., & Iscan, M. (2026). Computed Tomography Versus Pathologic Tumor Size in Resected Lung Tumors: High Correlation, Limited Agreement, and the Impact of Ground-Glass Opacity. Tomography, 12(5), 67. https://doi.org/10.3390/tomography12050067