
Musculoskeletal Pitfalls on Molecular Imaging Studies of Oncologic Patients: How to Stay Out of Trouble

 ,
, 
Abstract
1. Introduction
2. Bone
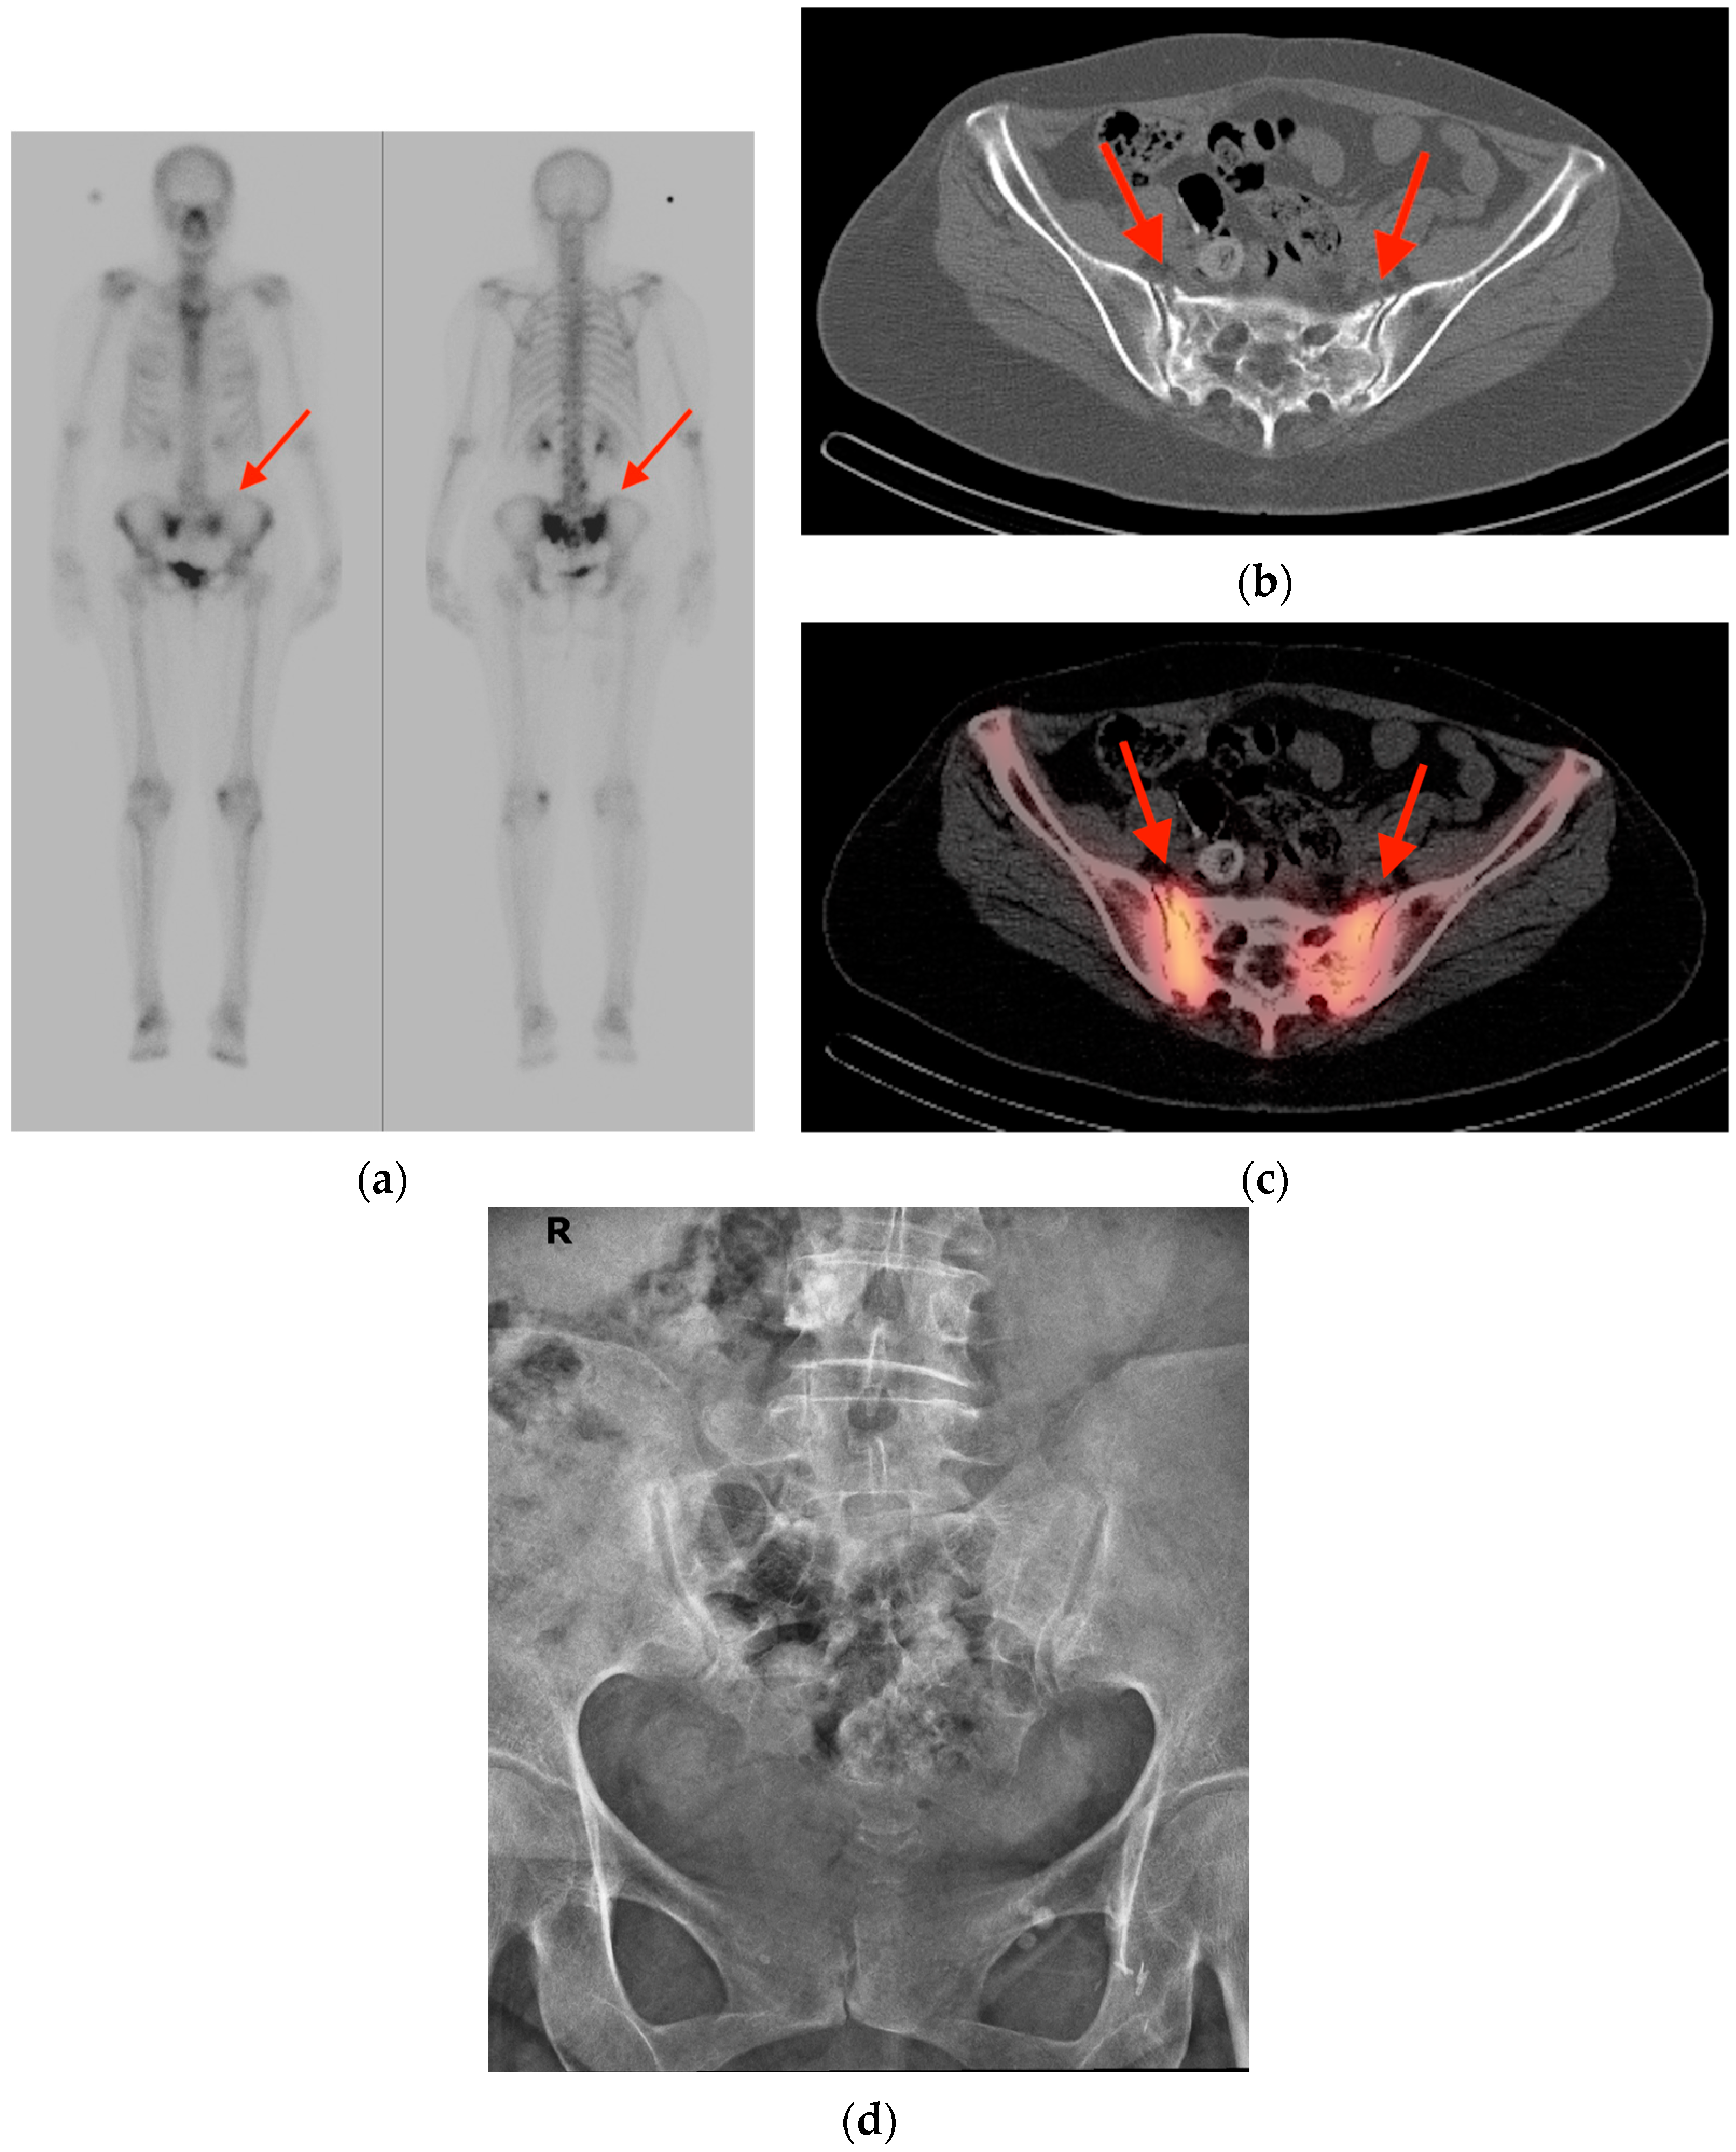
2.1. Fracture
2.2. Fibrous Dysplasia
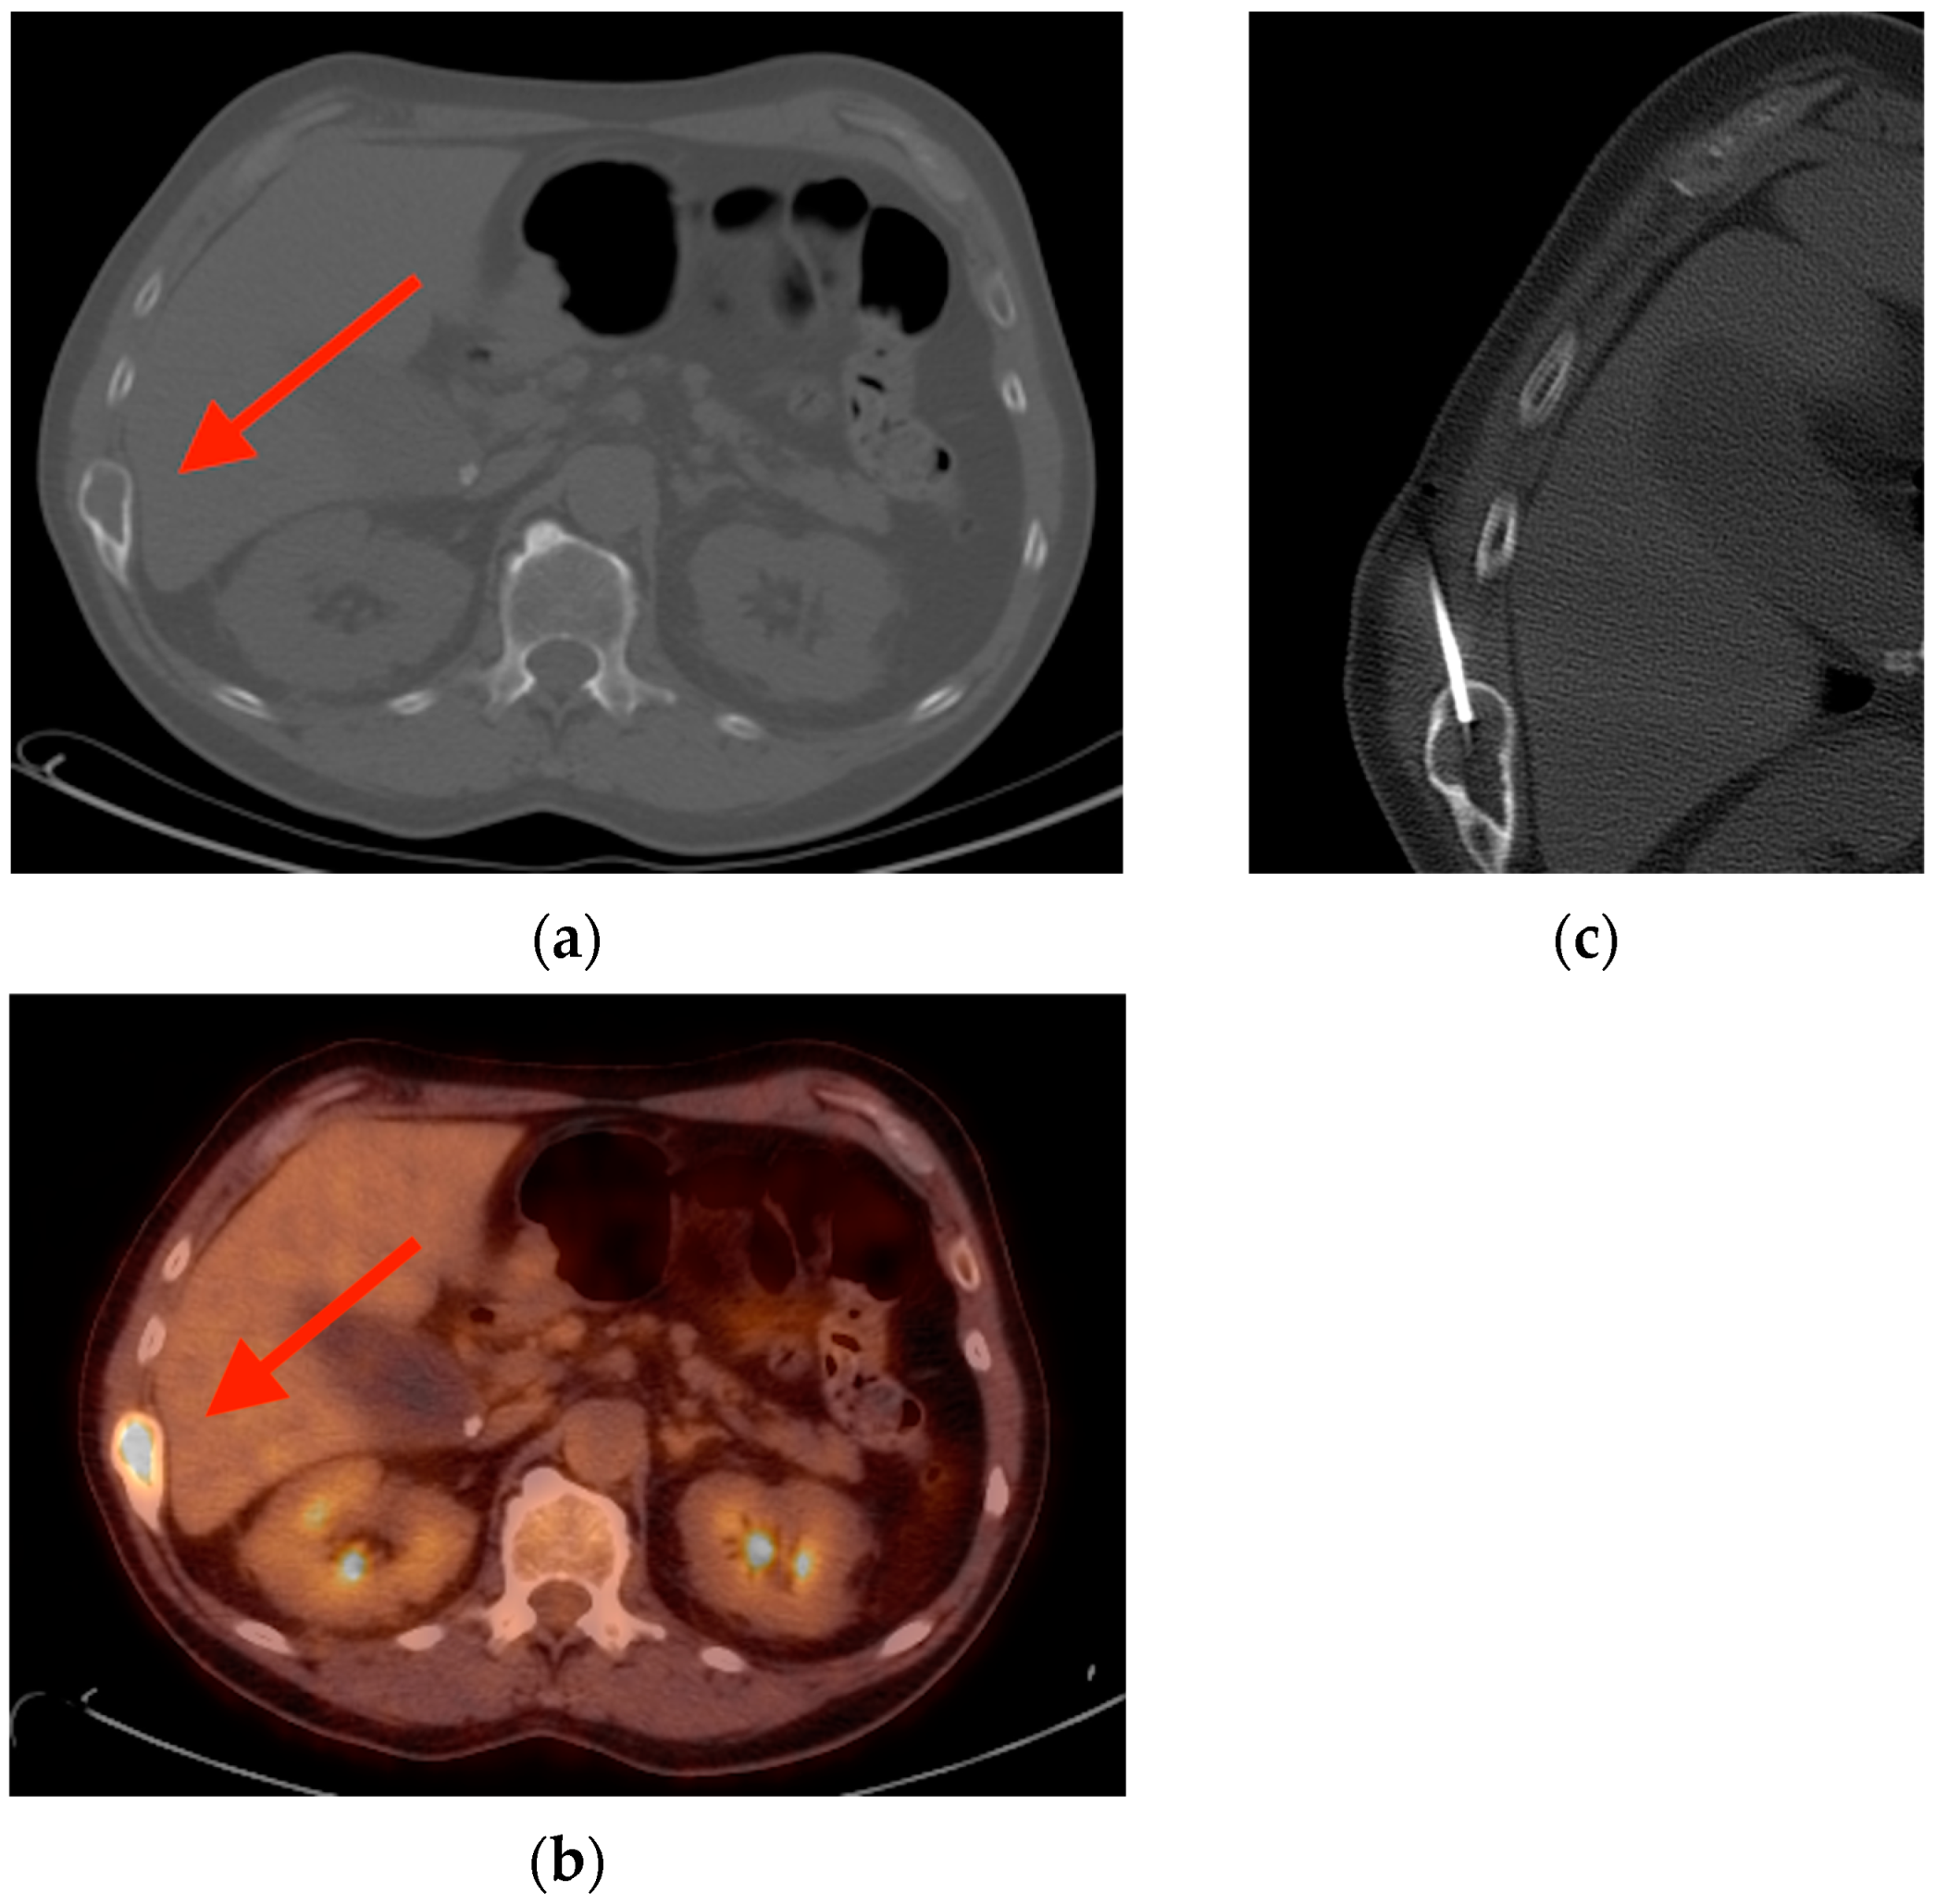
2.3. Enchondroma
2.4. Schmorl’s Node
2.5. Vertebral Hemangioma
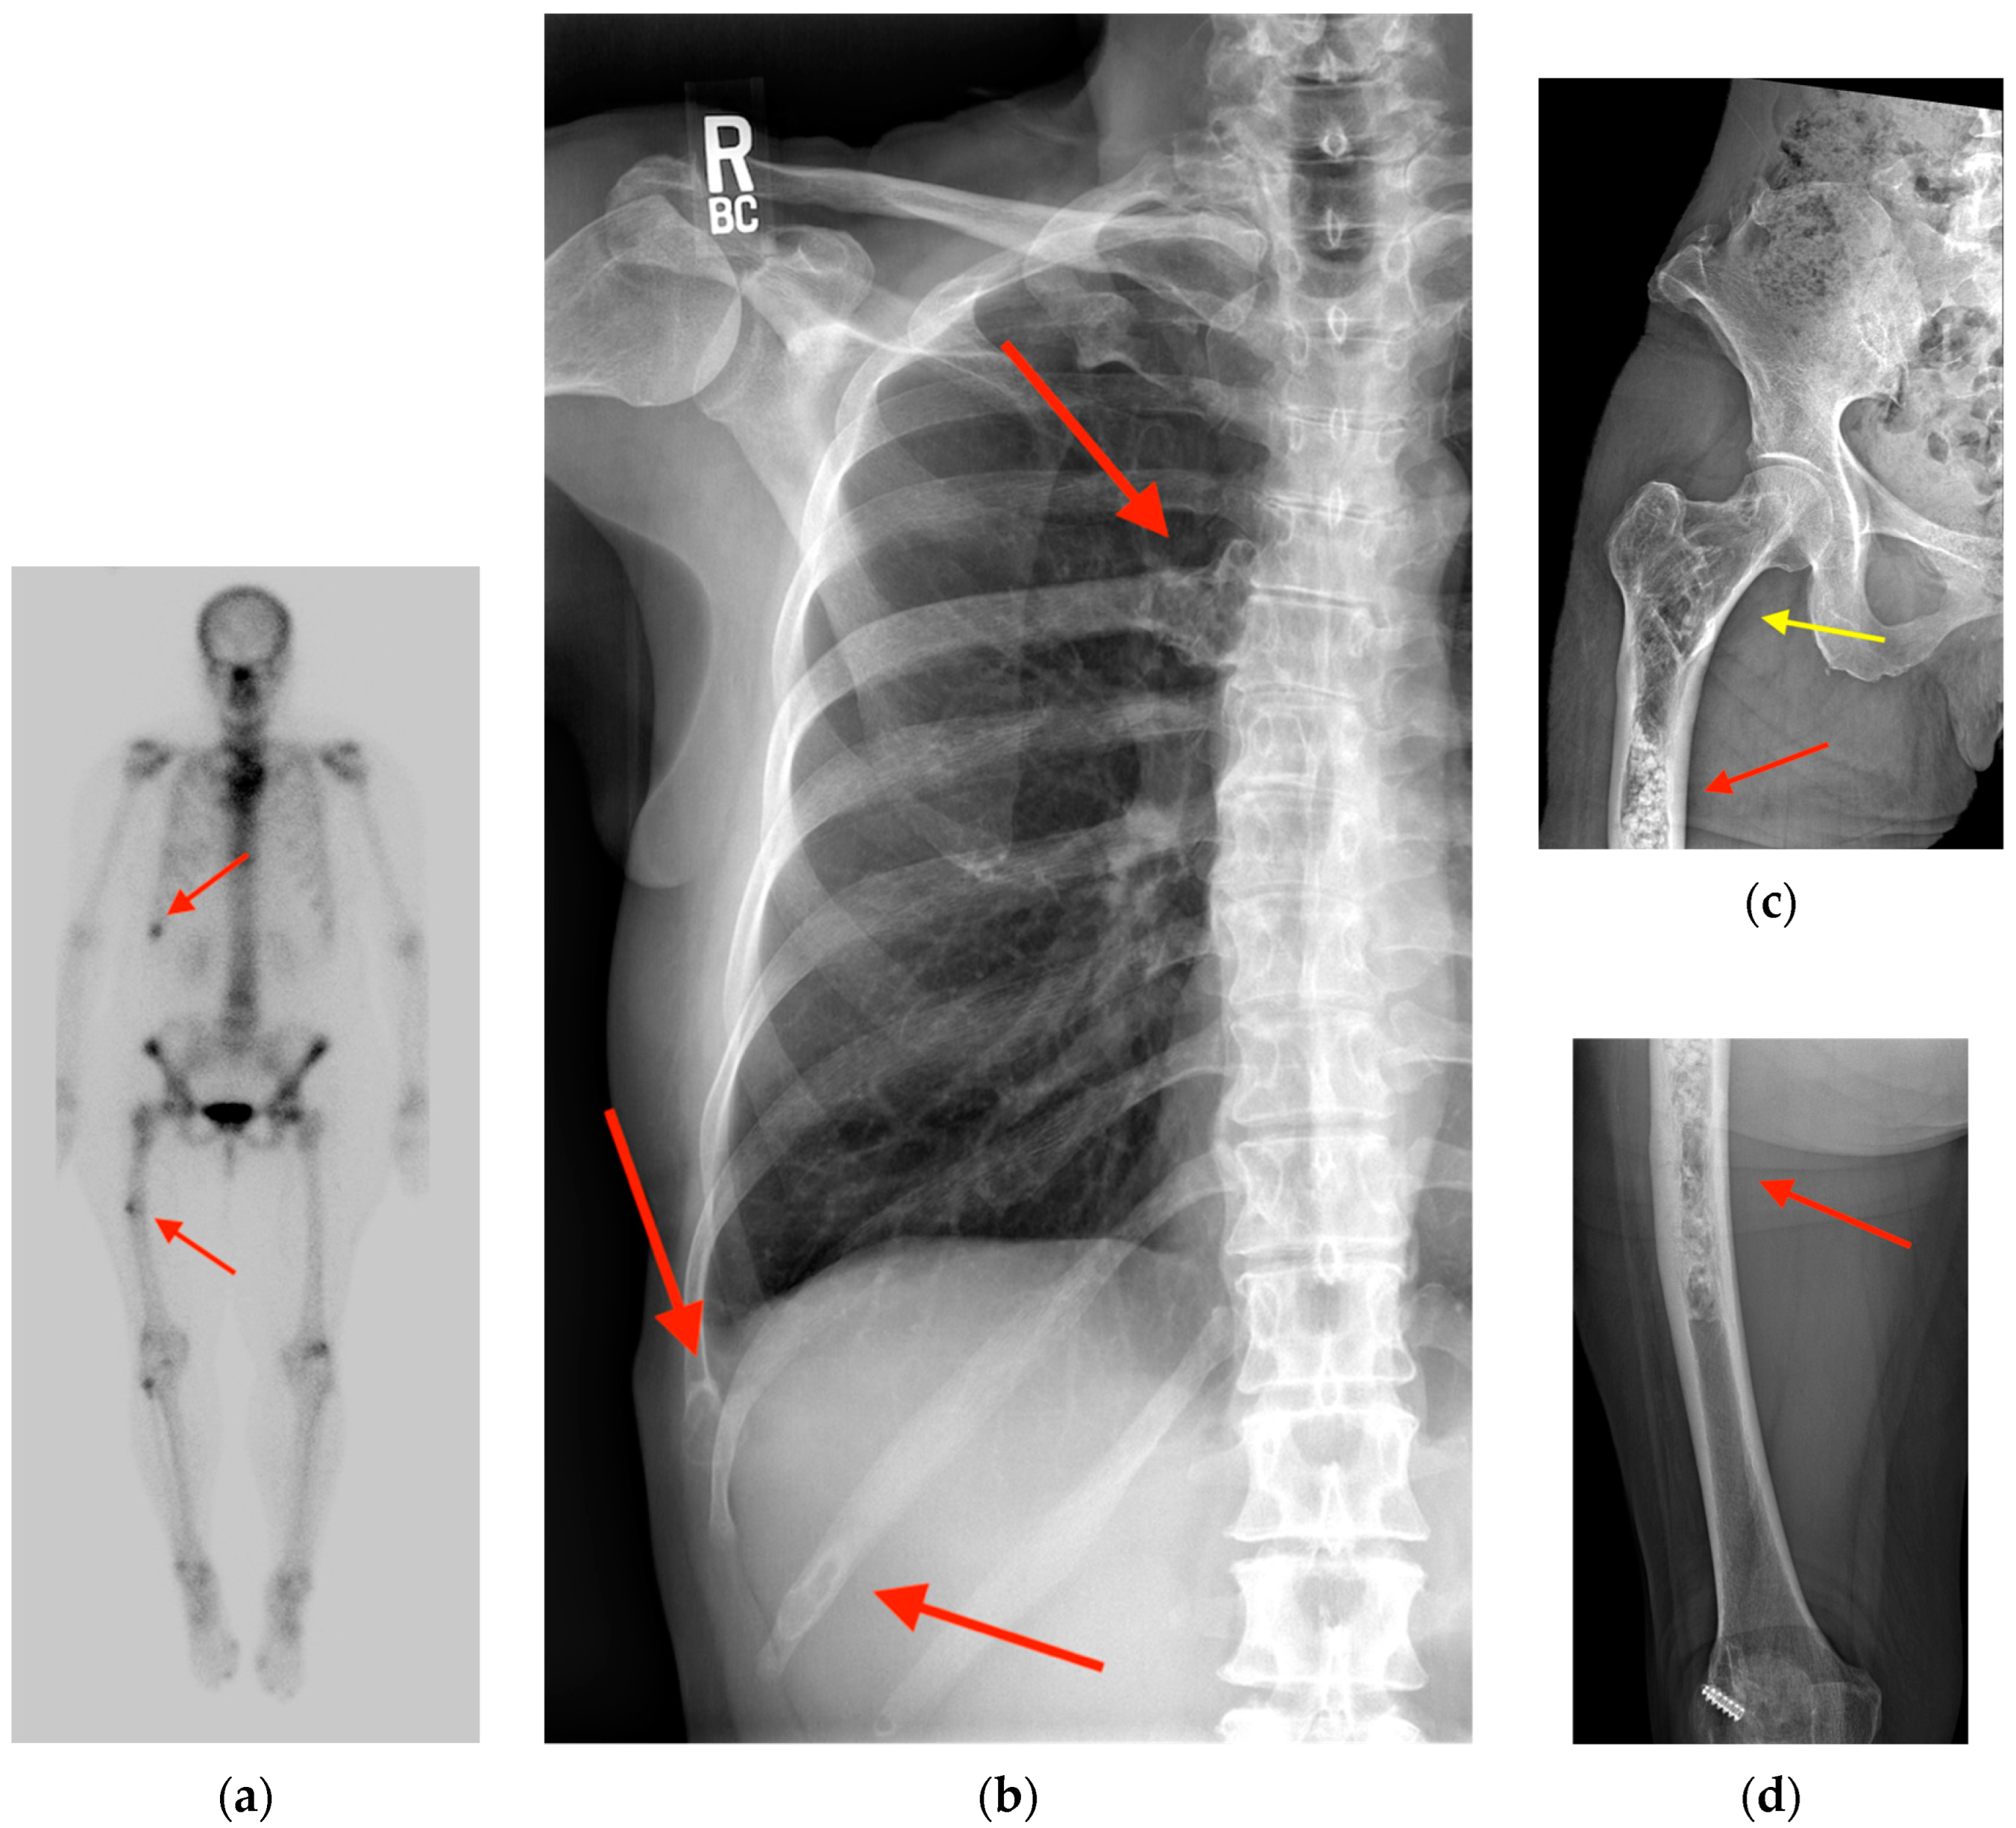
2.6. Paget’s Disease
3. Muscle and Tendon
3.1. Enthesopathy
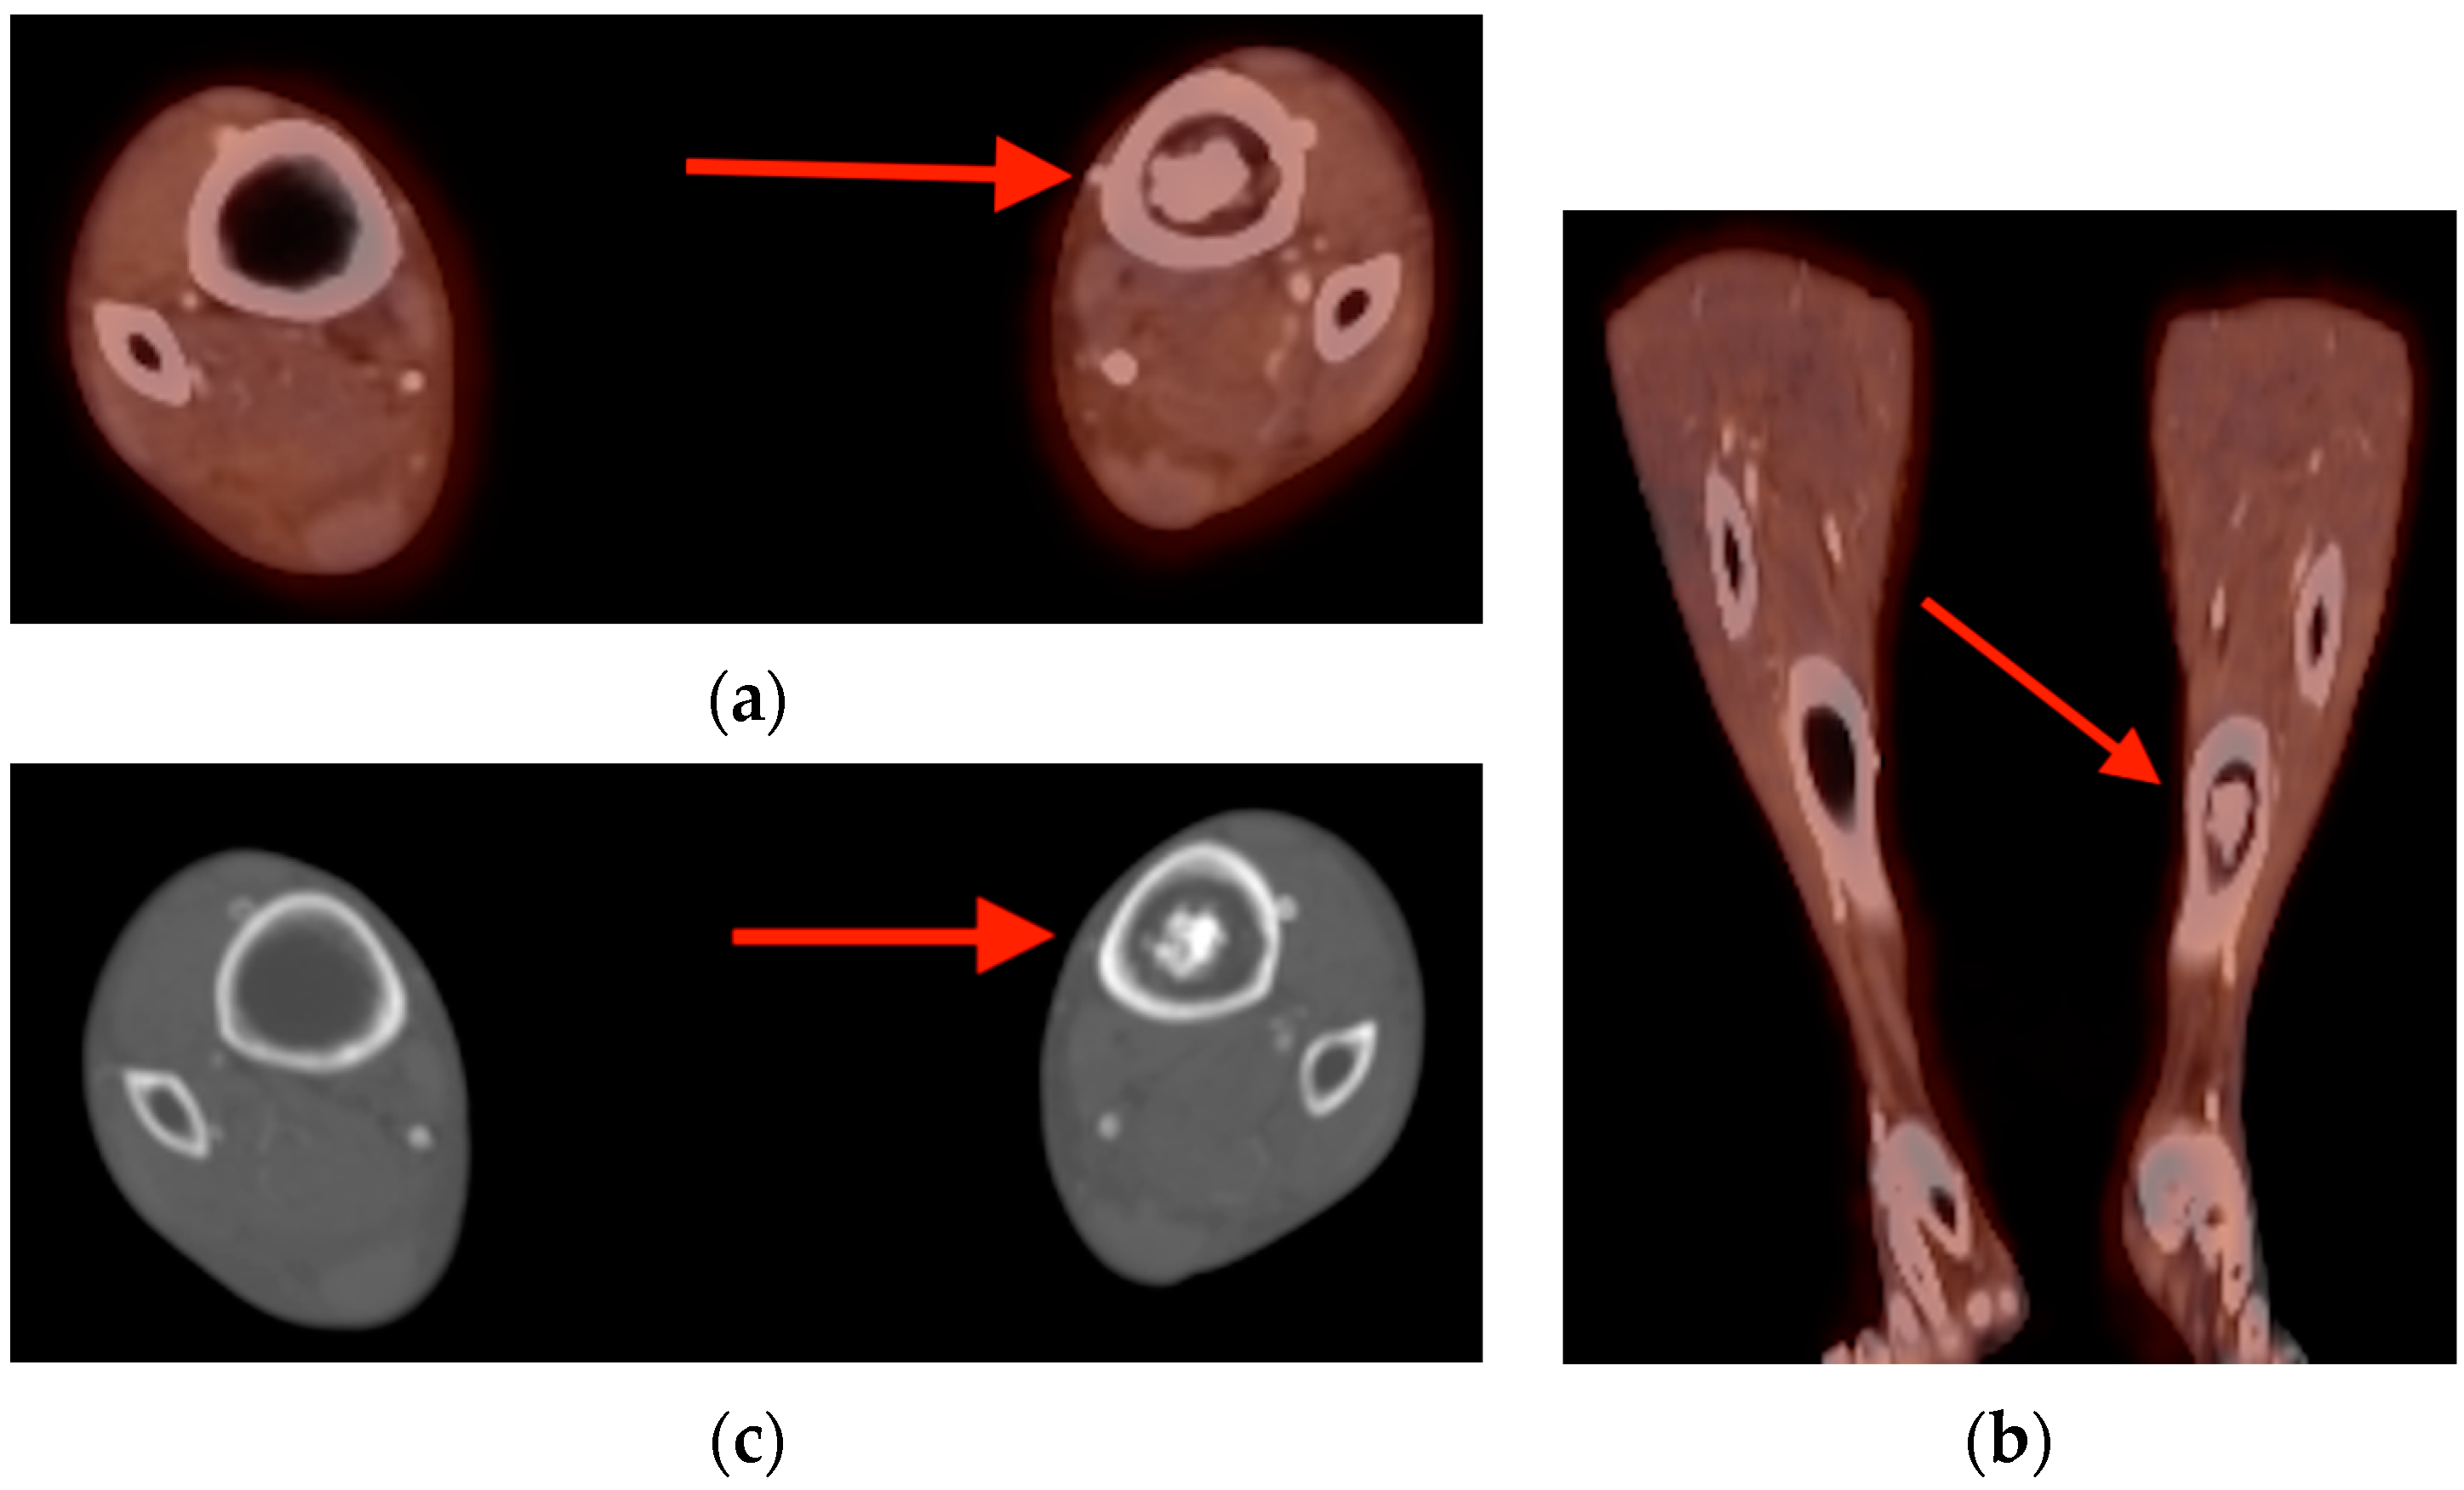
3.2. Myositis Ossificans
3.3. Calcific Tendinopathy
4. Joint
4.1. Tenosynovial Giant Cell Tumor/Pigmented Villonodular Synovitis
4.2. Adhesive Capsulitis
4.3. Acute Calcific Discitis
5. Soft Tissue
5.1. Fat Necrosis
5.2. Brown Fat Activation
5.3. Hibernoma
6. Conclusions
Author Contributions
Funding
Institutional Review Board Statement
Conflicts of Interest
References
- Miller, K.D.; Nogueira, L.; Devasia, T.; Mariotto, A.B.; Yabroff, K.R.; Jemal, A.; Kramer, J.; Siegel, R.L. Cancer treatment and survivorship statistics, 2022. CA Cancer J. Clin. 2022, 72, 409–436. [Google Scholar] [CrossRef]
- Tan, H.; Gu, Y.; Yu, H.; Hu, P.; Zhang, Y.; Mao, W.; Shi, H. Total-Body PET/CT: Current Applications and Future Perspectives. AJR Am. J. Roentgenol. 2020, 215, 325–337. [Google Scholar] [CrossRef]
- Edwards, B.J.; Sun, M.; Zhang, X.; Holmes, H.M.; Song, J.; Khalil, P.; Karuturi, M.; Shah, J.B.; Dinney, C.P.; Gagel, R.F.; et al. Fractures frequently occur in older cancer patients: The MD Anderson Cancer Center experience. Support. Care Cancer 2018, 26, 1561–1568. [Google Scholar] [CrossRef]
- Oh, D.; Huh, S.J. Insufficiency fracture after radiation therapy. Radiat. Oncol. J. 2014, 32, 213–220. [Google Scholar] [CrossRef]
- Chung, Y.K.; Lee, Y.K.; Yoon, B.H.; Suh, D.H.; Koo, K.H. Pelvic Insufficiency Fractures in Cervical Cancer After Radiation Therapy: A Meta-Analysis and Review. In Vivo 2021, 35, 1109–1115. [Google Scholar] [CrossRef]
- Blomlie, V.; Rofstad, E.K.; Talle, K.; Sundfør, K.; Winderen, M.; Lien, H.H. Incidence of radiation-induced insufficiency fractures of the female pelvis: Evaluation with MR imaging. AJR Am. J. Roentgenol. 1996, 167, 1205–1210. [Google Scholar] [CrossRef]
- Abe, H.; Nakamura, M.; Takahashi, S.; Maruoka, S.; Ogawa, Y.; Sakamoto, K. Radiation-induced insufficiency fractures of the pelvis: Evaluation with 99mTc-methylene diphosphonate scintigraphy. AJR Am. J. Roentgenol. 1992, 158, 599–602. [Google Scholar] [CrossRef]
- Matin, P. The appearance of bone scans following fractures, including immediate and long-term studies. J. Nucl. Med. 1979, 20, 1227–1231. [Google Scholar]
- Finiels, H.; Finiels, P.J.; Jacquot, J.M.; Strubel, D. Fractures du sacrum par insuffisance osseuse. Meta-analyse de 508 cas. [Fractures of the sacrum caused by bone insufficiency. Meta-analysis of 508 cases]. Presse Med. 1997, 26, 1568–1573. [Google Scholar]
- Salavati, A.; Shah, V.; Wang, Z.J.; Yeh, B.M.; Costouros, N.G.; Coakley, F.V. F-18 FDG PET/CT findings in postradiation pelvic insufficiency fracture. Clin. Imaging 2011, 35, 139–142. [Google Scholar] [CrossRef]
- Kato, K.; Aoki, J.; Endo, K. Utility of FDG-PET in differential diagnosis of benign and malignant fractures in acute to subacute phase. Ann. Nucl. Med. 2003, 17, 41–46. [Google Scholar] [CrossRef] [PubMed]
- Shin, D.S.; Shon, O.J.; Byun, S.J.; Choi, J.H.; Chun, K.A.; Cho, I.H. Differentiation between malignant and benign pathologic fractures with F-18-fluoro-2-deoxy-D-glucose positron emission tomography/computed tomography. Skelet. Radiol. 2008, 37, 415–421. [Google Scholar] [CrossRef]
- Zhong, X.; Zhang, L.; Dong, T.; Mai, H.; Lu, B.; Huang, L.; Li, J. Clinical and MRI features of sacral insufficiency fractures after radiotherapy in patients with cervical cancer. BMC Womens Health 2022, 22, 166. [Google Scholar] [CrossRef]
- Zhang, Y.; Rosenberg, A.E. Bone-Forming Tumors. Surg. Pathol. Clin. 2017, 10, 513–535. [Google Scholar] [CrossRef]
- Fitzpatrick, K.A.; Taljanovic, M.S.; Speer, D.P.; Graham, A.R.; Jacobson, J.A.; Barnes, G.R.; Hunter, T.B. Imaging findings of fibrous dysplasia with histopathologic and intraoperative correlation. AJR Am. J. Roentgenol. 2004, 182, 1389–1398. [Google Scholar] [CrossRef]
- Su, M.G.; Tian, R.; Fan, Q.P.; Tian, Y.; Li, F.L.; Li, L.; Kuang, A.; Miller, J.H. Recognition of fibrous dysplasia of bone mimicking skeletal metastasis on 18F-FDG PET/CT imaging. Skelet. Radiol. 2011, 40, 295–302. [Google Scholar] [CrossRef]
- Ribeiro, A.M.B.; Lima, E.N.P.; Rocha, M.M. Fibrous dysplasia as a possible false-positive finding in 68Ga-labeled prostate-specific membrane antigen positron emission tomography/computed tomography study in the follow-up of prostate cancer. World J. Nucl. Med. 2019, 18, 409–412. [Google Scholar] [CrossRef]
- Strobel, K.; Exner, U.E.; Stumpe, K.D.M.; Hany, T.F.; Bode, B.; Mende, K.; Veit-Haibach, P.; von Schulthess, G.K.; Hodler, J. The additional value of CT images interpretation in the differential diagnosis of benign vs. malignant primary bone lesions with 18F-FDG-PET/CT. Eur. J. Nucl. Med. Mol. Imaging 2008, 35, 2000–2008. [Google Scholar] [CrossRef]
- Kushchayeva, Y.S.; Kushchayev, S.V.; Glushko, T.Y.; Tella, S.H.; Teytelboym, O.M.; Collins, M.T.; Boyce, A.M. Fibrous dysplasia for radiologists: Beyond ground glass bone matrix. Insights Imaging 2018, 9, 1035–1056. [Google Scholar] [CrossRef]
- Mulligan, M.E. How to Diagnose Enchondroma, Bone Infarct, and Chondrosarcoma. Curr. Probl. Diagn. Radiol. 2019, 48, 262–273. [Google Scholar] [CrossRef] [PubMed]
- Cheung, H.; Yechoor, A.; Behnia, F.; Abadi, A.B.; Khodarahmi, I.; Soltanolkotabi, M.; Shafiei, M.; Chalian, M. Common Skeletal Neoplasms and Nonneoplastic Lesions at 18F-FDG PET/CT. Radiographics 2022, 42, 250–267. [Google Scholar] [CrossRef]
- Skinner, H.B. Current Diagnosis & Treatment in Orthopedics, 3rd ed.; Lange Medical Books/McGraw-Hill: New York, NY, USA, 2003; 758p. [Google Scholar]
- Crim, J.; Schmidt, R.; Layfield, L.; Hanrahan, C.; Manaster, B.J. Can imaging criteria distinguish enchondroma from grade 1 chondrosarcoma? Eur. J. Radiol. 2015, 84, 2222–2230. [Google Scholar] [CrossRef]
- Subhawong, T.K.; Winn, A.; Shemesh, S.S.; Pretell-Mazzini, J. F-18 FDG PET differentiation of benign from malignant chondroid neoplasms: A systematic review of the literature. Skelet. Radiol. 2017, 46, 1233–1239. [Google Scholar] [CrossRef]
- Gassert, F.G.; Breden, S.; Neumann, J.; Gassert, F.T.; Bollwein, C.; Knebel, C.; Lenze, U.; von Eisenhart-Rothe, R.; Mogler, C.; Makowski, M.R.; et al. Differentiating Enchondromas and Atypical Cartilaginous Tumors in Long Bones with Computed Tomography and Magnetic Resonance Imaging. Diagnostics 2022, 12, 2186. [Google Scholar] [CrossRef]
- Miwa, S.; Yamamoto, N.; Hayashi, K.; Takeuchi, A.; Igarashi, K.; Tada, K.; Yonezawa, H.; Morinaga, S.; Araki, Y.; Asano, Y.; et al. A Radiological Scoring System for Differentiation between Enchondroma and Chondrosarcoma. Cancers 2021, 13, 3558. [Google Scholar] [CrossRef]
- Ahmed, S.; Jubouri, S.; Mulligan, M. Incidental long bone cartilage lesions: Is any further imaging workup needed? Skelet. Radiol. 2021, 50, 1189–1196. [Google Scholar] [CrossRef] [PubMed]
- Hilton, R.C.; Ball, J.; Benn, R.T. Vertebral end-plate lesions (Schmorl’s nodes) in the dorsolumbar spine. Ann. Rheum. Dis. 1976, 35, 127–132. [Google Scholar] [CrossRef] [PubMed]
- Hamanishi, C.; Kawabata, T.; Yosii, T.; Tanaka, S. Schmorl’s nodes on magnetic resonance imaging. Their incidence and clinical relevance. Spine 1994, 19, 450–453. [Google Scholar] [CrossRef] [PubMed]
- Mattei, T.A.; Rehman, A.A. Schmorl’s nodes: Current pathophysiological, diagnostic, and therapeutic paradigms. Neurosurg. Rev. 2014, 37, 39–46. [Google Scholar] [CrossRef] [PubMed]
- Lin, C.Y.; Chen, H.Y.; Ding, H.J.; Chen, Y.K.; Kao, C.H. Evaluation of Schmorl’s nodes using F-18 FDG PET/CT. Clin. Radiol. 2012, 67, e17–e21. [Google Scholar] [CrossRef] [PubMed]
- Wang, Z.; Ma, D.; Yang, J. 18F-FDG PET/CT can differentiate vertebral metastases from Schmorl’s nodes by distribution characteristics of the 18F-FDG. Hell. J. Nucl. Med. 2016, 19, 241–244. [Google Scholar] [CrossRef]
- Papadakis, G.Z.; Millo, C.; Bagci, U.; Sadowski, S.M.; Stratakis, C.A. Schmorl Nodes Can Cause Increased 68Ga DOTATATE Activity on PET/CT, Mimicking Metastasis in Patients With Neuroendocrine Malignancy. Clin. Nucl. Med. 2016, 41, 249–250. [Google Scholar] [CrossRef] [PubMed]
- Ciftdemir, M.; Kaya, M.; Selcuk, E.; Yalniz, E. Tumors of the spine. World J. Orthop. 2016, 7, 109–116. [Google Scholar] [CrossRef] [PubMed]
- Pastushyn, A.I.; Slin, E.I.; Mirzoyeva, G.M. Vertebral hemangiomas: Diagnosis, management, natural history and clinicopathological correlates in 86 patients. Surg. Neurol. 1998, 50, 535–547. [Google Scholar] [CrossRef] [PubMed]
- Gaudino, S.; Martucci, M.; Colantonio, R.; Lozupone, E.; Visconti, E.; Leone, A.; Colosimo, C. A systematic approach to vertebral hemangioma. Skelet. Radiol. 2015, 44, 25–36. [Google Scholar] [CrossRef] [PubMed]
- Kim, C.H.; Kim, S.W. Rapidly Progressive Atypical Vertebral Hemangioma: A Case Report. Korean J. Neurotrauma 2020, 16, 320–325. [Google Scholar] [CrossRef] [PubMed]
- Gerard, P.S.; Wilck, E. Spinal hemangioma. An unusual photopenic presentation on bone scan. Spine 1992, 17, 607–610. [Google Scholar] [CrossRef]
- Domínguez, M.L.; Rayo, J.I.; Serrano, J.; Sánchez, R.; Infante, J.R.; García, L.; Durán, C. Vertebral hemangioma: Cold vertebrae on bone scintigraphy and fluordeoxy-glucose positron emission tomography-computed tomography. Indian J. Nucl. Med. 2011, 26, 49–51. [Google Scholar] [CrossRef]
- Solav, S.V.; Savale, S.V.; Patil, A.M. False-positive FDG PET CT Scan in Vertebral Hemangioma. Asia Ocean. J. Nucl. Med. Biol. 2019, 7, 95–98. [Google Scholar] [CrossRef]
- Ralston, S.H. Clinical practice. Paget’s disease of bone. N. Engl. J. Med. 2013, 368, 644–650. [Google Scholar] [CrossRef]
- Miller, S.W.; Castronovo, F.P., Jr.; Pendergrass, H.P.; Potsaid, M.S. Technetium 99m labeled diphosphonate bone scanning in Paget’s disease. Am. J. Roentgenol. Radium Ther. Nucl. Med. 1974, 121, 177–183. [Google Scholar] [CrossRef] [PubMed][Green Version]
- Park, E.T.; Kim, S.E. Radiography, Bone Scan, and F-18 FDG PET/CT Imaging Findings in a Patient with Paget’s Disease. Nucl. Med. Mol. Imaging 2010, 44, 87–89. [Google Scholar] [CrossRef] [PubMed][Green Version]
- Sasikumar, A.; Joy, A.; Nanabala, R.; Pillai, M.R.A.; Hari, T.A. 68Ga-PSMA PET/CT False-Positive Tracer Uptake in Paget Disease. Clin. Nucl. Med. 2016, 41, e454–e455. [Google Scholar] [CrossRef]
- Resnick, D.; Niwayama, G. Entheses and enthesopathy. Anatomical, pathological, and radiological correlation. Radiology 1983, 146, 1–9. [Google Scholar] [CrossRef]
- Taniguchi, Y.; Arii, K.; Kumon, Y.; Fukumoto, M.; Ohnishi, T.; Horino, T.; Kagawa, T.; Kobayashi, S.; Ogawa, Y.; Terada, Y. Positron emission tomography/computed tomography: A clinical tool for evaluation of enthesitis in patients with spondyloarthritides. Rheumatology 2010, 49, 348–354. [Google Scholar] [CrossRef][Green Version]
- Nisolle, J.F.; Delaunois, L.; Trigaux, J.P. Myositis ossificans of the chest wall. Eur. Respir. J. 1996, 9, 178–179. [Google Scholar] [CrossRef] [PubMed]
- Walczak, B.E.; Johnson, C.N.; Howe, B.M. Myositis Ossificans. J. Am. Acad. Orthop. Surg. 2015, 23, 612–622. [Google Scholar] [CrossRef]
- Tyler, P.; Saifuddin, A. The imaging of myositis ossificans. Semin. Musculoskelet. Radiol. 2010, 14, 201–216. [Google Scholar] [CrossRef]
- Koob, M.; Durckel, J.; Dosch, J.C.; Entz-Werle, N.; Dietemann, J.L. Intercostal myositis ossificans misdiagnosed as osteosarcoma in a 10-year-old child. Pediatr. Radiol. 2010, 40 (Suppl. S1), S34–S37. [Google Scholar] [CrossRef]
- Shehab, D.; Elgazzar, A.H.; Collier, B.D. Heterotopic ossification. J. Nucl. Med. 2002, 43, 346–353. [Google Scholar]
- Loew, M.; Jurgowski, W.; Mau, H.C.; Thomsen, M. Treatment of calcifying tendinitis of rotator cuff by extracorporeal shock waves: A preliminary report. J. Shoulder Elbow Surg. 1995, 4, 101–106. [Google Scholar] [CrossRef]
- Almedghio, S.; Garneti, N. The Acute and Chronic Presentation of Gluteus Medius Calcific Tendinitis—A Case Report of Two. J. Orthop. Case Rep. 2014, 4, 48–50. [Google Scholar] [CrossRef]
- Flemming, D.J.; Murphey, M.D.; Shekitka, K.M.; Temple, H.T.; Jelinek, J.J.; Kransdorf, M.J. Osseous involvement in calcific tendinitis: A retrospective review of 50 cases. AJR Am. J. Roentgenol. 2003, 181, 965–972. [Google Scholar] [CrossRef]
- Broski, S.M.; Murdoch, N.M.; Skinner, J.A.; Wenger, D.E. Pigmented Villonodular Synovitis: Potential Pitfall on Oncologic 18F-FDG PET/CT. Clin. Nucl. Med. 2016, 41, e24–e31. [Google Scholar] [CrossRef] [PubMed]
- Kitapci, M.T.; Coleman, R.E. Incidental detection of pigmented villonodular synovitis on FDG PET. Clin. Nucl. Med. 2003, 28, 668–669. [Google Scholar] [CrossRef] [PubMed]
- Hughes, T.H.; Sartoris, D.J.; Schweitzer, M.E.; Resnick, D.L. Pigmented villonodular synovitis: MRI characteristics. Skelet. Radiol. 1995, 24, 7–12. [Google Scholar] [CrossRef]
- Cohen-Levy, W.B.; Pretell-Mazzini, J.; Singer, A.D.; Subhawong, T.; Greif, D.N.; Jose, J. Significance of incidental intra-articular and peri-articular FDG avid foci on PET/CT. Acta Radiol. 2019, 60, 78–84. [Google Scholar] [CrossRef] [PubMed]
- Neviaser, A.S.; Neviaser, R.J. Adhesive capsulitis of the shoulder. J. Am. Acad. Orthop. Surg. 2011, 19, 536–542. [Google Scholar] [CrossRef] [PubMed]
- Waldburger, M.; Meier, J.L.; Gobelet, C. The frozen shoulder: Diagnosis and treatment. Prospective study of 50 cases of adhesive capsulitis. Clin. Rheumatol. 1992, 11, 364–368. [Google Scholar] [CrossRef] [PubMed]
- Sridharan, R.; Engle, M.P.; Garg, N.; Wei, W.; Amini, B. Focal uptake at the rotator interval or inferior capsule of shoulder on 18F-FDG PET/CT is associated with adhesive capsulitis. Skelet. Radiol. 2017, 46, 533–538. [Google Scholar] [CrossRef] [PubMed]
- Fields, B.K.; Skalski, M.R.; Patel, D.B.; White, E.A.; Tomasian, A.; Gross, J.S.; Matcuk, G.R. Adhesive capsulitis: Review of imaging findings, pathophysiology, clinical presentation, and treatment options. Skelet. Radiol. 2019, 48, 1171–1184. [Google Scholar] [CrossRef]
- Melnick, J.C.; Silverman, F.N. Intervertebral disk calcification in childhood. Radiology 1963, 80, 399–408. [Google Scholar] [CrossRef]
- Swischuk, L.E.; Jubang, M.; Jadhav, S.P. Calcific discitis in children: Vertebral body involvement (possible insight into etiology). Emerg. Radiol. 2008, 15, 427–430. [Google Scholar] [CrossRef] [PubMed]
- Sonnabend, D.H.; Taylor, T.K.; Chapman, G.K. Intervertebral disc calcification syndromes in children. J. Bone Joint Surg. Br. 1982, 64, 25–31. [Google Scholar] [CrossRef]
- Donmez, H.; Mavili, E.; Ikizceli, T.; Koc, R.K. Pediatric intervertebral disc calcification. Diagn. Interv. Radiol. 2008, 14, 225–227. [Google Scholar] [PubMed]
- Kashyap, R.; Lau, E.; George, A.; Seymour, J.F.; Lade, S.; Hicks, R.J.; Hofman, M.S. High FDG activity in focal fat necrosis: A pitfall in interpretation of posttreatment PET/CT in patients with non-Hodgkin lymphoma. Eur. J. Nucl. Med. Mol. Imaging 2013, 40, 1330–1336. [Google Scholar] [CrossRef] [PubMed]
- Lee, S.A.; Chung, H.W.; Cho, K.J.; Sung, C.K.; Lee, S.H.; Lee, M.H.; Shin, M.J. Encapsulated fat necrosis mimicking subcutaneous liposarcoma: Radiologic findings on MR, PET-CT, and US imaging. Skelet. Radiol. 2013, 42, 1465–1470. [Google Scholar] [CrossRef]
- Alkhawaldeh, K.; Alavi, A. Quantitative assessment of FDG uptake in brown fat using standardized uptake value and dual-time-point scanning. Clin. Nucl. Med. 2008, 33, 663–667. [Google Scholar] [CrossRef]
- Mavrogenis, A.F.; Coll-Mesa, L.; Drago, G.; Gambarotti, M.; Ruggieri, P. Hibernomas: Clinicopathological features, diagnosis, and treatment of 17 cases. Orthopedics 2011, 34, e755–e759. [Google Scholar] [CrossRef]
- Smith, C.S.; Teruya-Feldstein, J.; Caravelli, J.F.; Yeung, H.W. False-positive findings on 18F-FDG PET/CT: Differentiation of hibernoma and malignant fatty tumor on the basis of fluctuating standardized uptake values. AJR Am. J. Roentgenol. 2008, 190, 1091–1096. [Google Scholar] [CrossRef]
- Baffour, F.I.; Wenger, D.E.; Broski, S.M. 18F-FDG PET/CT imaging features of lipomatous tumors. Am. J. Nucl. Med. Mol. Imaging 2020, 10, 74–82. [Google Scholar] [PubMed]
- Al Hmada, Y.; Schaefer, I.M.; Fletcher, C.D.M. Hibernoma Mimicking Atypical Lipomatous Tumor: 64 Cases of a Morphologically Distinct Subset. Am. J. Surg. Pathol. 2018, 42, 951–957. [Google Scholar] [CrossRef] [PubMed]


Disclaimer/Publisher’s Note: The statements, opinions and data contained in all publications are solely those of the individual author(s) and contributor(s) and not of MDPI and/or the editor(s). MDPI and/or the editor(s) disclaim responsibility for any injury to people or property resulting from any ideas, methods, instructions or products referred to in the content. |
© 2024 by the authors. Licensee MDPI, Basel, Switzerland. This article is an open access article distributed under the terms and conditions of the Creative Commons Attribution (CC BY) license (https://creativecommons.org/licenses/by/4.0/).
Share and Cite
Sarna, B.; Subhawong, T.; Sfakianaki, E.; Wang, R.; Christodoulou-Vega, A.; Cardoso, F.N. Musculoskeletal Pitfalls on Molecular Imaging Studies of Oncologic Patients: How to Stay Out of Trouble. Tomography 2024, 10, 378-399. https://doi.org/10.3390/tomography10030030
Sarna B, Subhawong T, Sfakianaki E, Wang R, Christodoulou-Vega A, Cardoso FN. Musculoskeletal Pitfalls on Molecular Imaging Studies of Oncologic Patients: How to Stay Out of Trouble. Tomography. 2024; 10(3):378-399. https://doi.org/10.3390/tomography10030030
Chicago/Turabian StyleSarna, Brooke, Ty Subhawong, Efrosyni Sfakianaki, Richard Wang, Anna Christodoulou-Vega, and Fabiano N. Cardoso. 2024. "Musculoskeletal Pitfalls on Molecular Imaging Studies of Oncologic Patients: How to Stay Out of Trouble" Tomography 10, no. 3: 378-399. https://doi.org/10.3390/tomography10030030
APA StyleSarna, B., Subhawong, T., Sfakianaki, E., Wang, R., Christodoulou-Vega, A., & Cardoso, F. N. (2024). Musculoskeletal Pitfalls on Molecular Imaging Studies of Oncologic Patients: How to Stay Out of Trouble. Tomography, 10(3), 378-399. https://doi.org/10.3390/tomography10030030