
Indentation and Detachment in Adhesive Contacts between Soft Elastomer and Rigid Indenter at Simultaneous Motion in Normal and Tangential Direction: Experiments and Simulations


Abstract
:
1. Introduction
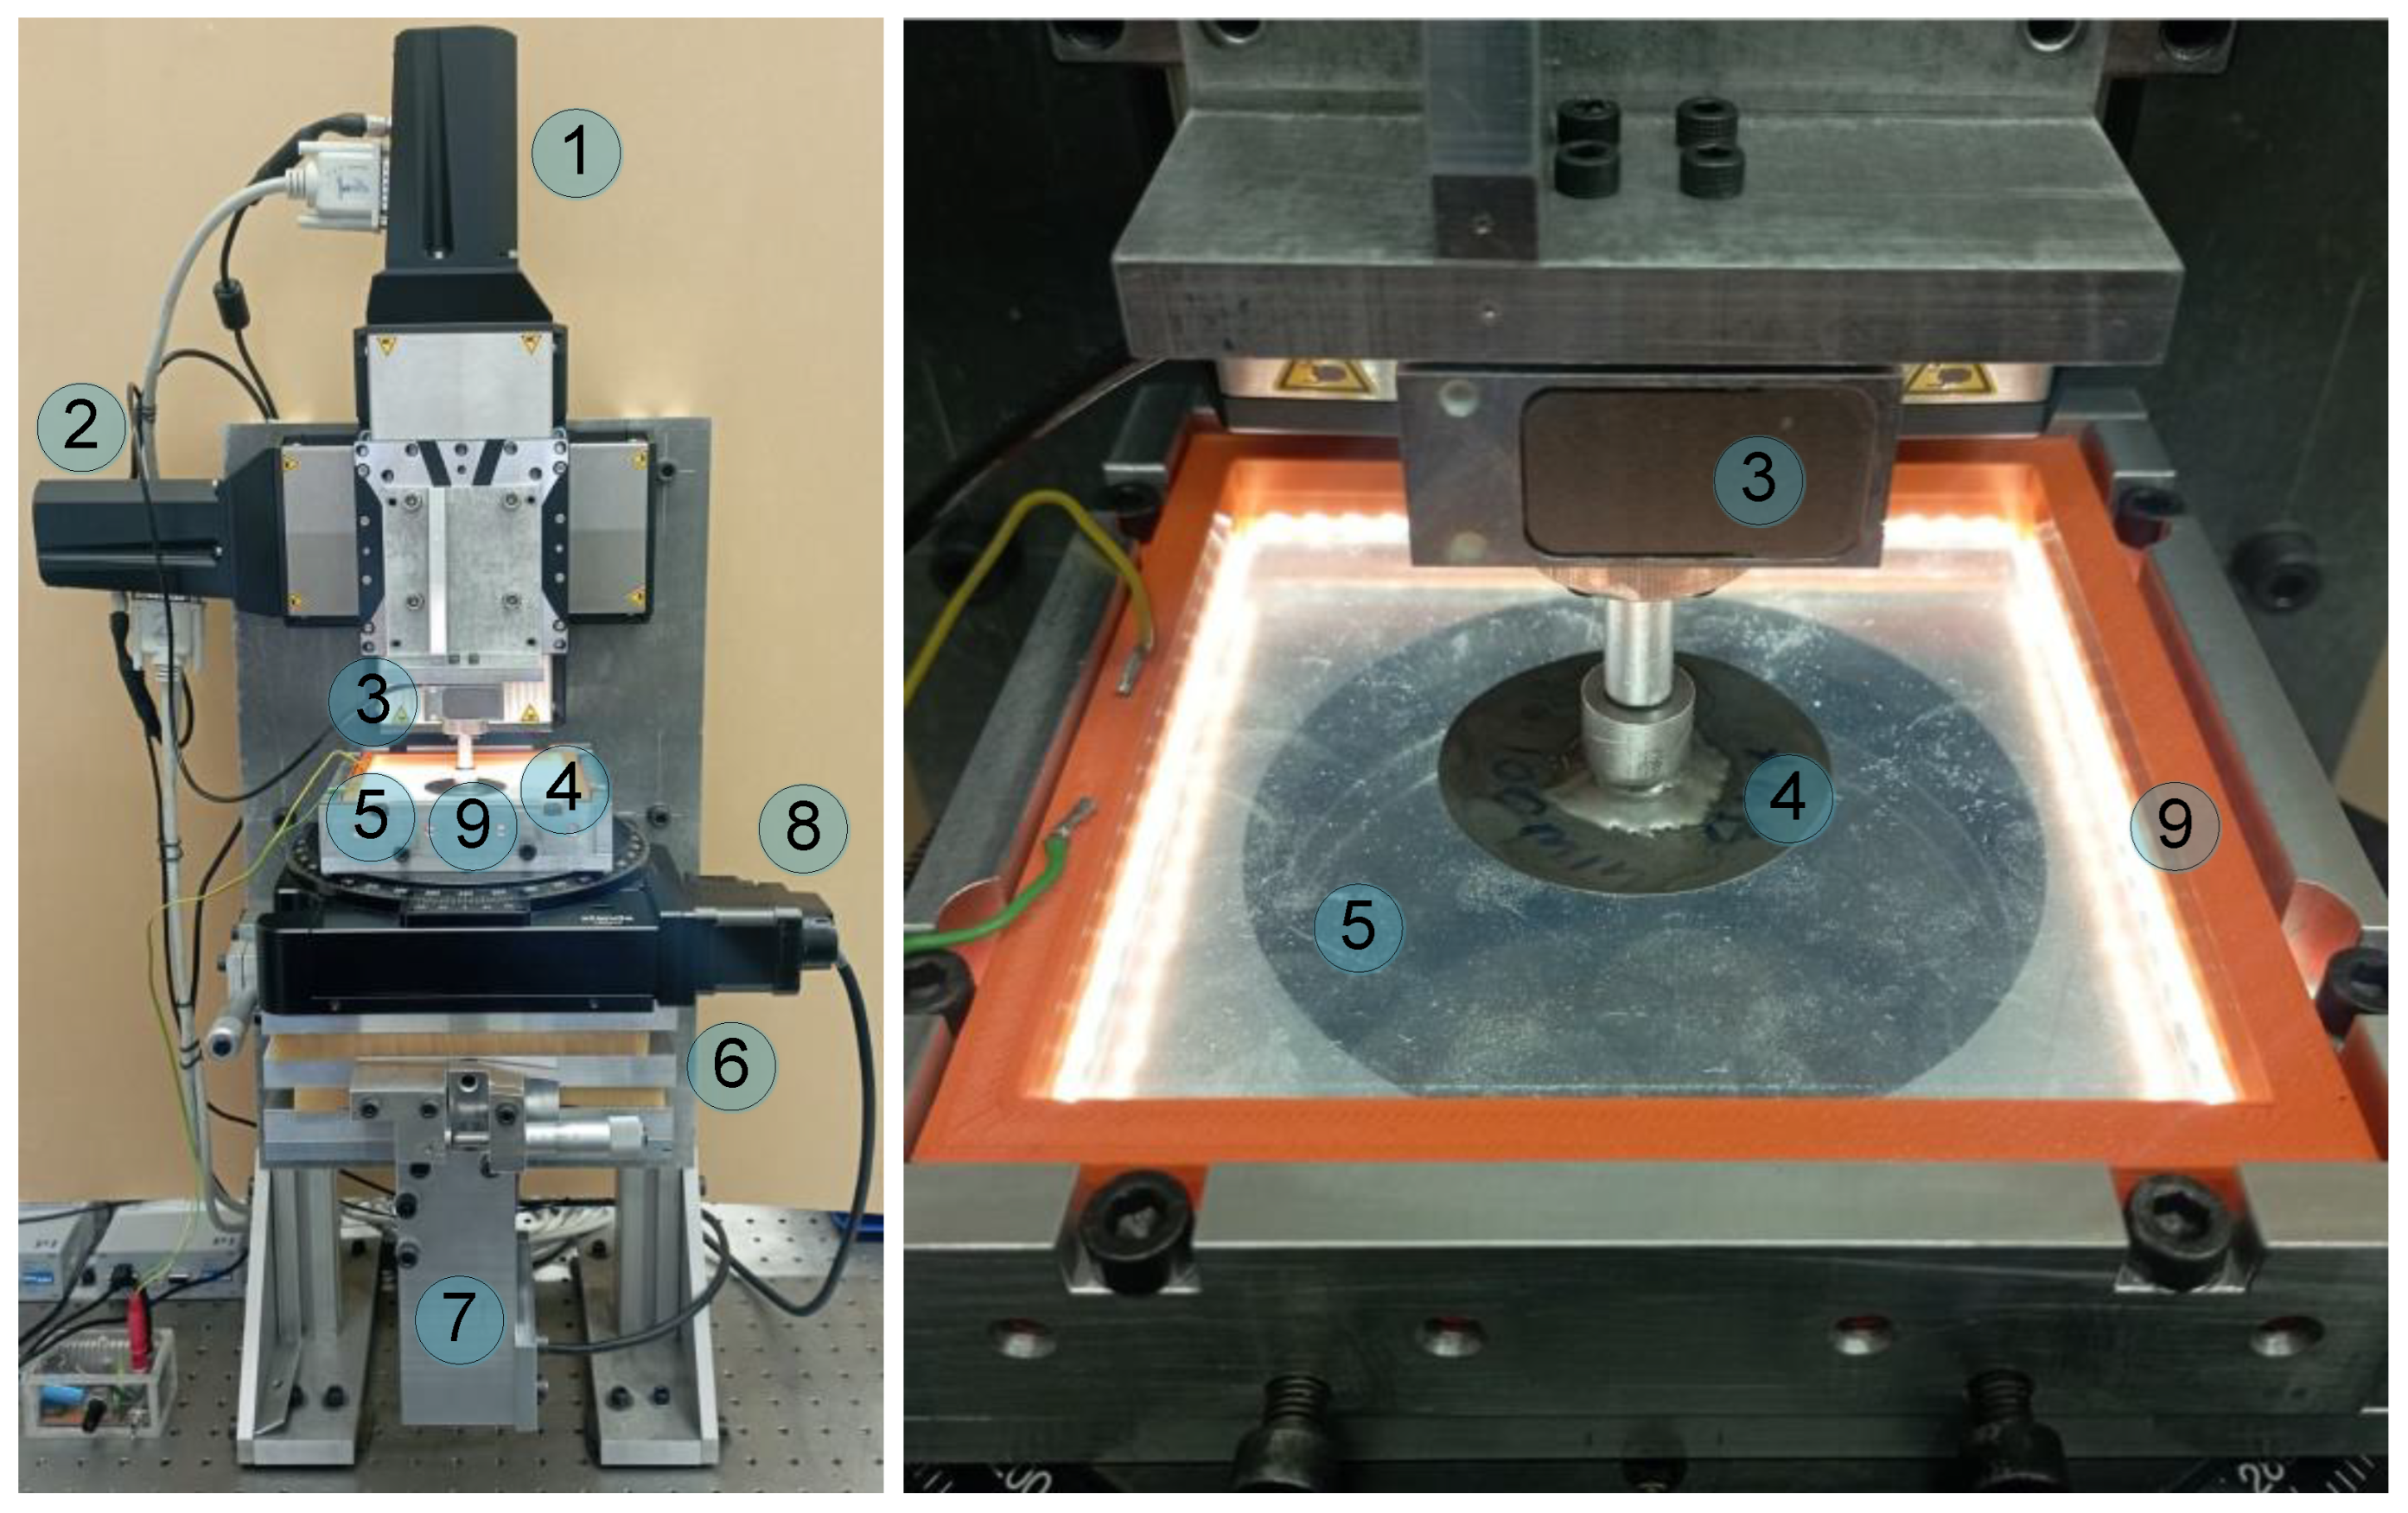
2. Experimental Set-Up
3. Experimental Results
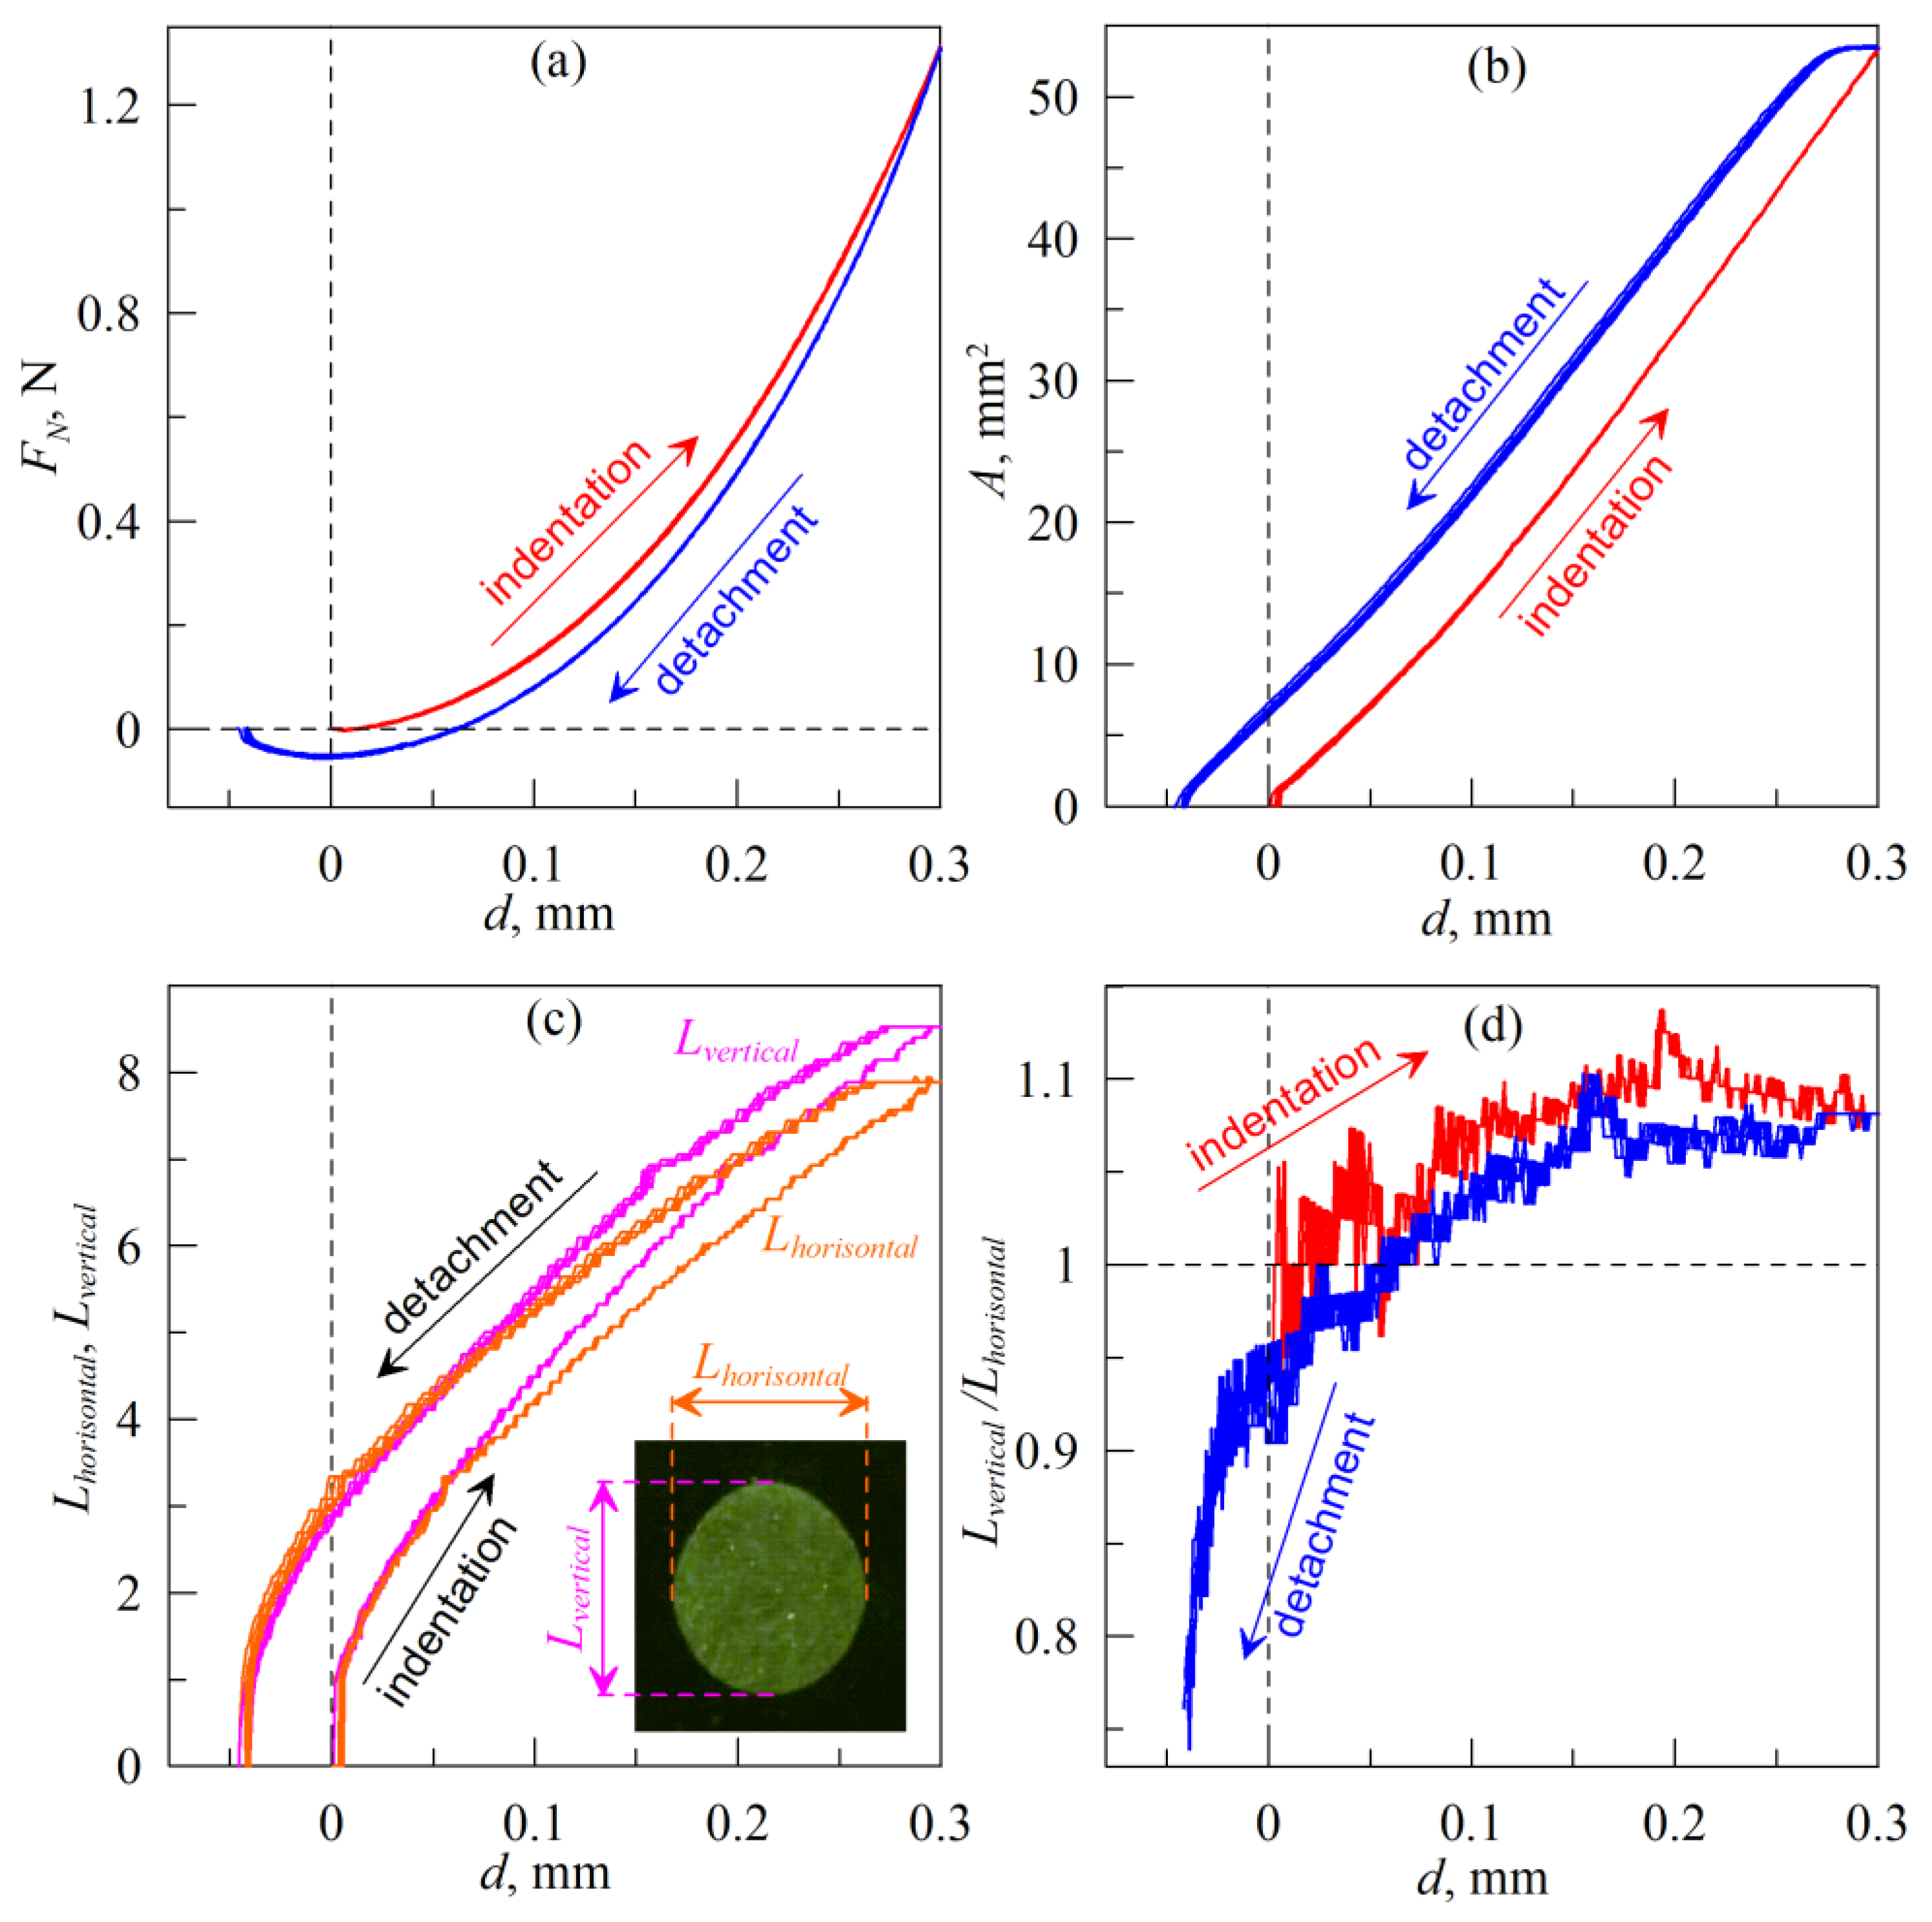
3.1. Normal Contact
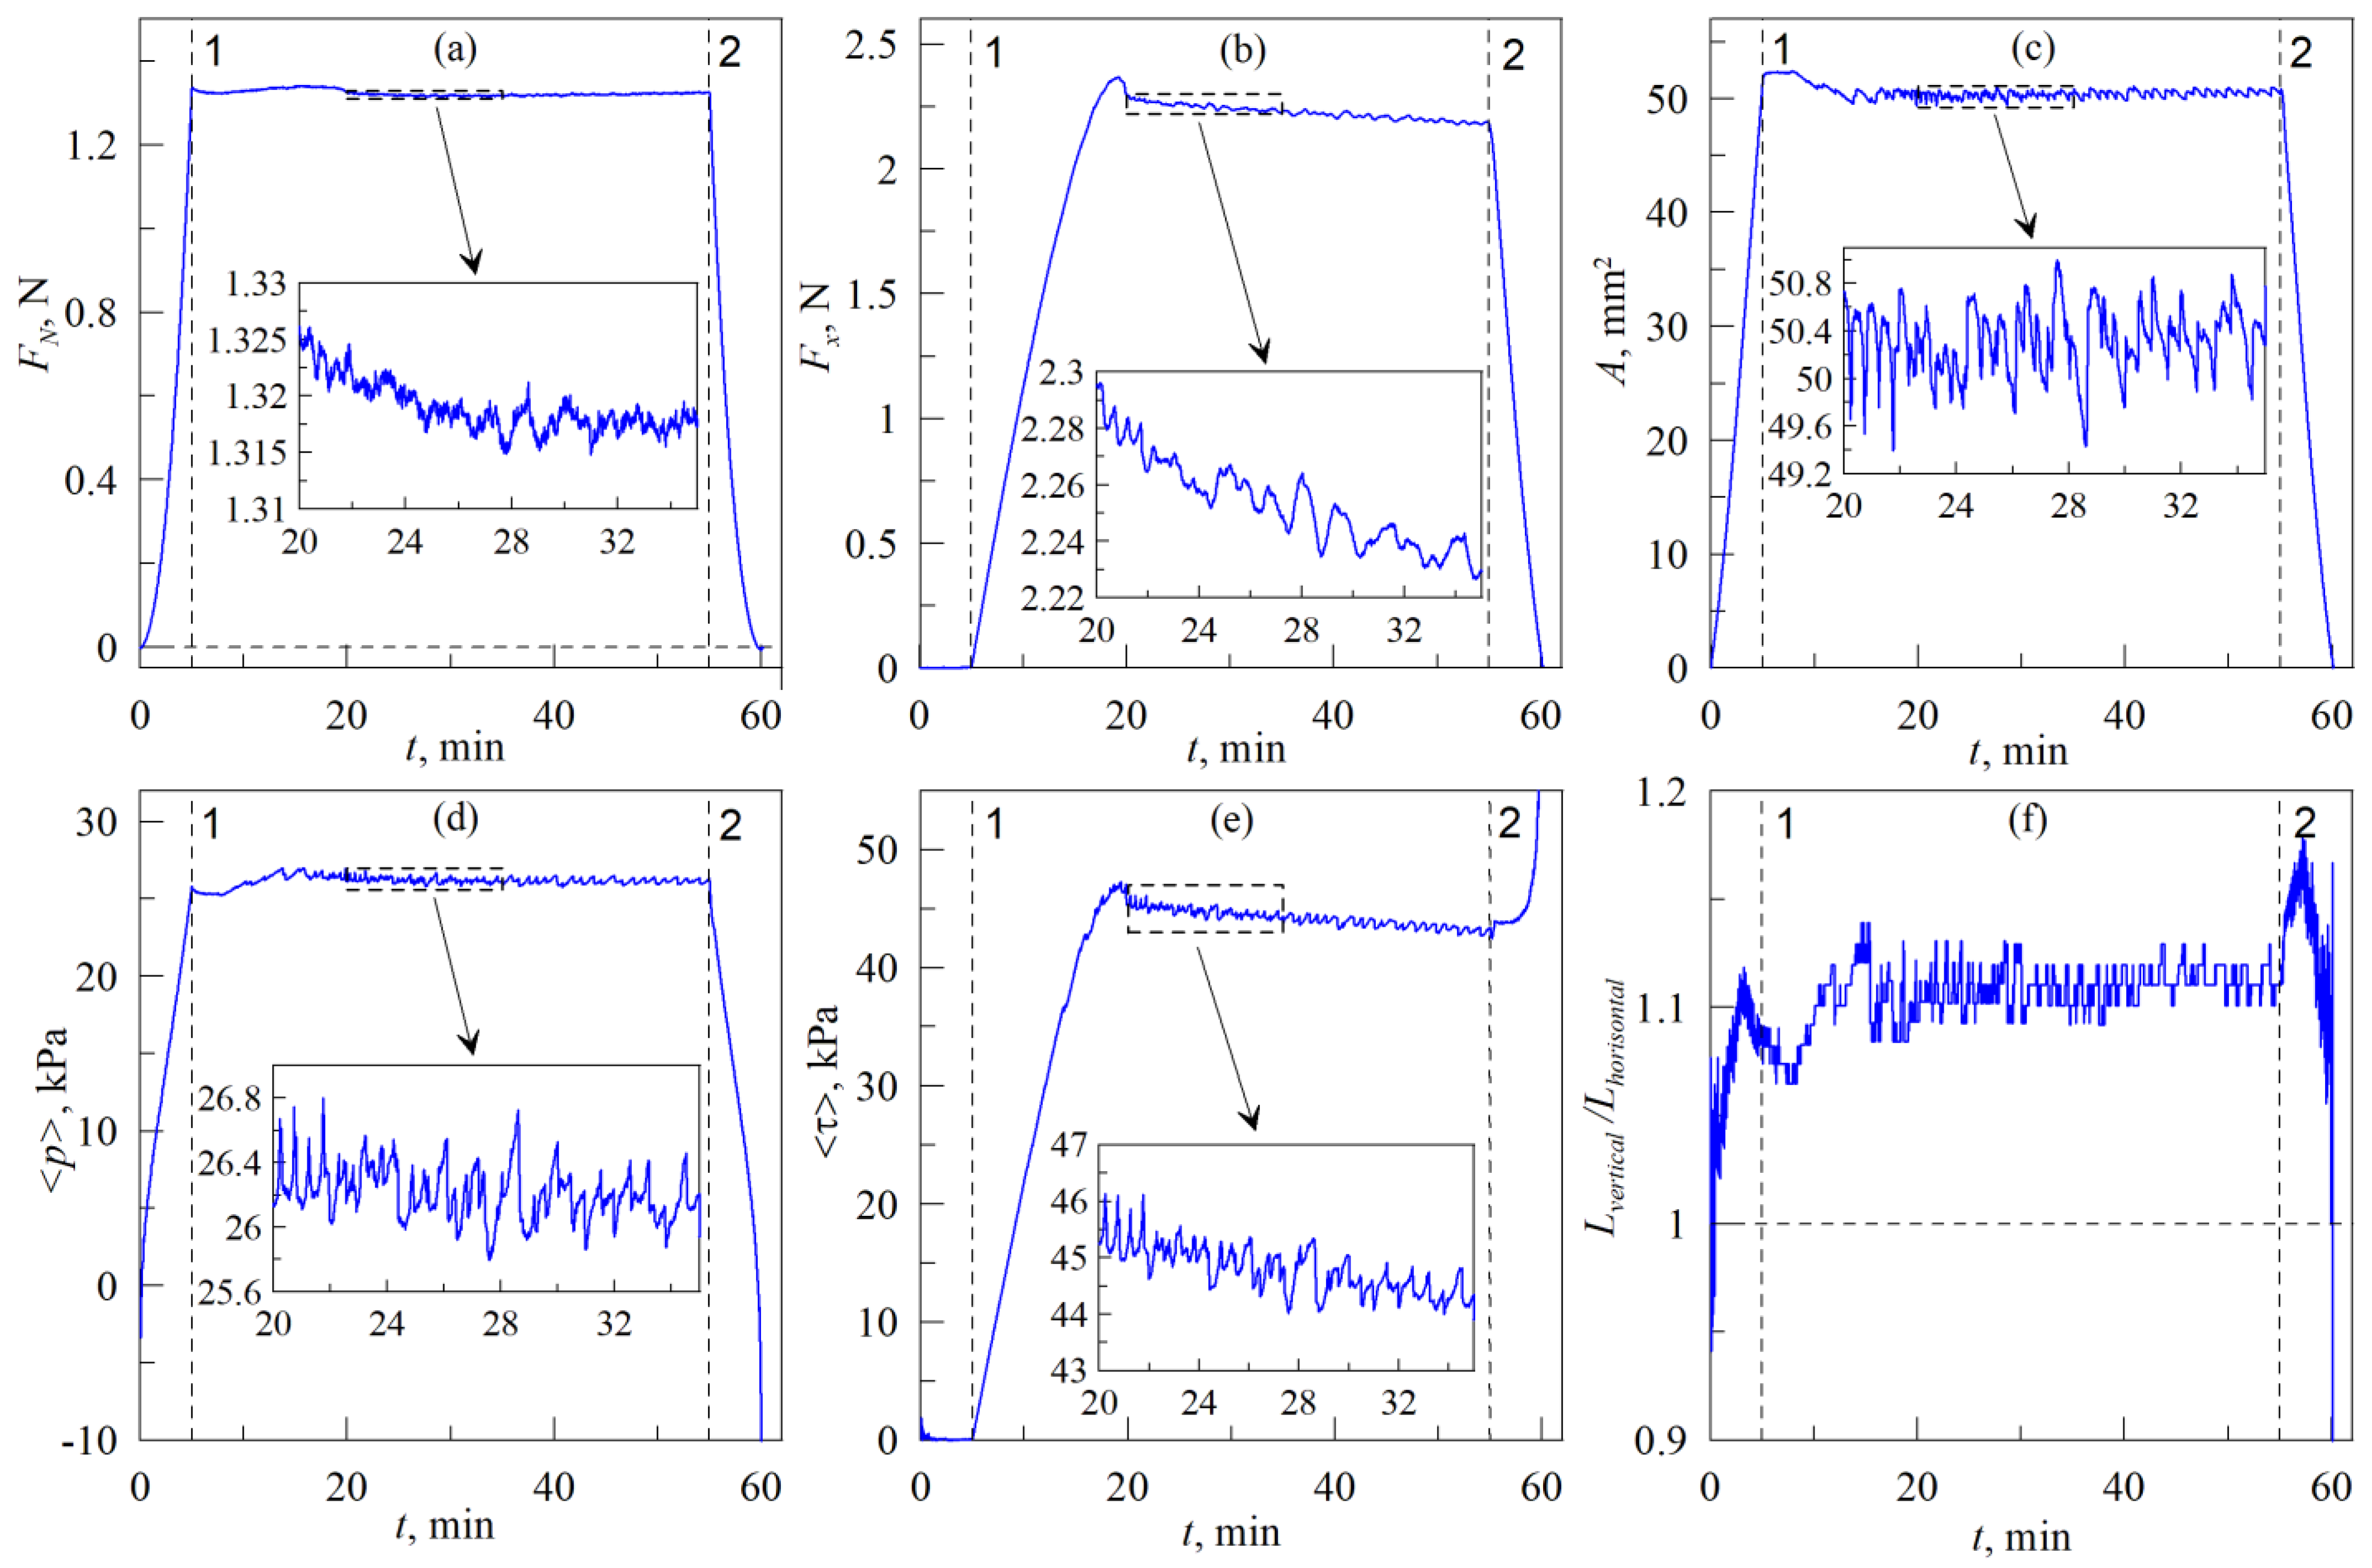
3.2. Tangential Contact
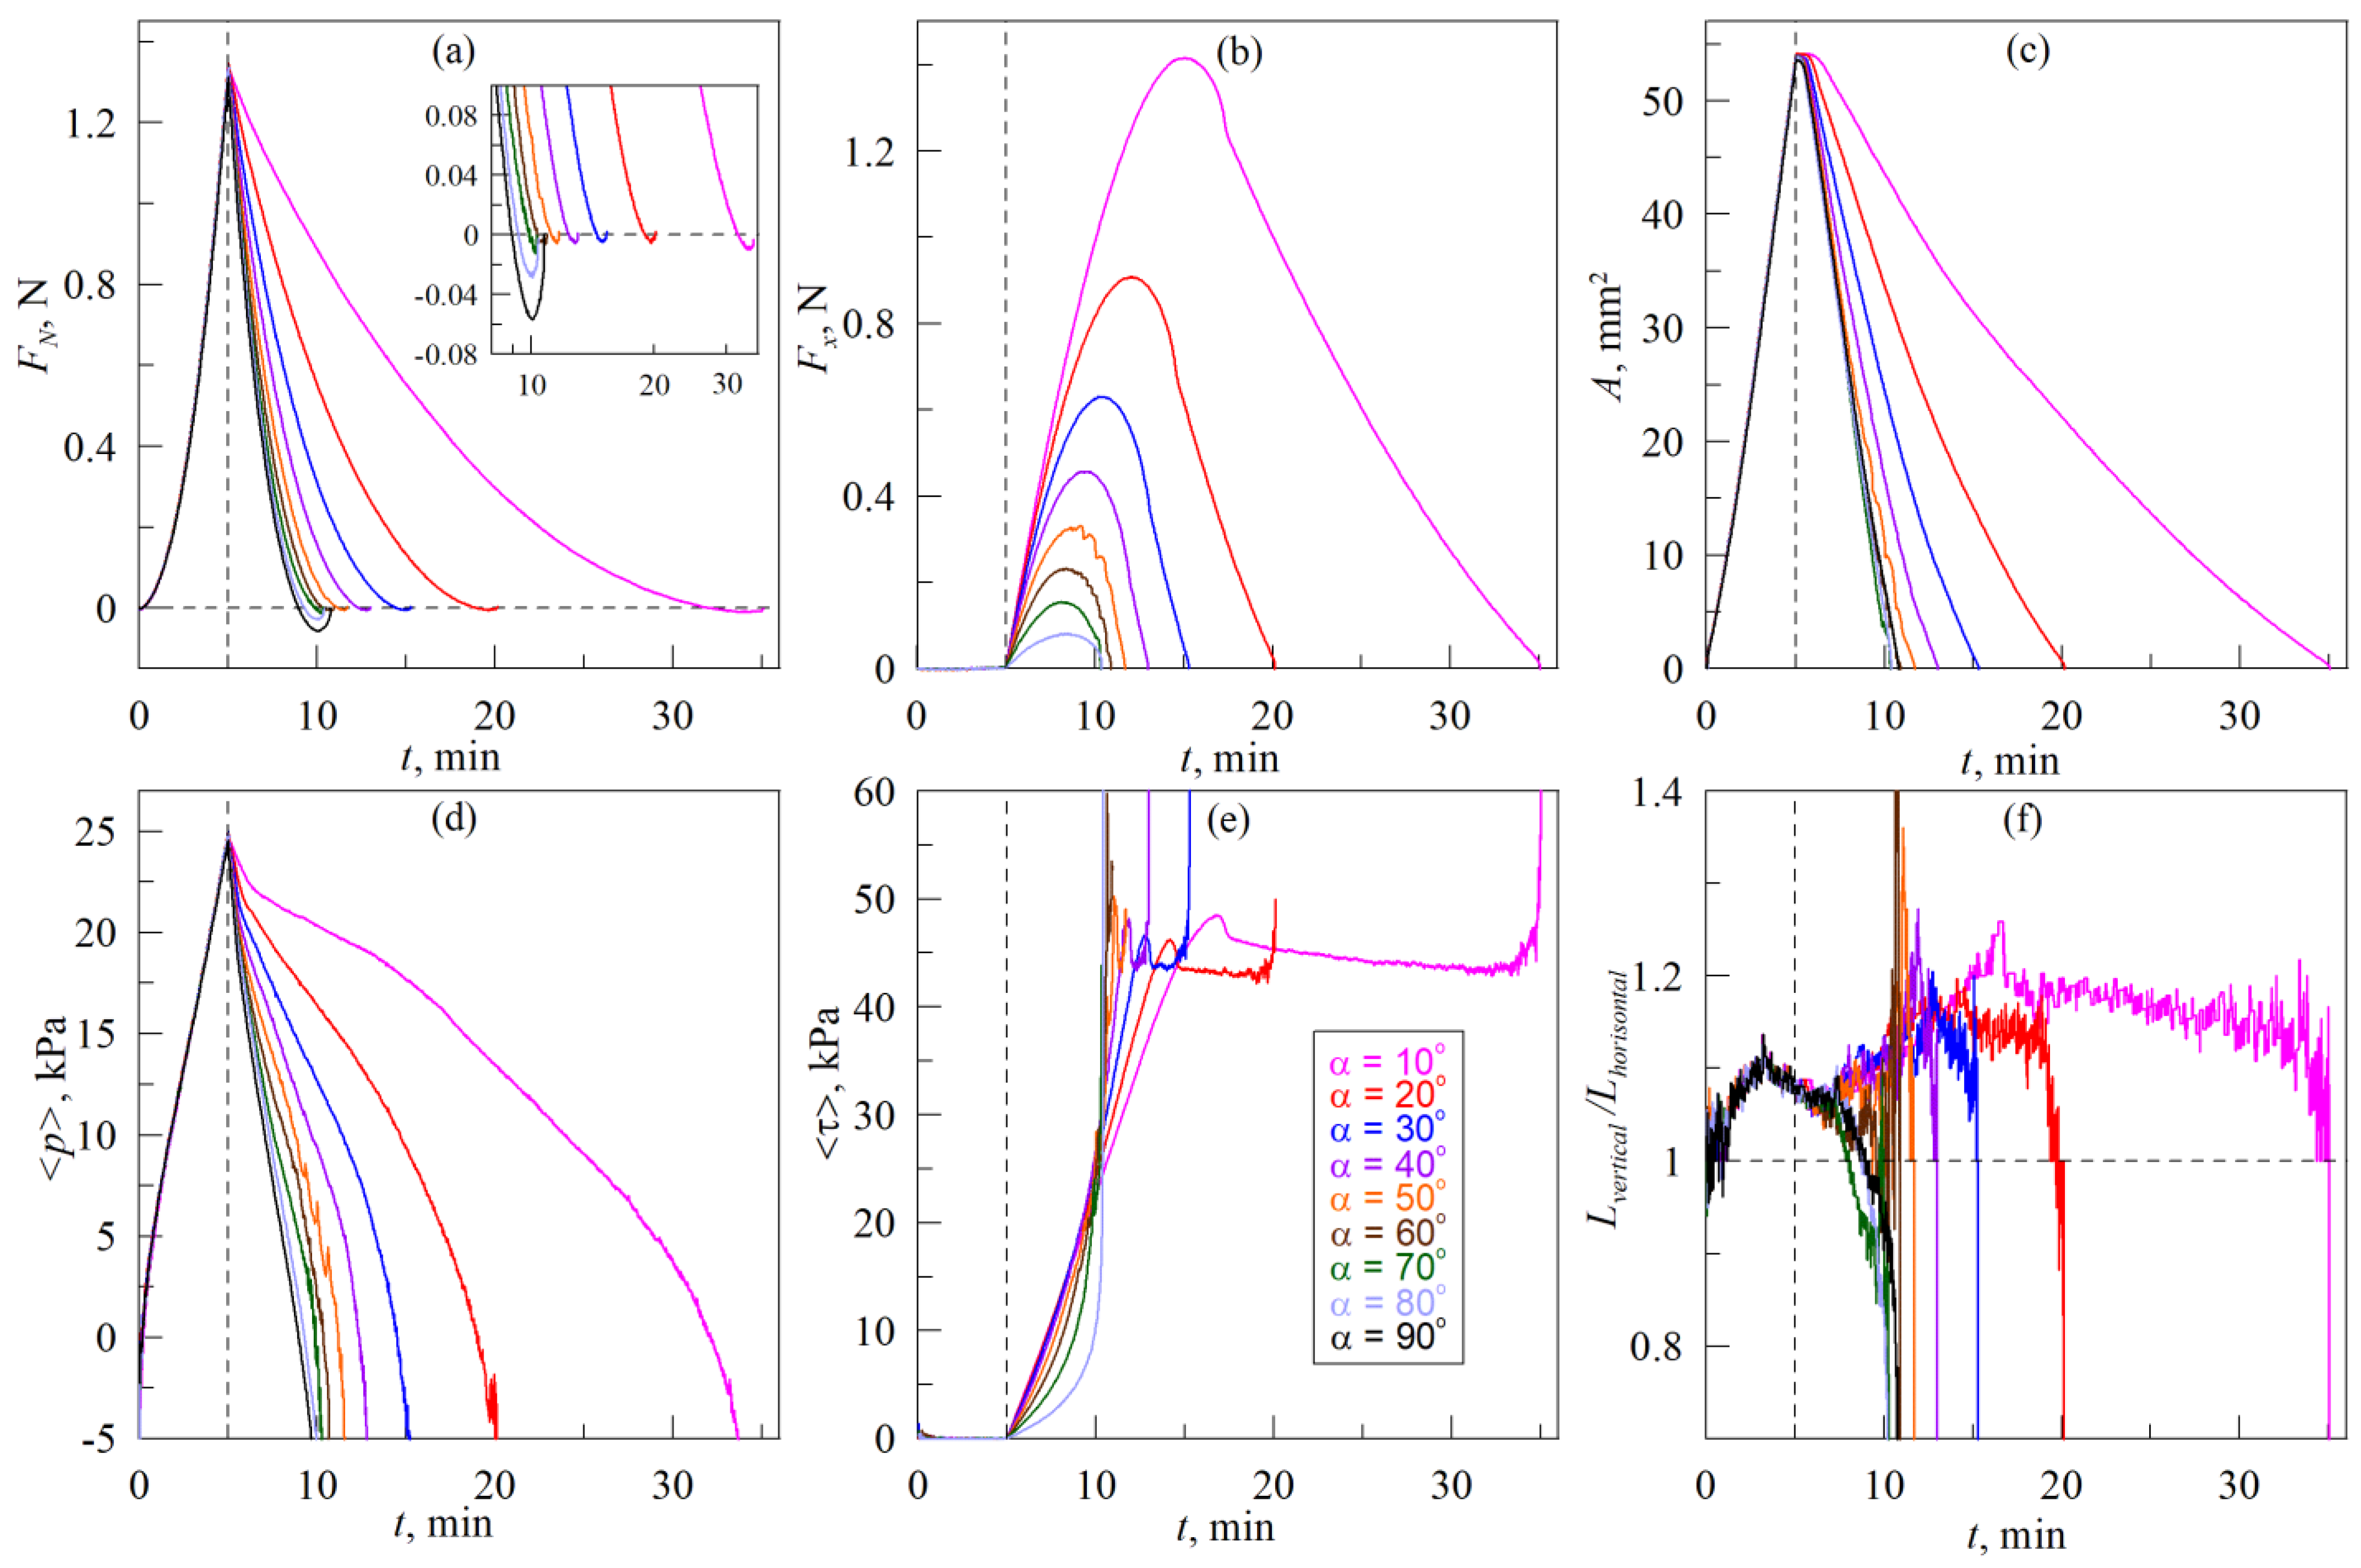
3.3. Immersion of the Indenter at an Angle to the Surface, Scenario (A)
3.4. Pull-Off of the Indenter at an Angle to the Surface, Scenario (B)
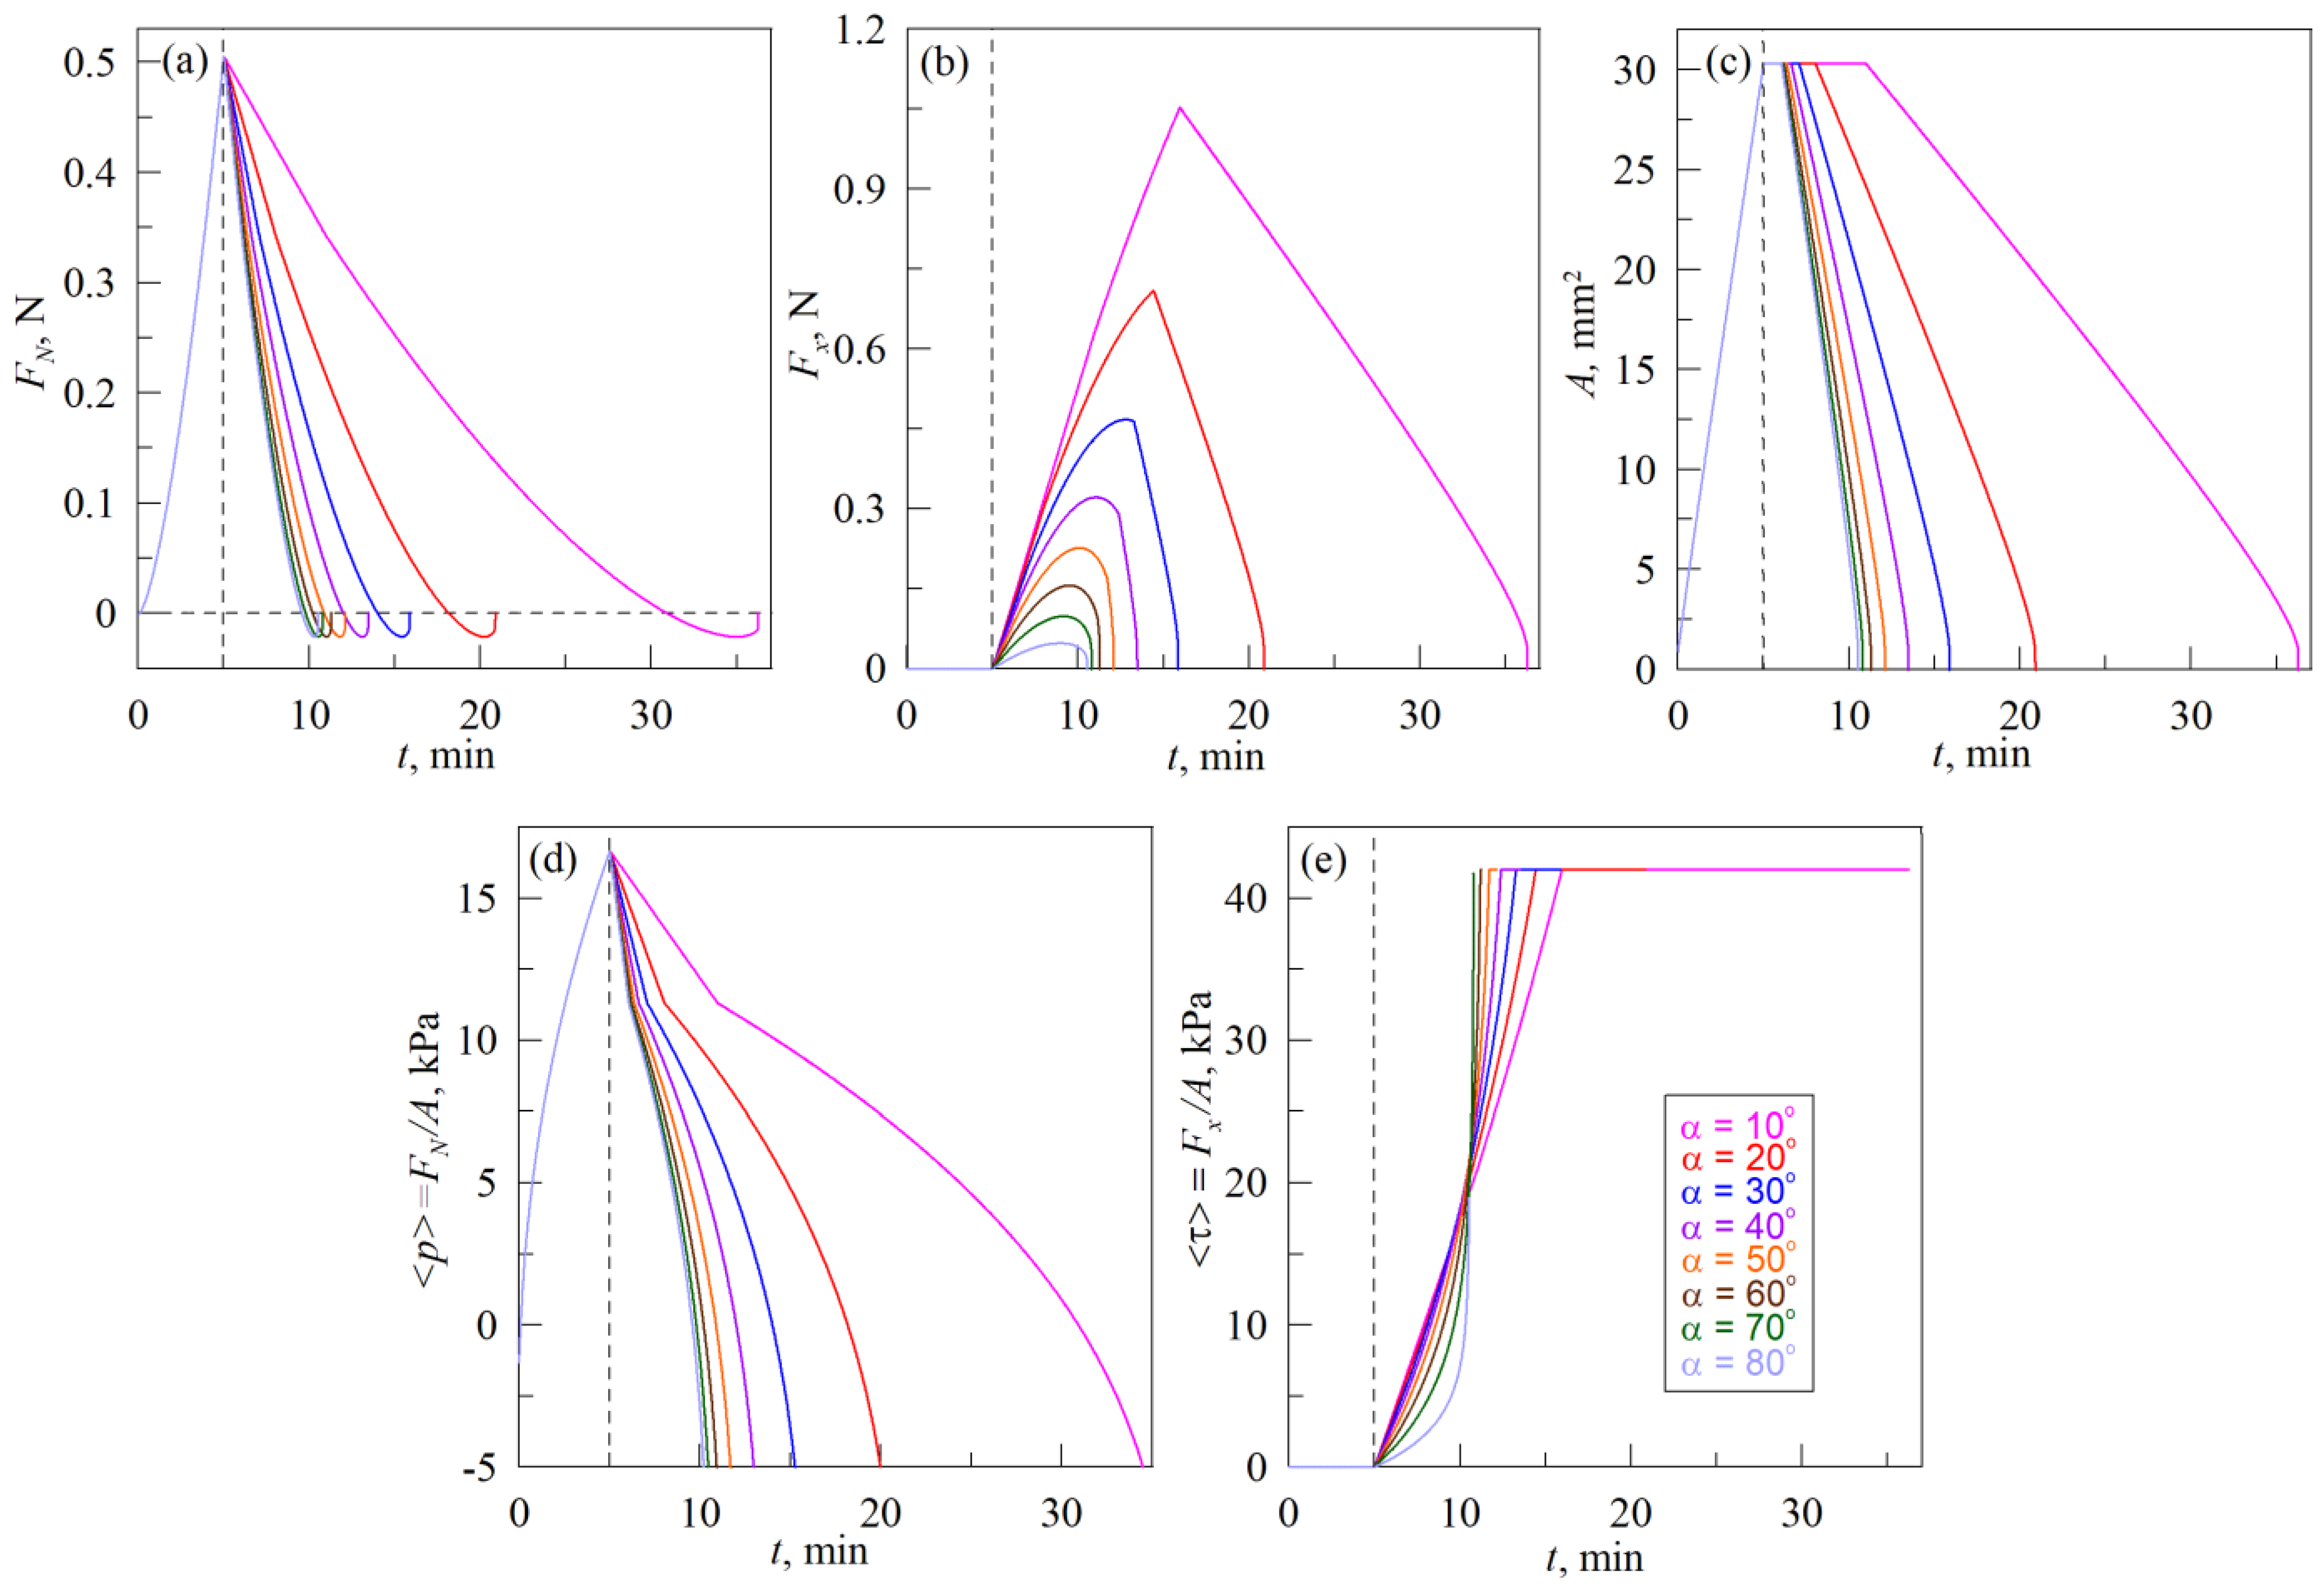
4. Simulation of the Indentation/Detachment Process
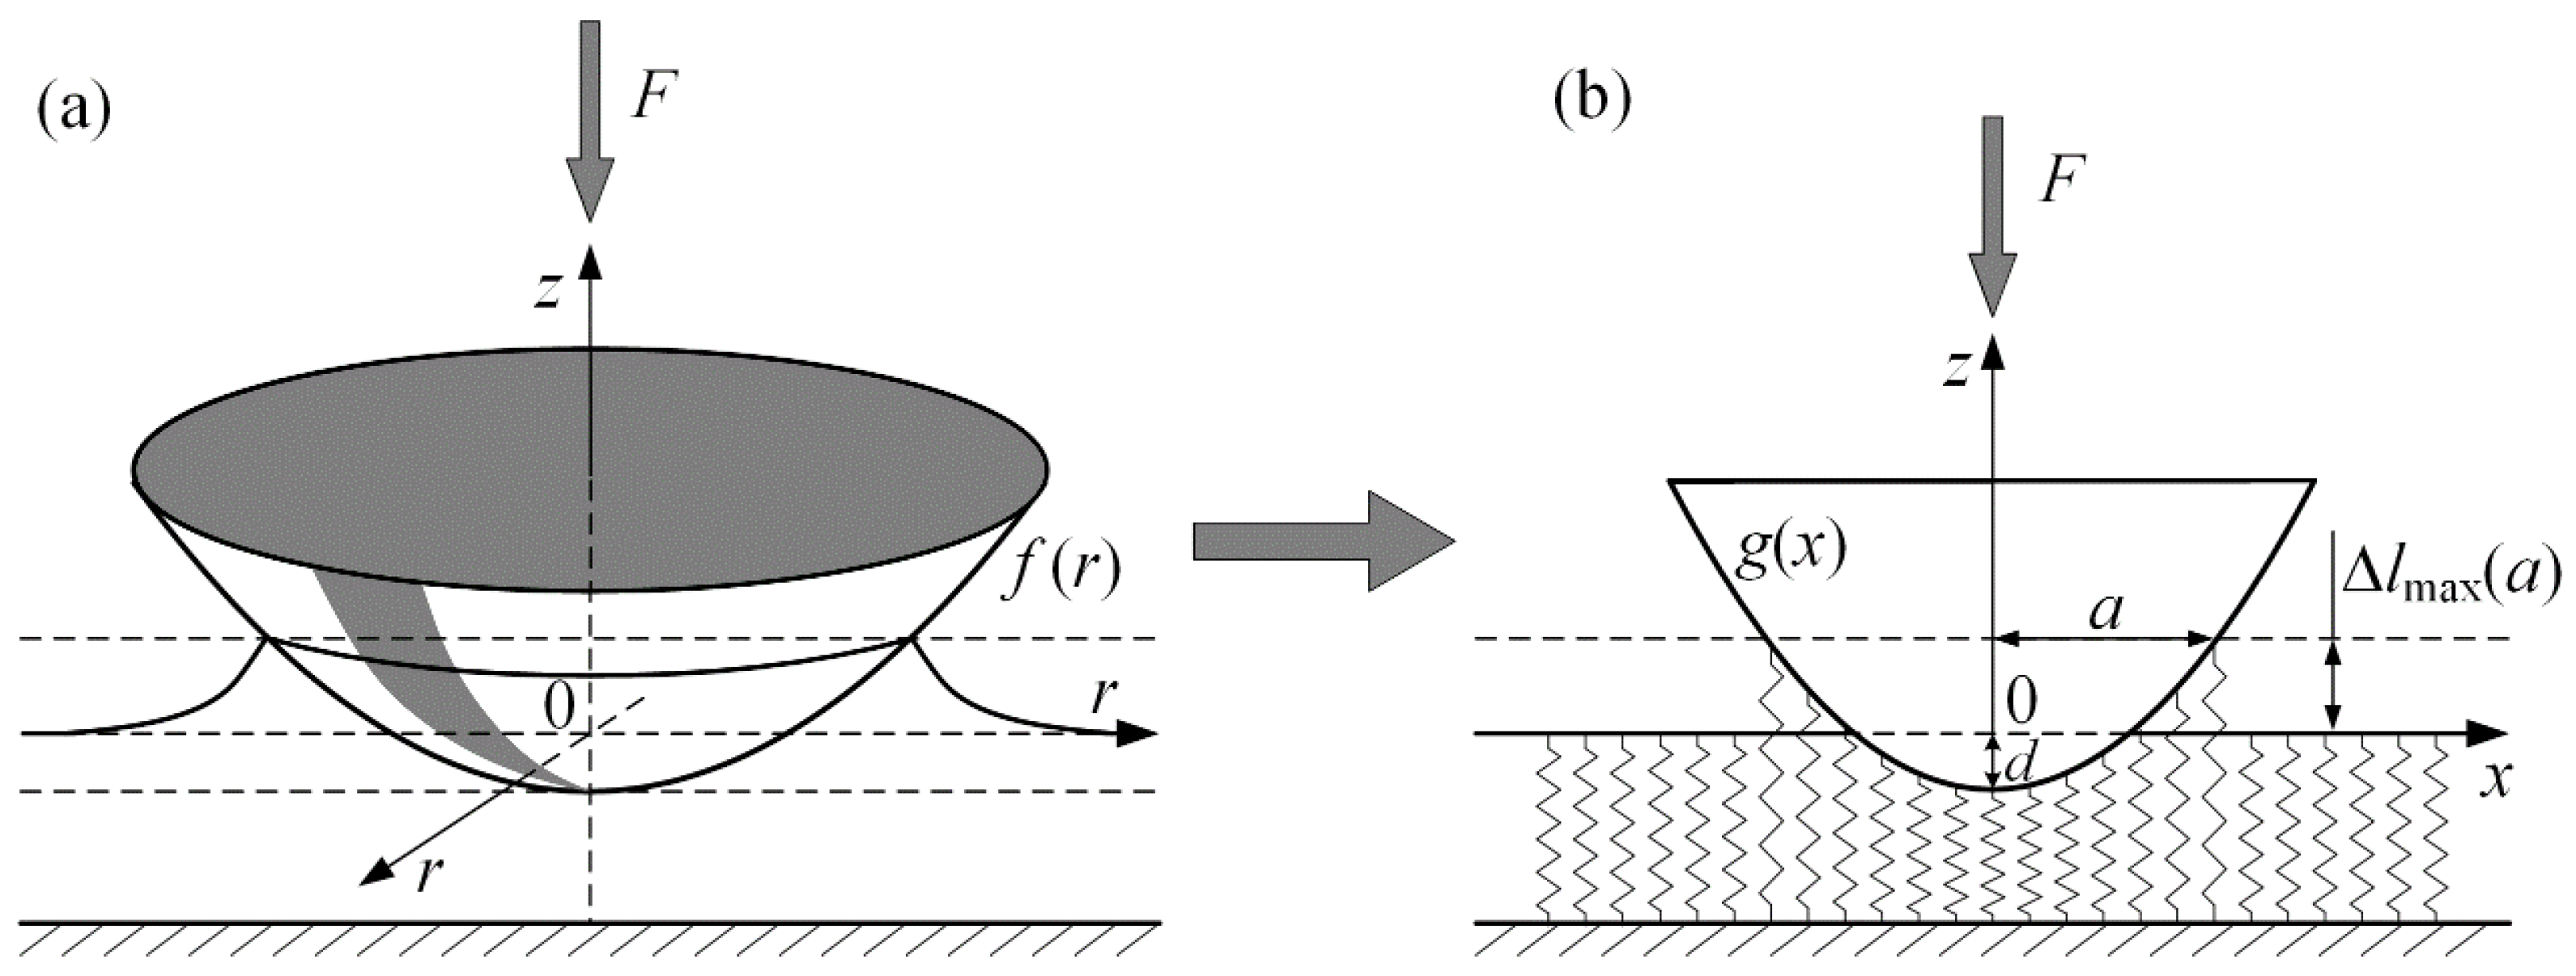
4.1. Formalism of the Model
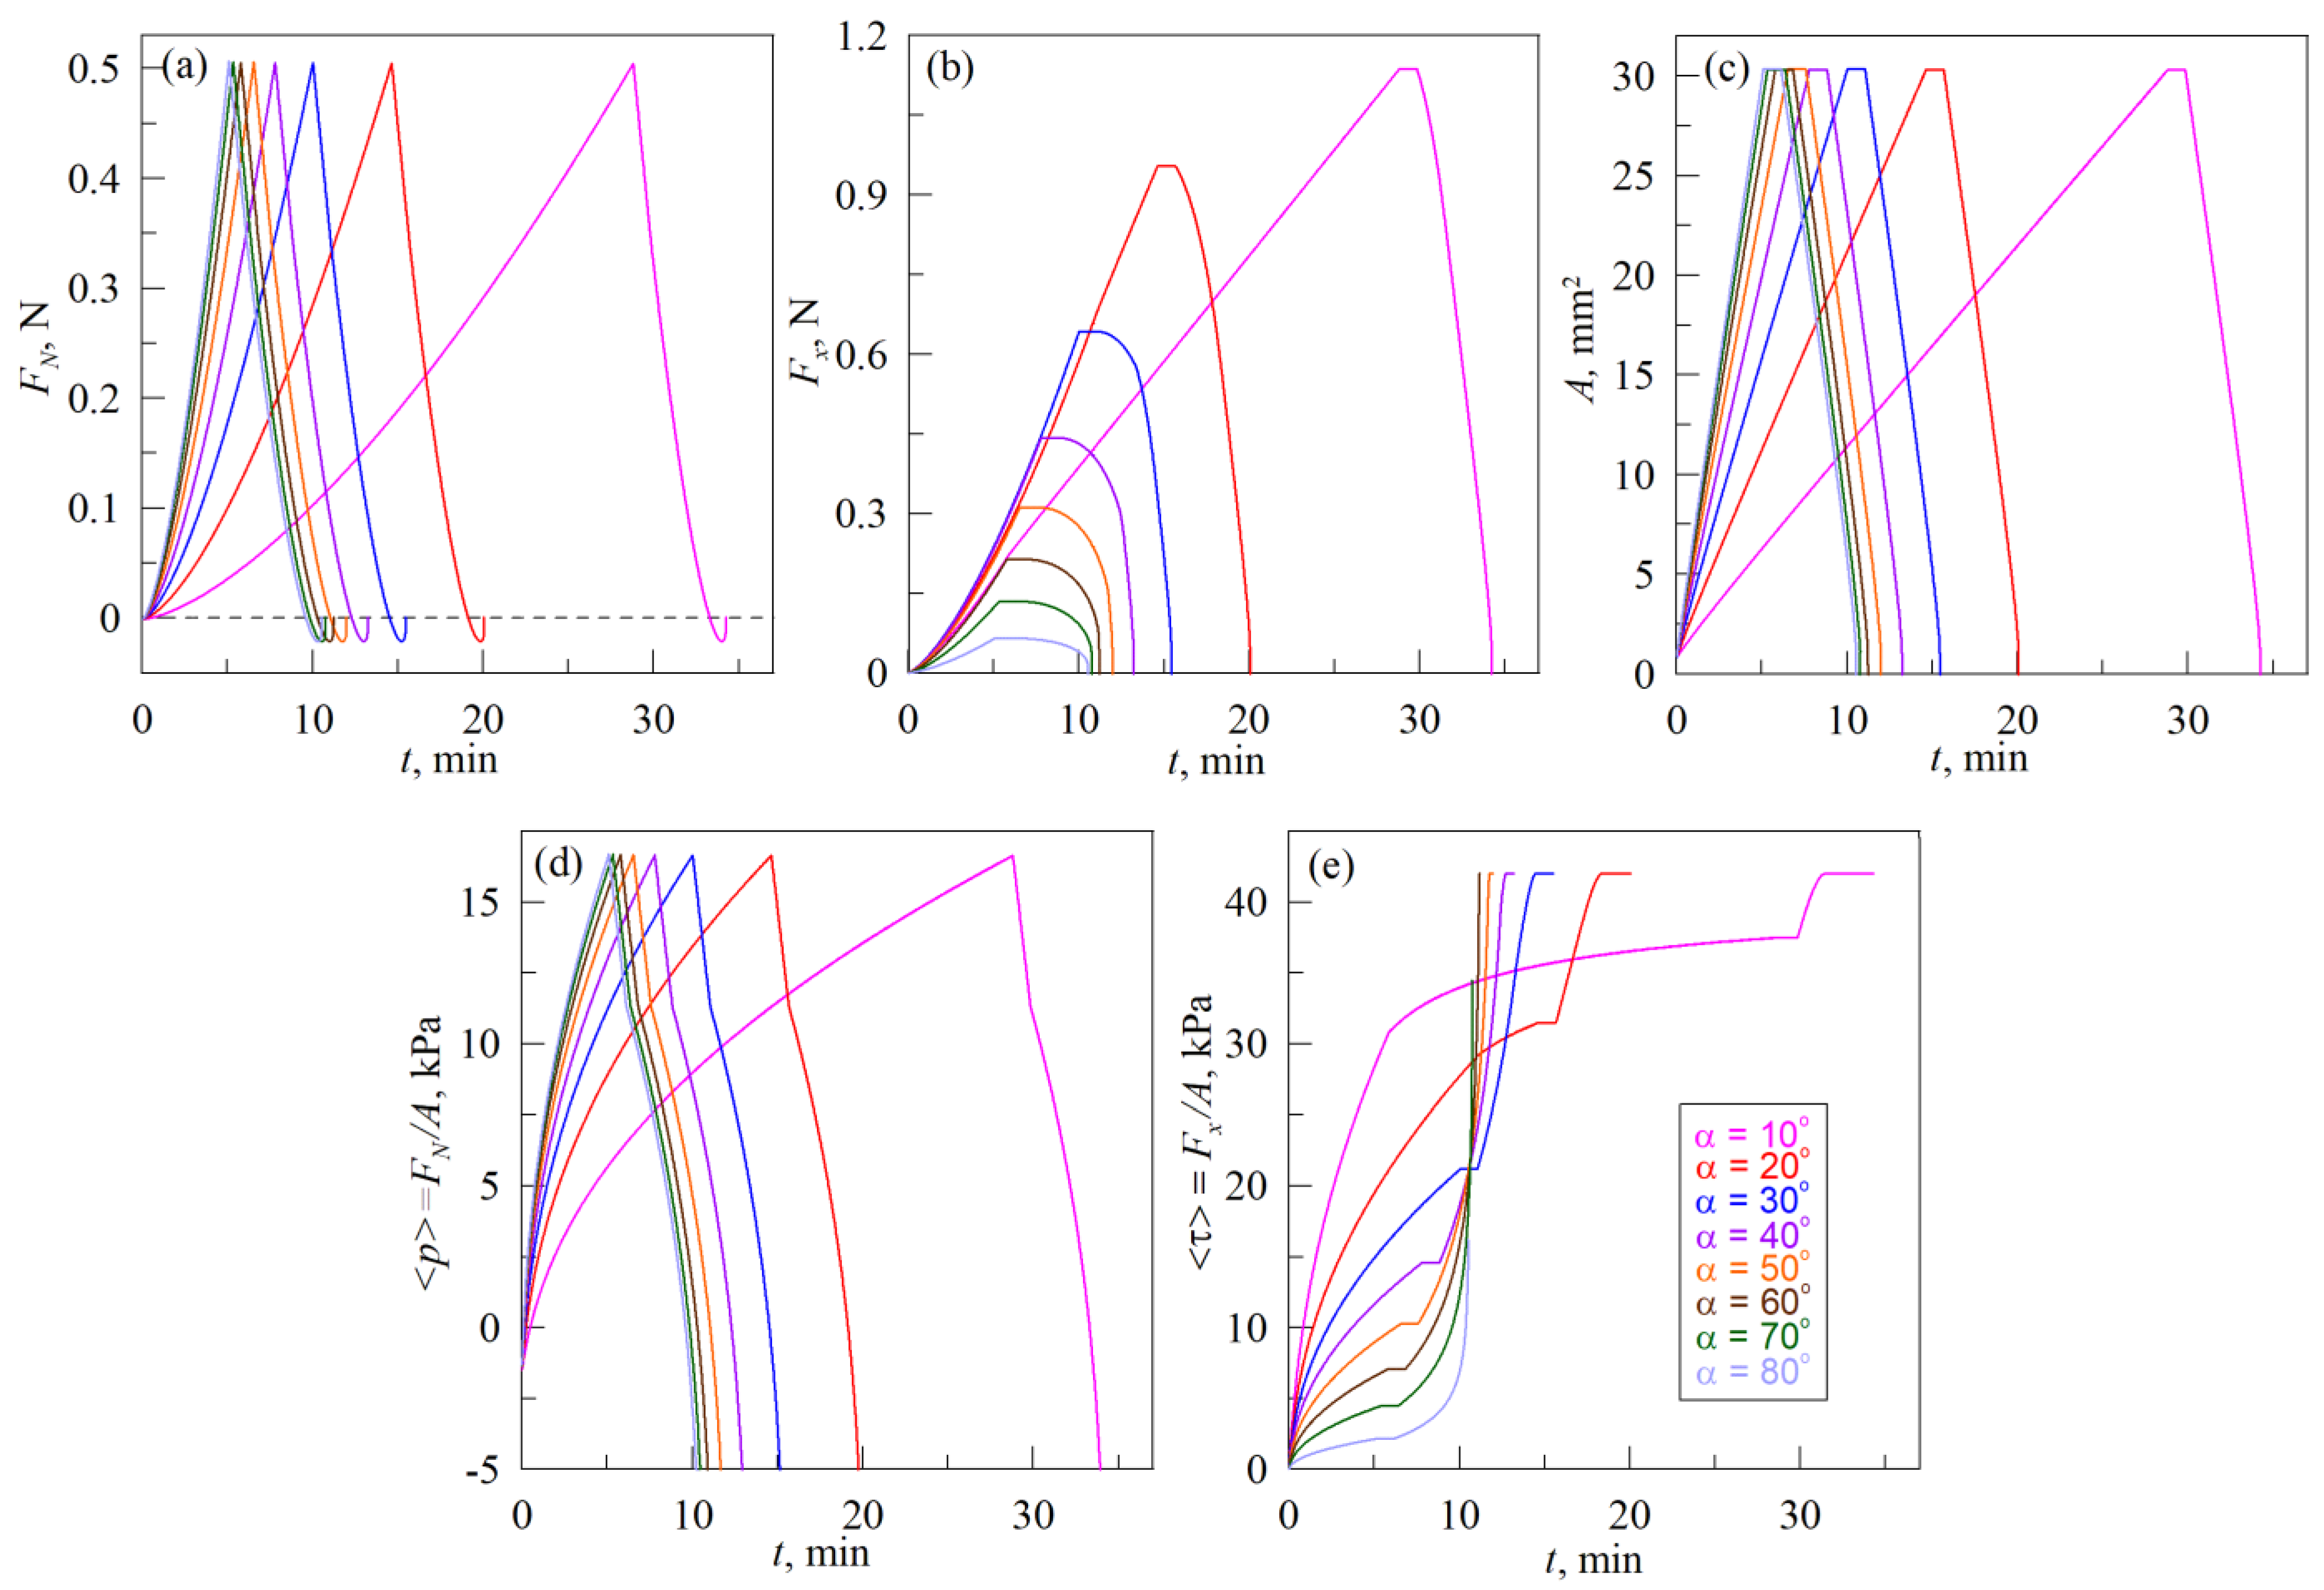
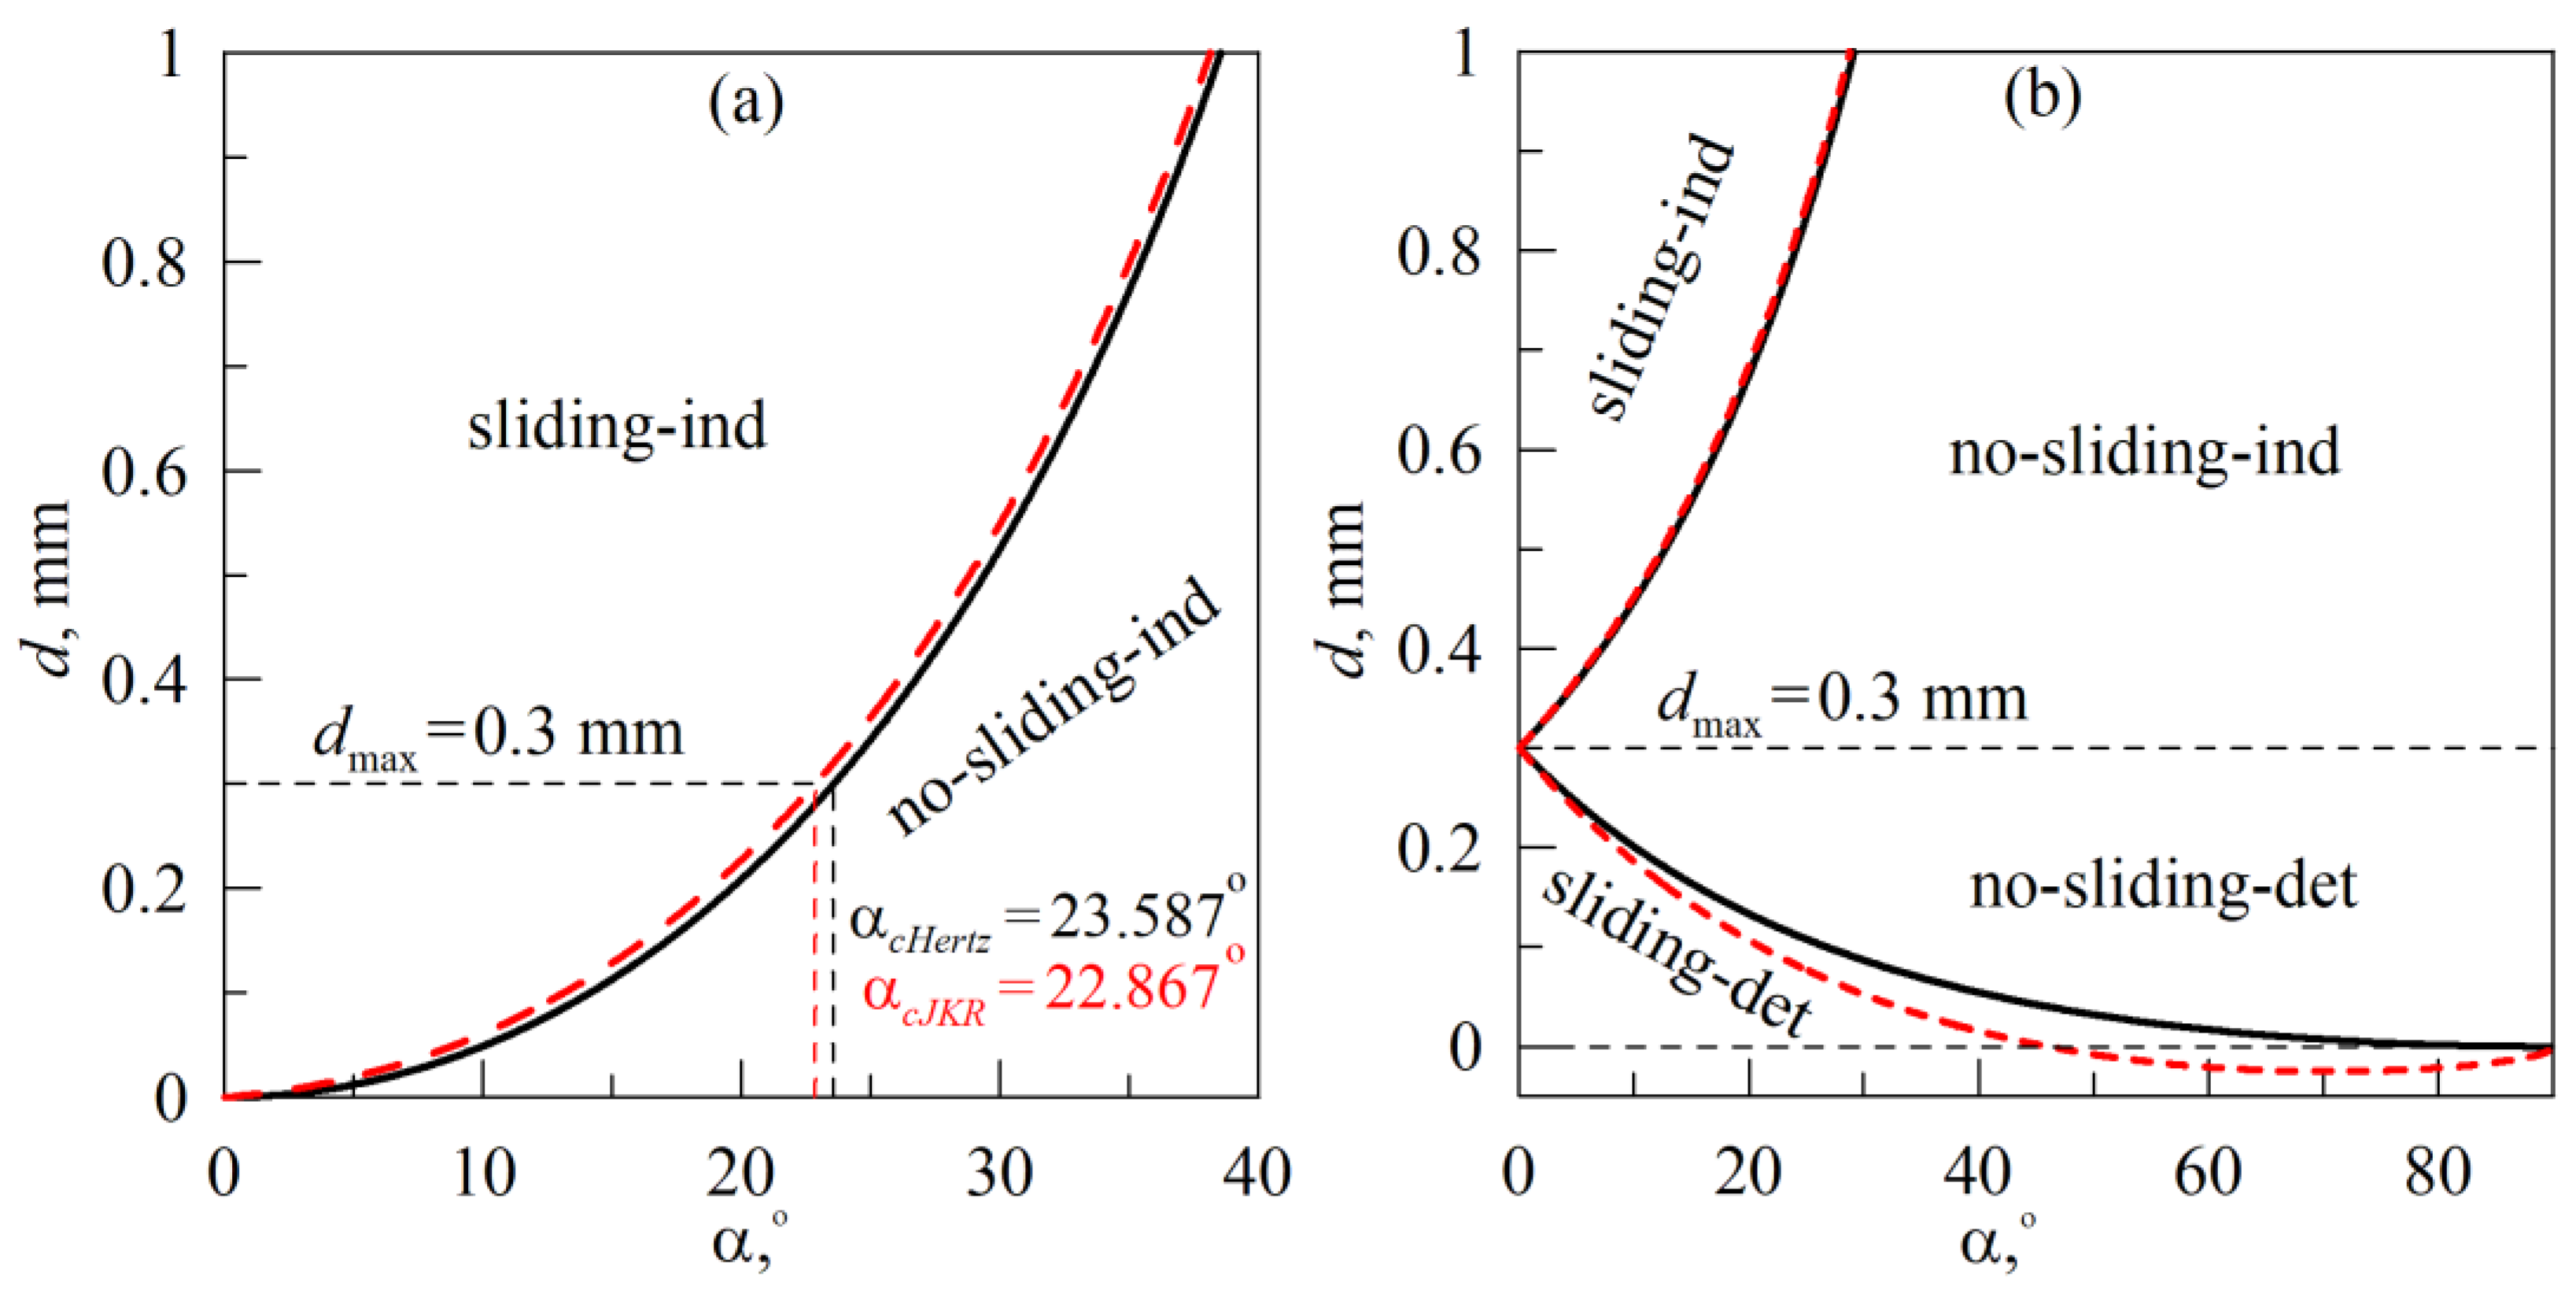
4.2. Results of the Simulation
5. Conclusions
Supplementary Materials
Author Contributions
Funding
Institutional Review Board Statement
Informed Consent Statement
Data Availability Statement
Conflicts of Interest
References
- Springer, T.A. Adhesion receptors of the immune system. Nature 1990, 346, 425–434. [Google Scholar] [CrossRef] [PubMed]
- Hermansson, M. The DLVO theory in microbial adhesion. Colloids Surf. B Biointerfaces 1999, 14, 105–119. [Google Scholar] [CrossRef]
- Berne, C.; Ellison, C.K.; Ducret, A.; Brun, Y.V. Bacterial adhesion at the single-cell level. Nat. Rev. Microbiol. 2018, 16, 616–627. [Google Scholar] [CrossRef]
- Gao, H.; Wang, X.; Yao, H.; Gorb, S.; Arzt, E. Mechanics of hierarchical adhesion structures of geckos. Mech. Mater. 2005, 37, 275–285. [Google Scholar] [CrossRef]
- Büscher, T.H.; Buckley, T.R.; Grohmann, C.; Gorb, S.N.; Bradler, S. The Evolution of Tarsal Adhesive Microstructures in Stick and Leaf Insects (Phasmatodea). Front. Ecol. Evol. 2018, 6, 69. [Google Scholar] [CrossRef]
- Huber, G.; Mantz, H.; Spolenak, R.; Mecke, K.; Jacobs, K.; Gorb, S.N.; Arzt, E. Evidence for capillarity contributions to gecko adhesion from single spatula nanomechanical measurements. Proc. Natl. Acad. Sci. USA 2005, 102, 16293. [Google Scholar] [CrossRef] [PubMed]
- Higham, T.E.; Russell, A.P.; Niewiarowski, P.H.; Wright, A.; Speck, T. The Ecomechanics of Gecko Adhesion: Natural Surface Topography, Evolution, and Biomimetics. Commun. Integr. Biol. 2019, 59, 148–167. [Google Scholar] [CrossRef]
- Li, J.; Zhang, Y.; Liu, S.; Liu, J. Insights into adhesion of abalone: A mechanical approach. J. Mech. Behav. 2018, 77, 331–336. [Google Scholar] [CrossRef]
- van den Boogaart, L.M.; Langowski, J.K.A.; Amador, G.J. Studying Stickiness: Methods, Trade-Offs, and Perspectives in Measuring Reversible Biological Adhesion and Friction. Biomimetics 2022, 7, 134. [Google Scholar] [CrossRef]
- Tang, T.; Hou, X.; Xiao, Y.; Su, Y.; Shi, Y.; Rao, X. Research on motion characteristics of space truss-crawling robot. Int. J. Adv. Robot. Syst. 2019, 16, 1. [Google Scholar] [CrossRef]
- Johnson, K.L.; Kendall, K.; Roberts, A.D. Surface energy and the contact of elastic solids. Proc. R. Soc. Lond. A 1971, 324, 301–313. [Google Scholar] [CrossRef]
- Derjaguin, B.V.; Muller, V.M.; Toporov, Y.P. Effect of contact deformations on the adhesion of particles. JCIS 1975, 53, 314–326. [Google Scholar] [CrossRef]
- Maugis, D. Adhesion of spheres: The JKR-DMT transition using a dugdale model. JCIS 1992, 150, 243–269. [Google Scholar] [CrossRef]
- Waters, J.F.; Guduru, P.R. Mode-mixity-dependent adhesive contact of a sphere on a plane surface. Proc. R. Soc. A 2010, 466, 1303–1325. [Google Scholar] [CrossRef]
- Attard, P. Interaction and Deformation of Elastic Bodies: Origin of Adhesion Hysteresis. J. Phys. Chem. B 2000, 104, 10635–10641. [Google Scholar] [CrossRef]
- Diao, D.; Kandori, A. Finite element analysis of the effect of interfacial roughness and adhesion strength on the local delamination of hard coating under sliding contact. Tribol. Int. 2006, 39, 849–855. [Google Scholar] [CrossRef]
- Nguyen, T.; Gu, Y. Investigation of Cell-Substrate Adhesion Properties of Living Chondrocyte by Measuring Adhesive Shear Force and Detachment Using AFM and Inverse FEA. Sci. Rep. 2016, 6, 38059. [Google Scholar] [CrossRef]
- Lorentz, B.; Albers, A. A numerical model for mixed lubrication taking into account surface topography, tangential adhesion effects and plastic deformations. Tribol. Int. 2013, 59, 259–266. [Google Scholar] [CrossRef]
- Bazrafshan, M.; de Rooij, M.B.; Schipper, D.J. The effect of adhesion and roughness on friction hysteresis loops. Int. J. Mech. Sci. 2019, 155, 9–18. [Google Scholar] [CrossRef]
- de Beer, S.; Kenmoé, G.D.; Müser, M.H. On the friction and adhesion hysteresis between polymer brushes attached to curved surfaces: Rate and solvation effects. Friction 2015, 3, 148–160. [Google Scholar] [CrossRef]
- Khajeh Salehani, M.; Irani, N.; Müser, M.H.; Nicola, L. Modelling coupled normal and tangential tractions in adhesive contacts. Tribol. Int. 2018, 124, 93–101. [Google Scholar] [CrossRef]
- Pérez-Ràfols, F.; Nicola, L. Incipient sliding of adhesive contacts. Friction 2022, 10, 963–976. [Google Scholar] [CrossRef]
- Waghmare, A.K.; Sahoo, P. Adhesive friction at the contact between rough surfaces using n-point asperity model. Eng. Sci. Technol. Int. J. 2015, 18, 463–474. [Google Scholar] [CrossRef]
- Papangelo, A.; Scheibert, J.; Sahli, R.; Pallares, G.; Ciavarella, M. Shear-induced contact area anisotropy explained by a fracture mechanics model. Phys. Rev. E 2019, 99, 053005. [Google Scholar] [CrossRef] [PubMed]
- Immel, K.; Nguyen, V.-H.; Haïat, G.; Sauer, R.A. Modeling the debonding process of osseointegrated implants due to coupled adhesion and friction. Biomech. Model Mechanobiol. 2023, 22, 133–158. [Google Scholar] [CrossRef]
- Nadimi, S.; Otsubo, M.; Fonseca, J.; O’Sullivan, C. Numerical modelling of rough particle contacts subject to normal and tangential loading. Granul. Matter 2019, 21, 108. [Google Scholar] [CrossRef]
- Homola, A.M.; Israelachvili, J.N.; McGuiggan, P.M.; Gee, M.L. Fundamental experimental studies in tribology: The transition from “interfacial” friction of undamaged molecularly smooth surfaces to “normal” friction with wear. Wear 1990, 136, 65–83. [Google Scholar] [CrossRef]
- Pengfei, L.; Shuying, W.; Yufeng, S.; Junsheng, Y.; Jinyang, F.; Feng, Y. Tangential Adhesion Strength between Clay and Steel for Various Soil Softnesses. J. Mater. Civ. Eng. 2019, 31, 04019048. [Google Scholar] [CrossRef]
- Yao, H.; Della Rocca, G.; Guduru, P.R.; Gao, H. Adhesion and sliding response of a biologically inspired fibrillar surface: Experimental observations. J. R. Soc. Interface 2008, 5, 723–733. [Google Scholar] [CrossRef]
- Sahli, R.; Pallares, G.; Ducottet, C.; Ben Ali, I.E.; Al Akhrass, S.; Guibert, M.; Scheibert, J. Evolution of real contact area under shear and the value of static friction of soft materials. Proc. Natl. Acad. Sci. USA 2018, 115, 471–476. [Google Scholar] [CrossRef]
- Popov, V.L.; Heß, M.; Willert, E. Handbook of Contact Mechanics: Exact Solutions of Axisymmetric Contact Problems; Springer: Berlin, Germany, 2019. [Google Scholar] [CrossRef]
- Lyashenko, I.A.; Popov, V.L.; Borysiuk, V. Experimental verification of the boundary element method for adhesive contacts of a coated elastic half-space. Lubricants 2023, 11, 84. [Google Scholar] [CrossRef]
- Lyashenko, I.A.; Popov, V.L.; Pohrt, R.; Borysiuk, V. High-Precision Tribometer for Studies of Adhesive Contacts. Sensors 2023, 23, 456. [Google Scholar] [CrossRef]
- Lyashenko, I.A.; Popov, V.L. Hysteresis in an adhesive contact upon a change in the indenter direction of motion: An experiment and phenomenological model. Tech. Phys. 2021, 66, 672–690. [Google Scholar] [CrossRef]
- Lyashenko, I.A.; Popov, V.L. Dissipation of mechanical energy in an oscillating adhesive contact between a hard indenter and an elastomer. Tech. Phys. Lett. 2020, 46, 1092–1095. [Google Scholar] [CrossRef]
- Lyashenko, I.A.; Li, Q.; Popov, V.L. Influence of chemical heterogeneity and third body on adhesive strength: Experiment and simulation. Front. Mech. Eng. 2021, 7, 658858. [Google Scholar] [CrossRef]
- Popov, V.L.; Li, Q.; Lyashenko, I.A.; Pohrt, R. Adhesion and friction in hard and soft contacts: Theory and experiment. Friction 2021, 9, 1688–1706. [Google Scholar] [CrossRef]
- Lyashenko, I.A.; Filippov, A.E.; Popov, V.L. Friction in Adhesive Contacts: Experiment and Simulation. Machines 2023, 11, 583. [Google Scholar] [CrossRef]
- Greenwood, J.A. Reflections on and Extensions of the Fuller and Tabor Theory of Rough Surface Adhesion. Tribol. Lett. 2017, 65, 159. [Google Scholar] [CrossRef]
- Deng, W.; Kesari, H. Depth-dependent hysteresis in adhesive elastic contacts at large surface roughness. Sci. Rep. 2019, 9, 1639. [Google Scholar] [CrossRef]
- Liu, J.-L.; Xia, R. A unified analysis of a micro-beam, droplet and CNT ring adhered on a substrate: Calculation of variation with movable boundaries. Acta Mech. Sin. 2013, 29, 62–72. [Google Scholar] [CrossRef]
- Schallamach, A. How does rubber slide? Wear 1971, 17, 301–312. [Google Scholar] [CrossRef]
- Barquins, M. Sliding Friction of Rubber and Schallamach Waves—A Review. Mater. Sci. Eng. 1985, 73, 45–63. [Google Scholar] [CrossRef]
- Rand, C.J.; Crosby, A.J. Insight into the periodicity of Schallamach waves in soft material friction. Appl. Phys. Lett. 2006, 89, 261907. [Google Scholar] [CrossRef]
- Viswanathan, K.; Chandrasekar, S. Fifty years of Schallamach waves: From rubber friction to nanoscale fracture. Philos. Trans. R. Soc. A 2022, 380, 20210339. [Google Scholar] [CrossRef] [PubMed]
- Zhibo, C.; Zhaoqian, S.; Dandan, H.; Genzong, L.; Jian, W.; Benlong, S.; Yuyan, L.; Youshan, W. From small wrinkles to Schallamach waves during rubber friction: In situation experiment and 3D simulation. Polym. Test. 2021, 96, 107084. [Google Scholar] [CrossRef]
- Forsbach, F. A Simple Semi-Analytical Method for Solving Axisymmetric Contact Problems Involving Bonded and Unbonded Layers of Arbitrary Thickness. Machines 2023, 11, 474. [Google Scholar] [CrossRef]
- Popov, V.L.; Lyashenko, I.A.; Filippov, A.E. Influence of tangential displacement on the adhesion strength of a contact between a parabolic profile and an elastic half-space. R. Soc. Open Sci. 2017, 4, 161010. [Google Scholar] [CrossRef]
- Hertz, H. Ueber die Berührung fester elastischer Körper. J. Reine Angew. Math. 1881, 92, 156–171. [Google Scholar] [CrossRef]


Disclaimer/Publisher’s Note: The statements, opinions and data contained in all publications are solely those of the individual author(s) and contributor(s) and not of MDPI and/or the editor(s). MDPI and/or the editor(s) disclaim responsibility for any injury to people or property resulting from any ideas, methods, instructions or products referred to in the content. |
© 2023 by the authors. Licensee MDPI, Basel, Switzerland. This article is an open access article distributed under the terms and conditions of the Creative Commons Attribution (CC BY) license (https://creativecommons.org/licenses/by/4.0/).
Share and Cite
Lyashenko, I.A.; Popov, V.L.; Borysiuk, V. Indentation and Detachment in Adhesive Contacts between Soft Elastomer and Rigid Indenter at Simultaneous Motion in Normal and Tangential Direction: Experiments and Simulations. Biomimetics 2023, 8, 477. https://doi.org/10.3390/biomimetics8060477
Lyashenko IA, Popov VL, Borysiuk V. Indentation and Detachment in Adhesive Contacts between Soft Elastomer and Rigid Indenter at Simultaneous Motion in Normal and Tangential Direction: Experiments and Simulations. Biomimetics. 2023; 8(6):477. https://doi.org/10.3390/biomimetics8060477
Chicago/Turabian StyleLyashenko, Iakov A., Valentin L. Popov, and Vadym Borysiuk. 2023. "Indentation and Detachment in Adhesive Contacts between Soft Elastomer and Rigid Indenter at Simultaneous Motion in Normal and Tangential Direction: Experiments and Simulations" Biomimetics 8, no. 6: 477. https://doi.org/10.3390/biomimetics8060477
APA StyleLyashenko, I. A., Popov, V. L., & Borysiuk, V. (2023). Indentation and Detachment in Adhesive Contacts between Soft Elastomer and Rigid Indenter at Simultaneous Motion in Normal and Tangential Direction: Experiments and Simulations. Biomimetics, 8(6), 477. https://doi.org/10.3390/biomimetics8060477