Abstract
Sand cat swarm optimization algorithm (SCSO) keeps a potent and straightforward meta-heuristic algorithm derived from the distant sense of hearing of sand cats, which shows excellent performance in some large-scale optimization problems. However, the SCSO still has several disadvantages, including sluggish convergence, lower convergence precision, and the tendency to be trapped in the topical optimum. To escape these demerits, an adaptive sand cat swarm optimization algorithm based on Cauchy mutation and optimal neighborhood disturbance strategy (COSCSO) are provided in this study. First and foremost, the introduction of a nonlinear adaptive parameter in favor of scaling up the global search helps to retrieve the global optimum from a colossal search space, preventing it from being caught in a topical optimum. Secondly, the Cauchy mutation operator perturbs the search step, accelerating the convergence speed and improving the search efficiency. Finally, the optimal neighborhood disturbance strategy diversifies the population, broadens the search space, and enhances exploitation. To reveal the performance of COSCSO, it was compared with alternative algorithms in the CEC2017 and CEC2020 competition suites. Furthermore, COSCSO is further deployed to solve six engineering optimization problems. The experimental results reveal that the COSCSO is strongly competitive and capable of being deployed to solve some practical problems.
1. Introduction
Throughout history, optimization issues have been presented in all dimensions of people’s lives, such as in finance, science, engineering, etc. Nevertheless, with the development of society, optimization issues have become progressively more intricate. Traditional optimization methods, such as the Lagrange multiplier method, the complex method, queuing theory, and so on, require explicit descriptions of conditions and can only solve smaller optimization problems, which cannot be tackled exactly in a limited time. At the same time, for nonlinear engineering problems with a large quantity of constraints and decision variables, traditional optimization methods tend to get caught in the local optimum instead of sourcing the global optimal solution. Therefore, drawing inspiration from numerous manifestations in nature, researchers have devised a host of powerful and accessible meta-heuristic algorithms that, it is worth noting, can strike a superior balance between hopping out of the topical optimum and converging to a single point in order to arrive at a global optimum and solve sophisticated optimization problems.
The algorithms have been grouped I”to f’ve principal categories based on the inspiration used to create them: (1). Human-based optimization algorithms are designed based on human brain thinking, systems, organs, and social evolution. An example is the well-known neural network algorithm (NNA) [1], which tackles problems in ways informed by the message transmission of neural networks in the human brain. The Harmony Search (HS) [2,3] algorithm simulates a musician’s ability to achieve a pleasing harmonic state by repeatedly adjusting the pitch through recall. (2). Those that emulate natural evolution are classified as evolutionary-based optimization algorithms. The genetic algorithm (GA) [4] is the most classical model for simulating evolution, in which chromosomes pass through a cycle of stages to form descendants that leave more adaptive individuals through the laws and methods of superiority and inferiority. Simultaneously, the differential evolution (DE) [5,6] algorithm, imperial competition algorithm (ICA) [7], and memetic algorithm (MA) [8] also belong to the algorithms based on evolutionary mechanisms. (3). Population-based optimization algorithms are modeled to simulate the reproduction, predation, migration, and other behaviors of a colony of organisms. In this class of algorithm, the individuals in the population are conceived as quality-free particles seeking the best position. Ant colony optimization (ACO) [9,10] exploits the ideology of ants searching for the shortest distance from the nest to food. Particle swarm optimization (PSO) [11], stemming from the feeding of birds, is the most broadly accepted swarm intelligence algorithm. The moth-flame optimization (MFO) [12] algorithm serves as a mathematical model that is built by simulating the special navigation of a moth, which spirals close to a light source until it “flames”. Other swarm intelligence algorithms include the gray wolf optimization (GWO) [13] algorithm, manta ray foraging optimization (MRFO) algorithm [14], artificial hummingbird algorithm (AHA) [15], dwarf mongoose optimization (DMO) [16], and chimpanzee optimization algorithm (CHOA) [17,18], etc. (4). Plant growth-based optimization algorithms. Such algorithms are devised inspired by the properties of plants, such as photosynthesis, flower pollination, and seed dispersal. The dandelion optimization (DO) [19] algorithm is inspired by its process of rising, falling, and landing in different weather conditions depending on the wind. The one that simulates the aggressive invasion of weeds, searches for a suitable living space, and utilizes natural resources for rapidly growing and reproducing is denoted as invasive weed optimization (IWO) [20]. (5). Physics-based optimization algorithms are created in accordance with physical phenomena and regulations in nature. The gravitational search algorithm (GSA) [21], which is derived from gravity, has a robust global search capability and a fast convergence rate. The artificial raindrop optimization algorithm (ARA) [22] is designed on the basis of the processes of raindrop formation, landing, collision, confluence, and finally evaporation as water vapor.
Especially, many algorithms have been implemented for many practical engineering problems on account of their excellent performance, such as feature selection [23,24,25], image segmentation [26,27], signal processing [28], construction of water facilities [29], path planning for walking robots [30,31], job-shop scheduling problems [32], and piping and wiring problems in industrial and agricultural production [33]. Unlike gradient-based optimization algorithms, meta-heuristic algorithms rely on probabilistic search rather than gradient-based execution. With no centralized control constraints, the failure of individual individuals does not affect the solution of the whole problem, ensuring a more stable search process. As a general rule, as a first step, it is necessary to appropriately setup the essential parameters in the algorithm and produce a stochastic collection of initial solutions. Next, the search mechanism of the algorithm is applied to help find the optimum value until the stopping constraint is attained or the optimum value is discovered [34]. Nevertheless, it is evident that there are two different aspects to every algorithm; there are merits and demerits, and the performance will fluctuate based on the problem being addressed. No free lunch (NFL) [35] claims that an algorithm is capable of addressing one or more optimization problems, but there is no scientific foundation for the idea that it is possible to successfully tackle other optimization problems. Therefore, facing several special problems, it is sensible to propose a variety of strategies to enhance the efficiency of the algorithm.
The sand cat swarm optimization algorithm is a recently published, completely new swarm intelligence algorithm. In [36], SCSO is tested with some other popular algorithms (such as PSO and GWO) on different test functions, and better results or at least comparable results are achieved, but they can still be further improved. As a result, this paper provides an enhancement to tackle the optimization problem with the following primary contributions:
- (1)
- The COSCSO with better performance is designed by adding three strategies to SCSO.
In the first place, the nonlinear adaptive parameters replace the original linear parameters to increase the global search and prevent it from being caught in a topical optimum.
In second place, the Cauchy mutation operator strategy expedites the convergence speed.
In the end, optimal neighborhood disturbance enriches population diversity.
- (2)
- The enhanced algorithm is instrumented on test suites of different dimensions and on real engineering optimization problems.
Analyzing the balance of COSCSO exploration and exploitation on the 30-dimensional CEC2019 test suite.
Comparing with other competitive algorithms on the CEC2017 test suite and the CEC2020 test suite of 30 and 50 dimensions.
The improved algorithm is deployed on six engineering optimization problems in conjunction with nine other algorithms.
The remaining details of the paper are described below. The second part describes the relevant work on SCSO, with the third part consisting of a summary review of the original algorithm for sand cat swarm search for attacking prey. The fourth part elaborates on the three improvement strategies in detail. The fifth part presents an analysis of the comparative data of COSCSO, SCSO, and other optimization algorithms, while the superiority of COSCSO is illustrated. In the sixth part, six engineering examples are collected to verify the capabilities of COSCSO with other algorithms in addressing real-world problems. The final part is the conclusion.
2. Related Works
Since the emergence of the sand cat swarm optimization algorithm, considerable attention has been paid to it by researchers due to its excellence. Vahid Tavakol Aghaei, Amir SeyyedAbbasi et al. [37] applied COSCSO to address three diverse nonlinear control systems for inverted pendulum, Furuta pendulum, and Acrobat robotic arm. It has been shown through simulation experiments that SCSO is simple and accessible and can be a viable candidate for real-world control and engineering problems. In addition, several researchers have optimized the SCSO for greater performance. Firstly, Li et al. [38] designed an elite collaboration strategy with stochastic variation to select the top three sand cats in the population for adaptation, and the three elites assigned different weights cooperated to form a new sand cat position to guide the search process, avoiding the dilemma of being entangled in a local optimum. Secondly, Amir Seyyedabbasi et al. [39] combined SCSO with reinforcement learning techniques to better balance the exploration and exploitation processes and further solve the mobile node localization problem in wireless sensor networks. Finally, the ISCSO proposed by Lu et al. [40] effectively boosts the fault diagnosis performance of power transformers.
3. The Sand Cat Swarm Optimization
The sand cat swarm optimization (SCSO) algorithm is a remarkably new meta-heuristic optimization algorithm proposed by Amir Seyyedabbasi et al. in 2022. Sand cats live in very barren deserts and mountainous areas. Gerbils, hares, snakes, and insects are their dominant sources of food. In appearance, sand cats are similar to domestic cats, but one big difference is that their hearing is very sensitive and they can detect low-frequency noise below 2 kHz. Therefore, they can use this special skill to find and attack their prey very quickly. The process from discovery to prey capture is shown in Figure 1. We can compare the sand cat’s predation to the process of finding the optimal value, which is the inspiration of the algorithm.

Figure 1.
Sand cat capturing prey diagram.
3.1. Initialization
Originally, it is initialized in a randomized manner so that the sand cats are evenly distributed in the exploration area:
where lb and ub are the upper and lower bounds of the variable, and rand is a random number between 0 and 1.
The resulting initial matrix is shown below:
where denotes the jth dimension of the ith individual, and there are a total of N individuals and M variables. Meanwhile, the matrix of the fitness function is shown below:
After comparing all fitness values, the minimum value is found, and the individual corresponding to it is the current optimal one.
3.2. Searching for Prey (Exploration)
The sand cat searches for prey mainly using its very sharp sense of hearing, which can detect low-frequency noise below 2 kHz. Then its mathematical model in the prey-finding stage is shown as follows:
where , denotes the general sensitivity range of the sand cats, whose value decreases linearly from 2 to 0, and re is the sensitivity range of a particular sand cat in the sand cat swarm. t is the immediate count of the iteration, and T depicts the utmost count of iterations for the entire search process. is any one of the populations, and is the immediate position of the sand cat. Notably, when , , the latest position of the sand cat will also be assigned to 0 according to Equation (6), also in the search space. Furthermore, in order to guarantee a steady state between the exploration and exploitation phases, Re is put forward, and , its value is given by Equation (7).
3.3. Grabbing Prey (Exploitation)
As the search process progresses and the sand cat attacks the prey found in the previous stage, its mathematical modeling of the prey attack phase is as follows:
where dist is the distance between the best and the current individual. is a random angle from 0 to 360.
3.4. Bridging Phase
The conversion of SCSO from the exploration phase to exploitation is closely associated with the parameter Re. When , the sand cat gets in close and captures the prey, which is in the exploitation phase; when , it continues to search different spaces to find the location of the prey, which is in the exploration phase. The pseudo-code of SCSO is seen in [36]. The mathematical modeling at this time is:
4. Improved Sand Cat Swarm Optimization
In SCSO, the sand cat uses its powerful ability to recognize lower-profile noise below 2 kHz to capture prey, although the algorithm is straightforward and accessible to implement and allows for iterating quickly until the best position is found. However, there are some shortcomings, such as the tendency to be stuck in the topical optimum and excessive premature convergence. So now this algorithm is optimized and improved. In this paper, three strategies will be taken, namely: nonlinear adaptive parameter, Cauchy mutation strategy, and optimal neighborhood disturbance strategy.
4.1. Nonlinear Adaptive Parameters
In SCSO, the parameter Se plays a very prominent role; firstly, it indicates the sensitivity range of the sand cat hearing. Secondly, it influences the size of the parameter Re, which is in turn accountable for equilibrating the global search and local exploitation phases of the iterative process, and thus Se is also a parameter that coordinates the exploration and exploitation phases. Finally, it is also a crucial component of the convergence factor re, which affects the speed of convergence during the iteration. Whereas in the original algorithm, Se decreases linearly from 2 to 0. This idealized law is not representative of the actual sand cat’s predation ability, so a nonlinear adaptive parameter strategy is now utilized with the formula as in Equation (11).
Here, , and .
The variation curves before and after the improvement of parameter Se are displayed in Figure 2. Comparing the two curves, we can see that the modified Se has a larger value in the preliminary portion of the optimization process, focusing on the global search; moreover, due to the perturbation of qt, the value of Se sometimes becomes smaller in the optimization process, which can cater for the local search at this time, forming a faster convergence speed and enabling a more precise search accuracy. In the posterior part of the optimization process, the value is on the lower side, focusing on the local search, and due to the perturbation of qt, the value of Se sometimes becomes larger in the optimization process, which ensures that the algorithm avoids becoming bogged down in local optima.
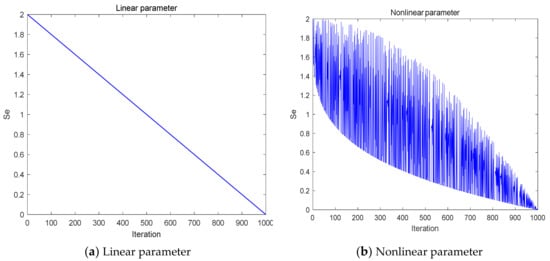
Figure 2.
The curve of the variation of parameter Se.
4.2. Cauchy Mutation Strategy
The Cauchy distribution is distinguished by long tails at both ends and a larger peak at the central origin. The introduction of the Cauchy mutation operator [41,42,43] as a mutational step provides each sand cat with a greater likelihood of skipping to a better place. Once obtaining the local optimal solution, the Cauchy mutation operator perturbs the step size, making the step size larger, which in turn causes the sand cat to jump away from the local optimal position. Conversely, this operator makes the step size smaller and speeds up the convergence when the individual is pursuing the global optimum. The Cauchy mutation has been integrated with many algorithms, such as MFO and CSO. The Cauchy distribution function and the probability density function of the Cauchy distribution are described as follows:
where x0 is referred to as the position parameter at the maximum and γ is the size parameter of half the distance at half the width of the peak. Here , the standard Cauchy distribution is obtained, and its probability density function is as in Equation (14), and Figure 3 is the probability density function curve of the standard Cauchy distribution.

Figure 3.
Curve of the probability density function of the Cauchy distribution.
To diminish the probability of dropping into the local optimum of SCSO, this paper uses the Cauchy mutation operator to promote the global optimization-seeking ability of the algorithm, expedite the convergence speed, and increase the population diversity. Well, at this point, the individual renewal changes to
where is a stochastic number that submits to the standard Cauchy distribution.
4.3. Optimal Neighborhood Disturbance Strategy
When a sand cat swarm is feeding, all individuals move towards the location of prey, a circumstance that may account for the homogeneity of the population but is not conducive to the fluidity of the global search phase. Therefore, an optimal neighborhood disturbance strategy [44] is now utilized. When the global optimum is updated, a further search is performed around it. With this, population diversity can be enriched to obviate the need for a local optimum. The optimal neighborhood disturbance is shown as follows:
where is the new individual generated after disturbance, .
After the optimal neighborhood search, the greedy strategy is adopted to opt for judgment. The specific formula is as follows:
4.4. COSCSO Steps
In this work, a nonlinear adaptive parameter, a Cauchy mutation strategy, and an optimal neighborhood disturbance strategy are combined to modify the standard SCSO algorithm to form the COSCSO algorithm. The fundamental steps of COSCSO are as follows:
Step 1. Initialization, identifying the population magnitude N, the maximum number of iterations T, and the parameters needed.
Step 2. Computing and comparing the fitness value of each sand cat and getting the existing best position.
Step 3. Update the nonlinear parameters Se and the parameters re, Re by means of Equations (11), (5) and (7).
Step 4. Generate the Cauchy mutation operator.
Step 5. Update the individual position of the sand cat if , using Equation (6); otherwise, use Equation (15).
Step 6. Compare the fitness values of the existing individual, and if the former is better, renew the best individual position.
Step 7. Generate new individuals by perturbing the existing best individual according to the optimal neighborhood disturbance strategy using Equation (16).
Step 8. A comparison of the fitness values of the freshly engendered individual and the best individual in accordance with the greedy strategy, and upgrading the position of the best individual if the former is preferable.
Step 9. Revert to Step 3 if the maximum count of iteration T has not been achieved; otherwise, continue with Step 10.
Step 10. Output the global best position and the corresponding fitness value.
For a more concise description of the procedures of the COSCSO algorithm, the pseudo-code of the algorithm is given in Table 1 and the flowchart in Figure 4.

Table 1.
Pseudo-code of COSCSO algorithm.

Figure 4.
Flow chart of the COSCSO algorithm.
4.5. Computational Complexity of COSCSO Algorithm
The computational complexity of an algorithm is defined as the volume of resources it consumes during implementation. When the COSCSO algorithm program is performed, the complexity of each D-dimensional individual in the population is O(D). Then, for a population size of N individuals, its computational complexity is O(N × D), and in the process of finding the best, it needs to be executed T times to get the final result, and the final is O(T × N × D). In the following section, we will test the capability of COSCSO by exploiting different test suites and concrete engineering problems.
5. Numerical Experiments and Analysis
In this chapter, the balance between the COSCSO exploration and development processes is first discussed. Then, the more challenging CEC2017 test suite and the CEC2020 test suite were selected to test the final performance of COSCSO. COSCSO is evaluated with standard SCSO as well as with an extensive variety of meta-heuristic algorithms, and the values of the required parameters for all algorithms are specified in Table 2. All statistical experiments are conducted on the same computer. In addition, all algorithms are implemented in 20 independent executions of each function, taking N = 50 and T = 1000. And the optimization results are compared by analyzing the average and standard deviation of the best solutions.

Table 2.
Parameters setting in traditional classical algorithms.
5.1. Exploration and Exploitation Analysis
Exploration and exploitation play an integral role in the optimization process. Therefore, when evaluating algorithm performance, it is vital to discuss not only the ultimate consequences of the algorithm but also the nature of the balance between exploration and exploitation [45]. Figure 5 gives a diagram of the exploration and exploitation of COSCSO on the 30-dimensional CEC2020 test suite.
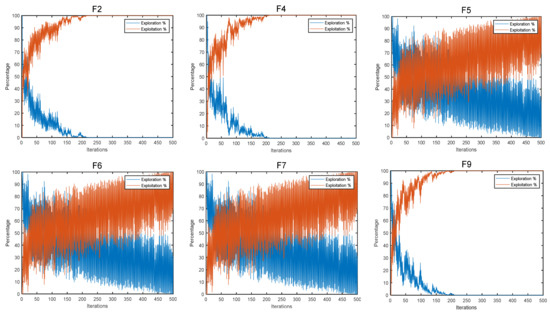
Figure 5.
Diagram of COSCSO exploration and exploitation.
As we can observe from the figure, the algorithm progressively transitions from the exploration phase to the exploitation phase. On the simpler basic functions F2 and F4 and the most complex composition function F9, COSCSO moves to the exploitation phase around the 10th iteration and rapidly reaches the top of the exploitation phase, illustrating the greatly enhanced convergence accuracy of COSCSO. On the hybrid functions F5, F6, and F7, COSCSO also preserves a strong exploration ability in the middle and late stages, effectively refraining from plunging into a local optimum.
5.2. Comparison and Analysis on the CEC2017 Test Suite
Firstly, a running test is performed on the 30-dimensional CEC2017 test suite. The specific formulas for these functions are given in [46]. Then, COSCSO is compared and analyzed with SCSO and eight other competitive optimization algorithms, which include: PSO, RSA [47], BWO [48], DO, AOA [49], HHO [50,51], NCHHO [52], and ATOA [53].
The results obtained by running COSCSO 20 times with other competing algorithms are given in Table 3. There are 24 test functions ranked first in COSCSO, accounting for about 82.76% of all test functions. At first, on single-peak test functions, COSCSO has a distinct superiority over others in regard to the mean value and can achieve a smaller standard deviation. Next, on the multi-peak test function, although COSCSO is at a weak point compared to PSO in F5 and F6, it is more competitive with the other nine algorithms. Furthermore, on the hybrid functions, except for F15 and F19, COSCSO is obviously superior to other algorithms, especially on F12–F14, F16, and F18, where COSCSO is on the leading edge with respect to mean and standard deviation. Finally, on the synthetic functions, COSCSO is far ahead on F22, F28, and F30, but on F21, it is marginally weaker than PSO and SCSO. The last row of the table shows the average ranking of the ten algorithms. The rankings are: COSCSO > HHO > SCSO > PSO > DO > ATOA > AOA > NCHHO = BWO > RSA. In summary, the COSCSO algorithm has superior merit-seeking ability on the CEC2017 test suite; this fully demonstrates that the three strategies effectively boost convergence accuracy and efficiency and greatly reduce the defects of the initial algorithm.

Table 3.
Comparison results on functions of CEC2017 (Bold type is the optimal value).
Table 3 depicts the Wilcoxon rank-sum test p-values [54] derived from solving the 30-dimensional CEC2017 problem for 20 runs of other meta-heuristic algorithms at the 95% significance level (), using COSCSO as a benchmark. The last row shows the statistical results, “+” indicates the number of algorithms that outperform the COSCSO, and “=” indicates that there is no appreciable variation among the two algorithms, at this point . “-” indicates the number of times COSCSO outperformed other algorithms. Combining the ranking of each algorithm, we get that COSCSO is significantly superior to RSA, BWO, DO, AOA, NCHHO, and ATOA on all test functions, worse than PSO on F6 and F21, and apparently preferred to PSO on 14 test functions. So, all together, COSCSO has by far better competence compared to other algorithms and is a wise choice for solving the CEC2017 problem.
Figure 6 illustrates the convergence curves of COSCSO with other algorithms on the CEC2017 test functions. Observing the curves, we can see that COSCSO is a dramatic enhancement over SCSO. Although for F5, F6, and F21, COSCSO is at a disadvantage compared to PSO and inferior to the ATOA on F15 and F19, COSCSO is still more superior than the other algorithms. On the remaining functions, COSCSO obviously converges faster and with higher convergence accuracy than SCSO. These advantages are attributed to the improvement of three major strategies of adaptive parameters, Cauchy mutation operator and optimal neighborhood disturbance, which hinder the algorithm from dropping into local optimum and excessive premature convergence.
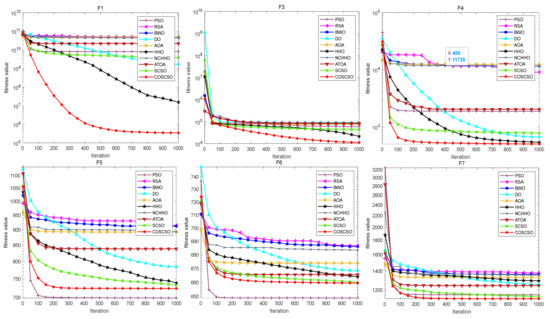
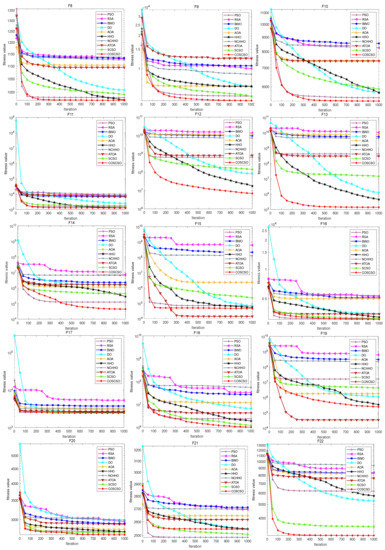
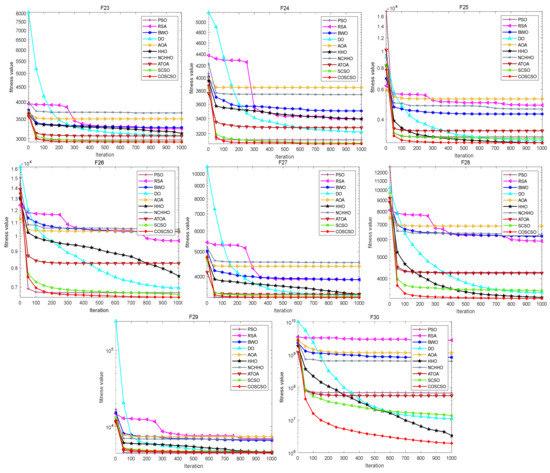
Figure 6.
Convergence curves of COSCSO with other algorithms (CEC2017).
Figure 7 depicts the box plots of COSCSO with other algorithms on the CEC2017 test functions. The height of the box mirrors the level of swing in the data, and a narrower box plot represents more concentrated data and a more stable algorithm. If there are abnormal points in the data that are beyond the normal range of the data, these points are signaled by a “+”. From the figure, we can see that on F1, F3, F4, F11, F12, F14, F15, F17, F18, F27, F28, and F30, the box plot width of the COSCSO is significantly narrower than other algorithms. In addition, except for F22, the COSCSO has almost no outliers. This implies that its operation is more stable and has good robustness in solving the CEC2017 test functions.
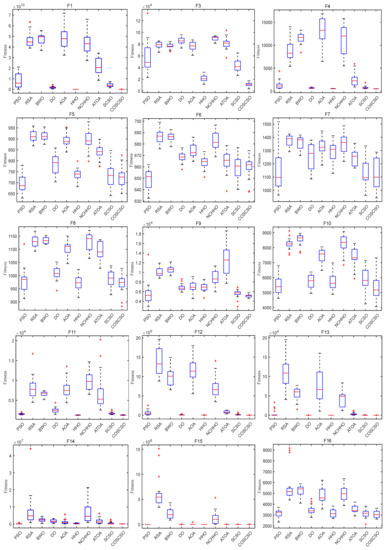
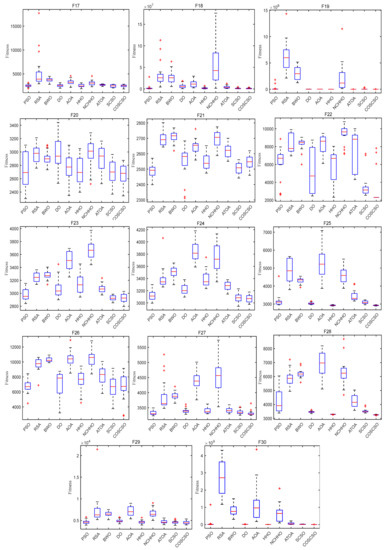
Figure 7.
Box plots of COSCSO with other algorithms (CEC2017).
Radar maps, also known as spider web maps, map the amount of data in multiple dimensions onto the axes and can give an indication of how high or low the weights of each variable are. Figure 8 shows the radar maps of COSCSO with other algorithms, which are plotted based on the ranking of the ten meta-heuristic algorithms on the CEC2017 test function. From the figure, it can be observed that COSCSO constitutes the smallest shaded area, which further sufficiently illustrates the capacity of COSCSO ahead of the other nine comparative algorithms. The shaded area of HHO ranks second, which indicates that HHO has some competition for COSCSO.

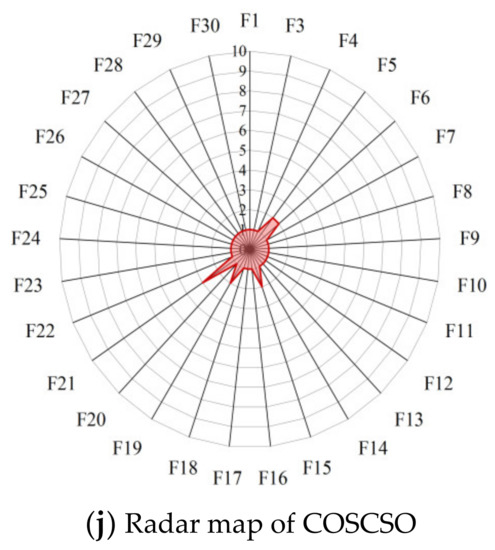
Figure 8.
Radar maps of COSCSO with other algorithms (CEC2017).
5.3. Comparison and Analysis on the CEC2020 Test Suite
In order to further test the COSCSO’s optimization-seeking ability, this paper is also tested on the 30-dimensional and 50-dimensional CEC2020 test suites, respectively. The CEC2020 test suite [55] is composed of some of the CEC2014 test suite [56] and the CEC2017 test suite. The algorithms compared with it are eight other optimization algorithms besides SCSO, which include WOA [57], RSA, PSO, CHOA, AOA, HHO, NCHHO, and ATOA. All parameter definitions remain identical except for the number of dimensions.
The experimental results of each algorithm on the 30-dimensional CEC2020 test suite are given in Table 4. From the data, it can be seen that COSCSO is ahead of SCSO and other comparative algorithms on nine test functions. And on F6, the HHO ranks first and the COSCSO ranks second, which is better than the other eight algorithms. The smallest standard deviation on F1, F5, and F7 indicates that COSCSO is more steady on these test functions. The table shows that the overall ranking is COSCSO > HHO > SCSO > PSO > WOA > ATOA > CHOA > AOA > RSA > NCHHO. The average rank of COSCSO is 1.1, which is the first overall rank, and the average rank of HHO is 2.8, which is the second overall rank, which shows that COSCSO is consistently first among all algorithms many times.

Table 4.
Comparison results on functions of 30-dimensional CEC2020.
In addition, Table 4 lists the p-value magnitude of each algorithm, from which it can be seen that COSCSO as a whole outperforms all compared algorithms, especially for the WOA, RSA, PSO, CHOA, AOA, NCHHO, and ATOA, the COSCSO algorithms far ahead. For the HHO and SCSO, there is no major difference in a few test functions. This reveals that COSCSO is extremely feasible for solving the CEC2020 function problem in 30 dimensions.
Figure 9 presents the convergence curves of COSCSO with other algorithms on the 30-dimensional CEC2020 test suite. Combining the data in the table visually illustrates that COSCSO has faster convergence and more accurate accuracy on F1, F2, F5, F7, and F8. It is poorer than the HHO on F6.
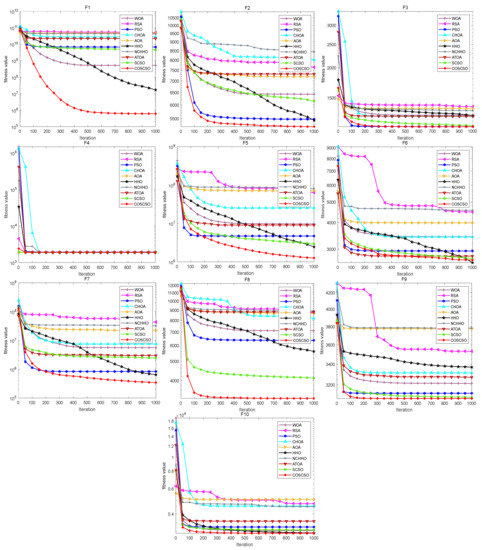
Figure 9.
Convergence curves of COSCSO with other algorithms (30-dimensional CEC2020).
Figure 10 displays the box plots of COSCSO with other algorithms on the 30-dimensional CEC2020 test function. Where the COSCSO algorithm has the smallest median on F1, F2, F5, F7, and F8 compared to the other nine algorithms. In the plots of F1, F5, F7, F8, and F10, the box plot of COSCSO is narrower, suggesting that the COSCSO algorithm is more stable and has relatively good robustness on these functions.
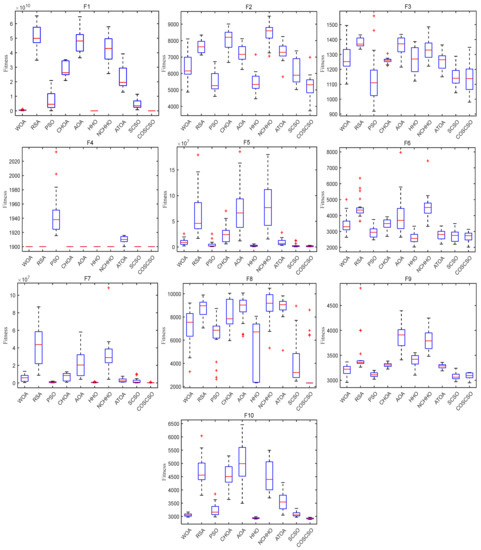
Figure 10.
Box plots of COSCSO with other algorithms (30-dimensional CEC2020).
Figure 11 presents the radar maps based on the ranking of the COSCSO with the other nine algorithms in the 30-dimensional CEC2020 test suite. Depending on the area of the radar maps, it is easy to see that COSCSO ranks at the top in all functions, which very intuitively shows the superiority of COSCSO and its applicability in solving the 30-dimensional CEC2020 problem.


Figure 11.
Radar maps of COSCSO with other algorithms (30-dimensional CEC2020).
Table 5 contains the experimental data for each algorithm for each metric on the 50-dimensional CEC2020 test function. In this experiment, COSCSO achieved better fitness values on the eight test functions. Although inferior to the original algorithm in F2 and F3, the COSCSO algorithm performed competitively compared to the other eight algorithms. The third row from the bottom is the average rank of the ten algorithms. COSCSO has an average rank of 1.4, ranking first. The combined ranking of the algorithms is: COSCSO > SCSO > HHO > PSO > WOA > ATOA > CHOA > RSA > AOA > NCHHO. This fully reflects the ability of the COSCSO algorithm to solve the CEC2020 problem.

Table 5.
Comparison results on functions of 50-dimensional CEC2020.
Rank sum tests are also documented in Table 5. Similarly, the COSCSO was used as a benchmark, and other meta-heuristic algorithms were run 20 times to solve the 50-dimensional CEC2020 problem at the 95% significance level (). Looking at the last row, COSCSO clearly excelled SCSO on the six tested functions; moreover, COSCSO outperformed the other algorithms on most tested functions.
The convergence plots of each function in Figure 12 more directly show its performance in solving the CEC2020 problem. COSCSO surpasses all other algorithms except F2, F3, and F4 and ranks first.
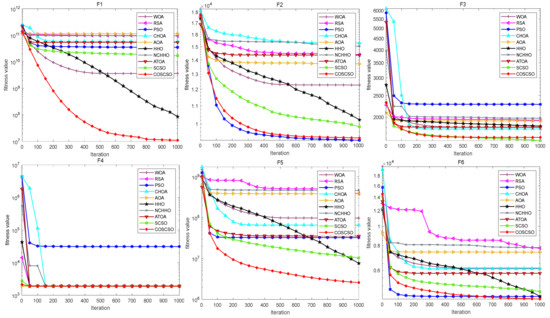
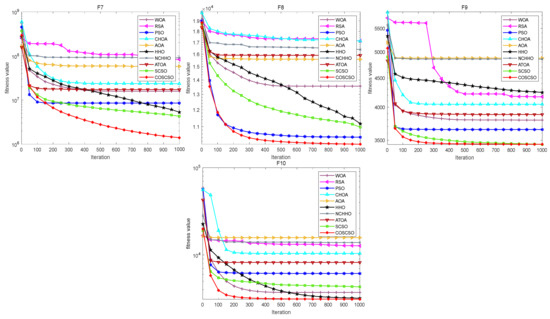
Figure 12.
Convergence curves of COSCSO with other algorithms (50-dimensional CEC2020).
In Figure 13, the median is the same for all algorithms except the PSO algorithm on F4. The median of COSCSO is lower than the other algorithms except for F3, F6, and F9. The box plots of COSCSO on F1, F5, F7, and F10 are extremely narrow, indicating its good stability and robustness.
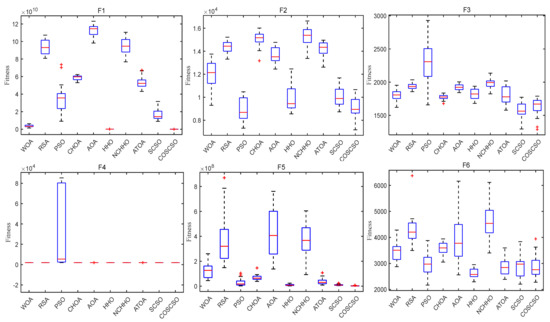
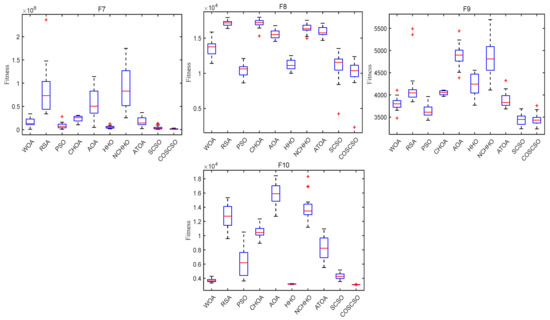
Figure 13.
Box plots of COSCSO with other algorithms (50-dimensional CEC2020).
Figure 14 shows the radar maps of COSCSO with other algorithms. Observing the area of each graph, it can be detected that the shaded area of COSCSO is the smallest as well as relatively more rounded, which indicates that COSCSO has more stable and remarkable capability, and COSCSO can be deployed to solve the 50-dimensional CEC2020 problem.
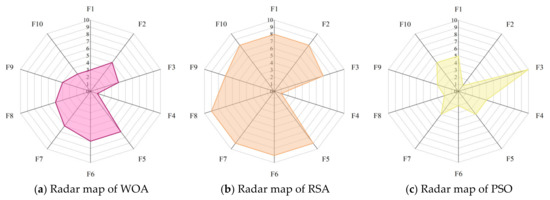
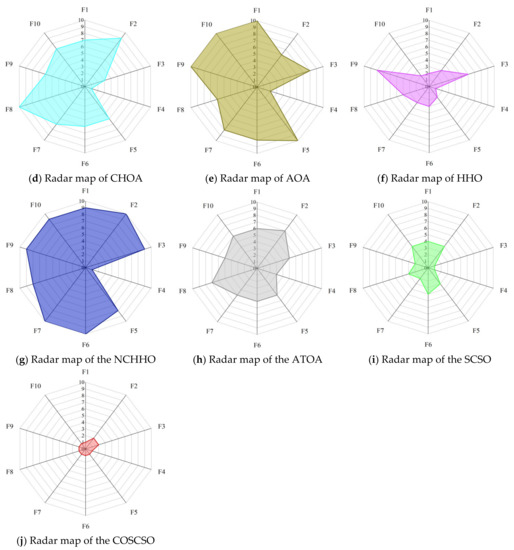
Figure 14.
Radar maps of COSCSO with other algorithms (50-dimensional CEC2020).
6. Engineering Problems
This chapter tests the ability of COSCSO to solve practical problems [58]. In the following, ten algorithms are devoted to addressing six practical engineering problems: welded beam, pressure vessel, gas transmission compressor, heat exchanger, tubular column, and piston lever design problems. In particular, the bounded problems are converted into unbounded problems by utilizing penalty functions. In the comparison experiments, , , and running times are set to 20.
6.1. Welded Beam Design
The objective of the problem is to construct a welded beam [59] with minimal expense under the bounds of shear stress (), bending stress (), buckling load () and end deflection () of the beam. It considers the weld thickness h, the joint length l, the height t of the beam, and the thickness b as variants, and the design schematic is shown in Figure 15. Let , the mathematical model of this problem is shown in Equation (18).
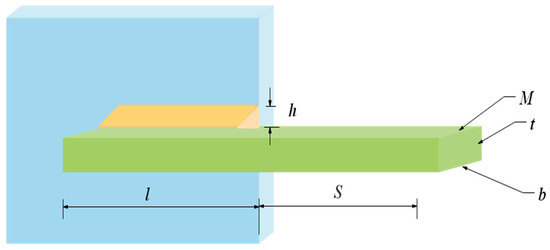
Figure 15.
Welded beam design problem.
Subject to:
Variable range:
where
Ten competitive meta-heuristic algorithms are used to solve this problem in this experiment, which are: COSCSO, SCSO, WOA, AO [60], SCA [61], RSA, HS, BWO, HHO, and AOA. The optimal cost obtained by solving the welded beam design problem using each algorithm and the decision variables it corresponds to are given in Table 6. It is apparent from the table that COSCSO generates the cheapest expenses. Table 7 shows the statistical results obtained for all algorithms run 20 times. It can be noticed that COSCSO obtained the best ranking in all indicators. In conclusion, COSCSO is highly competitive in solving the welded beam design problem.

Table 6.
The optimal result of welded beam design.

Table 7.
Statistical results of welded beam design.
6.2. Pressure Vessel Design
The main purpose of the problem is to fabricate the pressure vessel [62] with the least amount of cost under a host of constraints. It treats shell thickness T1, head thickness T2, inner radius R*, and the length S of the cylindrical part without head as variables, and let . The design schematic is presented in Figure 16. The mathematical model of the problem is shown in Equation (19).
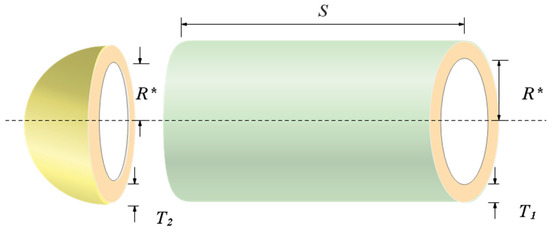
Figure 16.
Pressure vessel design problem.
Subject to:
Variable range:
This problem is solved by ten algorithms, which are COSCSO, SCSO, WOA, AO, HS, RSA, SCA, BWO, BSA [63], and AOA. Table 8 contains the optimal cost of COSCSO and other compared algorithms and their corresponding decision variables. Four more pieces of data for each algorithm are included in Table 9. The result of COSCSO is the best among the ten algorithms and is relatively stable.

Table 8.
The optimal result of pressure vessel design.

Table 9.
Statistical results of pressure vessel design.
6.3. Gas Transmission Compressor Design Problem
The key target of the problem [64] is to minimize the total expense of carrying 100 million cubic feet per day. There are three design variables in this problem: the distance between the two compressors (L), the ratio of the first compressor to the second compressor pressure (δ), and the length of the natural gas pipeline inside the diameter (H). The gas transmission compressor is shown in Figure 17. Let . It is modeled as illustrated in Equation (20).

Figure 17.
Gas transmission compressor design problem.
Variable range:
In addition to SCSO, we pick RSA, BWO, SOA [65], WOA, SCA, HS, AO, and AOA to compare with COSCSO. The best results of different algorithms and the corresponding decision variables are summarized in Table 10. The best results of COSCSO are substantially smaller than those of the other algorithms. The statistical results of all algorithms are collected in Table 11, where their standard deviations are the smallest, indicating a high stability of COSCSO.

Table 10.
The optimal result of gas transmission compressor design.

Table 11.
Statistical results of gas transmission compressor design.
6.4. Heat Exchanger Design
It is a minimization problem for heat exchanger design [66]. There are eight variables and six inequality constraints in this problem. It is specified as shown in Equation (21).
Subject to:
Variable range:
For this problem, nine algorithms, such as WOA and HHO, are compared with COSCSO. Table 12 counts the best results of COSCSO and other algorithms and the best decision variables corresponding to them. The results of each algorithm are listed in Table 13. Apparently, the COSCSO algorithm obtains better results and is very competitive among all ten algorithms.

Table 12.
The optimal result of heat exchanger design.

Table 13.
Statistical results of heat exchanger design.
6.5. Tubular Column Design
The goal of this problem is to minimize the expense of designing a tubular column [67] to bear compressive loads under six constraints. It contains two decision variables: the average diameter of the column (D), and the thickness of the tube (b), let . Its design schematic is depicted in Figure 18. The model of this problem is indicated in Equation (22).
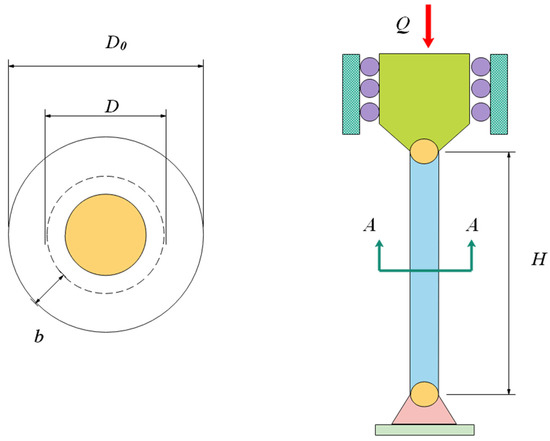
Figure 18.
Tubular column design problem.
Subject to:
Variable range:
where
Table 14 shows the optimal costs and variables for COSCSO and the other nine algorithms. Observing the four indicators in Table 15, COSCSO obtained better values for all of them.

Table 14.
The optimal result of tubular column design.

Table 15.
Statistical results of tubular column design.
6.6. Piston Lever Design
The primary goal of the problem [68] is to minimize the amount of oil consumed when the piston lever is tilted from 0° to 45° under four constraints, thus determining H, B, D, and K. The schematic is seen in Figure 19. The mathematical expression of the problem is Equation (23).

Figure 19.
Piston lever design.
Subject to:
where
Besides COSCSO and SCSO, SOA, MVO [69], HHO, etc., were also enrolled in the experiment. By looking at Table 16 and Table 17, COSCSO is the best choice within each of these ten algorithms to solve this problem.

Table 16.
The optimal result of piston lever design.

Table 17.
Statistical results of piston lever design.
7. Conclusions and Future Work
In this paper, SCSO based on adaptive parameters, Cauchy mutation, and an optimal neighborhood disturbance strategy are proposed. The nonlinear adaptive parameter replaces the linear adaptive parameter and increases the global search, which helps prevent premature convergence and puts exploration and development in a more balanced state. The introduction of the Cauchy mutation operator perturbs the search step to speed up convergence and improve search efficiency. The optimal neighborhood disturbance strategy is used to enrich the species diversity and prevent the algorithm from getting into the dilemma of the local optimum. COSCSO is evaluated against the standard SCSO and other challenging swarm intelligence optimization algorithms at CEC2017 and CEC2020 in distinct dimensions. The comparison of average and standard deviation, convergence, stability, and statistical analysis were performed. It is proven that COSCSO converges more rapidly, with higher accuracy, and stays more stable. In contrast to other algorithms, COSCO is more advanced. What is more, COSCSO is deployed to solve six engineering problems. From the experimental results, it can be visually concluded that COSCSO also has the potential to solve practical problems.
The COSCSO algorithm has strong exploration ability, which can effectively avoid falling into local optimums and prevent premature convergence. However, it has weak exploitation ability and a relatively slow convergence speed. In the future, we can use more novel strategies to improve the algorithm and further improve its exploration speed, which can be made available to tackle more high-dimensional optimization problems and employed in various fields, such as feature selection, path planning, image segmentation, fuzzy recognition, etc.
Author Contributions
Conceptualization, X.W.; Methodology, Q.L.; Software, Q.L. and L.Z.; Formal analysis, L.Z.; Investigation, X.W.; Resources, Q.L.; Writing—original draft, L.Z.; Funding acquisition, X.W. All authors have read and agreed to the published version of the manuscript.
Funding
This work was funded by Natural Science Basic Research Plan in Shaanxi Province of China (2023-JC-YB-023, 2021JM-320).
Institutional Review Board Statement
Not applicable.
Data Availability Statement
The figures utilized to support the findings of this study are embraced in the article.
Conflicts of Interest
The authors declare that they have no conflict of interest.
References
- Sadollah, A.; Sayyaadi, H.; Yadav, A. A dynamic metaheuristic optimization model inspired by biological nervous systems: Neural network algorithm. Appl. Soft Comput. 2018, 71, 747–782. [Google Scholar] [CrossRef]
- Qin, F.; Zain, A.M.; Zhou, K.-Q. Harmony search algorithm and related variants: A systematic review. Swarm Evol. Comput. 2022, 74, 101126. [Google Scholar] [CrossRef]
- Abualigah, L.; Diabat, A.; Geem, Z.W. A Comprehensive Survey of the Harmony Search Algorithm in Clustering Applications. Appl. Sci. 2020, 10, 3827. [Google Scholar] [CrossRef]
- Rajeev, S.; Krishnamoorthy, C.S. Discrete optimization of structures using genetic algorithms. J. Struct. Eng. 1992, 118, 1233–1250. [Google Scholar] [CrossRef]
- Storn, R.; Price, K. Differential evolution–A simple and efficient heuristic for global optimization over continuous spaces. J. Glob. Optim. 1997, 11, 341–359. [Google Scholar] [CrossRef]
- Houssein, E.H.; Rezk, H.; Fathy, A.; Mahdy, M.A.; Nassef, A.M. A modified adaptive guided differential evolution algorithm applied to engineering applications. Eng. Appl. Artif. Intell. 2022, 113, 104920. [Google Scholar] [CrossRef]
- Atashpaz-Gargari, E.; Lucas, C. Imperialist competitive algorithm: An algorithm for optimization inspired by imperialistic competition. In Proceedings of the 2007 IEEE Congress on Evolutionary Computation, Singapore, 25–28 September 2007; pp. 4661–4667. [Google Scholar]
- Priya, R.D.; Sivaraj, R.; Anitha, N.; Devisurya, V. Tri-staged feature selection in multi-class heterogeneous datasets using memetic algorithm and cuckoo search optimization. Expert Syst. Appl. 2022, 209, 118286. [Google Scholar] [CrossRef]
- Dorigo, M.; Birattari, M.; Stutzle, T. Ant colony optimization-Artificial ants as a computational intelligence technique. IEEE Comput. Intell. Mag. 2006, 1, 28–39. [Google Scholar] [CrossRef]
- Zhao, D.; Lei, L.; Yu, F.; Heidari, A.A.; Wang, M.; Oliva, D.; Muhammad, K.; Chen, H. Ant colony optimization with horizontal and vertical crossover search: Fundamental visions for multi-threshold image segmentation. Expert. Syst. Appl. 2021, 167, 114122. [Google Scholar] [CrossRef]
- Kennedy, J.; Eberhart, R. Particle swarm optimization. In Proceedings of the ICNN’95-International Conference on Neural Networks, Perth, WA, Australia, 27 November–1 December 1995; pp. 1942–1948. [Google Scholar]
- Ma, M.; Wu, J.; Shi, Y.; Yue, L.; Yang, C.; Chen, X. Chaotic Random Opposition-Based Learning and Cauchy Mutation Improved Moth-Flame Optimization Algorithm for Intelligent Route Planning of Multiple UAVs. IEEE Access 2022, 10, 49385–49397. [Google Scholar] [CrossRef]
- Yu, X.; Wu, X. Ensemble grey wolf Optimizer and its application for image segmentation. Expert Syst. Appl. 2022, 209, 118267. [Google Scholar] [CrossRef]
- Zhao, W.; Zhang, Z.; Wang, L. Manta ray foraging optimization: An effective bio-inspired optimizer for engineering applications. Eng. Appl. Artif. Intell. 2020, 87, 103300. [Google Scholar] [CrossRef]
- Zhao, W.; Wang, L.; Mirjalili, S. Artificial hummingbird algorithm: A new bio-inspired optimizer with its engineering applications. Comput. Methods Appl. Mech. Eng. 2022, 388, 114194. [Google Scholar] [CrossRef]
- Agushaka, J.O.; Ezugwu, A.E.; Abualigah, L. Dwarf Mongoose Optimization Algorithm. Comput. Methods Appl. Mech. Eng. 2022, 391, 114570. [Google Scholar] [CrossRef]
- Abdollahzadeh, B.; Gharehchopogh, F.S.; Mirjalili, S. Artificialgorilla troops optimizer: A new nature-inspired metaheuristic algorithm for global optimization problems. Int. J. Intell. Syst. 2021, 36, 5887–5958. [Google Scholar] [CrossRef]
- Houssein, E.H.; Saad, M.R.; Ali, A.A.; Shaban, H. An efficient multi-objective gorilla troops optimizer for minimizing energy consumption of large-scale wireless sensor networks. Expert Syst. Appl. 2023, 212, 118827. [Google Scholar] [CrossRef]
- Zhao, S.; Zhang, T.; Ma, S.; Chen, M. Dandelion Optimizer: A nature-inspired metaheuristic algorithm for engineering applications. Eng. Appl. Artif. Intell. 2022, 114, 105075. [Google Scholar] [CrossRef]
- Beşkirli, M. A novel Invasive Weed Optimization with levy flight for optimization problems: The case of forecasting energy demand. Energy Rep. 2022, 8 (Suppl. S1), 1102–1111. [Google Scholar] [CrossRef]
- Rashedi, E.; Nezamabadi-Pour, H.; Saryazdi, S. GSA: A Gravitational Search Algorithm. Inf. Sci. 2009, 179, 2232–2248. [Google Scholar] [CrossRef]
- Jiang, Q.; Wang, L.; Lin, Y.; Hei, X.; Yu, G.; Lu, X. An efficient multi-objective artificial raindrop algorithm and its application to dynamic optimization problems in chemical processes. Appl. Soft Comput. 2017, 58, 354–377. [Google Scholar] [CrossRef]
- Houssein, E.H.; Hosney, M.E.; Mohamed, W.M.; Ali, A.A.; Younis, E.M.G. Fuzzy-based hunger games search algorithm for global optimization and feature selection using medical data. Neural Comput. Appl. 2022, 35, 5251–5275. [Google Scholar] [CrossRef] [PubMed]
- Houssein, E.H.; Oliva, D.; Çelik, E.; Emam, M.M.; Ghoniem, R.M. Boosted sooty tern optimization algorithm for global optimization and feature selection. Expert Syst. Appl. 2023, 113, 119015. [Google Scholar] [CrossRef]
- Hu, G.; Du, B.; Wang, X.; Wei, G. An enhanced black widow optimization algorithm for feature selection. Knowl.-Based Syst. 2022, 235, 107638. [Google Scholar] [CrossRef]
- Abualigah, L.; Almotairi, K.H.; Elaziz, M.A. Multilevel thresholding image segmentation using meta-heuristic optimization algorithms: Comparative analysis, open challenges and new trends. Appl. Intell. 2022, 52, 1–51. [Google Scholar] [CrossRef]
- Houssein, E.H.; Hussain, K.; Abualigah, L.; Elaziz, M.A.; Alomoush, W.; Dhiman, G.; Djenouri, Y.; Cuevas, E. An improved opposition-based marine predators algorithm for global optimization and multilevel thresholding image segmentation. Knowl.-Based Syst. 2021, 229, 107348. [Google Scholar] [CrossRef]
- Sharma, P.; Dinkar, S.K. A Linearly Adaptive Sine–Cosine Algorithm with Application in Deep Neural Network for Feature Optimization in Arrhythmia Classification using ECG Signals. Knowl. Based Syst. 2022, 242, 108411. [Google Scholar] [CrossRef]
- Guo, Y.; Tian, X.; Fang, G.; Xu, Y.-P. Many-objective optimization with improved shuffled frog leaping algorithm for inter-basin water transfers. Adv. Water Resour. 2020, 138, 103531. [Google Scholar] [CrossRef]
- Das, P.K.; Behera, H.S.; Panigrahi, B.K. A hybridization of an improved particle swarm optimization and gravitational search algorithm for multi-robot path planning. Swarm Evol. Comput. 2016, 28, 14–28. [Google Scholar] [CrossRef]
- Yu, X.; Jiang, N.; Wang, X.; Li, M. A hybrid algorithm based on grey wolf optimizer and differential evolution for UAV path planning. Expert Syst. Appl. 2022, 215, 119327. [Google Scholar] [CrossRef]
- Gao, D.; Wang, G.-G.; Pedrycz, W. Solving fuzzy job-shop scheduling problem using DE algorithm improved by a selection mechanism. IEEE Trans. Fuzzy Syst. 2020, 28, 3265–3275. [Google Scholar] [CrossRef]
- Dong, Z.R.; Bian, X.Y.; Zhao, S. Ship pipe route design using improved multi-objective ant colony optimization. Ocean. Eng. 2022, 258, 111789. [Google Scholar] [CrossRef]
- Hu, G.; Wang, J.; Li, M.; Hussien, A.G.; Abbas, M. EJS: Multi-strategy enhanced jellyfish search algorithm for engineering applications. Mathematics 2023, 11, 851. [Google Scholar] [CrossRef]
- Wolpert, D.H.; Macready, W.G. No free lunch theorems for optimization. IEEE Trans. Evol. Comput. 1997, 1, 67–82. [Google Scholar] [CrossRef]
- Seyyedabbasi, A.; Kiani, F. Sand cat swarm optimization: A nature-inspired algorithm to solve global optimization problems. Eng. Comput. 2022, 38, 1–15. [Google Scholar] [CrossRef]
- Aghaei, V.T.; SeyyedAbbasi, A.; Rasheed, J.; Abu-Mahfouz, A.M. Sand cat swarm optimization-based feedback controller design for nonlinear systems. Heliyon 2023, 9, e13885. [Google Scholar] [CrossRef]
- Li, Y.; Wang, G. Sand cat swarm optimization based on stochastic variation with elite collaboration. IEEE Access 2022, 10, 89989–90003. [Google Scholar] [CrossRef]
- Seyyedabbasi, A. A reinforcement learning-based metaheuristic algorithm for solving global optimization problems. Adv. Eng. Softw. 2023, 178, 103411. [Google Scholar] [CrossRef]
- Lu, W.; Shi, C.; Fu, H.; Xu, Y. A Power Transformer Fault Diagnosis Method Based on Improved Sand Cat Swarm Optimization Algorithm and Bidirectional Gated Recurrent Unit. Electronics 2023, 12, 672. [Google Scholar] [CrossRef]
- Zhao, X.; Fang, Y.; Liu, L.; Xu, M.; Li, Q. A covariance-based Moth–flame optimization algorithm with Cauchy mutation for solving numerical optimization problems. Soft Comput. 2022, 119, 108538. [Google Scholar] [CrossRef]
- Wang, W.C.; Xu, L.; Chau, K.W.; Xu, D.M. Yin-Yang firefly algorithm based on dimensionally Cauchy mutation. Expert Syst. Appl. 2020, 150, 113216. [Google Scholar] [CrossRef]
- Ou, X.; Wu, M.; Pu, Y.; Tu, B.; Zhang, G.; Xu, Z. Cuckoo search algorithm with fuzzy logic and Gauss–Cauchy for minimizing localization error of WSN. Soft Comput. 2022, 125, 109211. [Google Scholar] [CrossRef]
- Hu, G.; Zhong, J.; Du, B.; Wei, G. An enhanced hybrid arithmetic optimization algorithm for engineering applications. Comput. Methods Appl. Mech. Eng. 2022, 394, 114901. [Google Scholar] [CrossRef]
- Hussain, K.; Salleh, M.N.M.; Cheng, S.; Shi, Y. On the exploration and exploitation in popular swarm-based metaheuristic algorithms. Neural Comput. Appl. 2019, 31, 7665–7683. [Google Scholar] [CrossRef]
- Awad, N.; Ali, M.; Liang, J.; Qu, B.; Suganthan, P.; Definitions, P. Evaluation criteria for the CEC 2017 special session and competition on single objective real-parameter numerical optimization. Technol. Rep. 2016. [Google Scholar]
- Abualigah, L.; Abd Elaziz, M.; Sumari, P.; Geem, Z.W.; Gandomi, A.H. Reptile Search Algorithm (RSA): A nature-inspired meta-heuristic optimizer. Expert Syst. Appl. 2022, 191, 116158. [Google Scholar] [CrossRef]
- Zhong, C.; Li, G.; Meng, Z. Beluga whale optimization: A novel nature-inspired metaheuristic algorithm. Knowl. Based Syst. 2022, 251, 109215. [Google Scholar] [CrossRef]
- Abualigah, L.; Diabat, A.; Mirjalili, S.; Abd Elaziz, M.; Gandomi, A.H. The Arithmetic Optimization Algorithm. Comput. Methods Appl. Mech. Eng. 2021, 376, 113609. [Google Scholar] [CrossRef]
- Heidari, A.A.; Mirjalili, S.; Faris, H.; Aljarah, I.; Mafarja, M.; Chen, H. Harris hawks optimization: Algorithm and applications. Future Gener. Comput. Syst. 2019, 97, 849–872. [Google Scholar] [CrossRef]
- Abualigah, L.; Diabat, A.; Svetinovic, D.; Elaziz, M.A. Boosted Harris Hawks gravitational force algorithm for global optimization and industrial engineering problems. J. Intell. Manuf. 2022, 34, 1–13. [Google Scholar] [CrossRef]
- Dehkordi, A.A.; Sadiq, A.S.; Mirjalili, S.; Ghafoor, K.Z. Nonlinear-based Chaotic Harris Hawks Optimizer: Algorithm and Internet of Vehicles application. Appl. Soft Comput. 2021, 109, 107574. [Google Scholar] [CrossRef]
- Arun Mozhi Devan, P.; Hussin, F.A.; Ibrahim, R.B.; Bingi, K.; Nagarajapandian, M.; Assaad, M. An Arithmetic-Trigonometric Optimization Algorithm with Application for Control of Real-Time Pressure Process Plant. Sensors 2022, 22, 617. [Google Scholar] [CrossRef] [PubMed]
- Hu, G.; Zhu, X.; Wei, G.; Chang, C.T. An improved marine predators algorithm for shape optimization of developable Ball surfaces. Eng. Appl. Artif. Intell. 2021, 105, 104417. [Google Scholar] [CrossRef]
- Mohamed, A.W.; Hadi, A.A.; Awad, N.H. Evaluating the performance of adaptive Gaining Sharing knowledge based algorithm on CEC 2020 benchmark problems. In Proceedings of the 2020 IEEE Congress on Evolutionary Computation (CEC), Glasgow, UK, 19–24 July 2020. [Google Scholar]
- Liang, J.; Qu, B.; Suganthan, P. Problem Definitions and Evaluation Criteria for the CEC 2014 Special Session and Competition on Single Objective Real-Parameter Numerical Optimization. Tech. Rep., Comput. Intell. Lab.Zhengzhou Univ. Zhengzhou China Nanyang Technol. Univ. Singap., 2013,635.S. Mirjalili, A. Lewis, The whale optimization algorithm. Adv. Eng. Softw. 2016, 95, 51–67. [Google Scholar]
- Mirjalili, S.; Lewis, A. The Whale Optimization Algorithm. Adv. Eng. Softw. 2016, 95, 51–67. [Google Scholar] [CrossRef]
- Zhao, W.; Wang, L.; Zhang, Z. Atom search optimization and its application to solve a hydrogeologic parameter estimation problem. Knowl. Based Sys. 2018, 163, 283–304. [Google Scholar] [CrossRef]
- Zhao, W.; Wang, L.; Zhang, Z. Artificial ecosystem-based optimization: A novel nature-inspired meta-heuristic algorithm. Neural Comput. Appl. 2020, 32, 9383–9425. [Google Scholar] [CrossRef]
- Abualigah, L.; Yousri, D.; Elaziz, M.A.; Ewees, A.A.; Al-Qaness, M.A.; Gandomi, A.H. Aquila Optimizer: A novel meta-heuristic optimization algorithm. Comput. Ind. Eng. 2021, 157, 107250. [Google Scholar] [CrossRef]
- Mirjalili, S. SCA: A Sine Cosine Algorithm for solving optimization problems. Knowl. Based Syst. 2016, 96, 120–133. [Google Scholar] [CrossRef]
- Seyyedabbasi, A. WOASCALF: A new hybrid whale optimization algorithm based on sine cosine algorithm and levy flight to solve global optimization problems. Adv. Eng. Softw. 2022, 173, 103272. [Google Scholar] [CrossRef]
- Wang, L.; Wang, H.; Han, X.; Zhou, W. A novel adaptive density-based spatial clustering of application with noise based on bird swarm optimization algorithm. Comput. Commun. 2021, 174, 205–214. [Google Scholar] [CrossRef]
- Kumar, N.; Mahato, S.K.; Bhunia, A.K. Design of an efficient hybridized CS-PSO algorithm and its applications for solving constrained and bound constrained structural engineering design problems. Results Control. Optim. 2021, 5, 100064. [Google Scholar] [CrossRef]
- Dhiman, G.; Kumar, V. Seagull optimization algorithm: Theory and its applications for large-scale industrial engineering problems. Knowl. Based Syst. 2019, 165, 169–196. [Google Scholar] [CrossRef]
- Jaberipour, M.; Khorram, E. Two improved harmony search algorithms for solving engineering optimization problems. Commun. Nonlinear Sci. Numer. Simul. 2010, 15, 3316–3331. [Google Scholar] [CrossRef]
- Hu, G.; Yang, R.; Qin, X.; Wei, G. MCSA: Multi-strategy boosted chameleon-inspired optimization algorithm for engineering applications. Comput. Methods Appl. Mech. Eng. 2023, 403, 115676. [Google Scholar] [CrossRef]
- Ong, K.M.; Ong, P.; Sia, C.K. A new flower pollination algorithm with improved convergence and its application to engineering optimization. Decis. Anal. J. 2022, 5, 100144. [Google Scholar] [CrossRef]
- Mirjalili, S.; Mirjalili, S.M.; Hatamlou, A. Multi-Verse Optimizer: A nature-inspired algorithm for global optimization. Neural Comput. Appl. 2016, 27, 495–513. [Google Scholar] [CrossRef]
Disclaimer/Publisher’s Note: The statements, opinions and data contained in all publications are solely those of the individual author(s) and contributor(s) and not of MDPI and/or the editor(s). MDPI and/or the editor(s) disclaim responsibility for any injury to people or property resulting from any ideas, methods, instructions or products referred to in the content. |
© 2023 by the authors. Licensee MDPI, Basel, Switzerland. This article is an open access article distributed under the terms and conditions of the Creative Commons Attribution (CC BY) license (https://creativecommons.org/licenses/by/4.0/).