An Approximation of Heart Failure Using Cardiovascular Simulation Toolbox

Abstract
:1. Introduction
- Depending of the output in the ventricles: “High-Output” and “Low-Output”.
- Depending of their location: “Left-Sided Systolic,” “Left-Sided Diastolic” and “Right-Sided Right-Ventricle.”
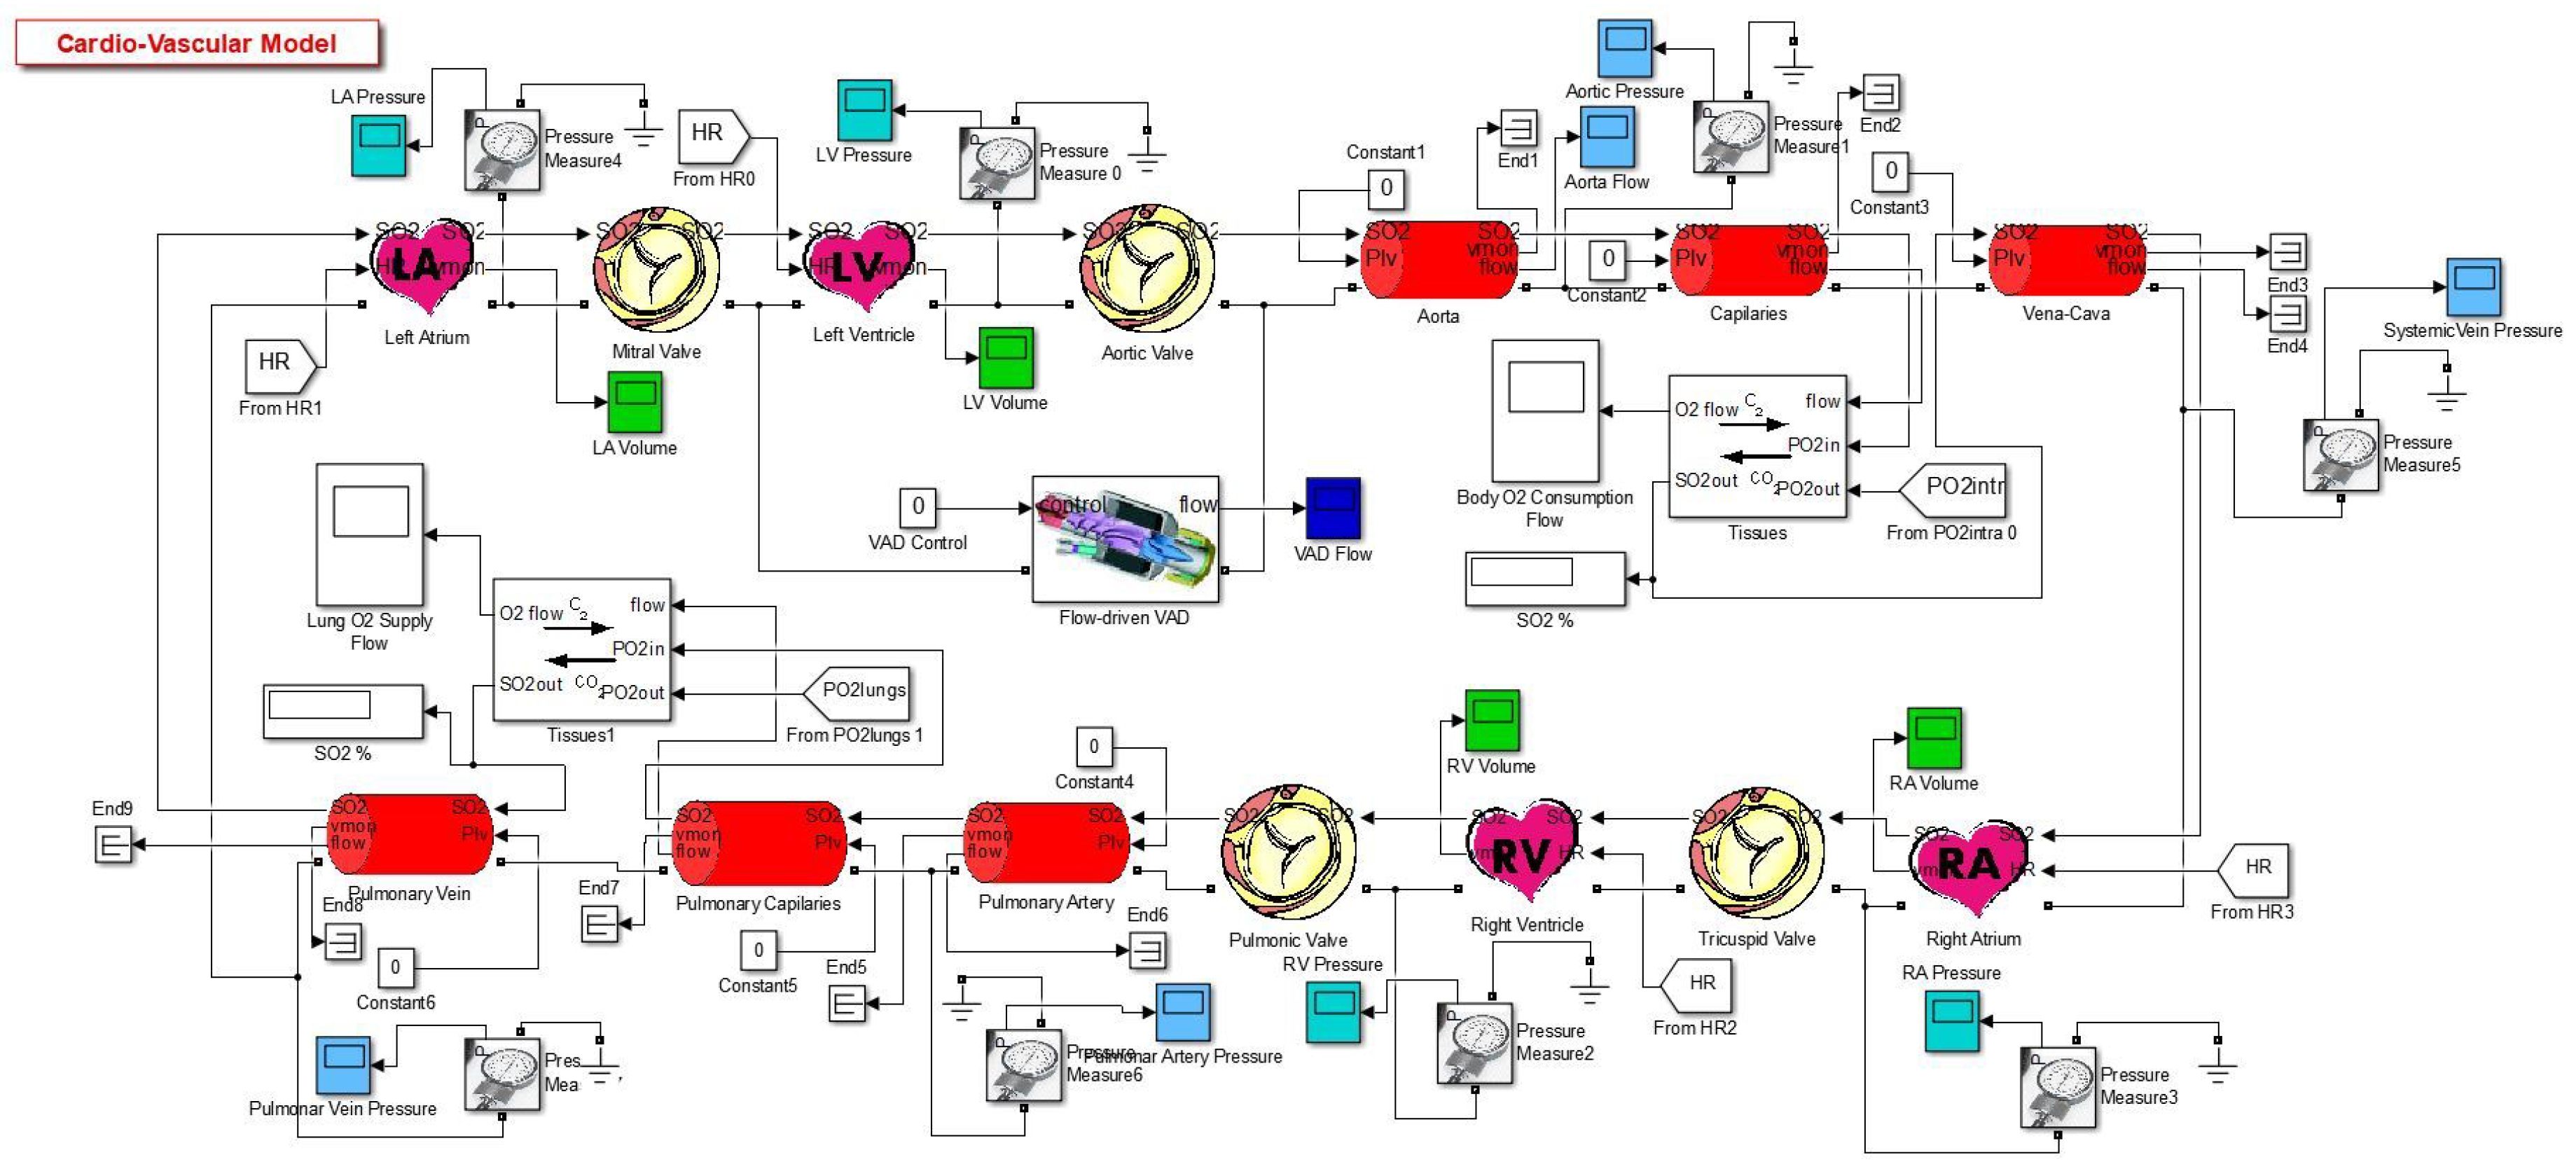
2. Simulation Model
- Heart: Contains auricles, ventricles and valves.
- Measurements: Designed to obtain and visualize different parameters in the system.
- Veins: Contains power transmission-based circuits.
- Oxygen Transport: Contains blocks which calculate the oxygen concentration and the gas exchange between blood and the tissues.
- Other: Groups the other components that don’t fit the description of the previous categories, such as resistances and flow valves [2].
3. About the Heart Failures
- High-Output Heart Failure (HOHF): It happens when the body needs high levels of blood, due to that the heart beat faster than usual [11]. Causes of HOHF could be: Anemia, hipoertiroidism, arteriovenous fistula, Beriberi illnesses and Paget’s in Reference [12]. Lobato [13] mentions that HOHF is the result of an increase in the diastolic pressure and the volume on the left ventricle. Some effects are: marked vasodilatation, pulse increase, water and salt retention, renal fluid diminution and activation on the neuroendocrine system [13]. Also, heart function could be supra normal but this will be inadequate for the high metabolic necessities [4].
- Low-Output Heart Failure (LOHF): It happens due to cardiac disorders that damages the adequate bombing function, due to diastolic and systolic dysfunctions. LOHF can produce damage to the valves, arrhythmia, vasoconstrictions and cyanotic and cold extremities. The cardiac output is normal but it tends to decrease when the body undergoes physical exertion [4].
- Systolic Heart Failure (SHF): It is the heart’s incapacity of bombing blood at its normal speed. The ejection fraction in the left ventricle plays an important role when diagnosing it, due to its significant diminution. This is a lethal sickness hence, deaths are very spontaneous [14]. Some physical effects are: the cavity of the left ventricle dilates, although the thickness of the wall maintains in a similar way; the contractile function of the heart seems to reduce. Due to that fact, the ejection fraction reduces and so the systolic volume.
- Diastolic Heart Failure (DHF): It relates with the difficulty of filling one or both ventricles, as also, the camera of the ventricle does not accept the appropriate level of normal blood pressure. In this case, the quantity of blood that is bombed every beat in the left ventricle is normal [14]. Some risk factors are: diabetes, hypertension, age, obesity and coronary artery sickness. Physically, the cavity of the left ventricle maintains the same or reduces but on the other hand, the thickness of the wall increases significantly.
- Right-Ventricle Heart Failure (RVHF): It is a consequence from the damage resulted in the left side of the heart, the increase of blood pressure transfers to the lungs, thus going back to the right side of the heart. The blood accumulates in the veins, each time that the right ventricle loses pumping power. Some effects of RVHF are: inflammations in ankles and legs [15].
4. Results
5. Discussion
6. Input Parameters
7. Conclusions
Author Contributions
Conflicts of Interest
Abbreviations
| HB | Heart Beat |
| CO | Cardiac Output |
| LVEDV | Left Ventricle End-Diastolic Volume |
| LVESV | Left Ventricle End-Systolic Volume |
| LVSV | Left Ventricle Stroke Volume |
| CVST | Cardiovascular Simulation Toolbox |
| HOHF | High Output Heart Failure |
| LOHF | Low Output Heart Failure |
| SHF | Systolic Heart Failure |
| DHF | Diastolic Heart Failure |
| RVHF | Right Ventricle Heart Failure |
References
- Barnea, O. Open-source programming of cardiovascular pressure-flow dynamics using SimPower toolbox in Matlab and Simulink. Open Pacing Electrophysiol. Ther. J. 2010, 3, 55–59. [Google Scholar] [CrossRef]
- Ortiz-Leon, G.; Vilchez-Monge, M.; Montero-Rodriguez, J.J. An updated cardiovascular simulation tool. In Proceedings of the 2013 IEEE International Symposium on Circuits and Systems (ISCAS), Beijing, China, 19–23 May 2013; pp. 1901–1904. [Google Scholar]
- Alpert, J.S.; Ewy, G.A. Manual of Cardiovascular Diagnosis and Therapy; Lippincott Williams & Wilkins: Philadelphia, PA, USA, 2002. [Google Scholar]
- Porth, C. Essentials of Pathophysiology: Concepts of Altered Health States; Lippincott Williams & Wilkins: Philadelphia, PA, USA, 2011. [Google Scholar]
- Bronzino, J. The Biomedical Engineering Handbook, 2nd ed.; CRC Press LLC: Danvers, MA, USA, 2000. [Google Scholar]
- Edwards Lifesciences. Normal Hemodynamic Parameters and Laboratory Values. 2011, pp. 1–2. Available online: Http://ht.edwards.com/sci/edwardssitecollectionimages/edwards/products/presep/ar04313hemodynpocketcard.pdf (accessed on 12 March 2014).
- Umetani, K.; Singer, D.H.; McCraty, R.; Atkinson, M. Twenty-four hour time domain heart rate variability and heart rate: Relations to age and gender over nine decades. J. Am. Coll. Cardiol. 1998, 31, 593–601. [Google Scholar] [CrossRef]
- Schlosser, T.; Pagonidis, K.; Herborn, C.U.; Hunold, P.; Waltering, K.-U.; Lauenstein, T.C.; Barkhausen, J. Assessment of left ventricular parameters using 16-MDCT and new software for endocardial and epicardial border delineation. Am. J. Roentgenol. 2005, 184, 765–773. [Google Scholar] [CrossRef] [PubMed]
- Keller, M.; Gopal, S.; King, D.L. Left and right atrial volume by freehand three-dimensional echocardiography: In vivo validation using magnetic resonance imaging. Eur. J. Echocardiogr. J. Work. Group Echocardiogr. Eur. Soc. Cardiol. 2000, 1, 55–65. [Google Scholar] [CrossRef] [PubMed]
- Lancashire & South Cumbria Cardiac Network. Normal & Abnormal Intracardiac Pressures. Available online: Http://lane.stanford.edu/portals/cvicu/HCP_CV_Tab_1/Intracardiac_Pressures.pdf (accessed on 12 March 2014).
- Pai, R.K. High-Output Heart Failure—Topic Overview. Available online: https://www.uofmhealth.org/health-library/tx4092abc (accessed on 12 March 2014).
- Hoeper, M.M.; Granton, J. Intensive care unit management of patients with severe pulmonary hypertension and right heart failure. Am. J. Respir. Crit. Med. 2011, 184, 1114–1124. [Google Scholar] [CrossRef] [PubMed]
- Lobato, E.B.; Gravenstein, N.; Kirby, R.R. Complications in anesthesiology. Ethics 2004, 27, 391–414. [Google Scholar]
- Chatterjee, K.; Massie, B. Systolic and diastolic heart failure: Differences and similarities. J. Cardiac Failure 2007, 13, 569–576. [Google Scholar] [CrossRef] [PubMed]
- Association, A.H. Types of Heart Failure. Available online: https://www.heart.org/en/health-topics/heart-failure/what-is-heart-failure/types-of-heart-failure (accessed on 6 April 2015).
- Nixon, J.V.; Aurigemma, G.P.; Bolger, A.F.; Crawford, M.H.; Fletcher, G.F.; Francis, G.S.; Gerber, T.C.; Gersony, W.M.; Ott, P.; Pape, L.A.; et al. The AHA Clinical Cardiac Consult; Lippincott Williams & Wilkins: Philadelphia, PA, USA, 2010. [Google Scholar]
- Givertz, M.; Haghighat, A. Causes and pathophysiology of High Output Heart Failure. Available online: https://www.uptodate.com/contents/causes-and-pathophysiology-of-high-output-heart-failure (accessed on 5 November 2012).

| Parameter | Units | Reference Value | Normal | |
|---|---|---|---|---|
| Min | Max | |||
| Heart Rate | bpm | 48–105 [6] | 75 | - |
| Cardiac output | L/min | 4.0–8.0 [6] | 6.7154 | - |
| Left Ventricular Volume | mL | 16–239 [7] | 62.5976 | 152.1365 |
| Right Ventricular Volume | mL | 50–160 [6] | 78.7093 | 152.6721 |
| Left Atrial Volume | mL | 25.3–109.7 [9] | 19.3332 | 102.0856 |
| Right Atrial Volume | mL | 26.4–121.5 [9] | 7.3287 | 79.7041 |
| Arterial Pressure | mmHg | 60–140 [10] | 68.47 | 144.3845 |
| Left Ventricular Pressure | mmHg | 0–140 [10] | 1.8499 | 147.8072 |
| Left Atrial Pressure | mmHg | 4.0–12 [6] | 0.4368 | 30.1822 |
| Right Ventricular Pressure | mmHg | 2.0–30 [6] | 2.1612 | 41.7744 |
| Right Atrial Pressure | mmHg | 2.0–6.0 [6] | 0.2426 | 21.4079 |
| LV Stroke Volume | mL | 60–100 [6] | 89.5389 | - |
| RV Stroke Volume | mL | 60–100 [6] | 73.9628 | - |
| LV End-Diastolic Volume | mL | 120 (65–239) [8] | 152.1365 | - |
| LV End-Systolic Volume | mL | 50 (16–143) [8] | 62.5976 | - |
| RV End-Diastolic Volume | mL | 100–160 [6] | 152.6721 | - |
| RV End-Systolic Volume | mL | 50–100 [6] | 78.7093 | - |
| LV Ejection Fraction | % | 59.9 (18–76) [8] | 58.8543 | - |
| RV Ejection Fraction | % | 40–60 [6] | 48.4455 | - |
| Variable | Normal | SHF | RVHF | LOHF | HOHF | DHF |
|---|---|---|---|---|---|---|
| Heart Rate | 75 | 75 | 75 | 65 | 100 | 75 |
| LV Emax | 2.5 | 1 | 2.8 | 2 | 2.9 | 2.5 |
| LV P-V graph intercepted volume | 15 | 60 | 15 | 15 | 50 | 15 |
| LV End-Diastolic Volume | 112 | 137 | 120 | 112 | 132 | 112 |
| MV Resistance | 0.02 | 0.05 | 0.03 | 0.02 | 0.03 | 0.05 |
| AV Resistance | 0.002 | 0.005 | 0.003 | 0.006 | 0.008 | 0.005 |
| RV Emax | 0.85 | 0.35 | 0.3 | 0.85 | 0.85 | 0.85 |
| RV P-V graph intercepted volume | 50 | 60 | 50 | 50 | 50 | 50 |
| RV Initial Volume | 80 | 65 | 80 | 80 | 80 | 80 |
| TV Resistance | 0.02 | 0.05 | 0.03 | 0.03 | 0.03 | 0.05 |
| PV Resistance | 0.002 | 0.005 | 0.008 | 0.004 | 0.003 | 0.005 |
| LA Emax | 1 | 0.8 | 1 | 1 | 1 | 0.8 |
| LA BFR | 0.1 | 0.15 | 0.1 | 0.1 | 0.1 | 0.15 |
| RA Emax | 1 | 0.8 | 1 | 1 | 1 | 0.8 |
| RA BFR | 0.1 | 0.2 | 0.1 | 0.1 | 0.1 | 0.2 |
| Parameter | Units | Normal | SHF | RVHF | LOHF | HOHF | DHF | |||||||
|---|---|---|---|---|---|---|---|---|---|---|---|---|---|---|
| Min | Max | Min | Max | Min | Max | Min | Max | Min | Max | Min | Max | |||
| HR | Heart Rate | bpm | 75 | - | 75 | - | 75 | - | 65 | - | 100 | - | 75 | - |
| CO | Cardiac output | L/min | 6.7154 | - | 3.3494 | - | 5.5054 | - | 5.879 | - | 7.0117 | - | 3.7728 | - |
| LVV | Left Ventricular Volume | mL | 62.5976 | 152.1365 | 135.793 | 180.4515 | 50.9441 | 124.3494 | 70.7789 | 161.2252 | 90.635 | 160.7519 | 45.439 | 95.7433 |
| RVV | Right Ventricular Volume | mL | 78.7093 | 152.6721 | 117.8721 | 156.0561 | 128.5198 | 189.2988 | 78.5933 | 154.2769 | 77.3493 | 134.5208 | 74.253 | 115.8001 |
| LAV | Left Atrial Volume | mL | 19.3332 | 102.0856 | 27.195 | 83.431 | 18.7101 | 93.7377 | 20.826 | 114.4978 | 16.2727 | 80.9615 | 29.0205 | 84.0079 |
| RAV | Right Atrial Volume | mL | 7.3287 | 79.7041 | 11.3458 | 50.6052 | 11.3257 | 82.8504 | 9.0201 | 89.2757 | 6.2522 | 62.3506 | 9.909 | 50.3329 |
| AP | Arterial Pressure | mmHg | 68.47 | 144.3845 | 44.4787 | 81.3584 | 59.2085 | 122.4431 | 60.1552 | 129.1583 | 75.4493 | 146.3819 | 46.3871 | 89.3429 |
| LVP | Left Ventricular Pressure | mmHg | 1.8499 | 147.8072 | 7.9626 | 84.8965 | 1.3463 | 126.253 | 2.243 | 134.5208 | 3.4325 | 154.4136 | 1.1235 | 93.3702 |
| LAP | Left Atrial Pressure | mmHg | 0.4368 | 30.1822 | 0.5485 | 35.1587 | 0.4093 | 31.3536 | 0.4849 | 37.0309 | 0.3594 | 31.2227 | 0.5907 | 36.8683 |
| RVP | Right Ventricular Pressure | mmHg | 2.1612 | 41.7744 | 4.5958 | 30.7118 | 5.5388 | 37.0351 | 2.1566 | 41.3696 | 2.0972 | 41.3268 | 1.961 | 33.6142 |
| RAP | Right Atrial Pressure | mmHg | 0.2426 | 21.4079 | 0.2441 | 21.5873 | 0.2674 | 28.7435 | 0.2673 | 26.1614 | 0.1876 | 23.3241 | 0.2349 | 19.7209 |
| LVSV | Left Ventricular Stroke Volume | mL | 89.5389 | - | 44.6585 | - | 73.4053 | - | 90.4463 | - | 70.117 | - | 50.3043 | - |
| RVSV | Right Ventricular Stroke Volume | mL | 73.9628 | - | 38.184 | - | 60.779 | - | 75.6836 | - | 57.1715 | - | 41.5471 | - |
| LVEDV | Left Ventricular End-Diastolic Volume | mL | 152.1365 | - | 180.4515 | - | 124.3494 | - | 161.2252 | - | 160.7519 | - | 95.7433 | - |
| LVESV | Left Ventricular End-Systolic Volume | mL | 62.5976 | - | 135.793 | - | 50.9441 | - | 70.7789 | - | 90.635 | - | 45.439 | - |
| RVEDV | Right Ventricular End-Diastolic Volume | mL | 152.6721 | - | 156.0561 | - | 189.2988 | - | 154.2769 | - | 134.5208 | - | 115.8001 | - |
| RVESV | Right Ventricular End-Systolic Volume | mL | 78.7093 | - | 117.8721 | - | 128.5198 | - | 78.5933 | - | 77.3493 | - | 74.253 | - |
| LVEF | Left Ventricular Ejection Fraction | % | 58.8543 | - | 24.7482 | - | 59.0315 | - | 56.0993 | - | 43.6181 | - | 52.5409 | - |
| RVEF | Right Ventricular Ejection Fraction | % | 48.4455 | - | 24.4681 | - | 32.1075 | - | 49.057 | - | 42.5001 | - | 35.8783 | - |
© 2019 by the authors. Licensee MDPI, Basel, Switzerland. This article is an open access article distributed under the terms and conditions of the Creative Commons Attribution (CC BY) license (http://creativecommons.org/licenses/by/4.0/).
Share and Cite
Ortiz-León, G.; Barrantes-Vargas, H.J.; Arguedas-Sandí, M.; Pacheco-Chaverri, J.Á.; Vílchez-Monge, M. An Approximation of Heart Failure Using Cardiovascular Simulation Toolbox. Biomimetics 2019, 4, 47. https://doi.org/10.3390/biomimetics4030047
Ortiz-León G, Barrantes-Vargas HJ, Arguedas-Sandí M, Pacheco-Chaverri JÁ, Vílchez-Monge M. An Approximation of Heart Failure Using Cardiovascular Simulation Toolbox. Biomimetics. 2019; 4(3):47. https://doi.org/10.3390/biomimetics4030047
Chicago/Turabian StyleOrtiz-León, Gabriela, Heiner José Barrantes-Vargas, Manuel Arguedas-Sandí, Jose Ángel Pacheco-Chaverri, and Marta Vílchez-Monge. 2019. "An Approximation of Heart Failure Using Cardiovascular Simulation Toolbox" Biomimetics 4, no. 3: 47. https://doi.org/10.3390/biomimetics4030047
APA StyleOrtiz-León, G., Barrantes-Vargas, H. J., Arguedas-Sandí, M., Pacheco-Chaverri, J. Á., & Vílchez-Monge, M. (2019). An Approximation of Heart Failure Using Cardiovascular Simulation Toolbox. Biomimetics, 4(3), 47. https://doi.org/10.3390/biomimetics4030047