1. Introduction
Cloud computing is at the center of today’s digital transformation and modern IT ecosystem, initiating a revolutionary paradigm shift in data processing, storage, and management. As Internet of Things (IoT) technologies spread rapidly, handling the data generated by billions of Edge devices has become increasingly difficult with traditional infrastructure. Real-time execution of complex algorithms and big data analytics are possible using the high computing power, scalable resource management, and cost-effectiveness of Cloud computing. This technology is not only simple data storage, but also a critical foundation for the sustainability and accessibility of systems in various fields, including smart cities and autonomous systems.
End devices in IoT-based networks, such as smart home systems, generally face hardware bottlenecks, such as limited battery life, low processing capacity, and limited memory. These limitations made operating modern, locally based applications that require high-level computing difficult. The expansion of the IoT ecosystem has made the model of processing data only on central Cloud servers inadequate due to latency and bandwidth constraints. Hierarchical computing architectures, developed to overcome these bottlenecks and limitations, bring computational power closer to the data source by involving Edge and Fog layers into the process. Here, the Edge layer enables real-time, low-latency processing on the Edge devices where the data is generated or on local nodes located very close to them; the Fog layer serves as a strategic link between these two endpoints, offering a wider coverage area and moderate resource capacity. The addition of the Cloud layer to the three-layer (Edge–Fog–Cloud) architecture enhances the scalability of modern networks. However, the heterogeneous resource structure and varying energy characteristics of each layer make system management a complex optimization problem.
At this point, the task-offloading mechanism serves as a critical solution to the system’s optimization problem, in which the end devices have limited energy and processing capacity. This mechanism involves strategically transferring the heavy calculation workload from local devices to powerful Cloud or Edge servers. Efficient task-offloading management under dynamic and fluctuating network conditions has recently become a primary area of research due to the need to balance energy efficiency and computing speed.
Although many studies focus on either Cloud computing or Edge computing alone, the real challenge involves selecting the appropriate choice between the Edge and Fog layers to meet application needs (e.g., latency sensitivity, data size, and energy consumption). This intelligent layer selection is performed under dynamic network conditions, and it extends the system’s total lifespan while also improving quality of service (QoS) by reducing latency.
The current approaches in the mentioned literature usually address the trade-off between energy and latency by using static threshold values or single-layer architectures. However, in modern IoT ecosystems with a heterogeneous task structure, the requirements of each task and the network’s current load status change dynamically. This situation means that solutions focused only on the Cloud or only on Edge computing are insufficient for requirements.
Despite the significant advancements in IoT resource management, achieving a seamless balance between energy efficiency and latency in multi-layered architecture remains a formidable challenge. Traditional task-offloading strategies tend to prioritize a single performance metric or assume a uniform application environment, which is seldom true in reality. This leaves a research gap, especially in terms of adaptive frameworks. While taking distributed networks into account, these frameworks can navigate the complex interplay between heterogeneous Edge and Fog layers.
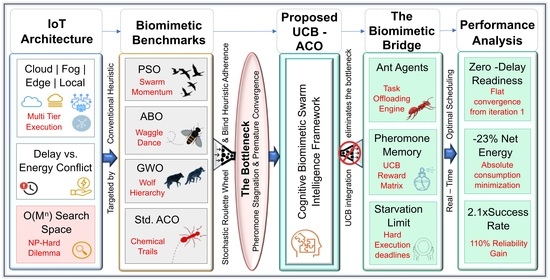
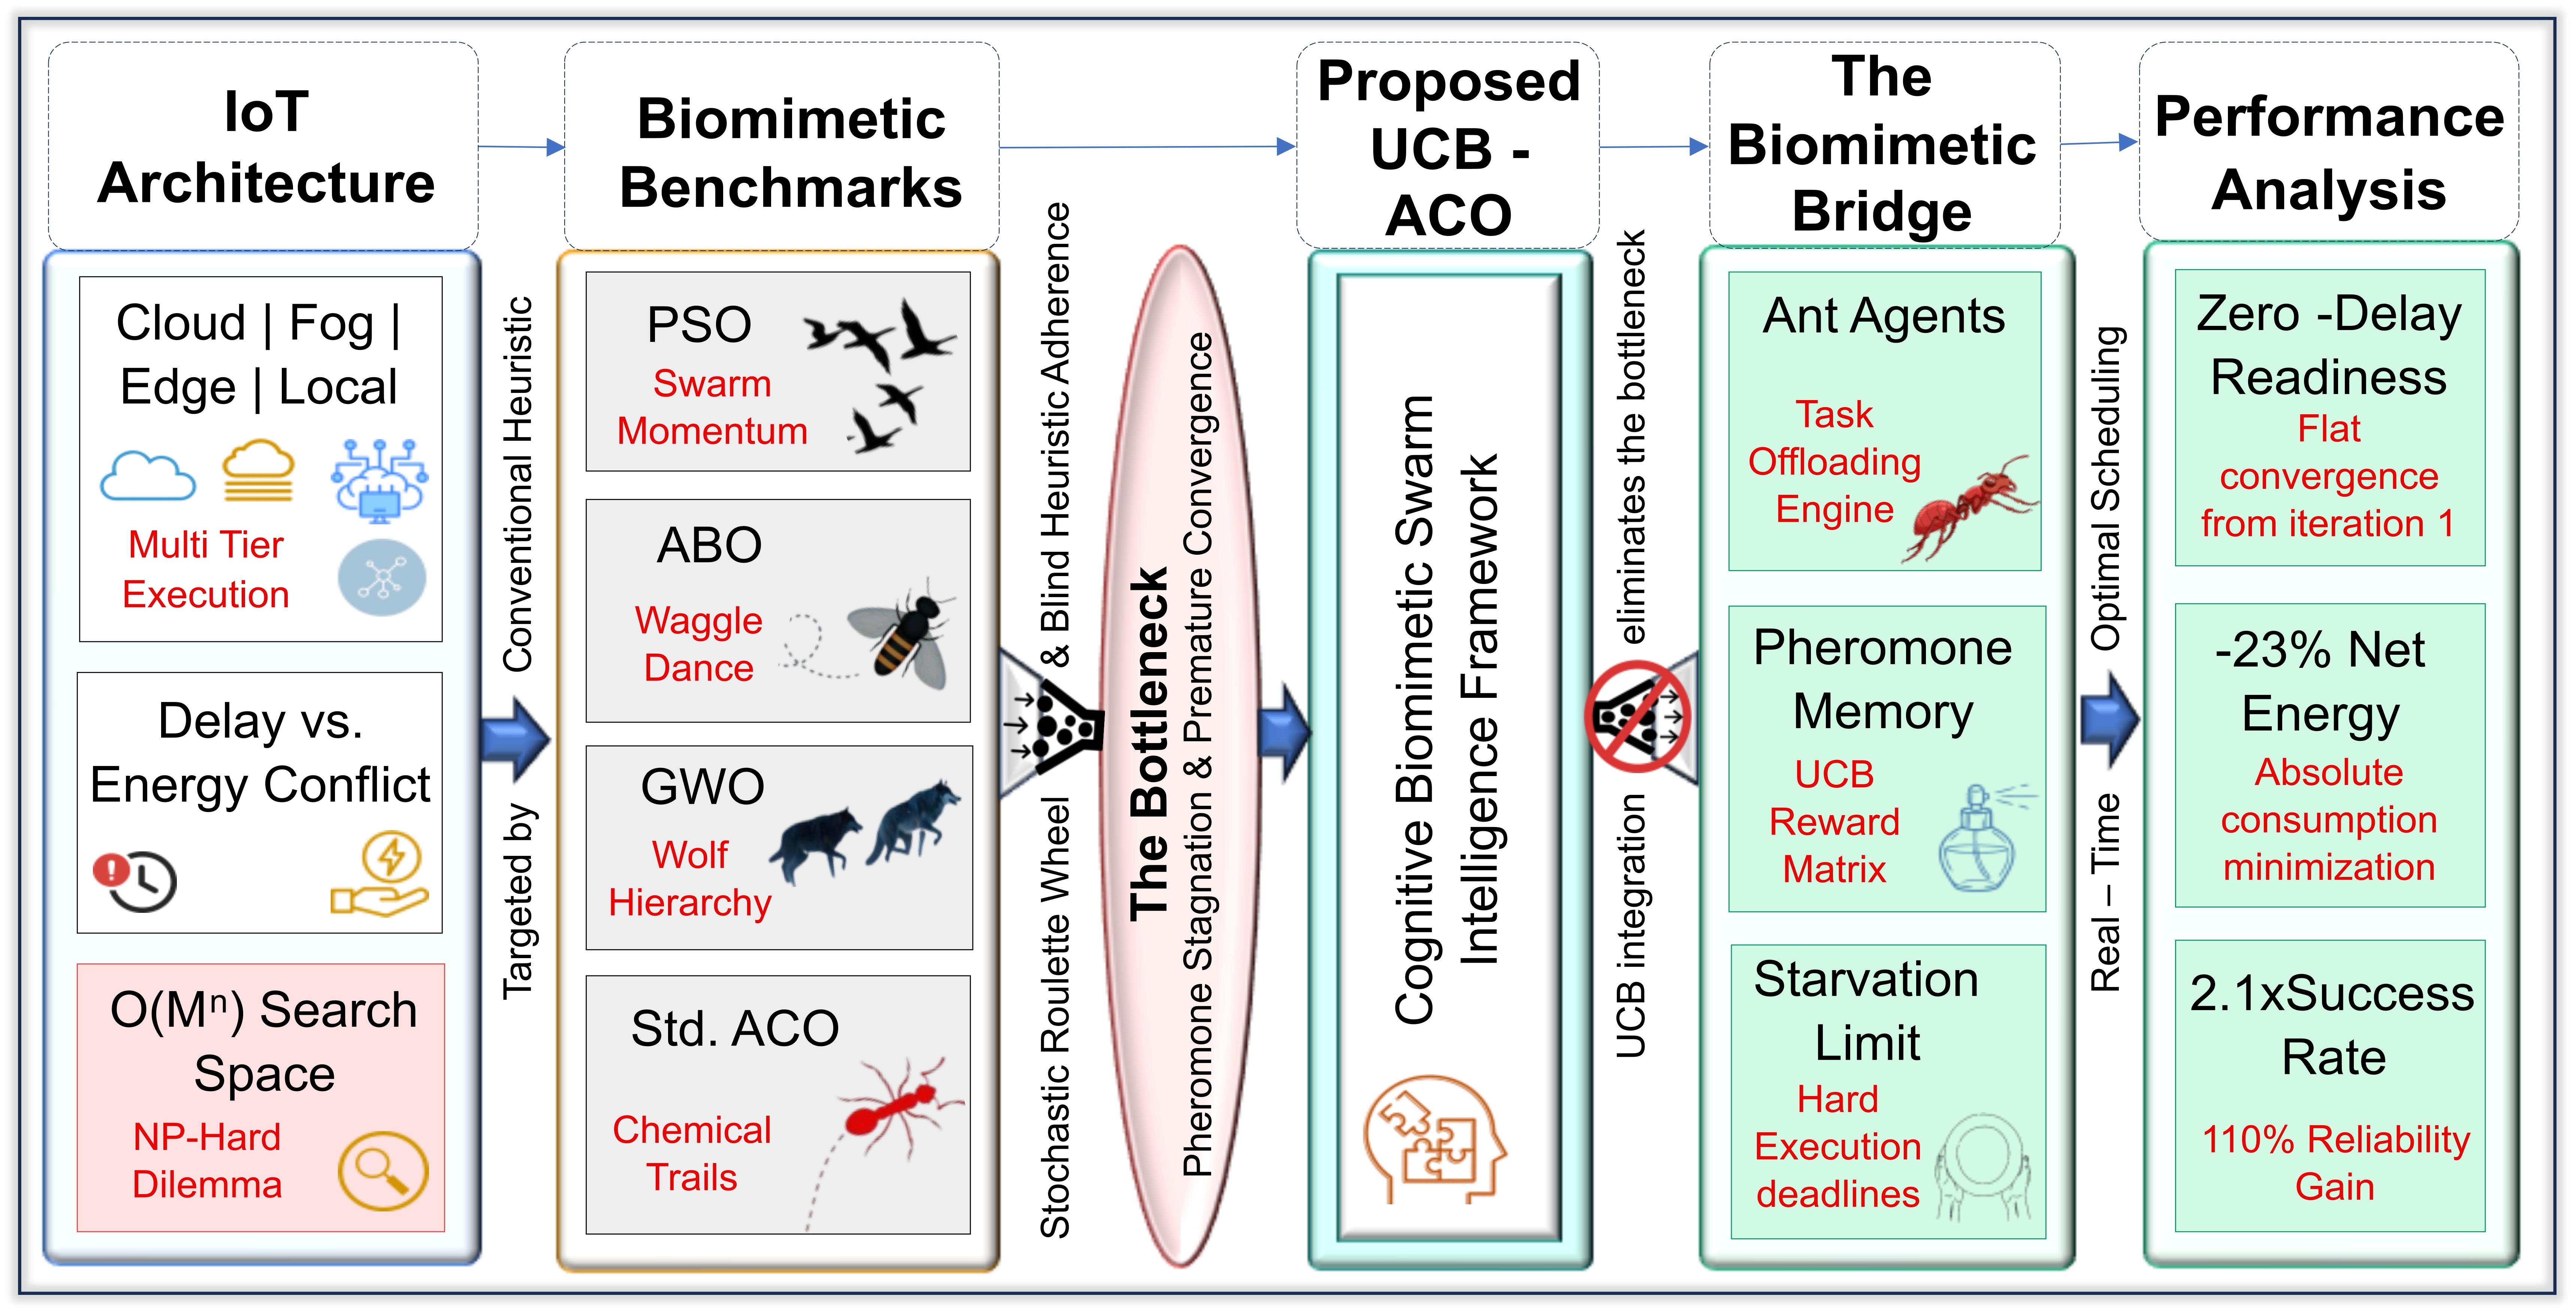
In many ways, IoT and Edge–Fog–Cloud architectures mirror biological ecosystems in their highly decentralized, dynamic nature. In nature, organisms such as ant colonies or bee swarms operate without centralized control. Nevertheless, they flawlessly execute complex tasks like resource allocation, workload distribution, and survival under severe energy constraints. The goal of biomimetics, or bionics, is to translate these evolutionary optimization mechanisms into mathematical models to solve complex engineering problems. Consequently, swarm intelligence-based biomimetic algorithms, particularly Ant Colony Optimization (ACO), have emerged as a natural fit for multi-tiered network environments. Traditional deterministic methods simply collapse under the weight of NP-hard task-offloading challenges. To resolve this, bio-inspired computational models mimic the pheromone signaling. These models also mimic adaptive choices of biological ants, thus they provide a robust, decentralized alternative. However, mapping raw biology directly onto artificial networks reveals a clear bottleneck. Real IoT channels are highly volatile, with volatile fluctuations and stochastic latency. Standard biological pheromone buildup is simply too slow to handle these rapid network shifts.
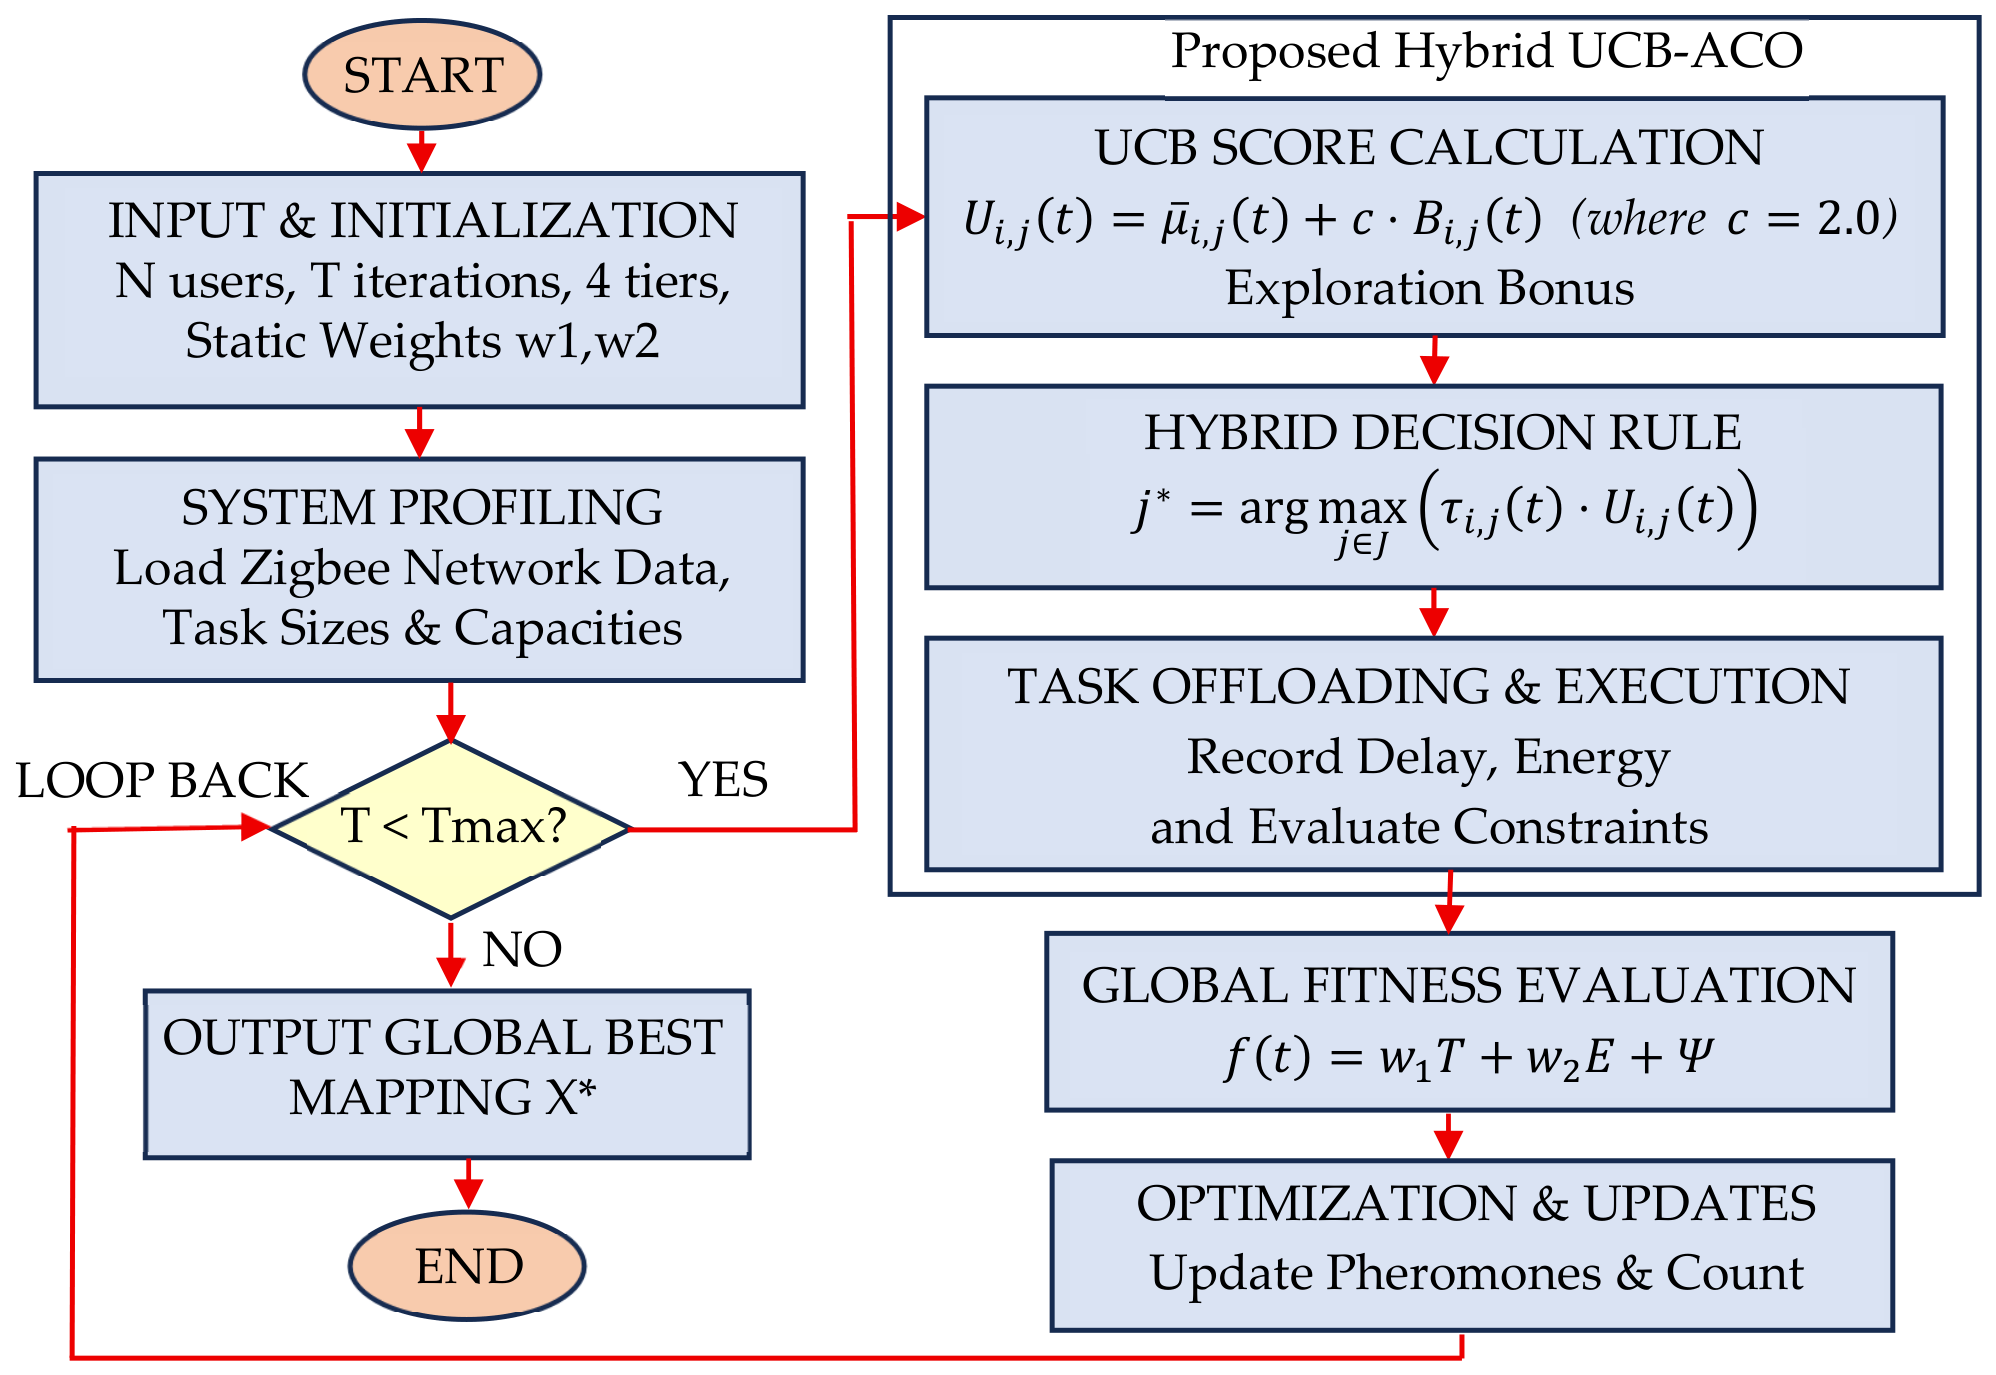
This operational gap is directly bridged here. Traditional bionics is elevated into a specialized “cognitive biomimetic” framework. This transition is achieved by upgrading the classic ACO structure with a learning-guided mechanism. Crucially, basic, blind swarm intelligence is surpassed. Actual higher-order cognitive functions are mimicked instead. Specifically, historical interaction data is utilized to actively balance exploration and exploitation. Through this integration, algorithmic agents are enabled to adapt to sudden network fluctuations on the fly. Ultimately, the feasibility of mathematically evolving nature-inspired concepts is proven. The successful orchestration of complex, multi-dimensional computing ecosystems is thus achieved. To address these limitations, this study proposes a novel hybrid meta-heuristic framework that integrates the Upper Confidence Bound (UCB)-inspired exploration mechanism with Ant Colony Optimization (ACO). In the context of this architecture, the integration of UCB does not imply a strict statistical framework; it is an adaptive empirical tracking mechanism. Unlike standard optimization techniques, the proposed UCB-ACO model dynamically allocates tasks while simultaneously minimizing energy consumption and latency. This hybrid mechanism leverages ACO’s exploration capabilities and UCB’s selection efficiency for robust decision-making. With this, multi-layered offloading processes can be managed adaptively.
One of the primary contributions of this research is the granular performance assessment conducted across multiple application types, reflecting the diverse workload characteristics of modern IoT systems. The effectiveness of the UCB-ACO model is rigorously validated through extensive simulation scenarios. The model performance is compared against established benchmarks, including ACO, Particle Swarm Optimization (PSO), Gray Wolf Optimizer (GWO), Artificial Bee Colony Optimization (ABO), and Non-dominated Sorting Genetic Algorithm II (NSGA-II). The findings demonstrate that the proposed model significantly outperforms traditional methods. It has provided more balanced and scalable solutions, especially in discrete and multi-objective optimization environments.
This paper proposes an ACO algorithm that addresses the Edge–Fog–Cloud hierarchy in an integrated manner and is enhanced with a UCB-based exploration capability, with the aim of overcoming the aforementioned limitations. The main contributions of this study can be summarized as follows:
Proposing a multi-objective task-offloading model that simultaneously optimizes energy consumption and latency,
Developing a hybrid meta-heuristic algorithm capable of making dynamic decisions between the Edge and Fog layers,
Demonstrating the performance advantage of the proposed model over traditional methods through comprehensive simulations.
Conducting application-based comparisons across multiple application types to validate the proposed model’s effectiveness under diverse workload requirements.
The rest of the article is organized as follows:
Section 2 presents relevant studies in the literature and statistical analyses;
Section 3 details the proposed system model and mathematical framework.
Section 4 presents the proposed optimization method, and
Section 5 presents the experimental results.
Section 6 discusses the findings, and
Section 7 outlines future research objectives.
2. Related Work
In this section, the current state and solution approaches to the task-offloading problem in multi-tier network architectures are investigated from an integrated perspective. In heterogeneous structures consisting of mobile devices, Edge, Fog, and Cloud servers, the computational load created by multi-user scenarios and different application types (multi-applications) takes the problem to a complexity beyond traditional methods. Especially, the conflicting nature between minimizing energy consumption and optimizing latency makes the problem display a character of multi-objective and NP-hard. To present this complexity systematically, the literature review was categorized into three main areas. First, recent survey studies were summarized to identify general trends in the field; then, studies focusing on energy and latency were assessed. Second, given that these problems involve such trade-off mechanisms and are naturally complex, the types of optimization methods that should be selected—specifically meta-heuristic and bio-inspired optimization methods such as Non-dominated Sorting Genetic Algorithm II (NSGA-II) [
1], Ant Colony Optimization ACO [
2], Particle Swarm Optimization (PSO) [
3], Artificial Bee Colony Optimization (ABO) [
4], and Gray Wolf Optimizer (GWO) [
5] which are used to scan this complex solution space—have been evaluated comparatively in terms of their performance and application areas as reported in the literature. Finally, the studies in the literature were examined on a comparative table to emphasize the differences and improvements in the proposed study.
2.1. Surveys
To establish a rigorous conceptual baseline for distributed resource management, comprehensive review studies published over the past five years have been systematically analyzed [
6,
7,
8,
9,
10,
11,
12,
13,
14,
15,
16,
17,
18,
19,
20]. Rather than treating the prior literature in a purely narrative or qualitative manner, this subsection clusters recent survey findings into three sequential thematic groups. This approach highlights the architectural evolution of paradigms, intelligence-driven algorithmic distributions, and multi-objective metric quantifications across the Cloud–Edge continuum.
2.1.1. Algorithmic Paradigms and Architecture in Fog–Cloud Topologies
There is a dramatic shift away from centralized Cloud infrastructures toward layered, highly heterogeneous computing nodes in the recent meta-analytical literature. In Fog computing networks, for example, structural mappings emphasize the need for a new generation of genetic algorithm topologies that navigate volatile resource heterogeneity [
6]. A statistical analysis of the broader algorithmic distribution in this domain shows that 25% of workflow planning models use classical heuristics, but 75% use advanced artificial intelligence (AI)-driven or parametric modeling frameworks [
7]. A comprehensive review of the scheduling literature found that 97% of evaluated studies formulate the problem as multi-objective, with empirical simulation environments being used as primary validation methods in 51% of these frameworks [
8]. In order to solve these operational bottlenecks, overarching taxonomies have extensively mapped task scheduling and resource allocation boundaries across unified Fog, Edge, and hybrid architectures [
9]. There is a lot of momentum here, as 31% of foundational survey publications are coming out within the last three years. Quantitative resource allocation metrics prioritize execution cost (28.7%), network latency (24.1%) and deterministic execution time (22.2%) [
10].
2.1.2. Latency-Sensitive Edge/MEC Topologies and Intelligent Frameworks
Optimization challenges for high-density, latency-sensitive applications where real-time computing and strict reliability are crucial can also be found in the literature. Researchers confirm latency, energy consumption, and cost are the tri-focal parameters in distributed orchestration, with latency being the most frequently addressed [
11]. These studies also note that large-scale meta-heuristic deployments get slowed down by manual hyperparameter tuning [
11]. A robust Edge AI infrastructure and specialized resource management frameworks are required to solve this problem [
12]. Particularly since standard Cloud paradigms are not suitable for time-critical IoT loops due to backhaul propagation bottlenecks [
13]. Meta-heuristics prove powerful scaling advantages when searching massive, unexplored solution spaces in multi-access Mobile Edge Computing (MEC) to circumvent these limitations [
14]. Additionally, recent surveys highlight the urgent need for lightweight, adaptive, and context-aware confidence frameworks that enable real-time, intelligent decision-making in decentralized environments [
15].
2.1.3. Quantitative Metric Allocation and Multi-Objective Trade-Offs
Offloading objective functions are the topic of the third thematic cluster. An analysis of data offloading frameworks in industrial IoT environments shows that time-related criteria (e.g., delay) and energy usage account for 24% and 20% of the active literature, respectively [
16]. Classifying these mechanisms into classical, heuristic, and AI-based models reveals that communication parameters have a non-negligible impact on latency and power consumption [
17]. Soft computing frameworks emphasize that ignoring localized trade-offs between delay, energy, and cost leads to suboptimal solutions that severely impact the efficiency of global systems [
18]. From an energy-centric perspective, specialized scheduling reviews report that energy parameters dictate 28% of data transfer optimization efforts, followed by time variables at 16% [
19]. According to these reports, traditional meta-heuristics have slow convergence profiles and high computational complexity, so hybrid meta-heuristics and machine learning integration are the most viable [
19]. Compared to recent quality of service (QoS) mappings, energy efficiency takes the top spot at 22.86%, delay takes the third spot, and optimization problems remain the top academic driver in modern research [
20].
2.2. Energy- and Latency-Focused Studies
In task-offloading processes, energy consumption and end-to-end latency represent the two most critical parameters governing system performance. Literature reviews show that researchers prioritize divergent optimization objectives because of the inherent trade-off between these two metrics. For example, some approaches emphasize energy efficiency to make resource-constrained Edge nodes last longer, while others focus on low latency to satisfy real-time application requirements. In some studies, different metrics are given different priority weights; for instance, time and energy are given 24% and 20% priority, respectively [
16]. Alternative findings show energy as the top priority at 28%, followed by time at 16% [
19]. Also, latency (22%) and energy consumption (17%) remain the top two research challenges in MEC environments, as a wide-ranging analysis shows that latency and energy are the primary metrics of interest across 93 and 75 studies, respectively [
17].
Delay, energy consumption, and cost are the main performance metrics, while delay is the most frequently evaluated [
11]. A balanced trade-off that mitigates energy load while maintaining overall system performance can be achieved using multi-objective optimization techniques [
20]. According to [
8], 97 percent of studies use multi-objective formulations—like minimizing delays and SLA violations while meeting deadlines—while a negligible fraction (3%) consider single-objective approaches. In Cloud computing environments, metrics like makespan, resource utilization, load balancing, and cost have a high significance level above 50%, while in Fog computing, makespan, delay, energy consumption, execution time, and cost win.
In Fog computing, energy efficiency is a key criterion, since most strategies to minimize processing time are dependent on latency or energy savings [
10]; similarly, traffic state optimization was modeled as a multi-objective problem to balance computational load, energy consumption, and communication latency [
12]. To conserve energy, Edge devices often get slower when they are running less computationally; this simultaneous optimization of conflicting objectives requires complex compromises, making it hard to find a near-optimal task allocation strategy in heterogeneous and dynamic Cloud and Fog environments [
7]. Consequently, computational task offloading is widely recognized as a multi-objective, NP-hard optimization problem that cannot be solved in polynomial time using classical deterministic methods [
13].
An evaluation of proposed architectural frameworks in the literature reveals clear distinctions regarding their hierarchical depth and architectural scope. To maximize conflicting goals such as processing time (makespan) and energy consumption, some studies focus solely on “Cloud” computing [
21]. This omits intermediate Fog and Edge layers which add complexities to the structure and network. A substantial portion of the literature structures task allocation across dual-layer paradigms, including Fog–Cloud [
22,
23], Edge–Cloud [
24,
25], or intricate Mixed Fog/Cloud infrastructures [
26]. Specifically, Ref. [
24] proposes a collaborative Edge and Cloud framework to solve IoT-based computational discharging problems. It uses three distinct Constrained Multi-Objective Evolutionary Algorithms (CMOEAs). Meanwhile, the J-NECORA framework presented in [
27] targets industrial IoT scenarios and mobile nodes to address the Cloud–Edge–Things continuum. In a similar vein, Ref. [
25] investigates task offloading within Edge–Cloud systems through the lens of pricing and deadline constraints. But Ref. [
28] directly focuses on the Cloud–Fog interaction to achieve an optimal energy–delay balance.
To further enhance architectural depth, another approach leverages three-tier hierarchies spanning local, Fog, and Cloud layers [
22]. Some approaches utilize multi-user MEC networks covering mobile device (MD), Edge, and Cloud layers [
29,
30]. Among these hierarchical designs, frameworks combining the Cloud, Edge, and Terminal (MD) layers [
29] present one of the closest architectural archetypes to the full four-tier continuum. Rather than proposing explicit algorithmic solutions, certain works provide essential theoretical foundations. The study in [
31] offers a comprehensive survey comparing Cloud, Edge, and Fog information technologies on an application-dependent basis. While Ref. [
32] compares the technical parameters of Fog, Cloudlet, and MEC to establish a decision tree for the initial framework design phase.
To scan the complex solution space, a broad methodological spectrum ranging from deterministic mathematical models to advanced meta-heuristic algorithms has been applied in the literature. Within the domain of mathematical programming, Semidefinite Relaxation (SDR)-based techniques have been utilized to minimize the weighted cost of energy consumption and delay under multi-user structures and resource (bandwidth, power) constraints in Mixed Fog/Cloud systems [
26]. Similarly, SDR-based algorithms have been proposed for task offloading from a single mobile device to multiple end devices while jointly optimizing energy, latency, and CPU frequency scaling [
33]. In addition to analytical models, game-theoretic approaches such as the Wardrop Equilibrium have been introduced to solve task offloading in Edge–Cloud networks by classifying tasks as hard or soft based on time constraints [
25].
Regarding classic heuristics and meta-heuristics, three distinct CMOEAs were developed to simultaneously optimize energy consumption and time constraints [
24], while a discrete version of the Non-dominated Sorting Genetic Algorithm II (D-NSGA-II) was implemented using classical evolutionary operators for delay minimization in Fog–Cloud systems [
23]. Under the swarm intelligence paradigm, a Non-dominated PSO (NPSO) algorithm was introduced to achieve an energy–delay balance in multi-application scenarios such as smart agriculture [
28]. Furthermore, control designs leveraging PSO have been explored for IoT applications using Edge–Cloud layers, though operating within Model Predictive Control (MPC) frameworks rather than explicit task offloading [
34]. To address processing costs and load balancing in Cloud environments, an Enhanced Firefly Algorithm (IFA) was driven to optimize execution parameters [
35]. Additionally, hybrid meta-heuristics have been formulated to balance the exploration and exploitation phases in the search process, specifically aiming to mitigate local solution stagnation and premature convergence issues [
21].
To cope with the high volatility and uncertainties of dynamic IoT environments, learning-guided and artificially intelligent mechanisms have recently gained prominence. Within the scope of deep learning, a Deep Fusion Generative Adversarial Network (DFGAN) framework was introduced to simultaneously optimize multiple objectives including latency, cost, load balancing, and resource utilization across Cloud, Edge, and Terminal layers [
29]. Similarly, a Distributed Deep Learning-based Offloading (DDLO) method was implemented to handle application-based latency constraints and maintain an energy–latency balance in multi-user multi-server MEC networks [
30].
When online learning and intelligent exploration of unknown Edge nodes are required, Multi-Armed Bandit (MAB) learning approaches offer viable alternatives. In this context, a standard Upper Confidence Bound (UCB1) reinforcement learning approach was applied to jointly optimize energy consumption and latency in maritime IoT networks. The authors further introduced a novel UCB variant, namely UCB1-ESSS, to adaptively balance advantages and costs during the Edge server selection process [
36]. Although these learning-driven models provide remarkable adaptability, existing solutions in the literature either rely on pure machine learning architectures without hybridizing with robust meta-heuristics such as ACO or PSO, or they remain restricted to highly specialized, domain-specific deployment areas like maritime or industrial scenarios.
2.3. Problem Complexity
In Cloud and Fog computing-based network architectures, energy efficiency and low latency are the most fundamental performance metrics determining the operational success of the system. The limited battery capacity of Edge devices (IoT nodes) makes minimizing energy consumption essential for extending the network’s lifespan. Furthermore, latency directly impacts the quality of service (QoS) of critical applications, especially those requiring real-time response, and determines the reliability of the system.
In task-offloading processes, energy consumption and latency typically appear as conflicting objectives, which makes it difficult to optimize both simultaneously. Although transferring a task from a local endpoint to a more powerful Edge, Fog, or Cloud node saves processing energy, it increases network latency and communication-related energy costs. On the other hand, aggressive computational choices aimed at minimizing latency can result in an excessive energy load on nodes with limited resources. This situation results in the problem taking on a multi-objective optimization structure and requires the system to find an acceptable trade-off point between the two metrics.
2.4. Optimization Framework
The Mathematical Nature of Task-Offloading Processes: Task offloading problems inherently have a discrete, global, and multi-objective optimization structure. The problem exhibits a discrete nature because the decision to assign tasks to a specific node or keep them locally requires a binary (“0–1”) integer-based selection process. Moreover, the fact that the optimal solution involves searching the entire search space in variable network topologies places the problem within the category of global optimization. The need to simultaneously optimize conflicting objectives such as energy efficiency, computational latency, and bandwidth usage further reinforces the multi-objective nature of the problem. When these complex characteristics are put together, the problem’s solution space grows exponentially with the number of tasks and nodes, and the solution process reaches an NP-hard level.
A review of the discrete, global and multi-objective nature of task offloading studies in the literature is presented below.
Discreteness: Many formulations use binary or mixed-integer variables to indicate whether a task (or subtask) is executed locally, at an Edge server, at a Fog server, in the Cloud, or at another device:
Task offloading is modeled as a mixed-integer non-linear programming (MINLP) problem in multi-UAV MEC and solved via splitting and rounding methods [
37].
Cooperative MEC offloading is cast as a bi-level problem where upper-level offloading decisions are constructed by an ant colony system over discrete modes (local/cooperative/server) [
38].
Gray wolf-based WOLVERINE explicitly uses a binary multi-objective GWO algorithm for offloading decisions in collaborative MEC [
39].
Dependent-task offloading in MEC is formulated as an NP-hard problem with binary assignment of subtasks to heterogeneous nodes, solved via multi-objective PSO [
40].
Several multi-objective evolutionary or PSO approaches encode offloading as discrete genes/particles, sometimes with partial-offload ratios as additional continuous variables, leading to hybrid discrete–continuous spaces [
39,
41,
42].
These models clearly implement discretization through 0–1 (or small integer) variables that specify the offload location or mode, and this is typically combined with continuous resource allocation decisions [
37,
38,
41,
43].
Global Optimality: Suboptimal trapping creates a risk during local search, because offloading spans heterogeneous tiers and nodes (e.g., end, Edge, Fog, Cloud, UAVs, satellites, vehicles).
Multi-tier and collaborative settings, such as Cloud–Edge–end, MEC–vehicular Fog, and Terminal–satellite–Cloud, are modeled as NP-hard MINLP/CMOP problems. This makes meta-heuristics or DRL necessary for global exploration [
37,
43,
44,
45,
46].
WOLVERINE specifically uses the evolutionary, multi-objective GWO algorithm to explore the global Pareto front in highly coupled, NP-hard search space [
39].
Bi-level CoMECO offloading uses ACO with a local search to find approximate solutions to problems involving strong coupling between discrete offloading and continuous resources [
38].
Surveys and related work sections emphasize that greedy or heuristic local strategies can become trapped in local optima, particularly in dependent tasks and heterogeneous layers [
40,
45,
47].
Offloading should be treated as a global (combinatorial) search rather than a local optimization, especially when it is used on a large scale.
Multi-objectivity: A significant body of research explicitly defines offloading as multi-objective optimization, typically balancing factors such as delay/latency, energy consumption, and occasionally monetary or resource cost:
Delay-energy CMOP in MEC/Fog is solved via evolutionary algorithms to obtain a Pareto optimal front [
43].
Latency, energy usage, and resource costs are optimized jointly via a multi-objective framework using binary GWO offloading [
39].
Time delay, energy consumption, and task execution cost are minimized jointly by PSO in IIoT MEC [
42].
Multi-objective offloading algorithms in Cloud–Edge–end collaboration minimize average latency and energy consumption for complex, dependent tasks [
47,
48].
Cloud–Edge collaborative schemes for 6G and vehicular/MEC networks minimize latency and energy by often aggregating them into system cost or exploring the full Pareto set using MOEAs or DRL [
44,
45,
48,
49,
50].
Earlier Fog–Cloud work minimizes a weighted combination of delay, energy, and Cloud payment. This is explicitly framed as a multi-objective problem and then relaxed [
43].
These studies either (i) maintain a Pareto-based multi-objective view [
39,
40,
43,
45,
47,
48,
50], or (ii) encode multi-objective trade-off using weighted sums or utility functions (e.g., latency–energy cost functions) [
42,
44,
49,
51]. As mentioned in both cases, the fundamental structure is multi-objective. Improving latency usually worsens energy or cost, and vice versa [
39,
43,
47].
Three main approaches have emerged in the literature for solving complex network problems: exact methods, heuristic approaches, and meta-heuristic algorithms. While exact methods such as “Branch and Bound” or “Dynamic Programming” guarantee an exact optimal solution for small-scale networks, they are inadequate for large and hierarchical network scenarios due to computational costs. Methods such as Deep Reinforcement Learning (DRL), Game Theory, and meta-heuristics are widely used to overcome this bottleneck and facilitate real-time decision-making processes. These methods aim to generate “good enough” solutions that are as close as possible to the optimal result in a reasonable amount of time. They do this by scanning complex solution spaces with intelligent scanning mechanisms.
The main reason to prefer meta-heuristic, genetic, and bio-inspired optimization methods is that these algorithms exhibit a high balance of exploration and exploitation in complex, multi-dimensional search spaces. Methods such as ACO or GA demonstrate a high degree of resilience in reaching the global optimum without getting stuck at local optima by imitating collective intelligence found in nature. Especially in energy-constrained and dynamic IoT environments, the flexibility offered by these algorithms enables them to generate stable solutions under non-linear constraints without requiring the mathematical model derivative. These features make meta-heuristic approaches superior and more adaptive than traditional methods in the management of heterogeneous resources within hierarchical Edge–Fog–Cloud architectures.
Optimization Methods Used
In hierarchical Edge–Fog–Cloud architectures, the task-offloading decision requires a complex optimization process due to the size of the solution space and the NP-hard nature of the problem. The inefficiency of traditional mathematical modeling methods when applied to a large scale in terms of computational cost and dynamic networks have made meta-heuristic and bio-inspired algorithms widespread in the literature. In this subsection, an evaluation is conducted on how meta-heuristic algorithms—which stand out particularly for their global search capabilities and resistance to getting stuck in local optima—are adapted to task-offloading problems, the challenges encountered, and the proposed solutions in the literature.
To map out current trends and highlight essential factors in the field of offloading, review studies on offloading conducted over the past five years were examined.
This review states that, in the 35 studies examined, the most commonly used techniques were heuristic methods, suggesting a trend towards these methods in data offloading approaches [
16]. Genetic algorithms are used to discover and develop the most suitable solutions for task scheduling, load balancing and resource allocation, taking various parameters and constraints into account in the field of Edge artificial intelligence and data offloading scenarios [
12,
15,
18]. It has been emphasized that the greatest advantage of heuristics is their ‘acceptable cost’, but that they do not guarantee optimality [
10,
12]. The study states that, in optimization problems, a heuristic method is a technique that aims to solve the problem more quickly than traditional methods by compromising on completeness, accuracy, optimality or precision [
14]. Heuristic algorithms rank first at 31.5% among Resource Allocation Techniques [
10].
As heuristic algorithms are experience-based techniques that do not guarantee an optimal result, meta-heuristics provide general computational intelligence frameworks that can be adapted to different optimization problems with minimal modification and potentially offer a sufficiently good solution [
14]. Particularly in task-scheduling processes within artificial intelligence-enabled Internet of Things (AIoT) systems, meta-heuristic methods such as GA and PSO offer critical efficiency in generating near-optimal solutions with low computational load for energy-constrained Edge devices [
12]. In multi-objective optimization problems, a suitable Pareto front provides greater flexibility in selecting the solution that offers the best trade-off between optimization criteria. The most common solution to the problem of generating a Pareto set, which involves high computational costs, is through the use of meta-heuristics capable of obtaining a near-optimal front [
6]. For these reasons, Meta-heuristic algorithms, which aim to find the optimal or near-optimal solutions to resource allocation problems in a reasonable timeframe, are used in 9.2% of cases [
10]. On the other hand this study indicates that meta-heuristic methods can be used for large-scale optimization but highlights the difficulty of tuning sensitive hyperparameters [
11].
Some research into task-offloading optimization has been conducted using heuristic and meta-heuristic methods; however, these methods have certain shortcomings. The main problem with meta-heuristic methods is that they can become trapped in local optima. To obtain a globally optimal solution, they must strike a balance between exploration and exploitation. Furthermore, meta-heuristic algorithms have numerous hyperparameters, which are often difficult to tune. These are parameters that must be set manually by the researcher [
13].
Although different objectives need to be optimized simultaneously, they are often inconsistent or incompatible, frequently requiring different trade-offs and compromises. This leads researchers to frequently use a mixture of various heuristic algorithms to address critical parameters in resource allocation and workflow planning [
7].
The modern literature addresses task-offloading optimization in MEC and IoT networks under three main categories: classical, heuristic, and artificial intelligence-based methods. Whilst classical methods guarantee a global optimum, the exponential growth of the search space in complex network structures renders these approaches unsuitable for large-scale systems. Although heuristic and meta-heuristic methods offer ‘near-optimal’ solutions by increasing convergence speed, the need to reconfigure the algorithm in scenarios where environmental parameters change dynamically poses a significant constraint. At this point, the development of robust approaches that gradually improve system performance through feedback mechanisms and offer higher adaptability constitutes the focus of current research [
17].
Consequently, there is an increasing number of hybrid algorithms in the literature. Among the algorithms categorized as heuristic, meta-heuristic, and hybrid meta-heuristic algorithms, nearly half of the solutions fall into the heuristic category, whilst 39% of the studies are based on meta-heuristic algorithms. The remaining 12% are hybrid meta-heuristic algorithms [
8]. The findings of this study suggest that hybrid meta-heuristic algorithms and the integration of machine learning could represent promising opportunities for future research [
19].
In the conceptual hierarchy, standard heuristics are ‘shortcut’ rules developed specifically for a particular problem, which are fast but generally yield suboptimal results. Meta-heuristic frameworks, on the other hand, are general-purpose strategy templates that go beyond such simple rules and can be adapted to almost any type of optimization problem (such as ACO, PSO or Simulated Annealing). GAs are a very specific and powerful type within this meta-heuristic family, inspired by biological evolution. In summary: heuristics are problem-specific tactics, meta-heuristics are general game plans that govern these tactics, and GAs are one of the most popular versions of this plan that operates via evolutionary mechanisms. Meta-heuristic frameworks demonstrate greater resilience compared to standard heuristic methods by striking an effective balance between global exploration (diversification) and local exploitation (convergence); this typically leads to consistent and reliable performance across various optimization tasks [
52].
There are numerous machine learning techniques, and many of these can be integrated into meta-heuristic frameworks to improve or guide the exploration of the solution space. Many machine learning techniques can enhance and enrich meta-heuristic methods. Machine learning can be used for training to predict promising regions of the search space, thereby allowing meta-heuristic methods to avoid a large portion of the exploration process and instead focus on regions where the best solutions are already expected. Convergence speed can thus be improved [
53]. The topic of hybrid meta-heuristic methods is a highly comprehensive one. Comprehensive information on the methods, their taxonomy and approaches are provided in [
52].
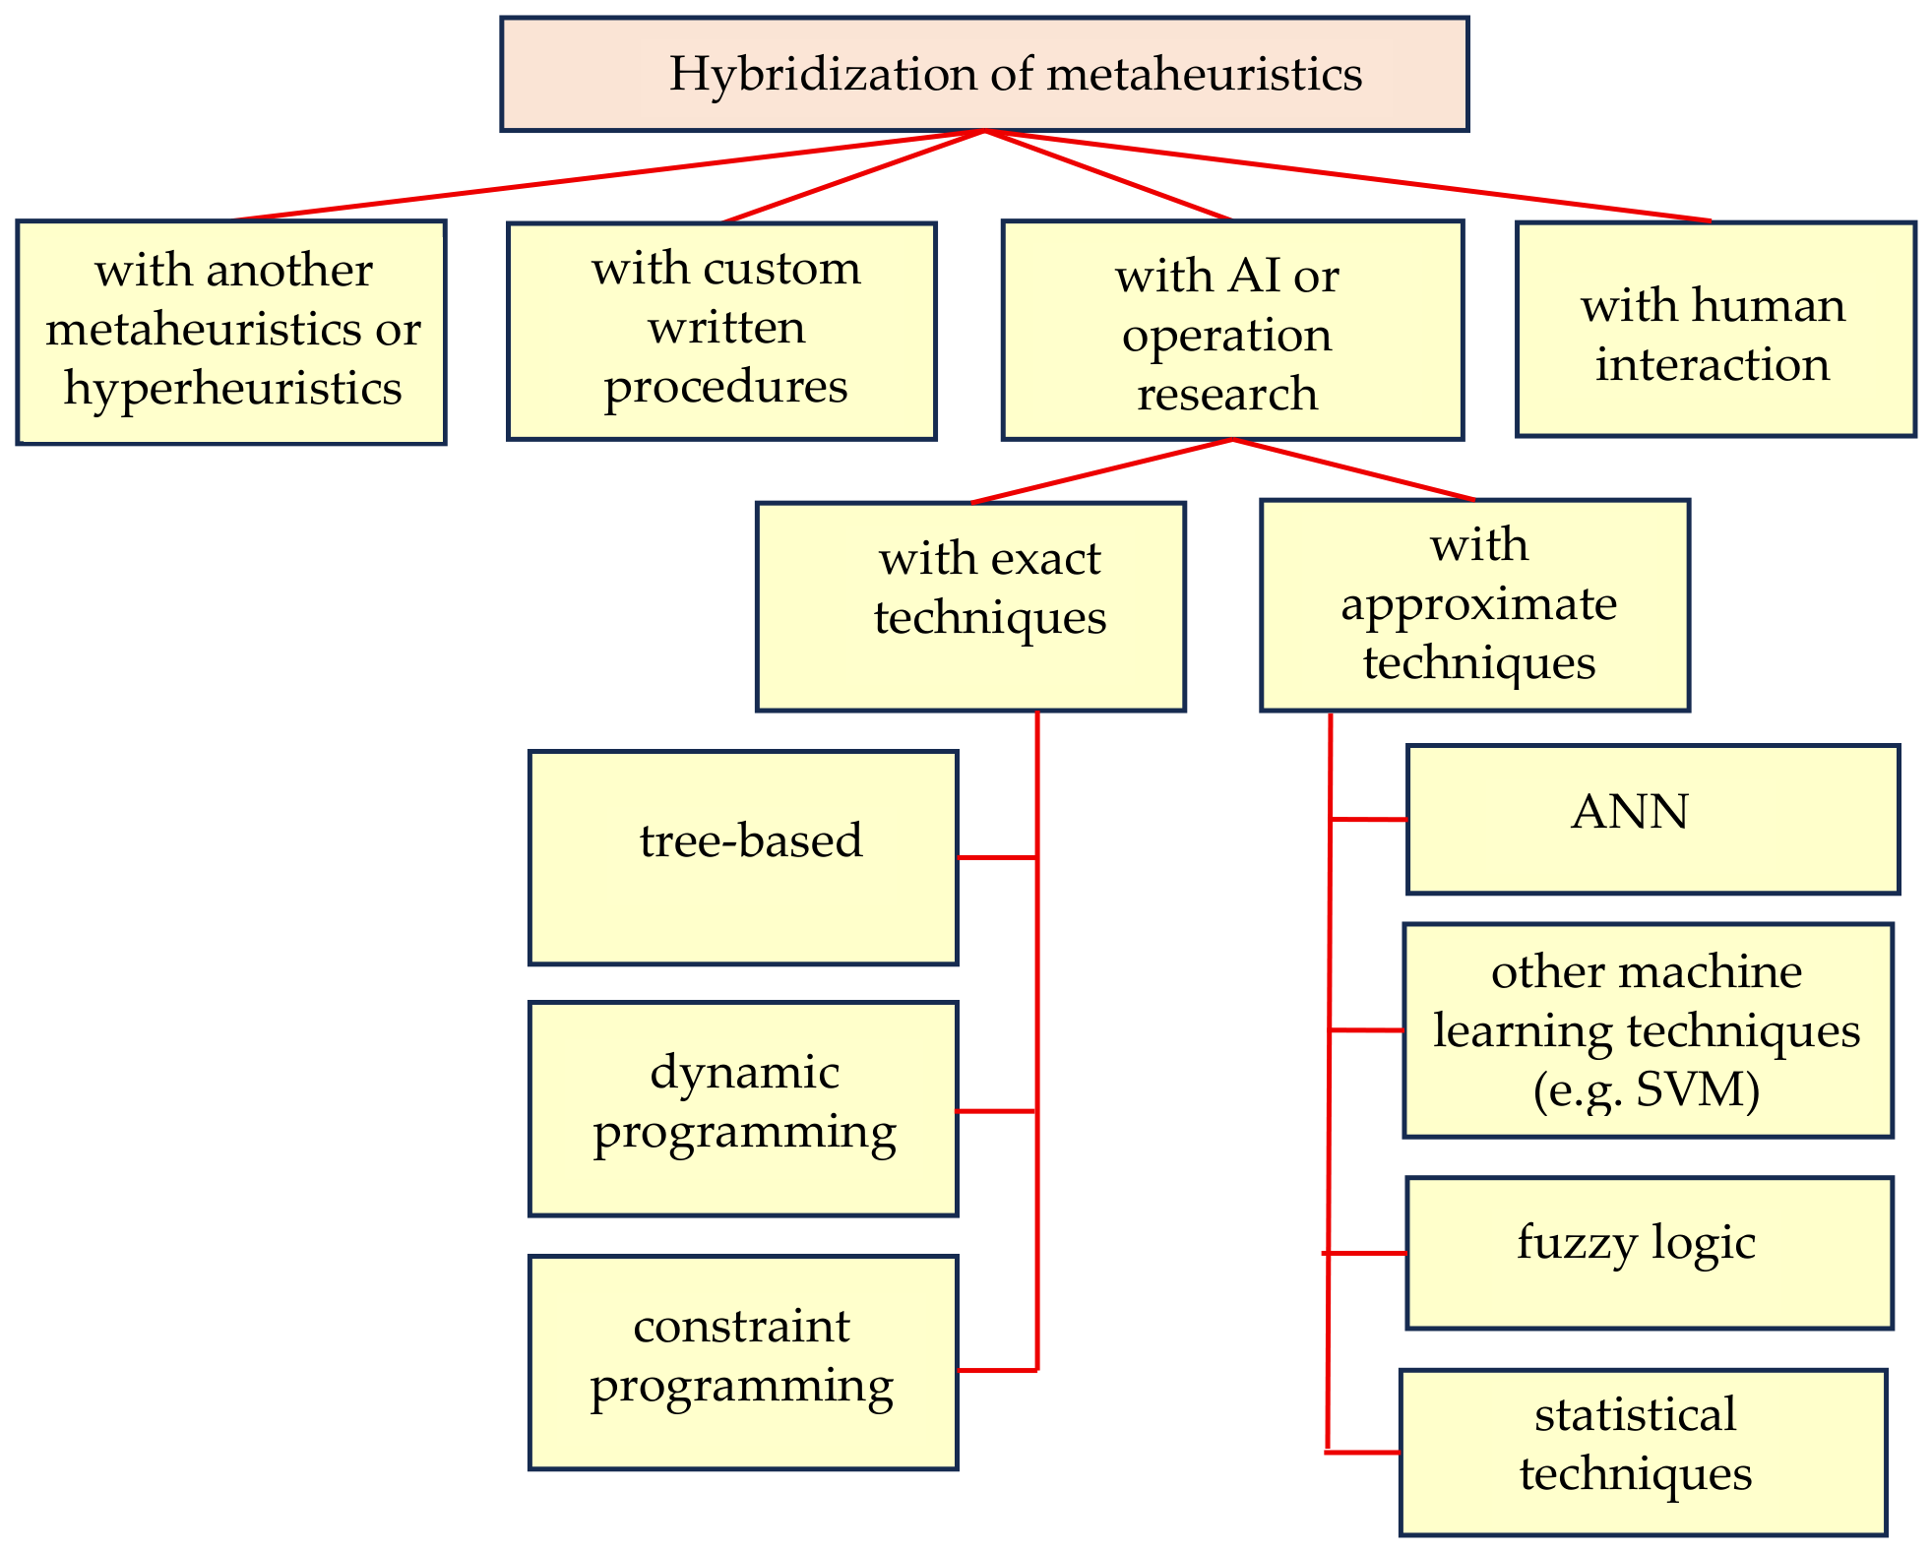
Figure 1 shows the classification of meta-heuristic hybridization methods, modified by [
53] with reference to [
52].
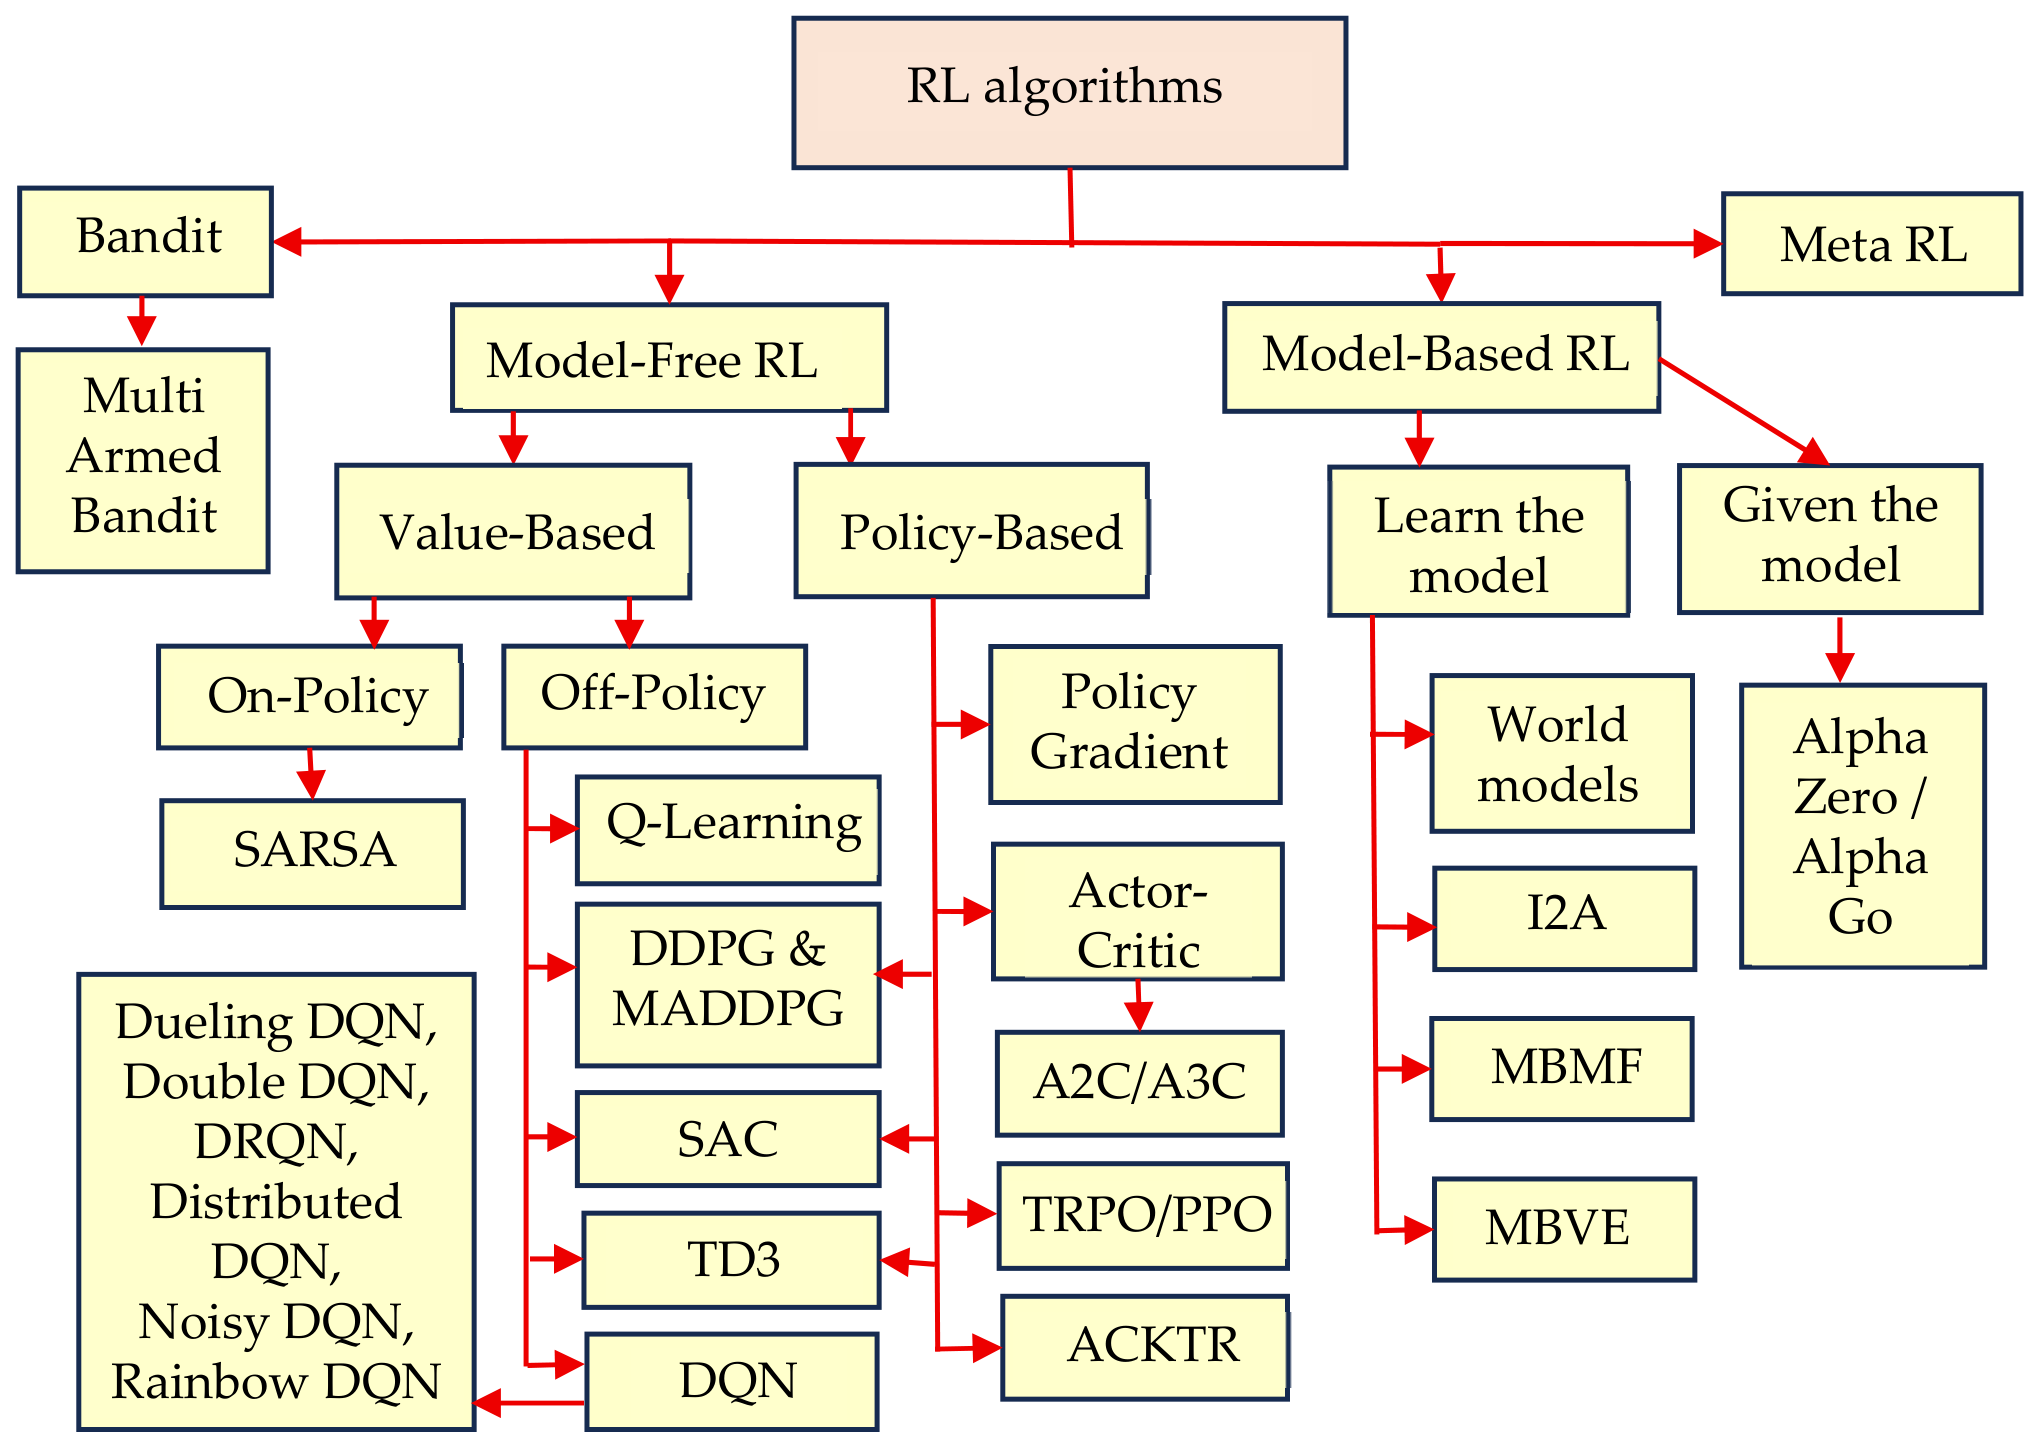
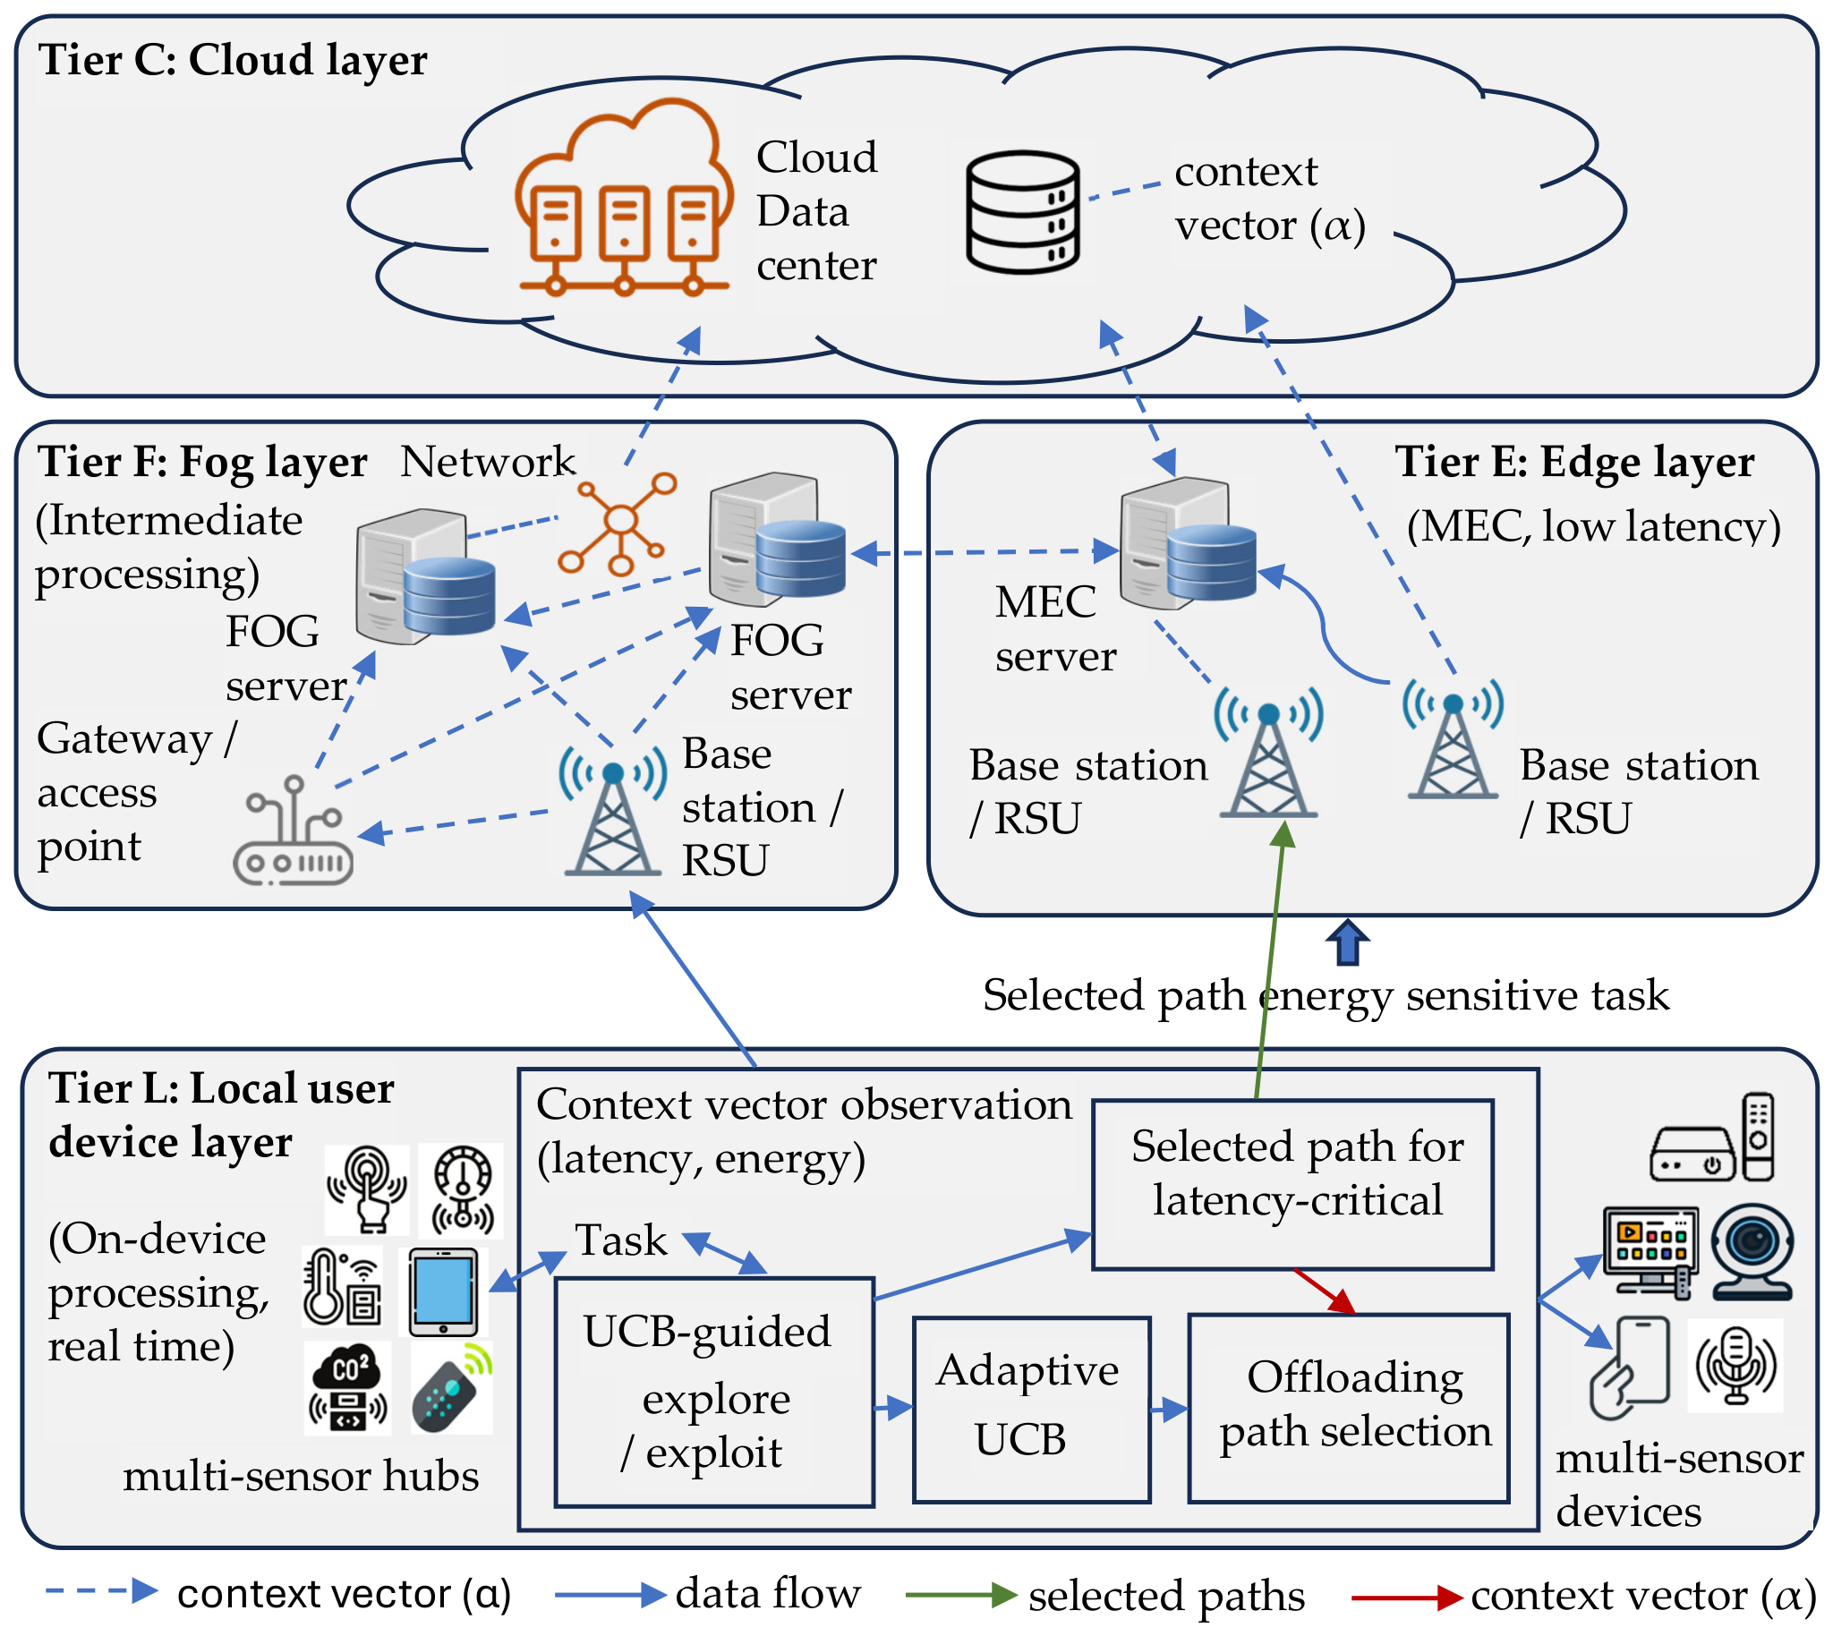
Reinforcement learning (RL) methods are frequently used in meta-heuristic hybridization. A taxonomy of RL algorithms is shown in
Figure 2 [
13]. The Multi-Armed Bandit (MAB) algorithm is also among the most important RL methods used in offloading [
11,
14]. Most RL policies face the challenge of striking a balance between exploration and exploitation. There must be a balance between searching for the problem space for profitable actions and executing the best possible trial action. The MAB problem is one of the earliest examples of the exploration–exploitation trade-off. It aims to strike a trade-off between following the best past solution and discovering potential new opportunities. At each step, a single resource is allocated to an action in an MAB problem, yielding an observable reward. The objective is to maximize the total profit gained across a series of allocations. The agent must learn to select a single optimal branch from a set of candidate branches based on previous rewards [
13].
The results of the literature review also indicate that combining the ‘restart cost’ disadvantage of heuristics (such as ACO) with UCB’s ‘learning from feedback’ capability constitutes a consistent and robust solution.
2.5. Research Gap and Positioning of the Proposed Study
The literature review began by examining systematic review articles from the past five years to provide an up-to-date overview of the current state of the field. This preliminary phase aims to identify the general trends and evolution of task-offloading strategies in heterogeneous environments. Research on energy-efficiency and latency-aware optimization models, providing a comprehensive analysis of studies that reflect the discrete, global, and multi-objective nature of these complex problems. Despite the abundance of existing research, there remains a significant gap in the literature regarding the dynamic management of the exploration and exploitation balance under context-sensitive constraints. To clarify how the proposed study addresses this gap and situates itself within the literature, a comparison table outlining the key differences between the proposed study and current methodologies is provided in
Table 1.
In conclusion, although the existing literature provides robust solutions for task offloading, a critical balance problem remains between the sensitivity of pheromone-based exploitation and the necessity of uncertainty-aware exploration in highly dynamic environments. Most studies either rely on static heuristic weights or fail to adapt to the multi-objective nature of diverse application profiles. The proposed UCB-ACO framework addresses this fundamental gap by integrating the UCB strategy within the ACO framework, ensuring a context-aware and balanced decision-making process.
After establishing the conceptual framework and necessity of this hybrid approach, the next section presents the Problem Formulation, which includes the mathematical network model and multi-objective cost functions that manage the optimization process.
5. Results
This section comprehensively analyzes the performance of the proposed UCB-ACO hybrid algorithm within the context of energy-efficient task offloading in hierarchical networks detailed in
Section 4. The simulation results are analyzed by comparing the proposed approach against modern meta-heuristic algorithms, including PSO, ABO, ACO, GWO, and NSGA-II. The primary objective of these experiments is to validate the effectiveness of the UCB-driven learning mechanism in balancing the multi-objective trade-off between total energy consumption and network delay, as mathematically formulated in the previous sections.
The findings were evaluated to quantify the effects of the hybrid approach on energy consumption and latency. For systematic analysis, the experimental findings are organized into five distinct subsections. Initially, the convergence analysis explores the learning stability and optimization speed of the algorithms. This is followed by the scalability analysis, which assesses performance under varying task and device densities. The third subsection focuses on multi-objective trade-offs through Pareto front distribution to highlight the balance between energy and time. The robustness and stability of the results are then verified using boxplot distributions over 30 independent runs. Finally, the statistical significance of the proposed method’s superiority is established through Wilcoxon rank-sum tests and comparative performance metrics.
The performance of the proposed algorithm was extensively evaluated across a broad spectrum of task-offloading applications, ranging from high-density mission-critical systems such as autonomous vehicles and smart factories to moderate-density service scenarios like smart healthcare and home automation. The primary objective is the simultaneous minimization of total energy consumption and processing latency. To investigate the impact of varying application requirements and user priorities, three distinct evaluation scenarios were implemented: time-weighted, energy-weighted, and a balanced scenario where both objectives hold equal significance. To ensure statistical reliability and accuracy of the results obtained, 30 independent simulation runs were conducted for each scenario. All presented graphical results and performance metrics were generated based on the average values obtained from these 30 independent runs.
5.1. Convergence Characteristics and Learning Stability
In this subsection, the convergence behavior and learning stability of the evaluated algorithms were analyzed to demonstrate their optimization efficiency over successive iterations. The primary focus is to illustrate how the proposed UCB-ACO hybrid mechanism explores the search space and stabilizes its decision-making process compared to standard meta-heuristics. To provide a holistic view of the convergence process, four key metrics are tracked simultaneously: the minimization of the global fitness function, the maximization of the task success rate, and the step-by-step optimization of energy consumption and total network delay.
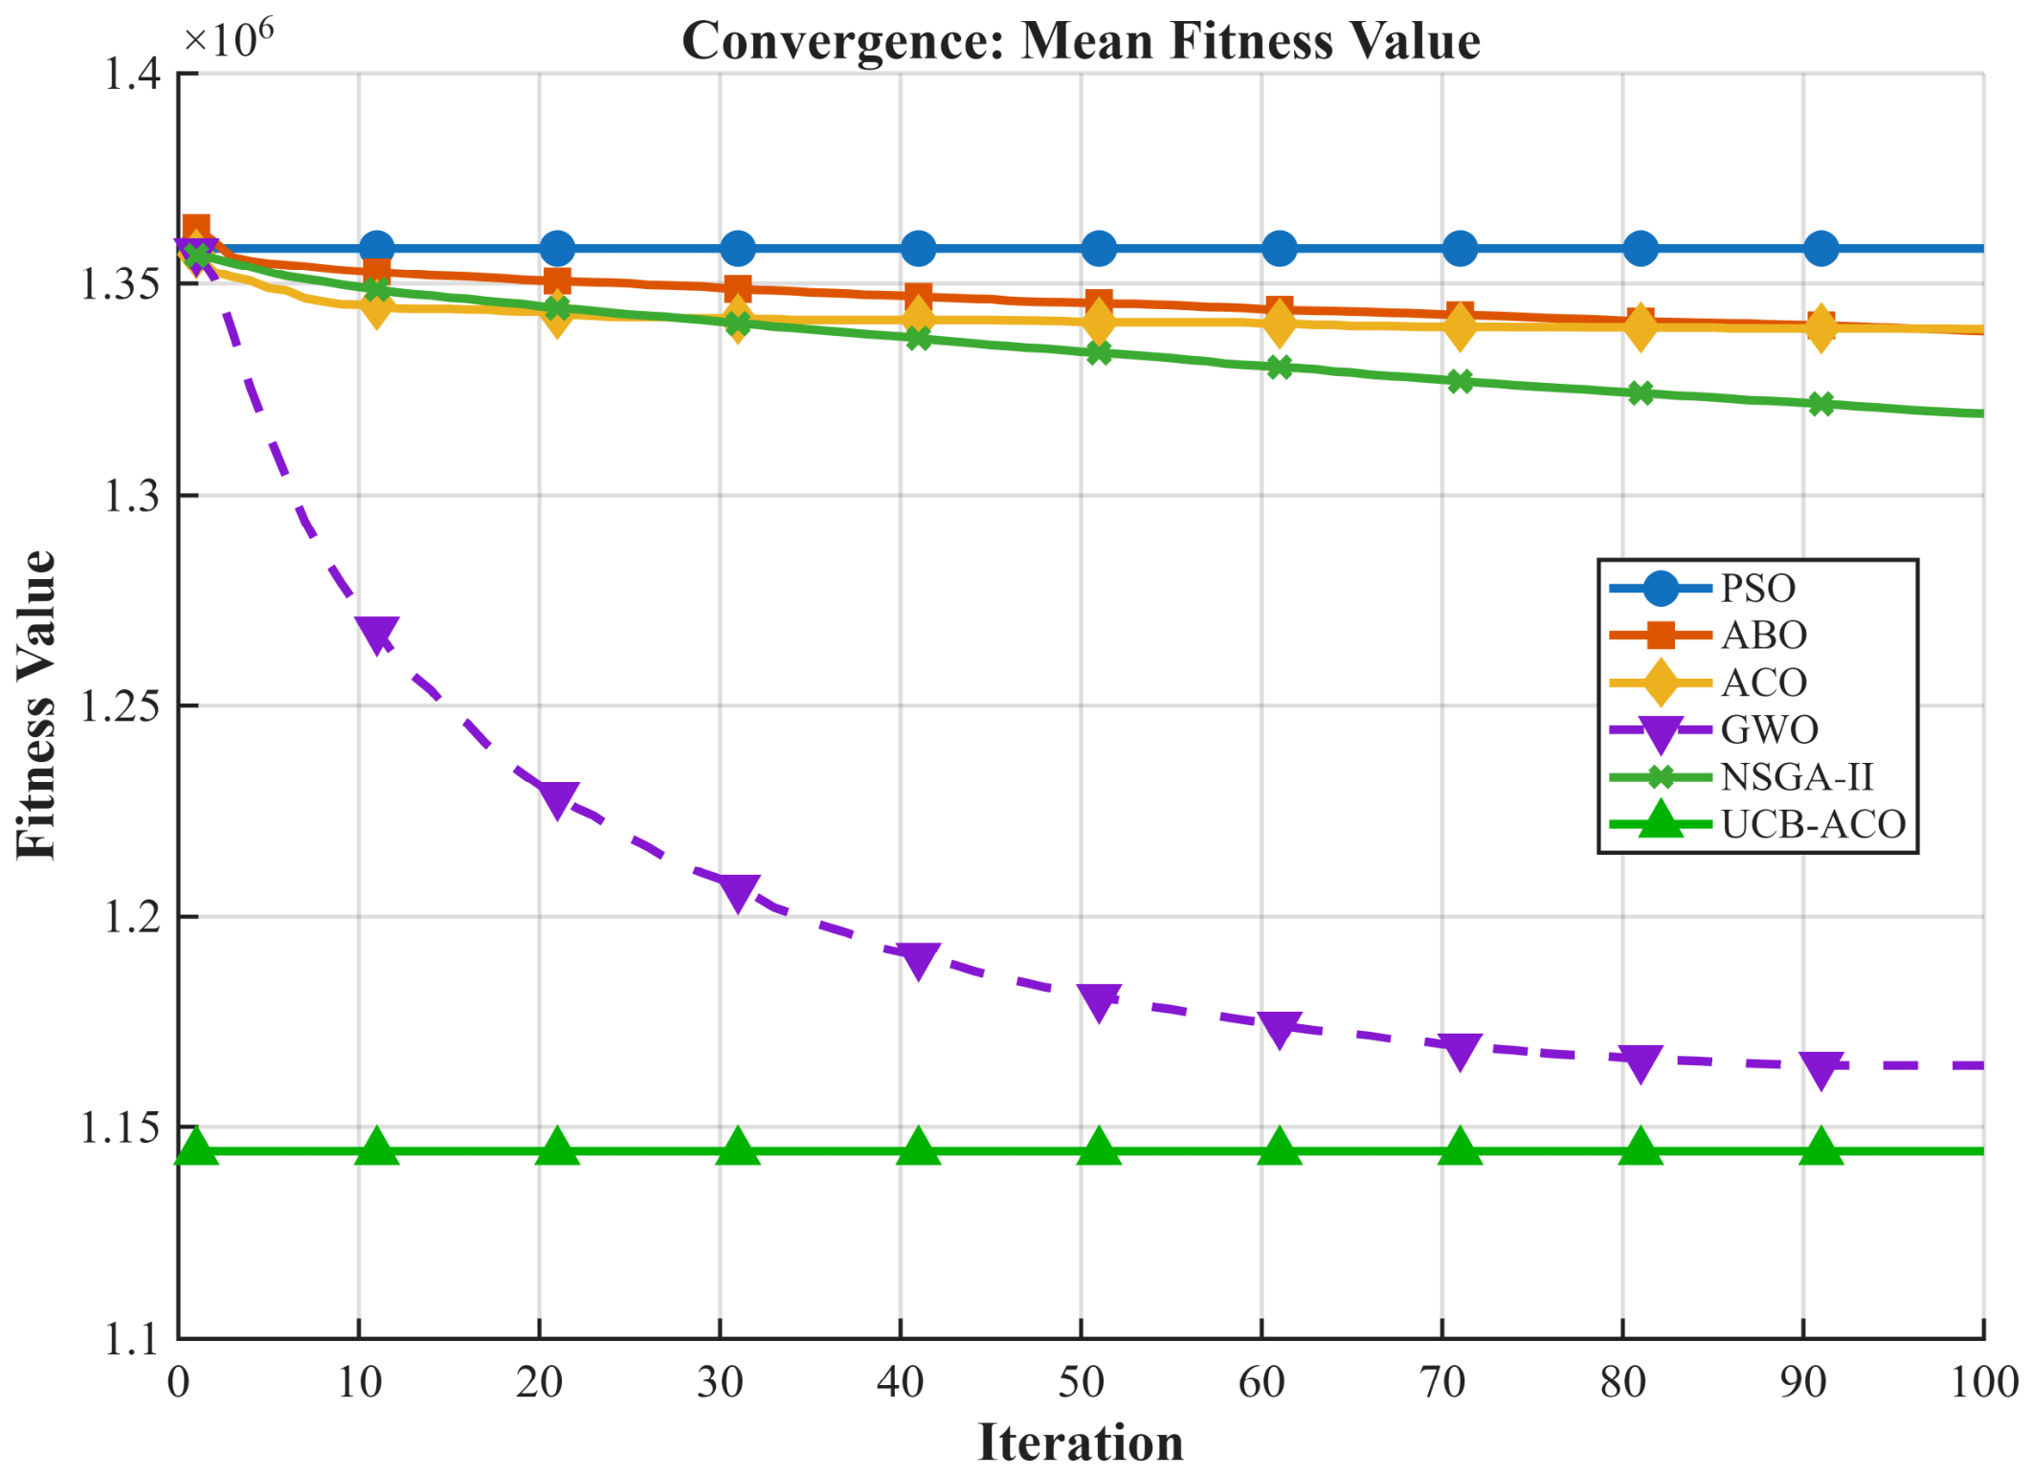
Engineering and network configuration are often a “minimization” problem. In such scenarios, the term “fitness” actually functions as a “cost function”. The problem aims to minimize energy consumption and latency. The goal is to reduce energy consumption and latency to the lowest possible level. As a result, as the graph moves downwards, it means the algorithm has found a “less costly” or “better” solution. “Best Fitness Value vs Iteration” is the most critical data showing how algorithms improve solution quality and convergence speeds over 100 iterations (
Figure 5).
All algorithms in the graph, except PSO, exhibit a decreasing trend as expected. This demonstrates that the algorithms find lower-cost (better fitness) solutions with each iteration. However, there are significant differences between the algorithms in terms of convergence speed and final solution quality. The fact that UCB-ACO has both the lowest (best) fitness value on the graph and “flattens” very quickly is directly related to the learning mechanism in the design of the algorithm. In a standard ACO, ants only follow pheromone trails. However, the UCB term used in the proposed model gives the ants a “memory” and “curiosity”. UCB mathematically rewards previously untried or rarely tried server/task pairings. This allows the algorithm to avoid falling into local optima, a pitfall for algorithms like PSO or ABO, and efficiently scan the search space until it finds the global optimum. Therefore, the solution it finds is of higher quality than others. The “flat” trajectory in the graph indicates that the algorithm found the ideal solution very early and maintained it. Thanks to its reward mechanism, UCB-ACO quickly learns which offloading decision yields the lowest energy and latency. Once the best path is discovered, pheromone updates strengthen that route so much that other weaker options are eliminated. The “flatness” in the graph is actually proof that the algorithm has reached convergence and has stopped random searching, instead exploiting the perfect solution it found.
As illustrated in
Figure 5, this hybrid synergy allows the proposed UCB-ACO model to bypass sub-optimal local traps and converge to the global optimal fitness value much faster than standard ACO, ABO, NSGA-II, PSO, and GWO algorithms. Since the global fitness function is strategically streamlined to prioritize the dual physical domains of latency and energy depletion, the convergence curve reflects a pure, unencumbered path toward multi-objective balance. The learning-guided exploration mechanism of UCB ensures that the pheromone landscape is not dominated by early local minima, driving the objective function score to its absolute lower bound within fewer mathematical iterations.
The instantaneous convergence—characterized by a flat trajectory from the first iteration—is fundamentally driven by UCB-ACO’s intra-iteration learning architecture. Unlike classical heuristics that update global knowledge only at the end of an iteration, UCB-ACO instantaneously updates its learning-guided reward matrices after each individual agent’s tour. Furthermore, by substituting traditional stochastic roulette-wheel selections with a deterministic Upper Confidence Bound maximization rule, the algorithm entirely bypasses the standard exploratory delay. This structural determinism ensures zero-delay operational readiness, which is critical for dynamic Fog network scheduling.
The PSO algorithm, which selects the highest cost in the graph, tracks the best position (pbest) found by the individuals in the swarm so far and the overall best position of the swarm (gbest). The graph showing PSO consistently remaining at a poor fitness value indicates that the algorithm is trapped in a local optimum. The diversity within the swarm has been lost, and all particles have clustered in the same region, unable to find an alternative path because the ability to expand the search space (exploration) was lost prematurely. Although the ABO and ACO algorithms attempt to move towards relatively better fitness values, their convergence speeds are low, they reach saturation early and get stuck at high fitness values. Although the NSGA II algorithm has a higher convergence speed than these two algorithms, it has not been able to find the low-cost options found by GWO.
GWO is the second most successful algorithm after UCB-ACO. GWO exhibits a much steeper descent than all other algorithms (PSO, ABO, ACO, and NSGA II), making it the algorithm that approaches the solution the fastest. This success of GWO proves that the search strategy built around the Alpha, Beta and Delta wolves is much more aggressive and effective at narrowing the solution space than the standard ACO or PSO.
The graph also shows how the UCB mechanism improves the system. Compared to the standard ACO algorithm, it enables 16% less costly selections, meaning better selections are made.
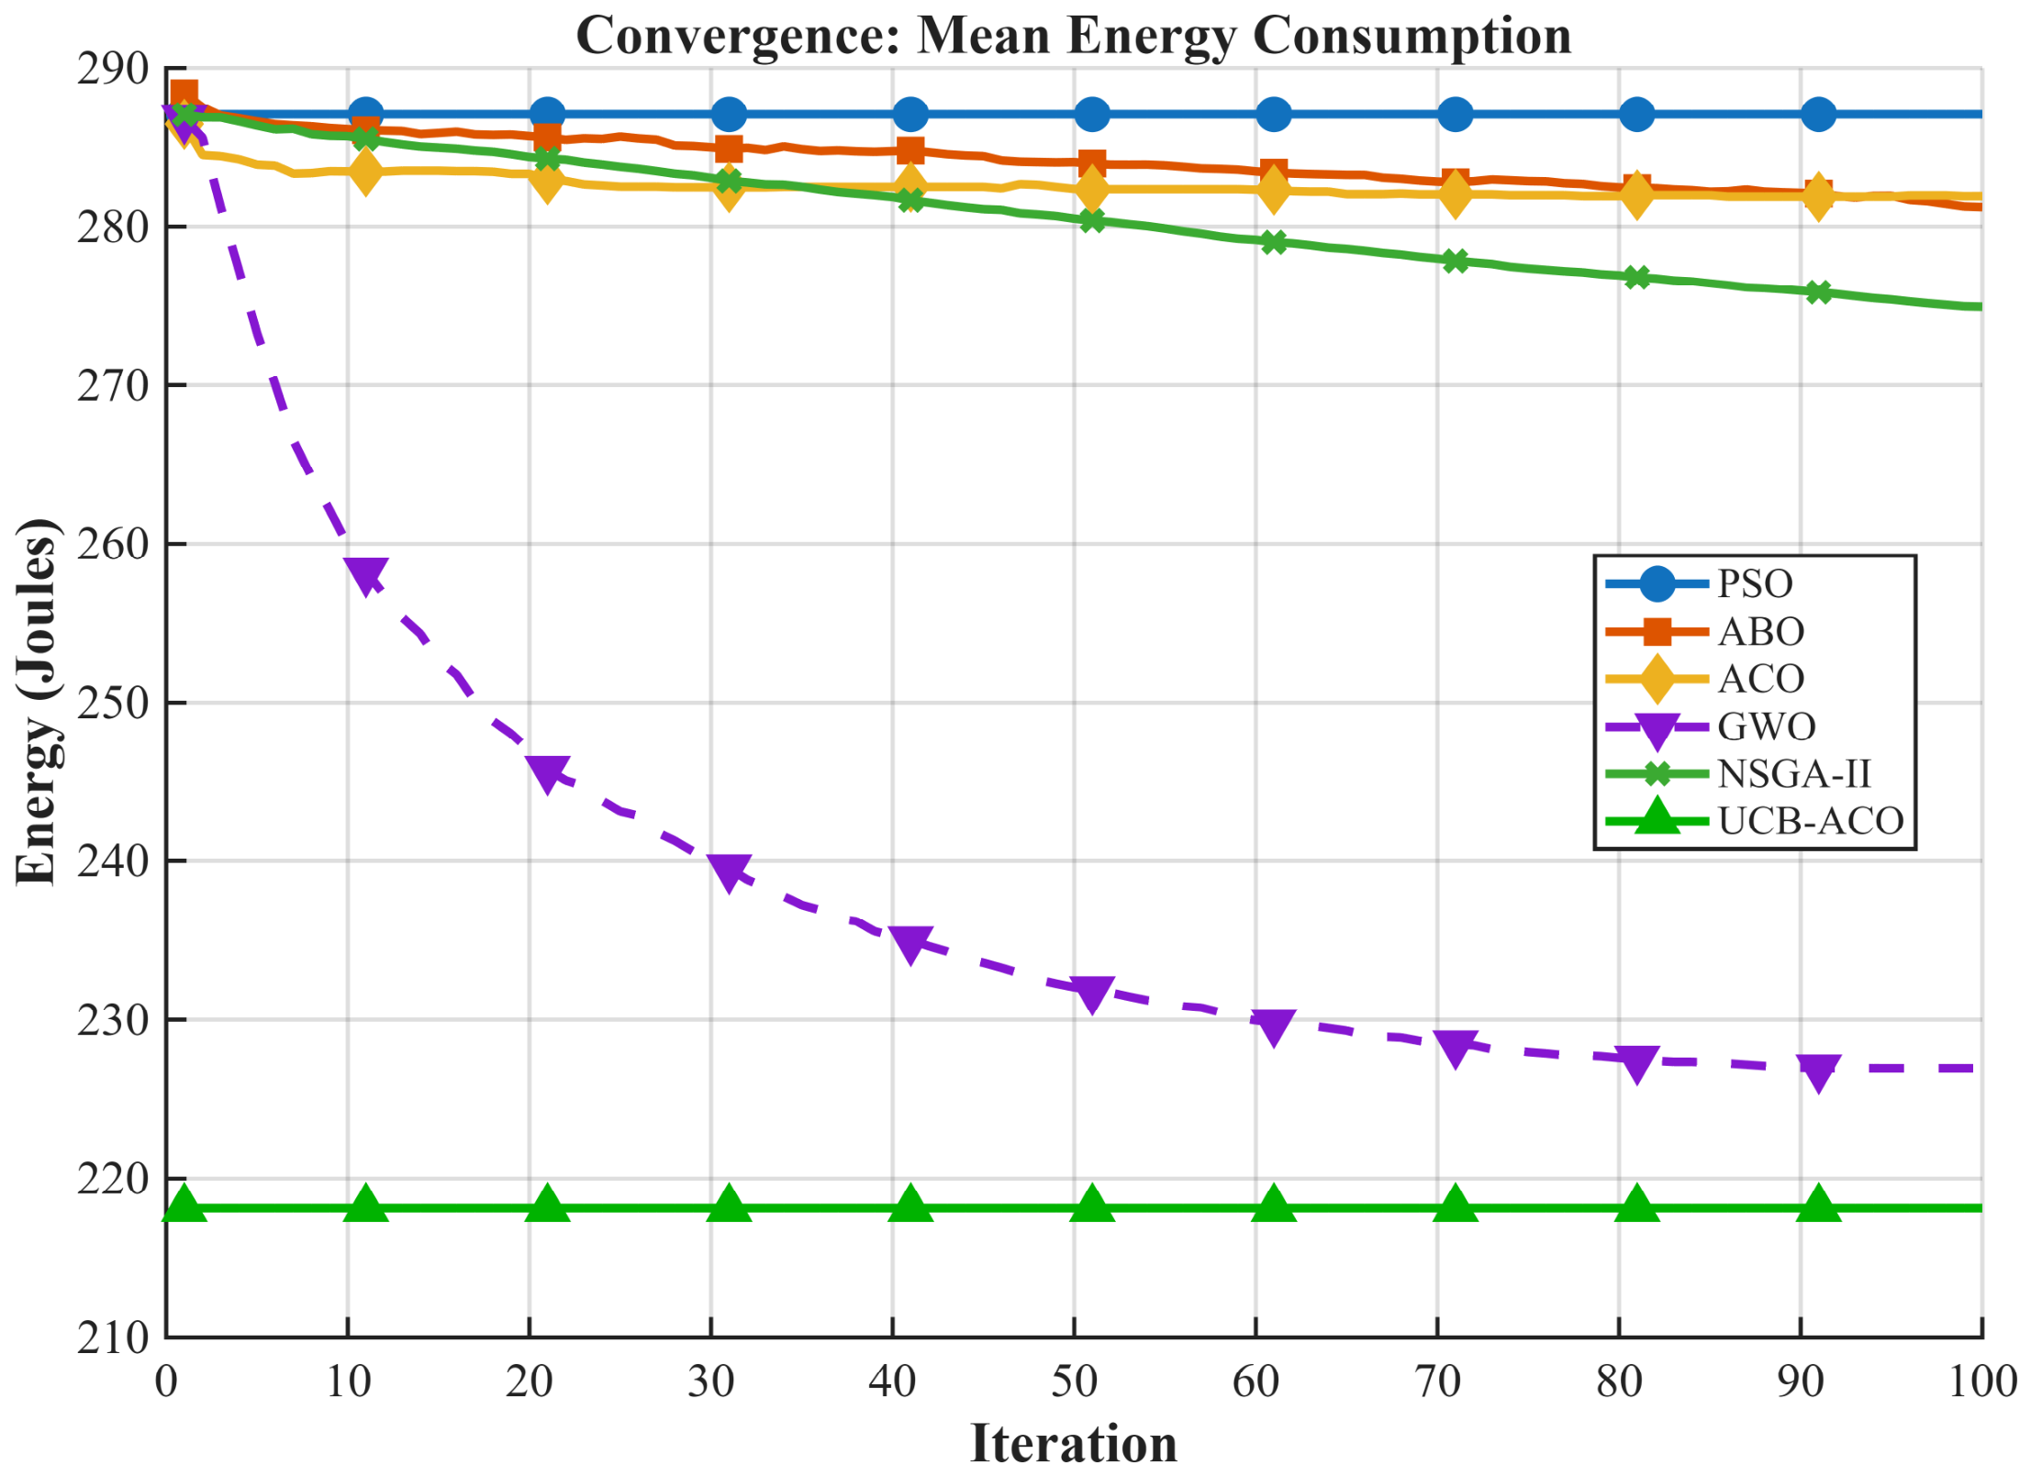
In the iteration vs. mean energy consumption graph, GWO is the algorithm that achieves the lowest energy consumption level after UCB-ACO (
Figure 6). GWO’s success stems from its “encircling prey” mechanism. By continuously tracking the top three solutions (Alpha, Beta, Delta), GWO focuses the solution space on a very narrow area. It has determined which tasks need to be assigned to which low-power servers to minimize energy consumption faster and more accurately than its competitors.
At the top of the graph, the algorithm that remains at the highest point of energy consumption and shows almost no improvement is PSO. PSO is a velocity-based algorithm. In the scenario, with its complex combination of 50 tasks and six servers, PSO failed to properly adjust the particle velocity and got stuck at an unwanted point where the energy was highest (presumably because all tasks were randomly or incorrectly distributed to the wrong servers). It remained unable to make “fine-tuning” adjustments that would reduce energy costs. Because NSGA-II is a genetically based approach, it offers greater diversity than PSO; this has allowed it to achieve slightly better energy levels than PSO.
UCB-ACO has provided a much more stable performance and greater energy decline compared to standard ACO. Exploration and Memory: standard ACOs “blindly” dive into paths (servers) where pheromone levels are high. If a server initially manages its energy a little well, the ACO will stick there. However, UCB tells the ants that they have tried this server a lot and should also look at another server that they have tried less but that has potential. Thanks to this “smart curiosity,” the system has discovered server–task combinations that are far more energy-efficient and have reached a global optimum that standard ACO could not detect. Thus, 23% less energy is consumed compared to the standard ACO algorithm.
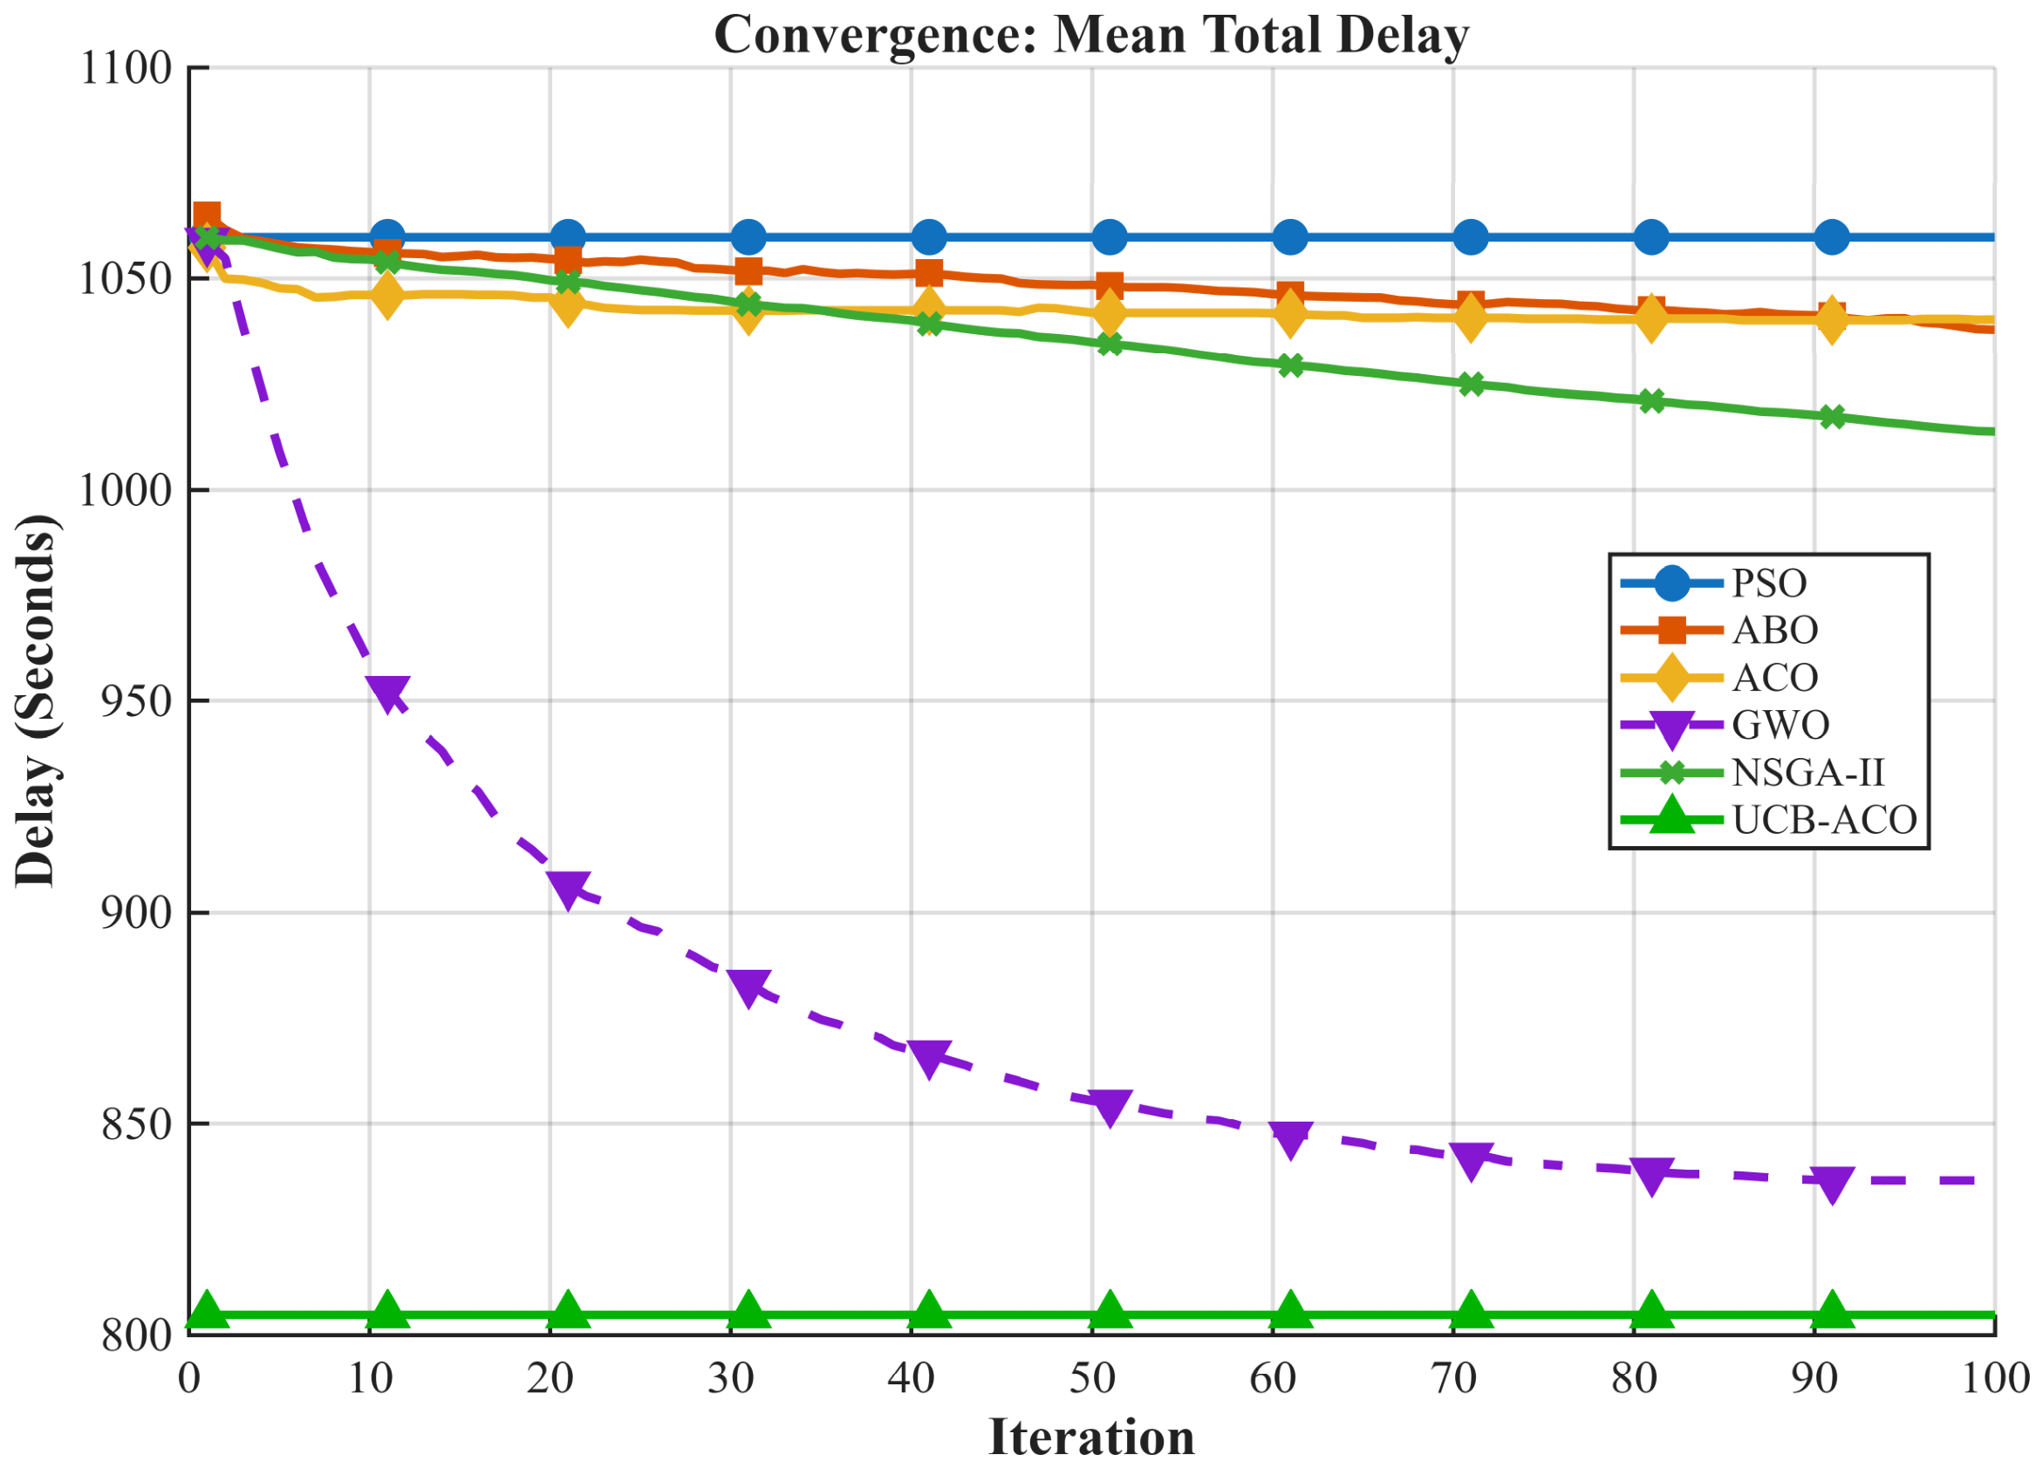
“Average Delay vs Iteration” is one of the most critical metrics representing the real-time performance of a system (
Figure 7). GWO’s hierarchical structure (Alpha, Beta, and Delta leadership) is highly agile in finding server–task matches that minimize latency. While other algorithms focus on a single leader, GWO’s ability to blend information from three different leaders makes it easier to find the fastest path (the server with the lowest latency), especially in a complex scheduling problem with 50 tasks. A steady and smooth decline across the iteration indicates the resistance of the algorithm to local optima. For this reason, it is the algorithm that finds the fastest servers after the UCB-ACO algorithm.
The biggest weakness of the PSO is the problem of “early or premature convergence”. The particles quickly focus on an “acceptable solution” (suboptimal solution) they initially find (such as a high-latency server assignment), and the rest of the swarm collapses to that point. The fact that the line remains almost completely horizontal after the 10th iteration in the graph proves that the particles’ velocities have become zero and they no longer have the capacity to search for a faster (low-latency) solution. Similarly, ABO and ACO also get stuck on local optima and make high-latency server assignments.
UCB-ACO clearly has the lowest latency level. With the improvement made by UCB, UCB-ACO achieves a lower latency offset in each iteration compared to standard ACO. This shows that the system not only successfully completes tasks but also directs them to the fastest channels. Behind this is the exploration–exploitation balance. standard ACO overly relies on paths (servers) with high pheromone levels, which causes queuing delay on the server. Thanks to the smart exploration of the UCB mechanism, UCB-ACO distributes the load among servers in the most balanced and fastest way instead of piling all tasks onto a single “good” server and causing traffic congestion. As a result, task assignment to servers is 22.5% faster compared to the standard ACO algorithm.
As illustrated in
Figure 6 and
Figure 7, the convergence profiles of the evaluated algorithms reveal distinct behavioral patterns. Traditional meta-heuristic approaches, most notably GWO and PSO, initialize their search spaces randomly, which inherently results in high energy consumption and processing delays during the early phases of the simulation. These algorithms require numerous iterations to gradually explore the environment, learn the optimization landscape, and descend toward better solutions.
Conversely, the proposed UCB-ACO algorithm exhibits a remarkably flat convergence curve, maintaining its minimum energy baseline (~220 Joules) and optimal delay profile (~810 s) from the very first iteration. This near-instantaneous convergence capability is a direct consequence of the architectural advantage introduced by UCB mechanism. Instead of initiating a blind search, the UCB framework systematically exploits deterministic system knowledge—such as channel state information (CSI), server computing capacities, and task characteristics—to precisely guide the initial pheromone distribution of the ant colony. Consequently, UCB-ACO completely bypasses the prolonged and computationally expensive exploration phases that standard meta-heuristics depend on, immediately anchoring the search space within a near-optimal region. The downward trajectories observed in alternative algorithms like GWO merely demonstrate their progressive learning effort to eventually approach the optimized baseline that UCB-ACO establishes right at initialization.
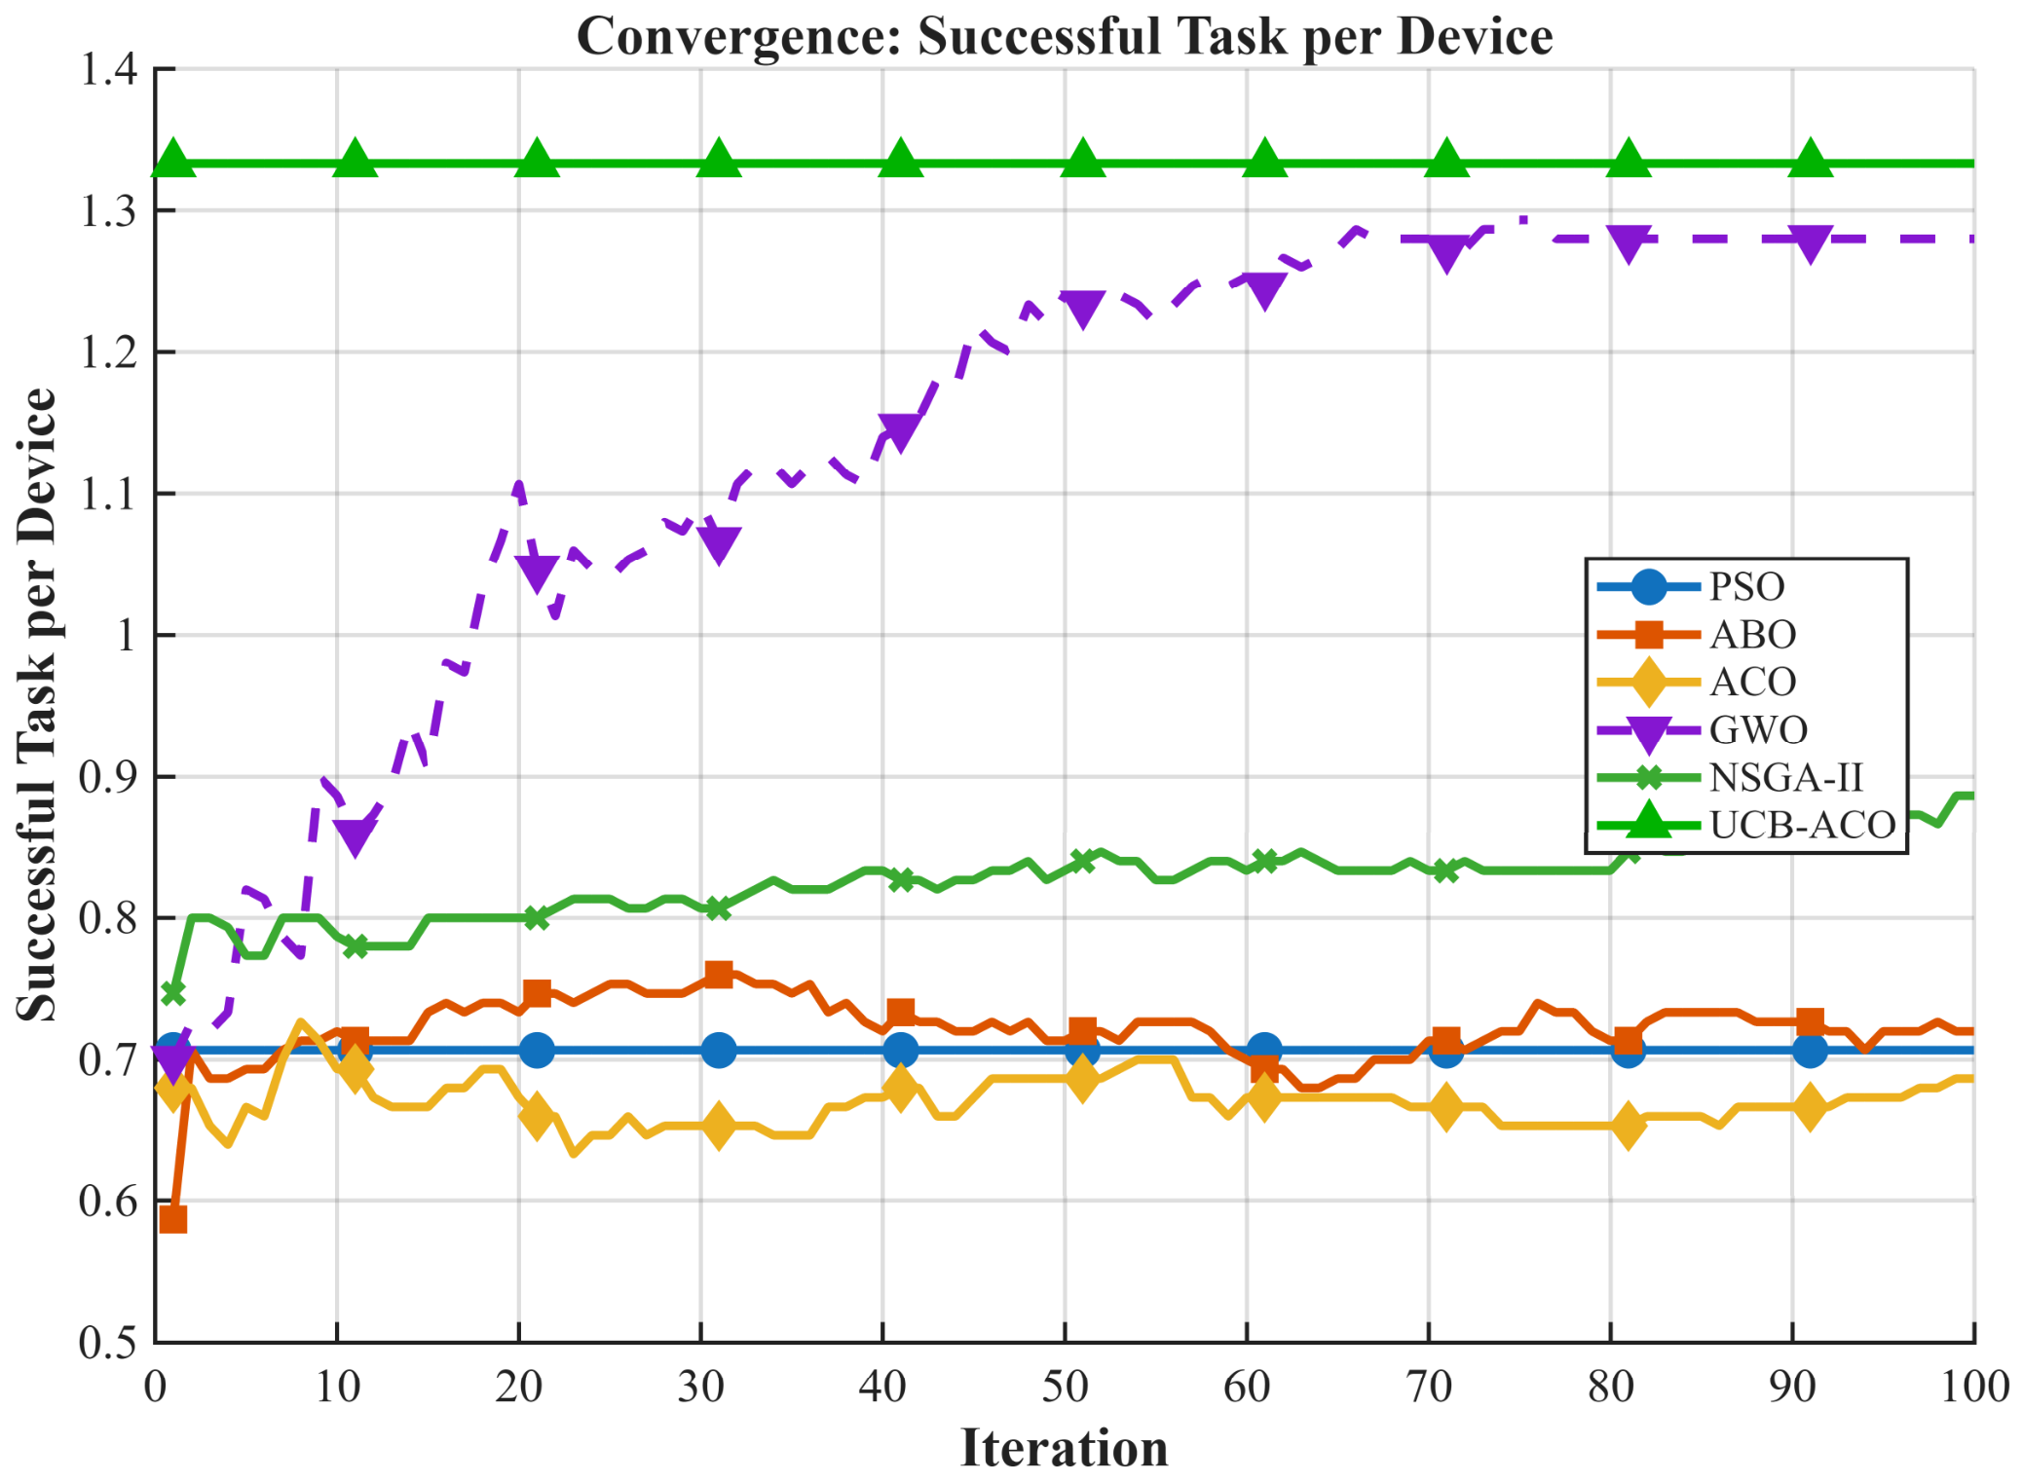
The “Successful Tasks per Device vs. Iteration” graph is one of the most critical performance indicators showing how well algorithms complete tasks on the network while adhering to time constraints and server capacities (
Figure 8). This graph is the most concrete indicator of the proposed algorithm’s adherence to real-world constraints, especially deadline values between 100 ms and 500 ms.
In this scenario, “success” refers strictly to whether tasks bypass the inelastic constraint violation penalty () by being completed on time. The fluctuations in the graph represent the system’s “stability search” as algorithms try new possibilities in each iteration. Because the deadline values for tasks were chosen within a narrow range (100–500 ms), even a few milliseconds of delay in a single task can trigger the penalty and lower the success count by one integer. This sensitivity initially causes sawtooth-like fluctuations. However, since the data is averaged over 30 trials, the amplitude of these fluctuations decreases, and the system becomes stable.
The main reason ABO ranks last in this metric is the lack of “Search Flexibility.” The task-offloading problem features a highly non-convex success surface with many local minima and fluctuations. In ABO, agents “swarm” toward the same server, overloading the server’s capacity. In scenarios with strict deadline constraints, this bottleneck causes most tasks to fail. Once the swarm focuses on a penalized direction, they lack a deterministic exploration mechanism to exit that area and explore new, underutilized servers. Consequently, ABO’s success values remain persistently low and inefficient. In the success evaluation, the closest competitor to UCB-ACO is the GWO algorithm. The structural advantages of the UCB mechanism are most clearly seen here. Rather than functioning as a strict Multi-Armed Bandit regret minimizer, the learning-guided aspect of the proposed hybrid algorithm acts as a powerful exploration heuristic that directly reinforces the pheromone-based search. Untried routes with low pheromone levels are systematically evaluated through the UCB confidence bounds. This learning process quickly determines which server is more reliable for specific types of tasks (e.g., tasks with short deadlines) and rapidly eliminates selections that could lead to penalty violations. As a result, UCB-ACO achieves a relative improvement of approximately 110% (a 2.1× increase) compared to standard ACO.
Convergence analysis conducted to test the stability of the proposed hybrid UCB-ACO algorithm shows that it stabilizes quite quickly. While traditional ACO approaches risk getting stuck in local minima in large search spaces, the learning-guided exploration mechanism in the developed model transforms trajectory evaluation into a systematic learning opportunity. Thus, the algorithm efficiently completes the search process by exhibiting stable, deterministic convergence towards the global optimum, even under complex network scenarios.
5.2. Scalability Analysis Under Varying Network Loads
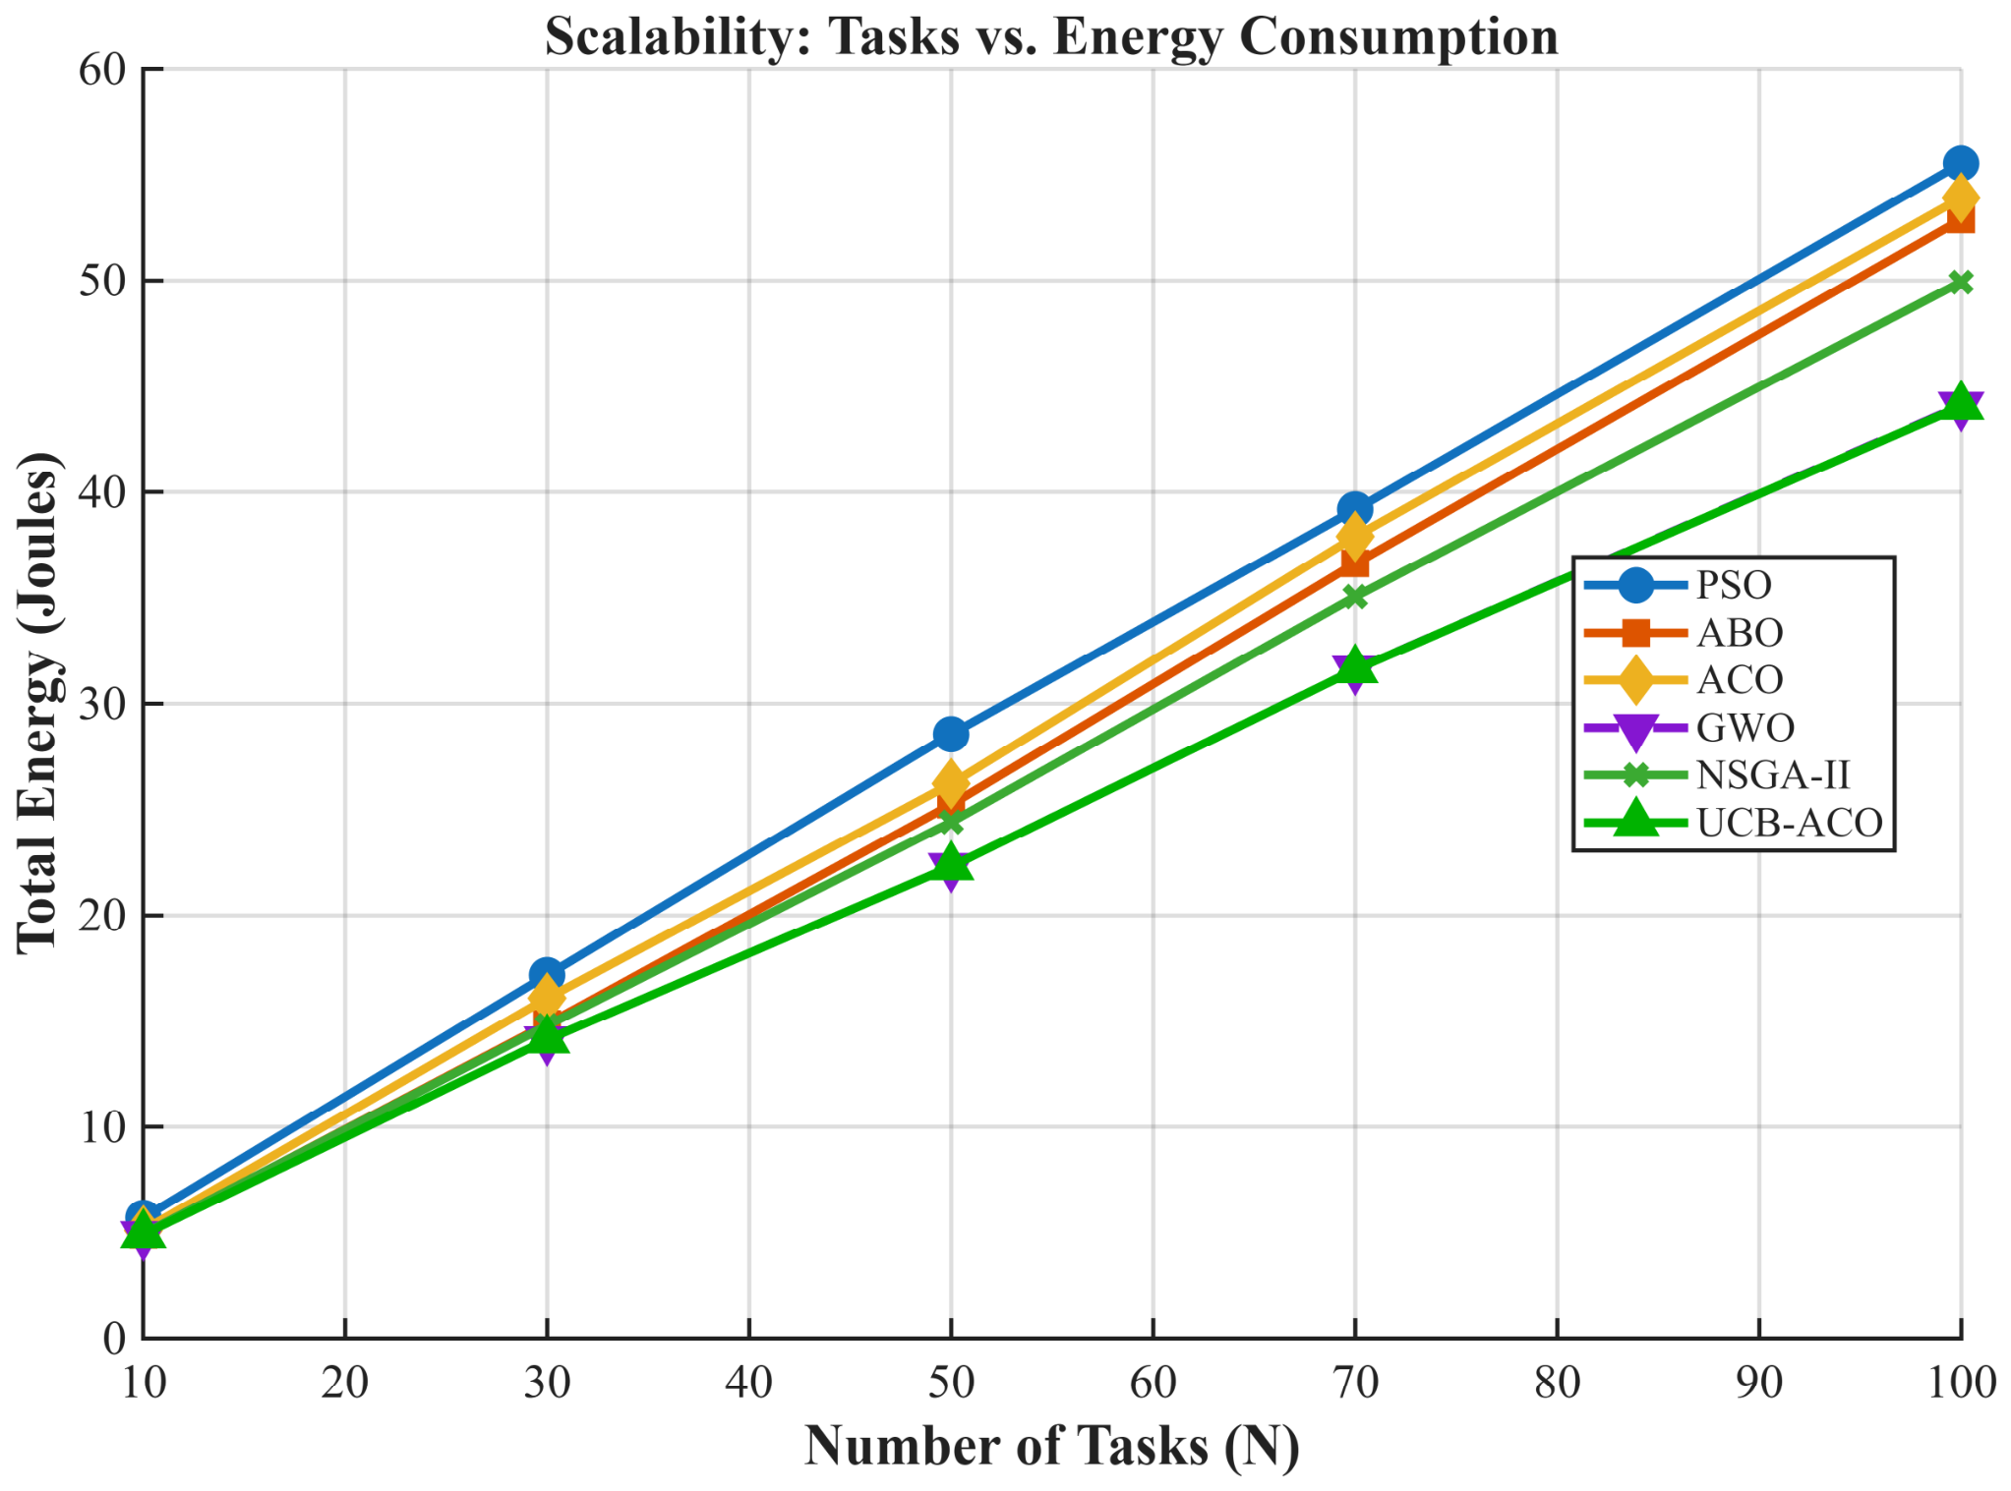
The practical applicability of an offloading algorithm is heavily dependent on its ability to maintain high performance under increasing computational demands and network density. This subsection evaluates the scalability of the proposed UCB-ACO method by systematically increasing the number of tasks within the hierarchical infrastructure. Although many algorithms perform adequately under low load conditions, their efficiency typically decreases significantly as the search space expands and resource competition intensifies. To demonstrate the robustness of the proposed approach, two critical scaling scenarios were examined: the effect of task volume on the global fitness value and variations in energy consumption under high task density.
Figure 9 is crucial in demonstrating that the proposed framework maintains its efficiency not only under low network loads but also as the system scales with an increasing number of tasks. The convergence of two structurally distinct meta-heuristic algorithms (the hierarchy-based GWO and the learning-guided UCB-ACO) at the exact same termination point indicates that the empirical global optimum for this specific problem configuration (e.g., a 100-task load) has been successfully verified. Despite approaching the optimization space from different algorithmic perspectives—one via social hierarchy-driven exploration and the other via learning-guided uncertainty evaluation—both frameworks successfully achieve the lowest energy consumption values, effectively reaching the physical operation bounds of the system.
When the number of tasks increases from 10 to 100, the search space grows exponentially. Algorithms like PSO and standard ACO “lose their way” in this complexity and expend high energy, whereas the fact that both UCB-ACO and GWO remain on the same low-energy trajectory demonstrates that these two algorithms are highly resilient to high-dimensional problems. Energy consumption usually depends on the total processing load and transmission power. Even if there are small differences between these two algorithms in the “Delay” graph, these differences may correspond to the same rounding or the same energy profile in terms of “Total Energy (Joule)”. In other words, although they differ in terms of timing, they may have achieved the same level of optimality in terms of the total “energy budget” consumed.
The algorithm, which is located just above UCB-ACO and GWO and exhibits the second lowest energy consumption, is NSGA-II. As the number of tasks increases from 10 to 100, the search space reaches an enormous size. The genetic-based structure of NSGA-II (crossover and mutation) better preserves “solution diversity” in this vast space compared to PSO or standard ACO. Especially, with the elitism mechanism successful task–server matches that keep energy consumption low are passed on to the next generation, making it more efficient than PSO and ACO for large-scale problems (in the range of 70–100 tasks).
PSO’s velocity-based update rule tends to get out of control as the number of tasks increases (dimensional problem). While it performs comparably with others at 10 tasks, when reaching 100 tasks, its energy consumption rises to around 54 Joules. This situation indicates that in high-dimensional optimization spaces, PSO’s “particles” tend to get stuck at random or inefficient points instead of reaching the global optimum. The gap between standard ACO and UCB-ACO widens dramatically as the number of tasks increases. The UCB term forces ants to try “servers that have not yet been explored or are underutilized.” This action naturally creates load balancing in the system. Since tasks are more homogenously distributed among servers, the total energy consumption increases much more steadily and with a lower gradient compared to standard ACO. While standard ACO consumes approximately 53 Joules at 100 tasks, UCB-ACO reduces this value to around 43 Joules, resulting in a net energy saving of about 19–20%.
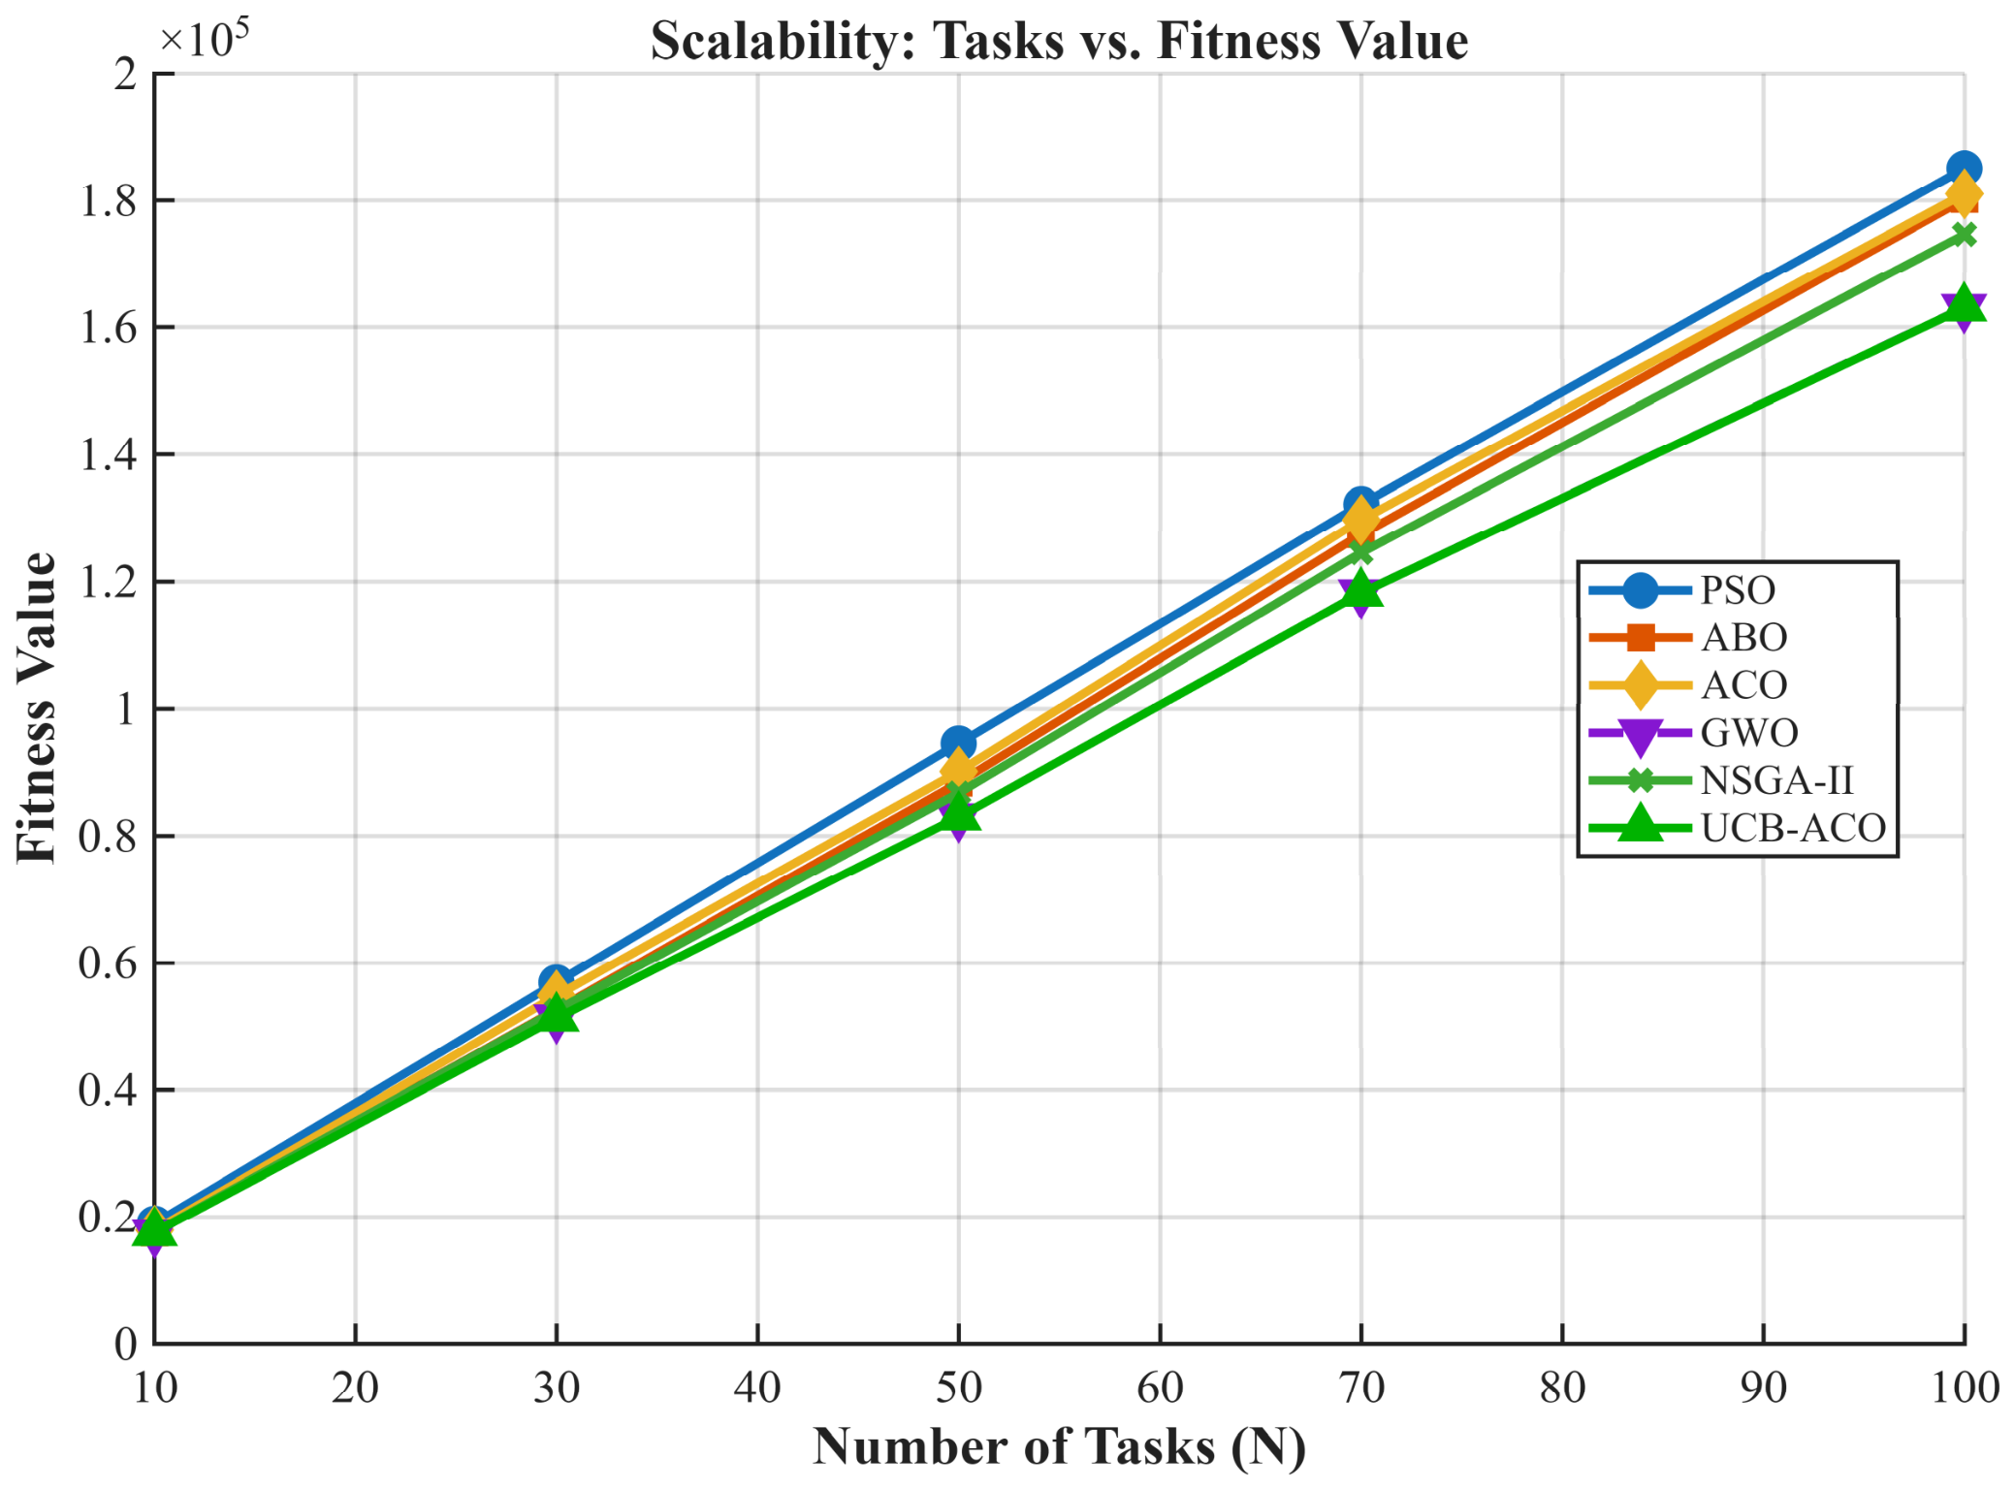
The “Scalability: Tasks vs. Fitness Value” graph summarizes the overall cost (fitness) performance of the system in response to increasing workload. Since the fitness value is a weighted combination of delay and energy, this graph illustrates the algorithm’s level of intelligence when dealing with challenging scales (
Figure 10). The fact that UCB-ACO and GWO have very close values in the graph indicates how parallel and robust the convergence abilities of these two algorithms are in high-dimensional problems.
The algorithm that is located just above the bottom (best) cluster (UCB-ACO and GWO) in the graph and exhibits consistent performance is NSGA-II. As a genetic-based algorithm, it is successful in maintaining “population diversity” and sustains its performance as the number of tasks increases. However, in high-dimensional problems, PSO or standard ACO may prematurely get stuck at a point, failing to achieve the desired minimization in fitness value.
The difference between standard ACO and UCB-ACO becomes clearer as the number of tasks increases. UCB-ACO has achieved an improvement of approximately 11%, which represents a significant increase in system cost as scales up.
The fact that the growth rate of UCB-ACO remains more linear in the graphs is mathematical proof of scalability. The results confirmed that the UCB-based exploration mechanism effectively manages increasing complexity and that the proposed method maintains its superiority even in large-scale and high-density network environments.
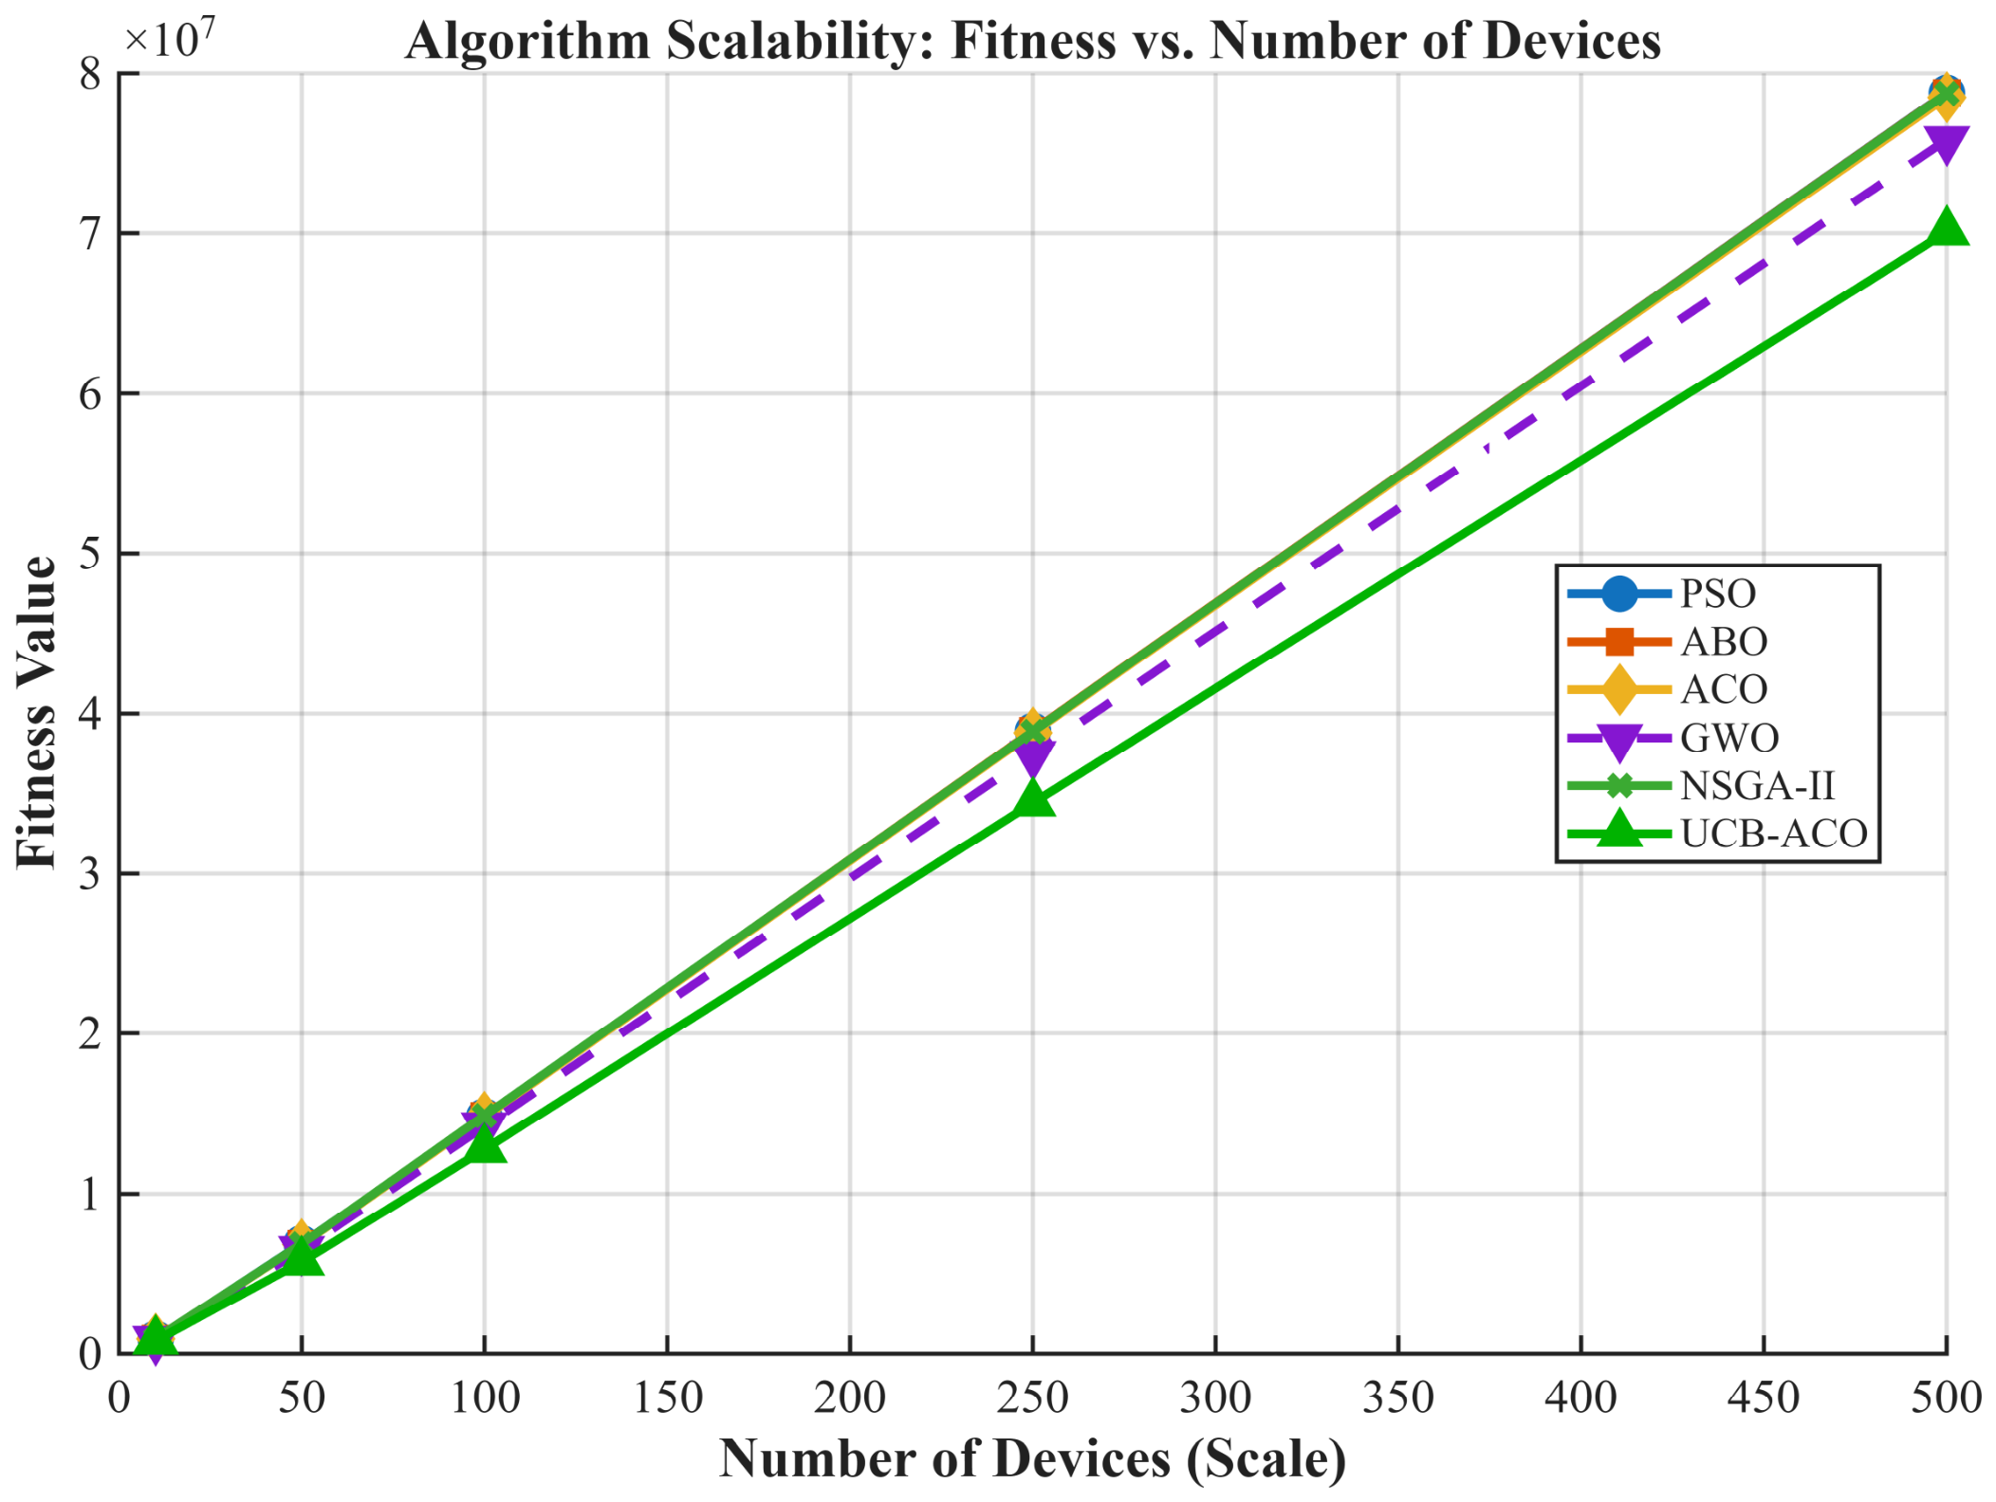
To properly evaluate the scalability of the proposed framework, it is imperative to align the simulation methodology with real-world telecommunication paradigms. In high-density IoT and Fog environments (e.g., Zigbee or local Edge cells), deploying a flat, centralized optimization layout for 1000 devices introduces severe physical constraints, such as catastrophic packet collisions, wireless channel interference, and localized protocol bottlenecks. To circumvent this, industrial IoT infrastructures leverage a decentralized, hierarchically clustered topology, dividing massive networks into localized atomic cells containing 10–20 devices governed by an edge gateway or cluster head. The proposed UCB-ACO framework is specifically designed to execute locally at these distributed gateways. So the baseline 10-device setup serves as the primary atomic building block of the infrastructure, ensuring architectural scalability by design.
However, to rigorously stress-test the algorithmic boundaries of UCB-ACO against competitive meta-heuristics under extreme, worst-case localized density, a massive scale scenario scaling from 10 up to 500 devices (deploying approximately 25,000 tasks) was systematically executed. This scenario significantly exceeds the real-time active scheduling limits of modern Edge/5G infrastructure, thereby serving as an extreme-stress boundary analysis.
Figure 11 illustrates the computational scalability of the algorithms by mapping the objective fitness value against the increasing network density. The results reveal a highly structured performance bifurcation under an extreme scale.
Under light-to-moderate loads (10 to 50 devices), all meta-heuristics exhibit relatively comparable fitness costs, successfully navigating the limited discrete search space. However, as the network density approaches 250 and 500 devices, the optimization complexity explodes exponentially, leading to severe constraint violations.
The proposed UCB-ACO framework strictly dominates the scalability trend, anchoring the lowest trajectory across all density levels. More importantly, the performance gap between UCB-ACO and the benchmark algorithms actively widens at the 500-device mark. By utilizing deterministic upper-bound utility matrix maximizations derived from the Multi-Armed Bandit model, UCB-ACO effectively filters the exponentially expanded discrete search space without falling into exploratory volatility.
GWO maintains an intermediate growth curve, demonstrating partial resilience due to its leadership-driven convergence vectors.
Conversely, a catastrophic performance degradation is observed in PSO, ABO, ACO, and NSGA-II. These algorithms form a tightly clustered upper bound of inefficiency, drifting to the highest fitness penalty quadrants. Under massive scale, traditional pheromone-driven roulette selections and standard evolutionary crossover operations suffer from identical sub-optimal constraint stagnation. This leads to extensive penalty accumulation in high-dimensional scheduling spaces.
Ultimately, these findings mathematically demonstrate that UCB-ACO is uniquely resilient to the scale-induced structural bottlenecks of massive IoT infrastructures.
5.3. Multi-Objective Optimization and Pareto Front Analysis
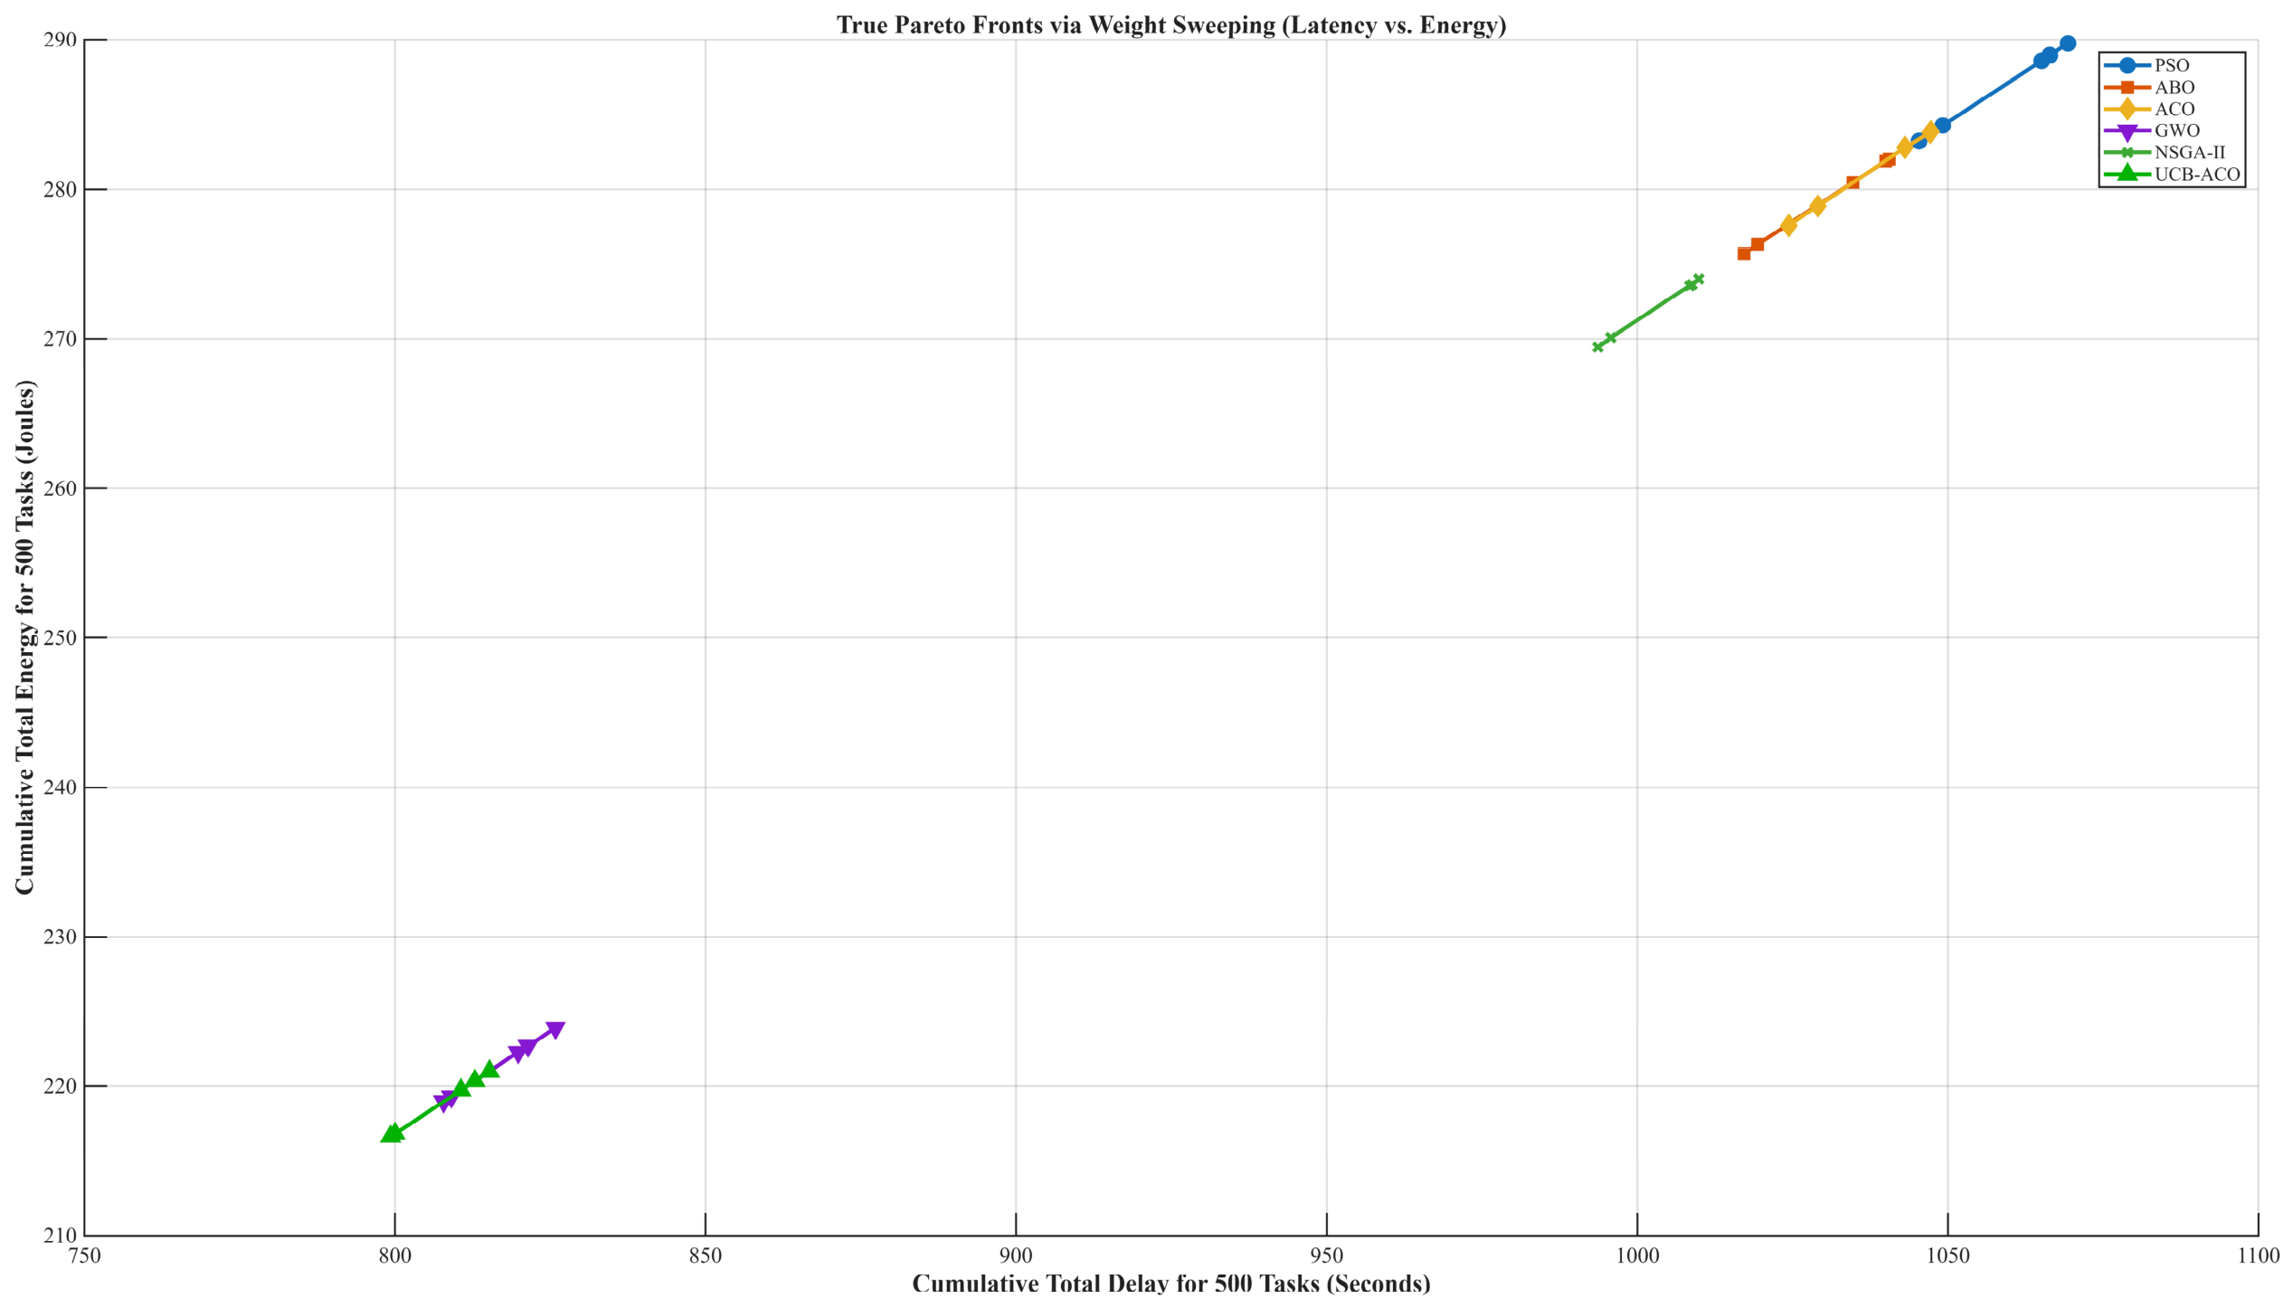
In hierarchical offloading systems, minimizing energy consumption and reducing network latency are often conflicting objectives; an improvement in one typically results in a degradation of the other. This subsection examines the efficiency of the proposed UCB-ACO algorithm in managing this fundamental trade-off through a Pareto front analysis. To construct continuous empirical frontiers rather than relying on sub-optimal single-point estimates, the weighting coefficients for latency () and energy () were systematically swept across a comprehensive spectrum ( where ) over 30 independent execution runs. The definitive multi-objective goal is the simultaneous minimization of both cumulative total delay (X-axis) and cumulative total energy consumption (Y-axis). Because of this the algorithmic trajectory situated closest to the coordinates of the origin (bottom-left quadrant) represents the most mathematically efficient framework.
As explicitly illustrated in
Figure 12, the multi-objective search space experiences a severe structural bifurcation, splitting the evaluated meta-heuristics into two distinct performance clusters. The proposed UCB-ACO framework, alongside GWO, successfully anchors an elite, low-cost cluster in the extreme lower-left region of the design space, demonstrating strict Pareto dominance over all continuous swarm variants and traditional evolutionary mechanisms.
Specifically, the continuous front generated by UCB-ACO tightly bounds the system cost within a highly optimized envelope of 800.2 to 814.1 s for delay and 217.1 to 220.1 Joules for energy. This steady state proves that the integration of the learning-guided upper-bound utility matrix allows the framework to intelligently filter out heavily loaded or high-latency Edge nodes. Even when the optimization priority shifts drastically toward latency () or energy (), UCB-ACO dynamically stabilizes its structural cost, preventing exploratory volatility.
GWO establishes a closely trailing, highly competitive intermediate frontier immediately adjacent to UCB-ACO, bounding its multi-objective trajectory between 808.5 and 826.3 s of delay and 219.2 to 224.1 Joules of energy. This robust behavior stems from GWO’s strict hierarchical Alpha-to-Delta leadership vectors, which facilitate rapid directional convergence in discrete spaces. However, because GWO lacks a step-by-step sequential learning layer to verify sub-task deadline violations dynamically, it cannot breach the absolute lower bound established by the learning-guided mechanism of UCB-ACO.
Conversely, a massive computational bottleneck is observed for the remaining algorithms, which are forced into a deeply sub-optimal upper-right macro-cluster. NSGA-II occupies the lower boundary of this inefficient cluster, spanning 993.1 to 1010.2 s and 269.4 to 274.1 Joules. While NSGA-II utilizes non-dominated sorting to distribute its population, the high-dimensional, highly constrained nature of the 500-task discrete space triggers extensive penalty accumulation, rendering its evolutionary crossover operations less effective.
Trailing further into the inefficient zone, ABO settles within a narrow band of 1018.1 to 1026.3 s and 276.1 to 278.2 Joules, followed closely by the standard ACO front which drifts heavily between 1026.4 to 1050.2 s and 277.2 to 284.1 Joules. The failure of standard ACO highlights the structural vulnerability of purely probabilistic pheromone routing; without a deterministic upper-bound exploration modifier, the ants blindly over-saturate dominant Edge gateways, inducing severe wireless channel collisions and localized processing queues.
Finally, PSO exhibits the most catastrophic multi-objective degradation, drifting to the extreme upper-right boundary (1048.2 to 1070.1 s and 284.1 to 290.0 Joules). Due to its inherent susceptibility to premature convergence in discrete optimization tasks, PSO suffers from severe constraint stagnation, accumulating massive time and energy penalties.
Ultimately, this true Pareto front analysis mathematically validates that the learning-guided UCB-ACO framework successfully establishes the lowest operational bound for massive IoT networks, delivering solutions that are simultaneously faster and more energy-efficient than traditional state-of-the-art heuristics.
The graph shows the mean total delay of approximately 815 s represents the cumulative processing time for all 500 tasks. When this total is distributed at the individual task level, the average delay per task response time of ∼1.63 s—which comprehensively includes the transmission delay to the Cloud/Edge, the computational execution time, and the result downloading time—is highly realistic and well within the acceptable constraints of typical Edge/Cloud-assisted IoT applications (such as smart building monitoring, environmental sensing, or non-mission-critical image processing).
5.4. Statistical Robustness and Distribution Results
In meta-heuristic optimization, relying on a single simulation run can lead to misleading results due to the stochastic (random) nature of these algorithms. This subsection presents the statistical distribution of results from 30 independent simulation runs to establish scientific reliability and prove the consistency of the proposed UCB-ACO method. The stability of the algorithms is visualized through boxplot diagrams that provide a detailed overview of the performance range from best-case to worst-case scenarios. Specifically, the distribution of global fitness values, total energy consumption, and network latency were analyzed. Furthermore, device-based remaining energy boxplots were used to demonstrate load balancing capability and network longevity.
To measure the effectiveness of the proposed UCB-ACO algorithm and other compared meta-heuristic methods under different operational conditions, three basic scenarios were designed. These scenarios are designed based on predominantly the time and energy weighting coefficients representing the fundamental trade-off in the multi-objective optimization problem. These weights, which directly affect the total cost function (fitness function), determine the system’s priorities as follows:
Energy-Weighted Scenario: This scenario is designed for low-power IoT devices and sensor networks where battery life and sustainability are the highest priorities. The system’s primary goal is to minimize total energy consumption by sacrificing from some latency.
Time-Weighted Scenario: It simulates low-latency tolerance situations such as real-time data processing, autonomous systems, or mission-critical applications. Here, the system focuses on the quickest completion of tasks by assigning the energy cost to the second plan.
Balanced Scenario: It reflects general-purpose Mobile Edge Computing (MEC) quality of service (QoS) requirements where both energy efficiency and processing speed are equally important.
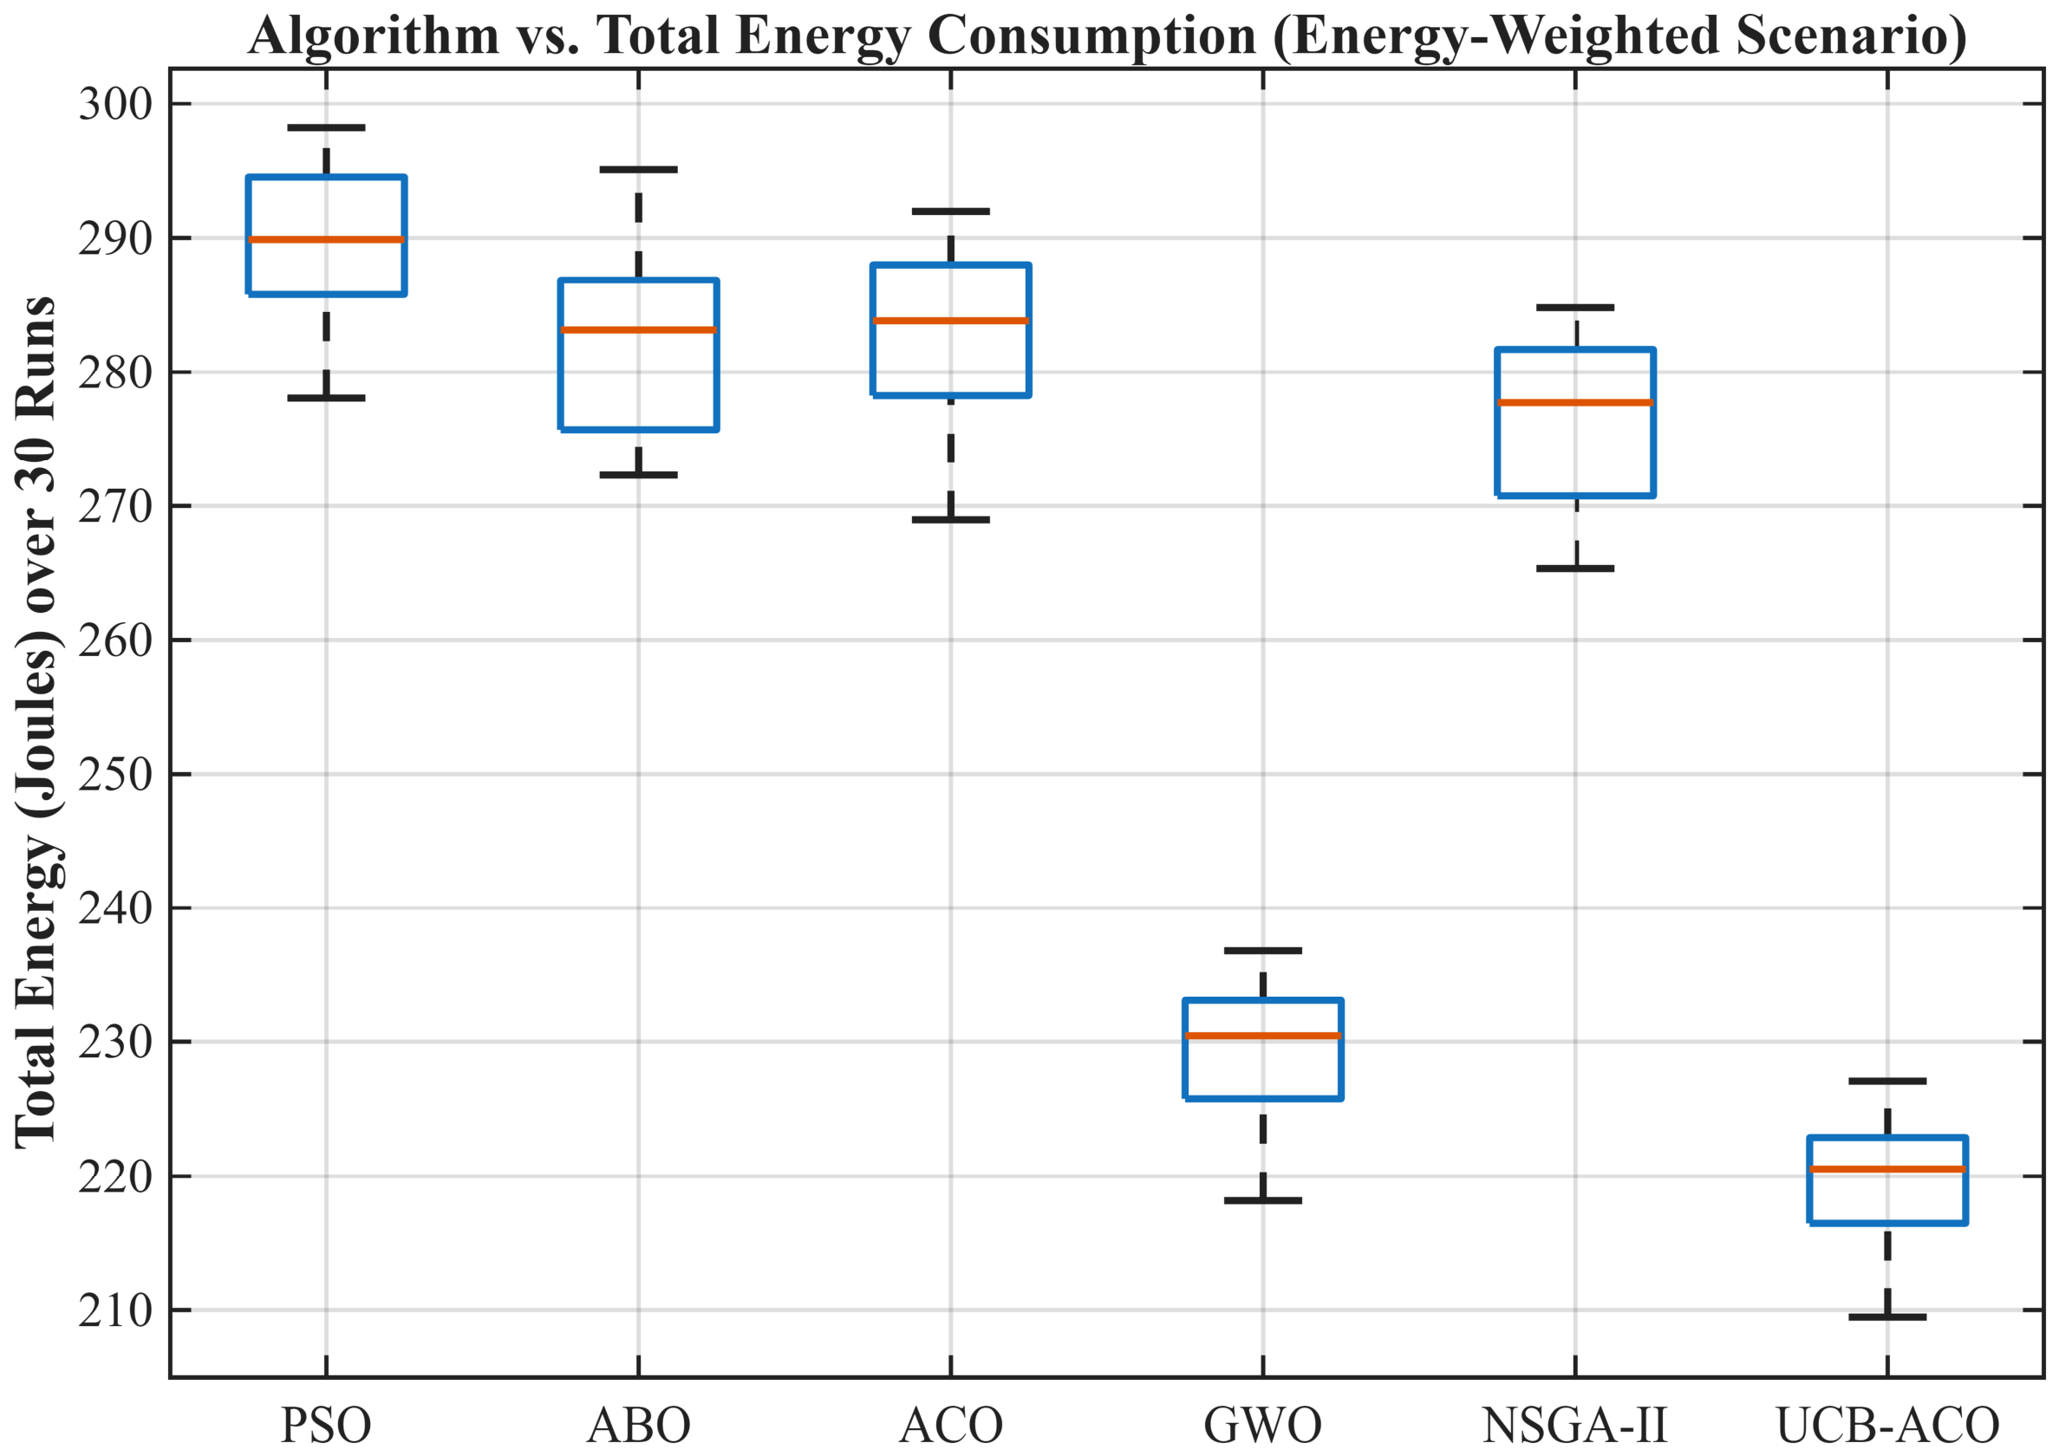
The “Algorithm vs. Total Energy Consumption (Energy-Weighted Scenario)” boxplot clearly reveals not only the average performance of the algorithms but also their robustness and error margins across 30 different trials (
Figure 13). Since this is an energy-weighted scenario, these results are the most critical data regarding the system’s sustainability.
The algorithm with the second lowest energy consumption level after UCB-ACO in the graph is GWO. The median (midline) value of GWO is approximately . GWO is quite capable of finding server–task matches that minimize energy consumption thanks to its hierarchical leadership structure. Since the box size (interquartile range—IQR) is relatively narrow, it provides consistent results across trials. However, because it lacked the “smart exploration” bonus offered by UCB-ACO, it was unable to bring the energy output below the band.
The algorithm with the highest energy consumption, positioned at the top of the graph, is again PSO. PSO’s energy consumption ranges widely between and , with a median around . PSO rapidly loses “solution diversity” in high-dimensional optimization problems. In this energy-weighted scenario, particles likely locked early onto high-power-consuming but “functional” servers and failed to discover more efficient configurations. Additionally, the large box width of PSO indicates that it produces very different results in different trials, meaning its reliability is low.
The graph clearly visualizes the gap between standard ACO ( median) and UCB-ACO ( median). The UCB term directs ants to “less tried” servers. This ensures that tasks are evenly distributed across all servers. Thus, the UCB mechanism has provided approximately a 22% savings in energy consumption.
Another detail to note in boxplot is box heights. PSO and NSGA-II algorithms both consume high amounts of energy and have longer box lengths (and whiskers). This proves that the results vary greatly from trial to trial, indicating unstable performance. The boxes of the UCB-ACO and GWO algorithms are quite thin. This indicates that results are very close to each other in almost all 30 trials. In this case, the algorithms find the best solution not by “chance,” but consistently.
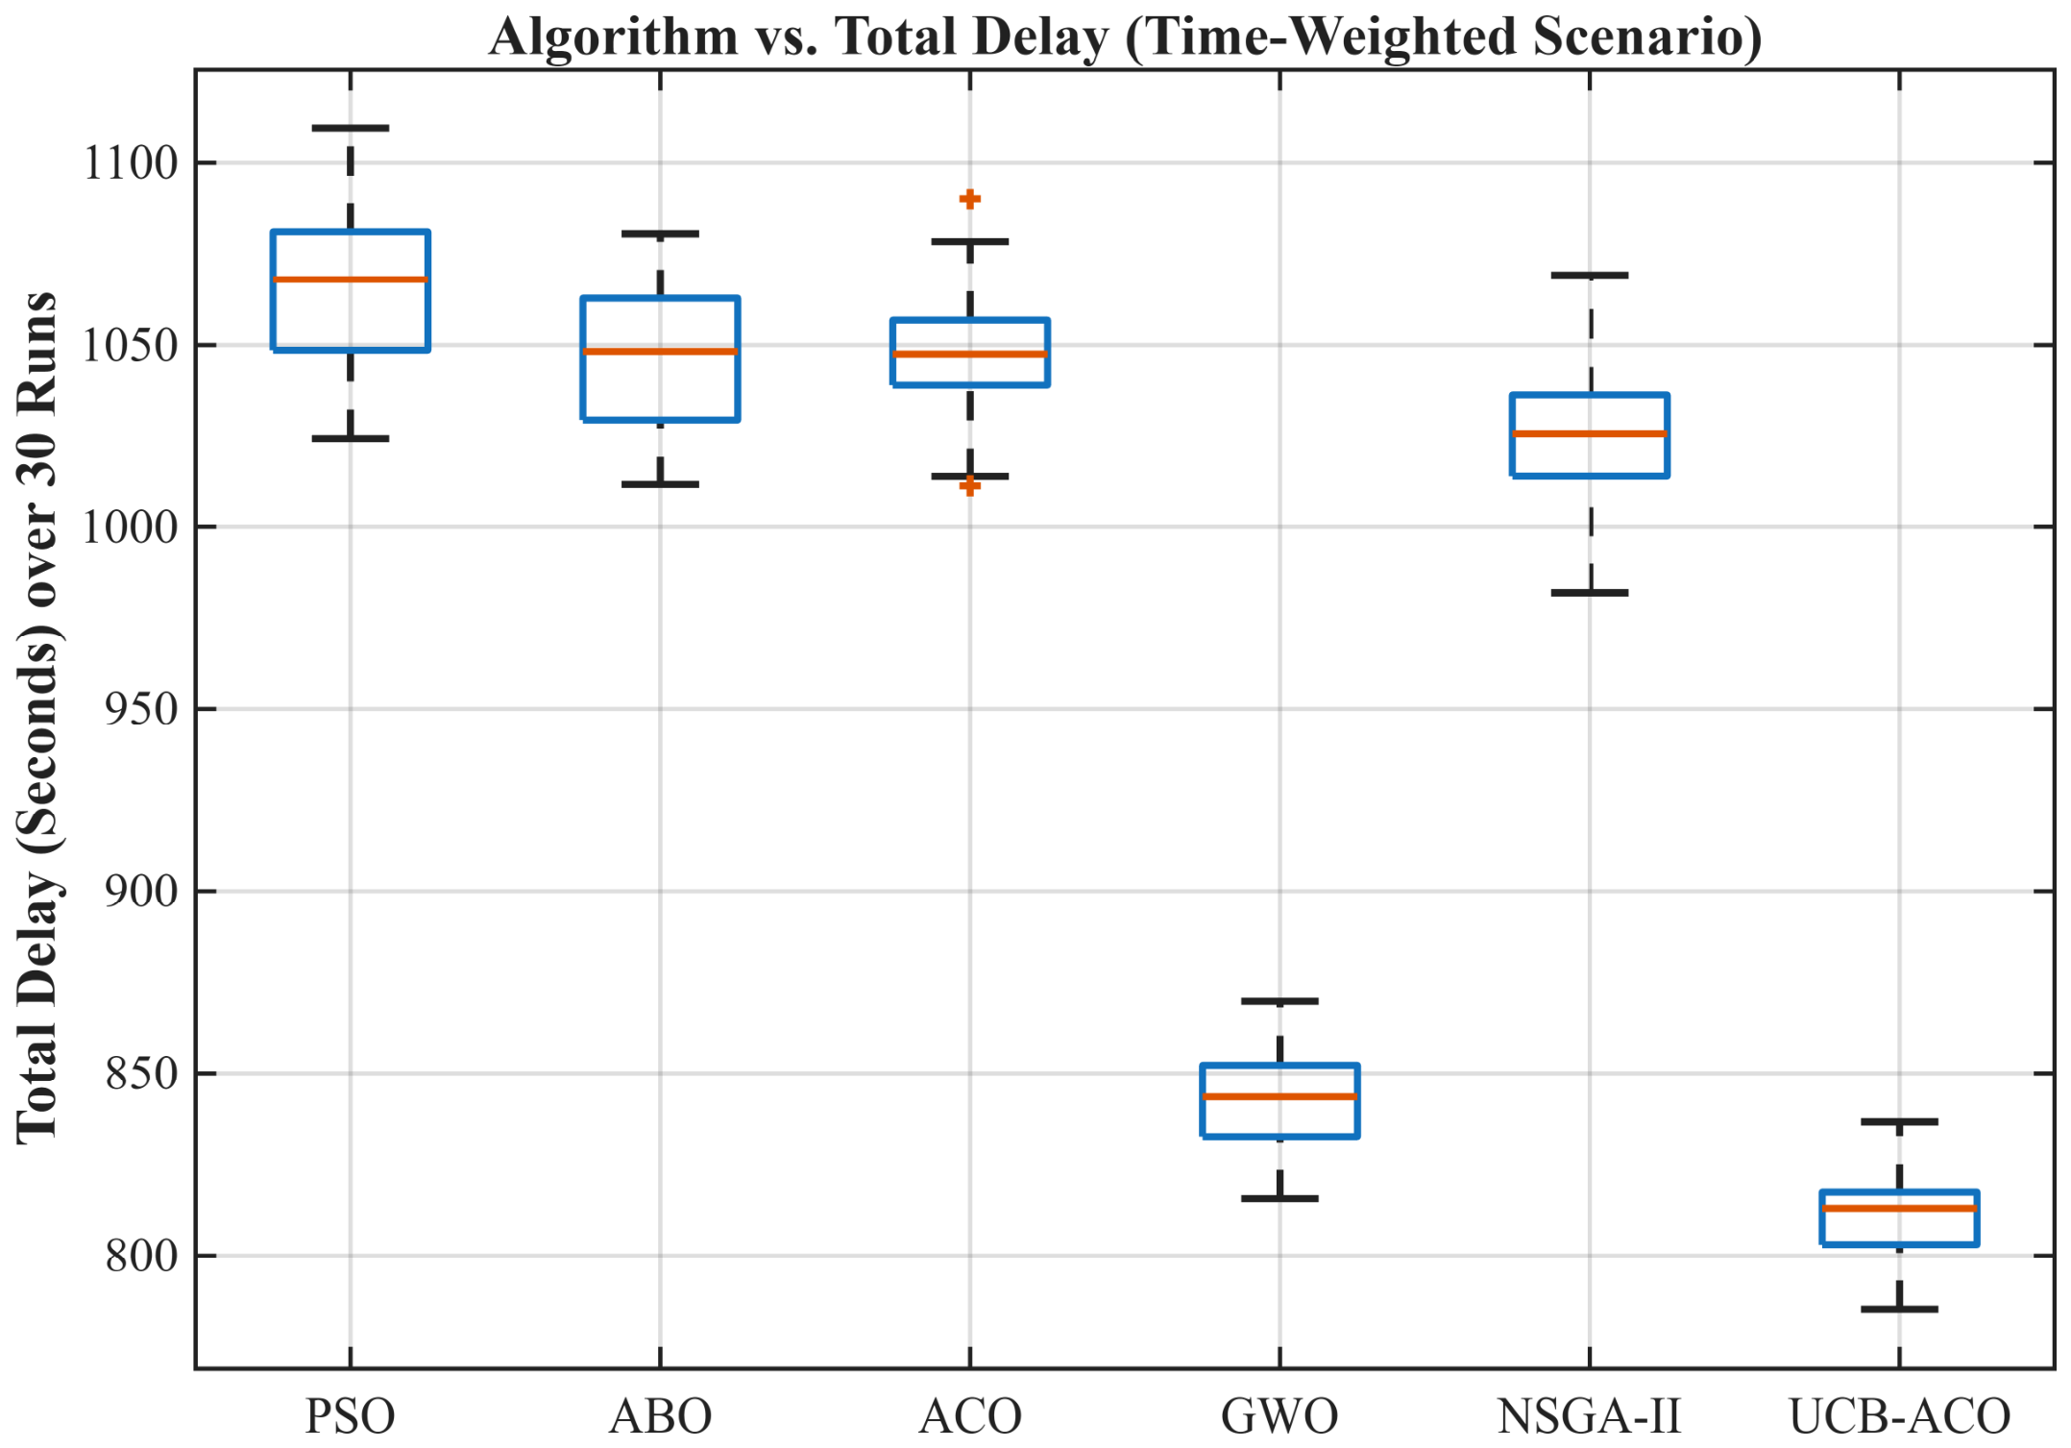
The boxplot representing the time-weighted scenario titled “Algorithm vs. Total Delay” tests the real-time performance capacity and reliability of the algorithms when the system operates with a “speed” priority (
Figure 14). In this scenario, where delay must be minimized, the lower the position of the boxes in the graph, the higher the success.
Following UCB-ACO, the algorithm that presents the lowest delay values is GWO, with a median delay value of around 845 s. GWO’s triple leadership (Alpha, Beta, Delta) structure is very aggressive and effective in identifying the fastest (lowest delay) paths in the search space. Compared to other bio-inspired algorithms, it has been able to escape local minima faster and focus on low-delay regions.
The algorithm with the highest total delay cost, located at the top of the graph, is PSO, with a median delay value of around 1075 s and has a considerably wide box width. PSO has experienced premature convergence in complex search spaces where task deadlines are heavily constrained. Large variances (long whiskers) indicate that PSO is unstable in terms of timing.
The graph clearly illustrates the performance difference between standard ACO (~1050 s) and UCB-ACO (~815 s). Since ants focus only on pheromone tracking, even if a server initially appears fast, they pile up there. This piling causes queuing delay on the server and slows down the system. But the UCB term forces ants to try “yet undiscovered or lightly loaded” servers. In this time-weighted scenario, UCB distributes tasks among servers in the most balanced way, preventing any node from becoming a bottleneck. This “load balancing” ability dramatically reduces total delay. The UCB integration provided approximately a 22% reduction in delay compared to the standard one.
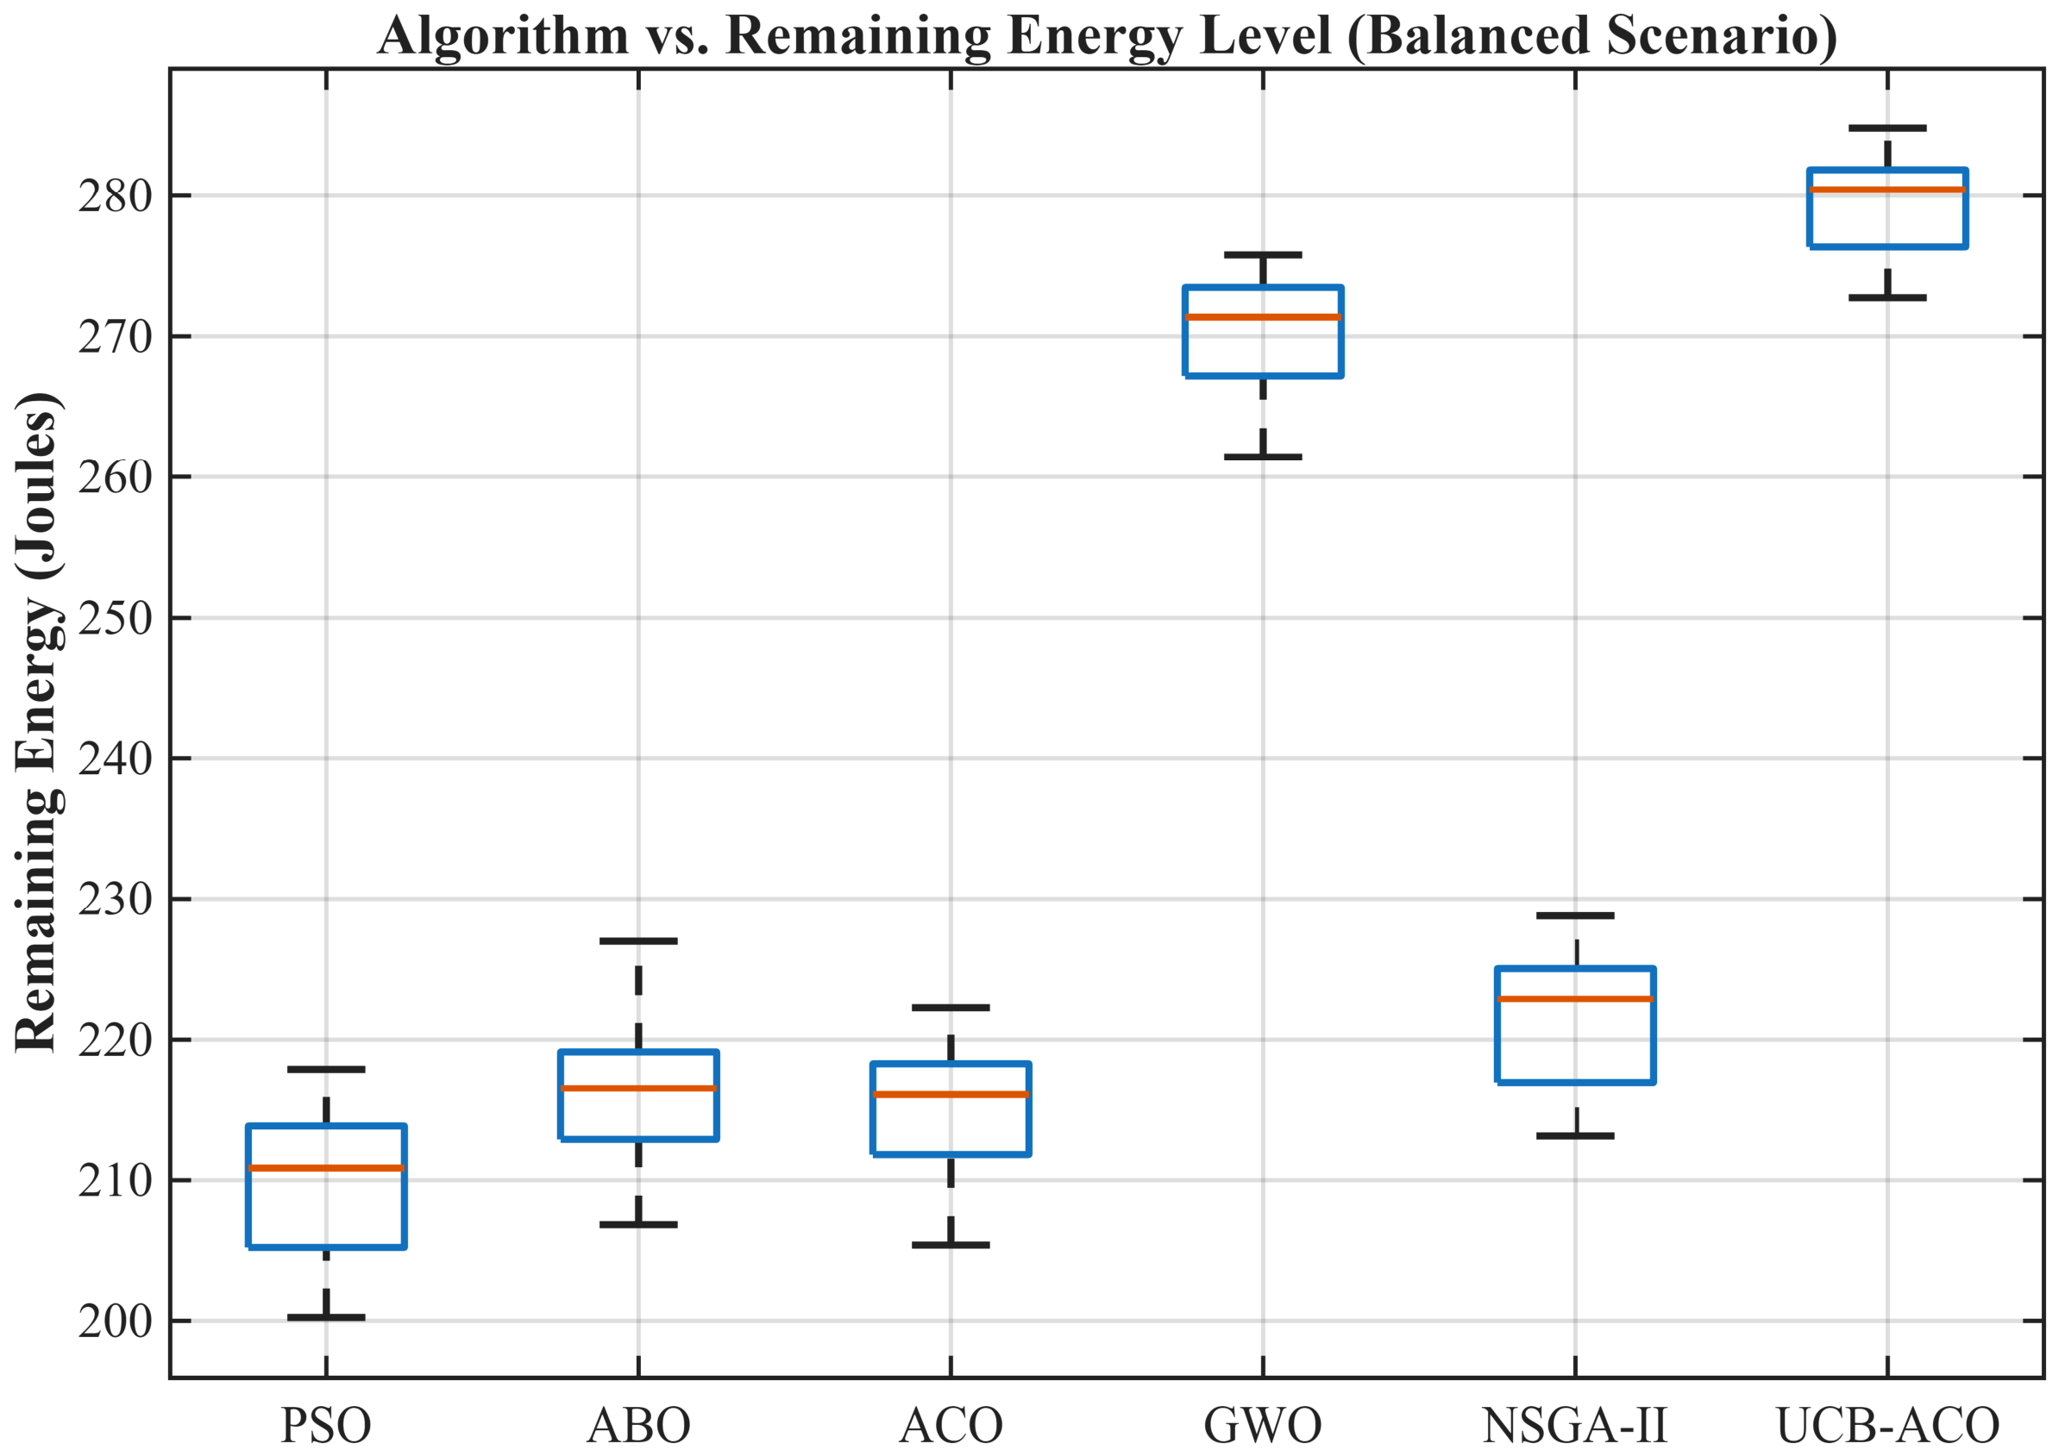
The “Algorithm vs. Remaining Energy Level” box plot representing the balanced scenario shows the energy reserves that devices have at the end of operation. In this graph, higher values (closer to 0) indicate less energy consumption and more remaining energy in the devices (
Figure 15).
After UCB-ACO, the algorithm maintaining the highest energy level is GWO, with a median remaining energy level around . While focusing on both speed and energy in the balanced scenario, GWO’s leader-based exploitation capability managed to keep energy at reasonable levels. However, since it lacks the dynamic load balancing advantage provided by UCB, it remains one step behind the leader.
The algorithm that uses the least energy in devices, meaning it consumes the most, is PSO, and its median value has dropped to levels as low as . PSO rapidly loses the diversity of “particles” when faced with high-dimensional and constrained problems. In the complexity introduced by the balanced scenario, the PSO became locked into an inefficient local optimum early on and failed to optimize energy consumption. Furthermore, the width of the box and the length of its whiskers indicate that it has given inconsistent results in different trials.
The graph clearly shows the significant performance difference between standard ACO and UCB-ACO . Ants fall into the problem of “stagnation” (recession) when following the pheromone trail. So, when a group of servers is marked as “quick”, all the ants head there. This congestion quickly drains the energy of those servers. But thanks to the UCB concept, tasks are distributed homogeneously across all servers on the network. The UCB mechanism managed to maintain the energy level remaining in the devices 34% higher compared to a standard ant colony. Another point is that the UCB-ACO box is compact. This proves that the algorithm is not only energy-efficient but also consistently achieves both objectives (time and energy) of the balanced scenario across all 30 trials. UCB-ACO exhibits a narrower IQR and shorter whiskers, indicating superior stability and lower variance across all simulation runs.
5.5. Performance Summary and Hypothesis Testing
The final stage of the experimental evaluation includes a comprehensive performance summary and rigorous statistical validation of the observed improvements. To provide a unified view of the system’s effectiveness, a multi-criteria performance benchmark was conducted, integrating key metrics such as energy efficiency, time savings, success rate, and fitness. This multi-dimensional analysis highlights the global superiority of the proposed UCB-ACO algorithm across all operational objectives. To ensure that the obtained performance gains are not due to stochastic randomness, a non-parametric Wilcoxon rank-sum test was applied to both the penalty-included and penalty-free fitness values. By obtaining a p-value below the standard significance threshold (p < 0.05), this study mathematically demonstrated the significant advantage of the proposed method over existing meta-heuristic approaches and provided a solid scientific basis for its use in hierarchical task offloading environments.
The radar graph is a holistic performance map that shows whether an algorithm focuses on a single criterion in multi-objective optimization problems or how “compatible” it is with the overall system requirements. The six axes in this graph serve as a “stress test” that not only checks if the proposed method is “fast” or “energy-efficient” but also tests whether it operates reliably, stably, and error-free. The total energy and total delay axes represent the algorithm’s resource management capacity. As the distance to the center increases (approaching 1.0 in normalized values), it indicates that the algorithm both preserves battery life and successfully completes real-time tasks. The effectiveness and reliability axes, success rate and penalty-free fitness indicate how “healthy” the system’s decisions are under strict constraints (deadlines). The penalty-free axis measures the actual success the algorithm achieves without violating constraints (without penalties); success rate provides a net output of the task completion percentage. The standard deviation and total fitness axes indicate statistical robustness. While the fitness axis shows the algorithm’s mathematical optimality level, the standard deviation axis shows how consistent (stable) the algorithm is across different simulation trials. If an algorithm’s line is close to the center on this axis, its performance is random; if it is close to the outside, it means it delivers the same high success under all conditions. In the “Compatibility Profile” radar graph, the further the lines are from the center (closer to a value of 1.0), the higher the success rate in that criterion (
Figure 16).
In the radar graph, the algorithm that follows closely behind UCB-ACO and covers the largest area is GWO. GWO shows a significant advantage over its competitors (PSO, ABO, ACO), especially in the axes of time efficiency and energy efficiency. Its search strategy based on the wolf hierarchy enables it to quickly identify efficient regions in the solution space. However, it failed to achieve the full coverage offered by UCB-ACO on the axes of reliability and success rate, remaining within the inner layer.
The algorithm closest to the center of the graph, thus covering the narrowest area, is PSO. PSO exhibits the lowest performance, particularly on the reliability and success rate axes. The premature convergence of particles to local optima prevents the algorithm from establishing a balance in multi-dimensional optimization. Its placement in the innermost ring on almost all axes in the graph proves that its overall compatibility profile is quite weak.
The fact that NSGA-II, a genetic-based algorithm, surpasses the leader-based GWO in Reliability and takes the second place can be explained by “Population Diversity”. GWO has a hierarchical structure (Alpha, Beta, Delta). If the leading wolves (especially Alpha) focus early on a wrong or inefficient direction (local optimum), the entire pack tends toward that direction. This causes performance fluctuations (high standard deviation) across different trials. In contrast, NSGA-II is a genetic algorithm. It has no leader; instead, it has a large set of solutions (population). But it has a “representative” at every corner of the solution space thanks to crossover and mutation mechanisms. Looking at all 30 trials, while NSGA-II’s chance of finding the “best” solution is not as high as UCB-ACO’s, its probability of producing the “worst” solution is lower than GWO’s. In other words, NSGA-II exhibits a trajectory in terms of “very stable average success”. Since the reliability axis measures precisely this stability (low variance), NSGA-II surpasses GWO.
The dramatic collapse in the success rate of algorithms is due to the system hitting the “Complexity Wall”. Especially when the number of tasks and constraints (deadlines) increase, the load balancing capacities of the algorithms are tested. PSO, ABO, and ACO experience “Search Stagnation” because the moment a server is marked as “fast” or “low-cost,” the entire swarm (ants, particles, or butterflies) rushes to that server. This causes excessive congestion on that server, queues lengthen, and tasks miss their deadlines. As soon as a task misses its deadline, the success rate drops to zero. Therefore, a mechanism is needed to prevent this “traffic congestion.”
The radar graph clearly reveals the massive performance difference between standard ACO and the proposed UCB-ACO as an “area expansion.” In standard ACO, ants experience “ant stagnation” because they focus only on pheromone intensity; this results in a low success rate and poor energy efficiency. The UCB term enables the algorithm not only to exploit known good paths but also to explore new paths with high uncertainty. This is the foundation of the full success seen on the cost optimization (Cost-Opt) and penalty minimization (Penalty-Min) axes in the radar graph. Thanks to UCB, the algorithm distributes the load so evenly across the network that both the success rate is maximized and energy and time costs are minimized. As a result, while standard ACO exhibits a profile in the approximately 0.6–0.7 range (medium level), UCB-ACO reaches the 1.0 limit (excellent compatibility) across all axes.
In conclusion, this graph is one of the most powerful visualizations for proving the “Pareto Stability” of algorithms. The expected shape that an ideal solution should form on this graph is a smooth hexagon approaching the outer boundary on all axes; this proves that the algorithm operates without compromising any performance criterion (perfectly balancing the trade-offs).
To measure the effectiveness of the proposed UCB-ACO algorithm and the compared meta-heuristic methods under different operational conditions, 30 population sizes and 100 iterations with 10 devices and 50 tasks per device were run for 30 independent runs in three designed basic scenarios. The simulation results include best (Min/Max), worst (Max/Min), mean (Average), and standard deviation statistics for fitness, energy, delay, and success rate, which are given in
Table 8,
Table 9 and
Table 10.
It is critical to note the statistical relationship between the evaluated average total delay (e.g.,
Table 8c) and the task success metric (e.g.,
Table 8d). An initial observation might suggest a discrepancy, as the system achieves highly optimized mean latency while simultaneously registering rejected tasks. However, this is a direct result of the framework’s inelastic constraint violation penalty (
). While the average delay reflects the mean response time of valid trajectories, the success metric strictly evaluates adherence to deadlines on a per-task basis. Consequently, transient network queuing delays may cause an individual task to exceed its rigid deadline, triggering the penalty and lowering the success count, even if the overall system average latency remains low. By isolating and rejecting invalid tracks, the framework ensures that the reported average delays are not artificially skewed by failed outliers.
To validate the superiority of the proposed UCB-ACO, all algorithms were subjected to 30 independent runs with and without penalty, and the results were analyzed using the Wilcoxon rank-sum test at a 5% significance level, presented in
Table 11.
Table 11 summarizes the Wilcoxon rank-sum test results, while the comprehensive data for each of the 30 independent runs are provided in
Table A1 and
Table A2 in
Appendix B.
According to Wilcoxon test results, p < 0.05 (especially p ≈ 10−11) was obtained, and the performance difference between the proposed UCB-ACO algorithm and competing algorithms is statistically significant. This proves that the success of the proposed method in cost minimization and constraint management is not coincidental.
In conclusion, comprehensive simulations and statistical analyses reveal that the proposed UCB-ACO based optimization framework demonstrates a significant advantage over competing algorithms in all test scenarios (balanced, energy-weighted, and time- weighted). Compared to PSO, ABO, ACO, GWO, and NSGA-II algorithms, UCB-ACO consistently achieved the lowest (best) values in both total energy consumption and network latency. Its stable performance, particularly in success rate analyses, confirms the algorithm’s ability to adapt to dynamic network conditions. Moreover, the p-values obtained from the Wilcoxon signed-rank test, which are far below the critical threshold value (p ≈ 3.0199 × 10⁻¹¹), prove that this observed performance increase is not coincidental and is statistically highly significant. All these findings indicate that the proposed model provides both an efficient and statistically reliable optimization solution for energy- and time-constrained task-offloading applications.
6. Discussion
In this study, an original optimization framework integrating UCB and ACO mechanisms was developed, successfully achieving an optimal balance between energy consumption and latency in task-offloading processes within energy-constrained Wireless Sensor Networks. Comprehensive analyses showed that the proposed method exhibits superior optimization performance in terms of both operational efficiency and statistical significance compared to competing meta-heuristic algorithms under dynamic network conditions.
The superior performance of UCB-ACO relies on its ability to manage the balance between exploration and exploitation within a statistical confidence interval framework. The biggest risk encountered in traditional ACO algorithms is the trapping quickly in local optima of algorithm because of influenced by pheromone intensity. However, the UCB mechanism adds an “uncertainty bonus” to the ant colony’s decision-making process, enabling the evaluation of task offloading paths that are less frequently visited but potentially more efficient. This dynamic adaptation capability ensures that, in WSN (Wireless Sensor Network) environments where network traffic and node energy levels change in real time, the algorithm continuously updates its offloading decisions to an optimal level based on changing conditions, rather than focusing solely on past good outcomes.
The findings obtained from the proposed model make a significant contribution to the advancement of multi-objective optimization in Edge/IoT layers compared to existing approaches in the literature. The results of the study show parallelism at the objective level with the CMOEA-based approaches presented by [
24], which aim to optimize energy–delay trade-offs. However, the success of the UCB1 mechanism used by [
36] has been transformed into a hybrid structure with ACO in the proposed study and adapted to the specific constraints of Zigbee-based sensor networks (low bandwidth and limited energy). In addition, this study developed an optimization framework that considers the priorities of different applications by defining application-based objective functions.
The fine balance between energy consumption and delay time has a critical impact on hardware lifetime and system reliability in real-world smart home applications. For sensor nodes using low-power communication protocols such as Zigbee, minimizing energy consumption extends device battery replacement intervals from months to years, significantly reducing maintenance costs and network outages. On the other hand, keeping latency under control during task-offloading processes ensures the simultaneous and uninterrupted operation of time-sensitive tasks in smart homes, such as security systems or fire alarms. These results demonstrate how task-offloading processes can become a more sustainable digital ecosystem not only for sensors but for all resource-constrained IoT devices.
The Pareto front analysis and numerical benchmarks clearly demonstrate the statistical and comparative superiority of UCB-ACO. It is crucial to interpret these gains within the practical context of physical Fog–IoT deployments. The improvements achieved by the proposed framework translate directly into critical real-world engineering benefits:
Firstly, the persistent minimization of task energy consumption directly extends the operational lifespan of battery-constrained IoT devices. In massive-scale deployments, such as smart agriculture or industrial sensor networks, even fractional energy savings per task accumulate into months of extended battery life. So this significantly reduces the logistical costs of hardware maintenance.
Secondly, the strict adherence to latency and energy constraints—where continuous algorithms like PSO and ABO fail—has profound practical implications. In mathematical terms, constraint violations result in high penalty scores; however, in real-world Edge networks, a violated deadline equates to a dropped task or a service disruption. For mission-critical applications, such as real-time healthcare monitoring or autonomous factory robotics, ensuring deterministic task completion within strict deadlines is an absolute physical necessity. UCB-ACO’s architectural precision ensures guaranteed quality of service (QoS) and robust network reliability. It proves that its algorithmic design is not only mathematically optimal but also practically indispensable for next-generation telecommunication infrastructures. Despite the high performance exhibited by the proposed UCB-ACO model, this study has some inherent limitations. The study assumes that MDs are either stationary or moving at very low speeds. With the number of MDs set to 10, the focus was primarily on adapting the proposed optimization framework to the task-offloading problem and conducting related analyses.
The scalability of the model in much larger-scale industrial networks (IIoT) has not yet been evaluated. These limitations present a significant research gap and roadmap for expanding the developed optimization framework to cover larger-scale networks and heterogeneous network structures that include mobile devices in the future.