
Single-Trial Electroencephalography Discrimination of Real, Regulated, Isometric Wrist Extension and Wrist Flexion


Abstract
1. Introduction
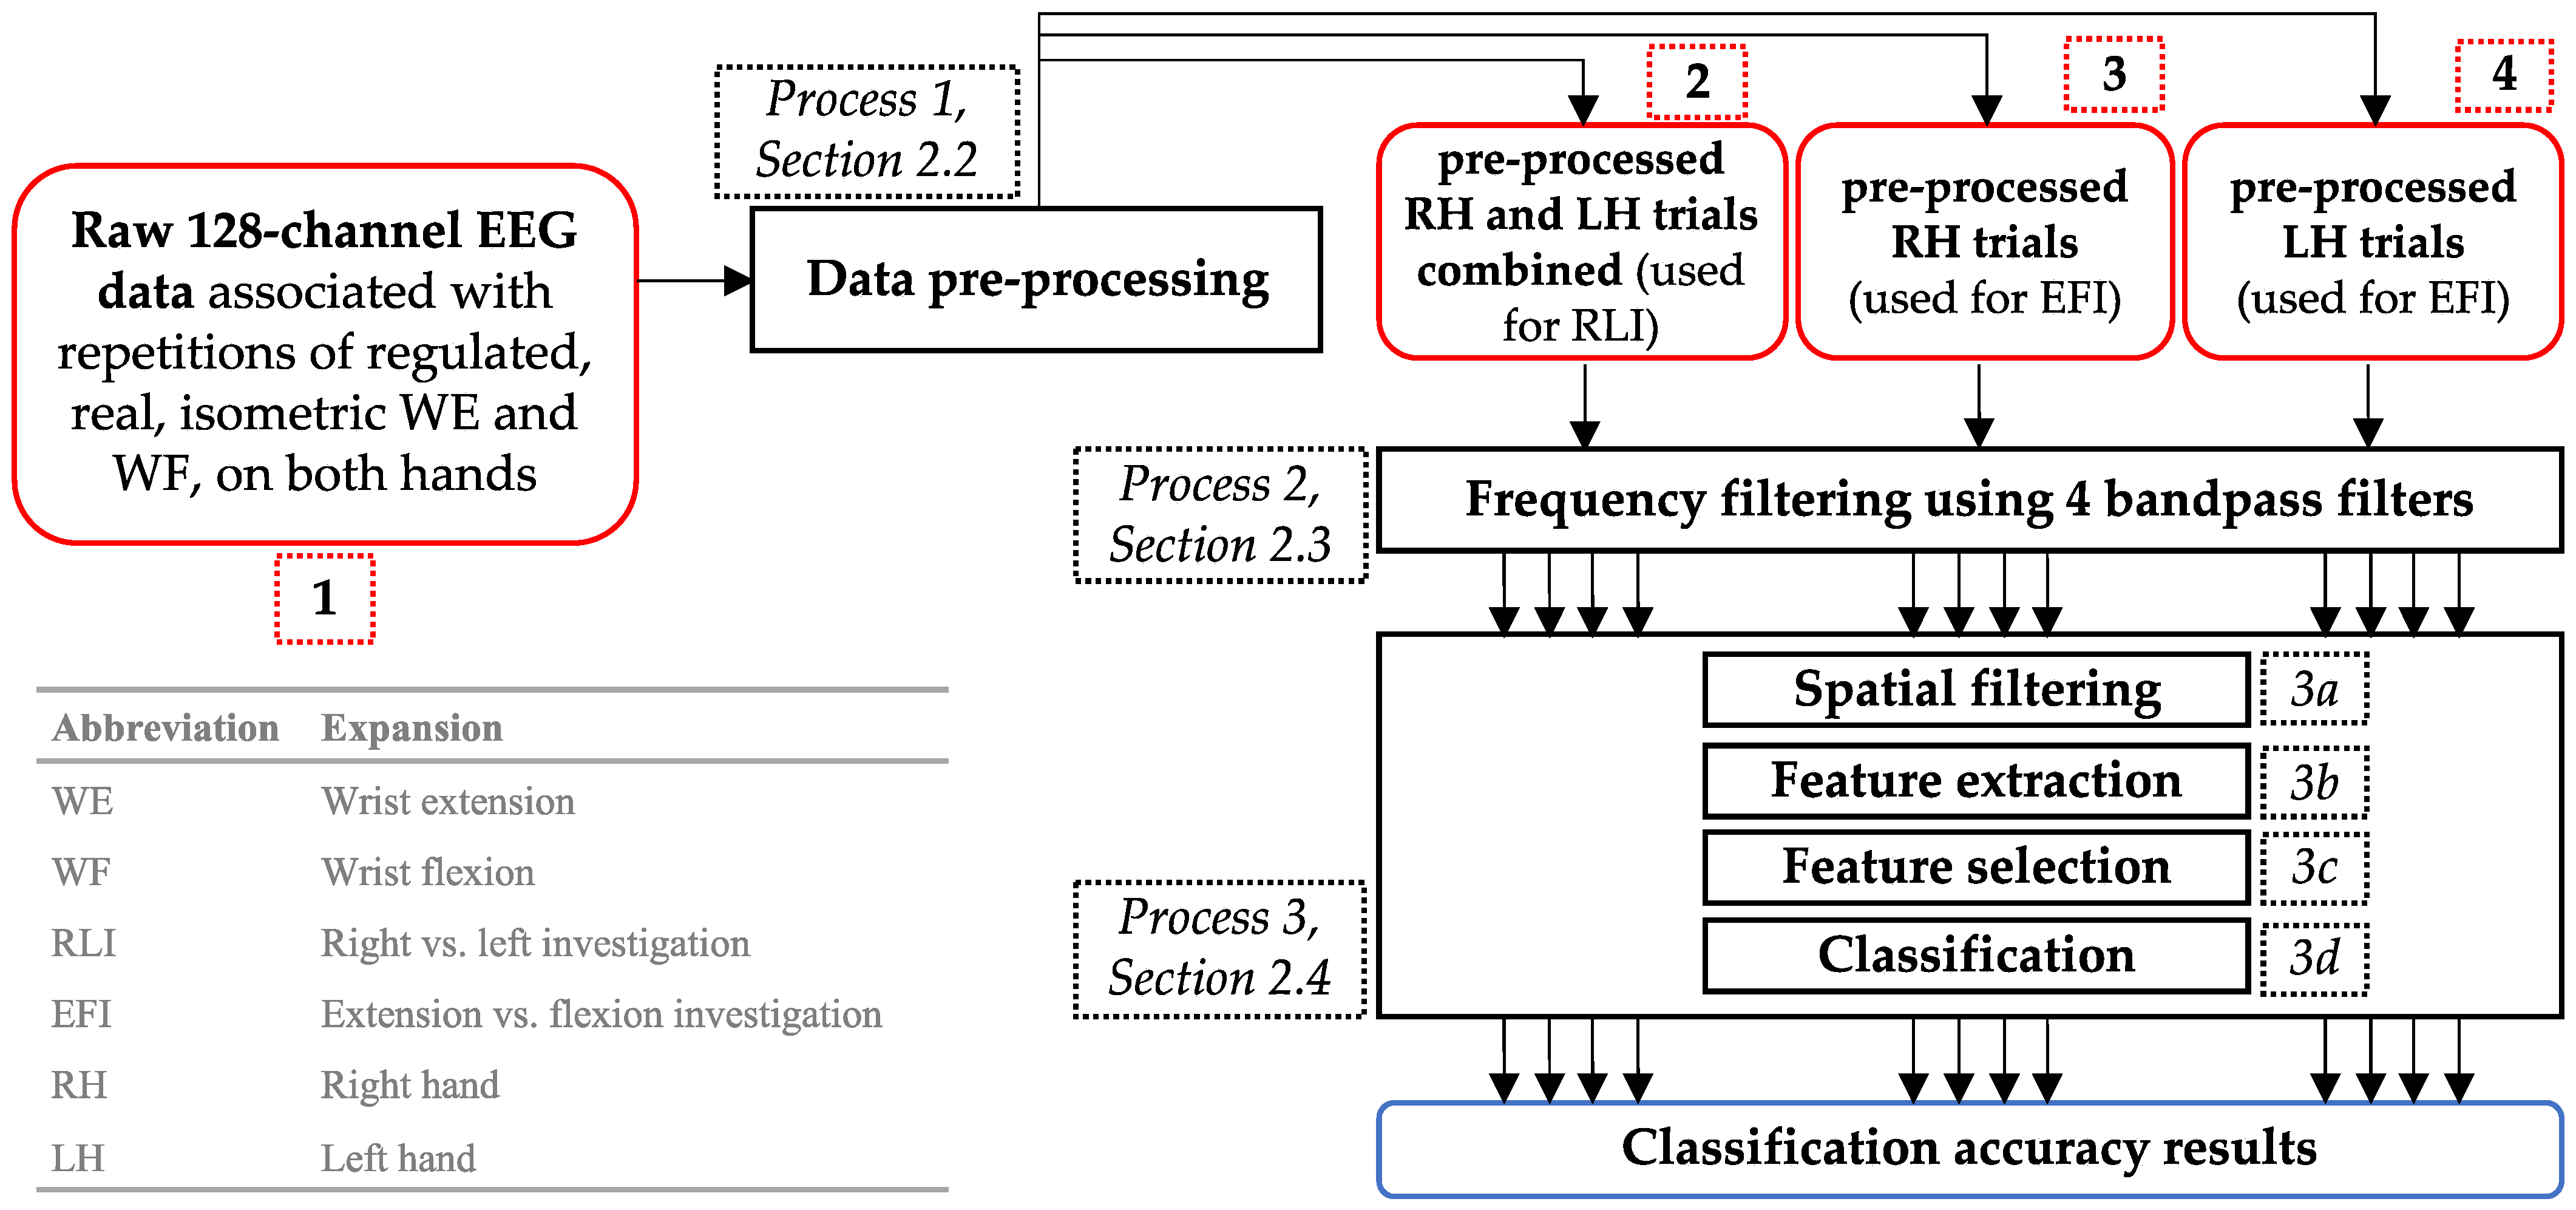
2. Materials and Methods
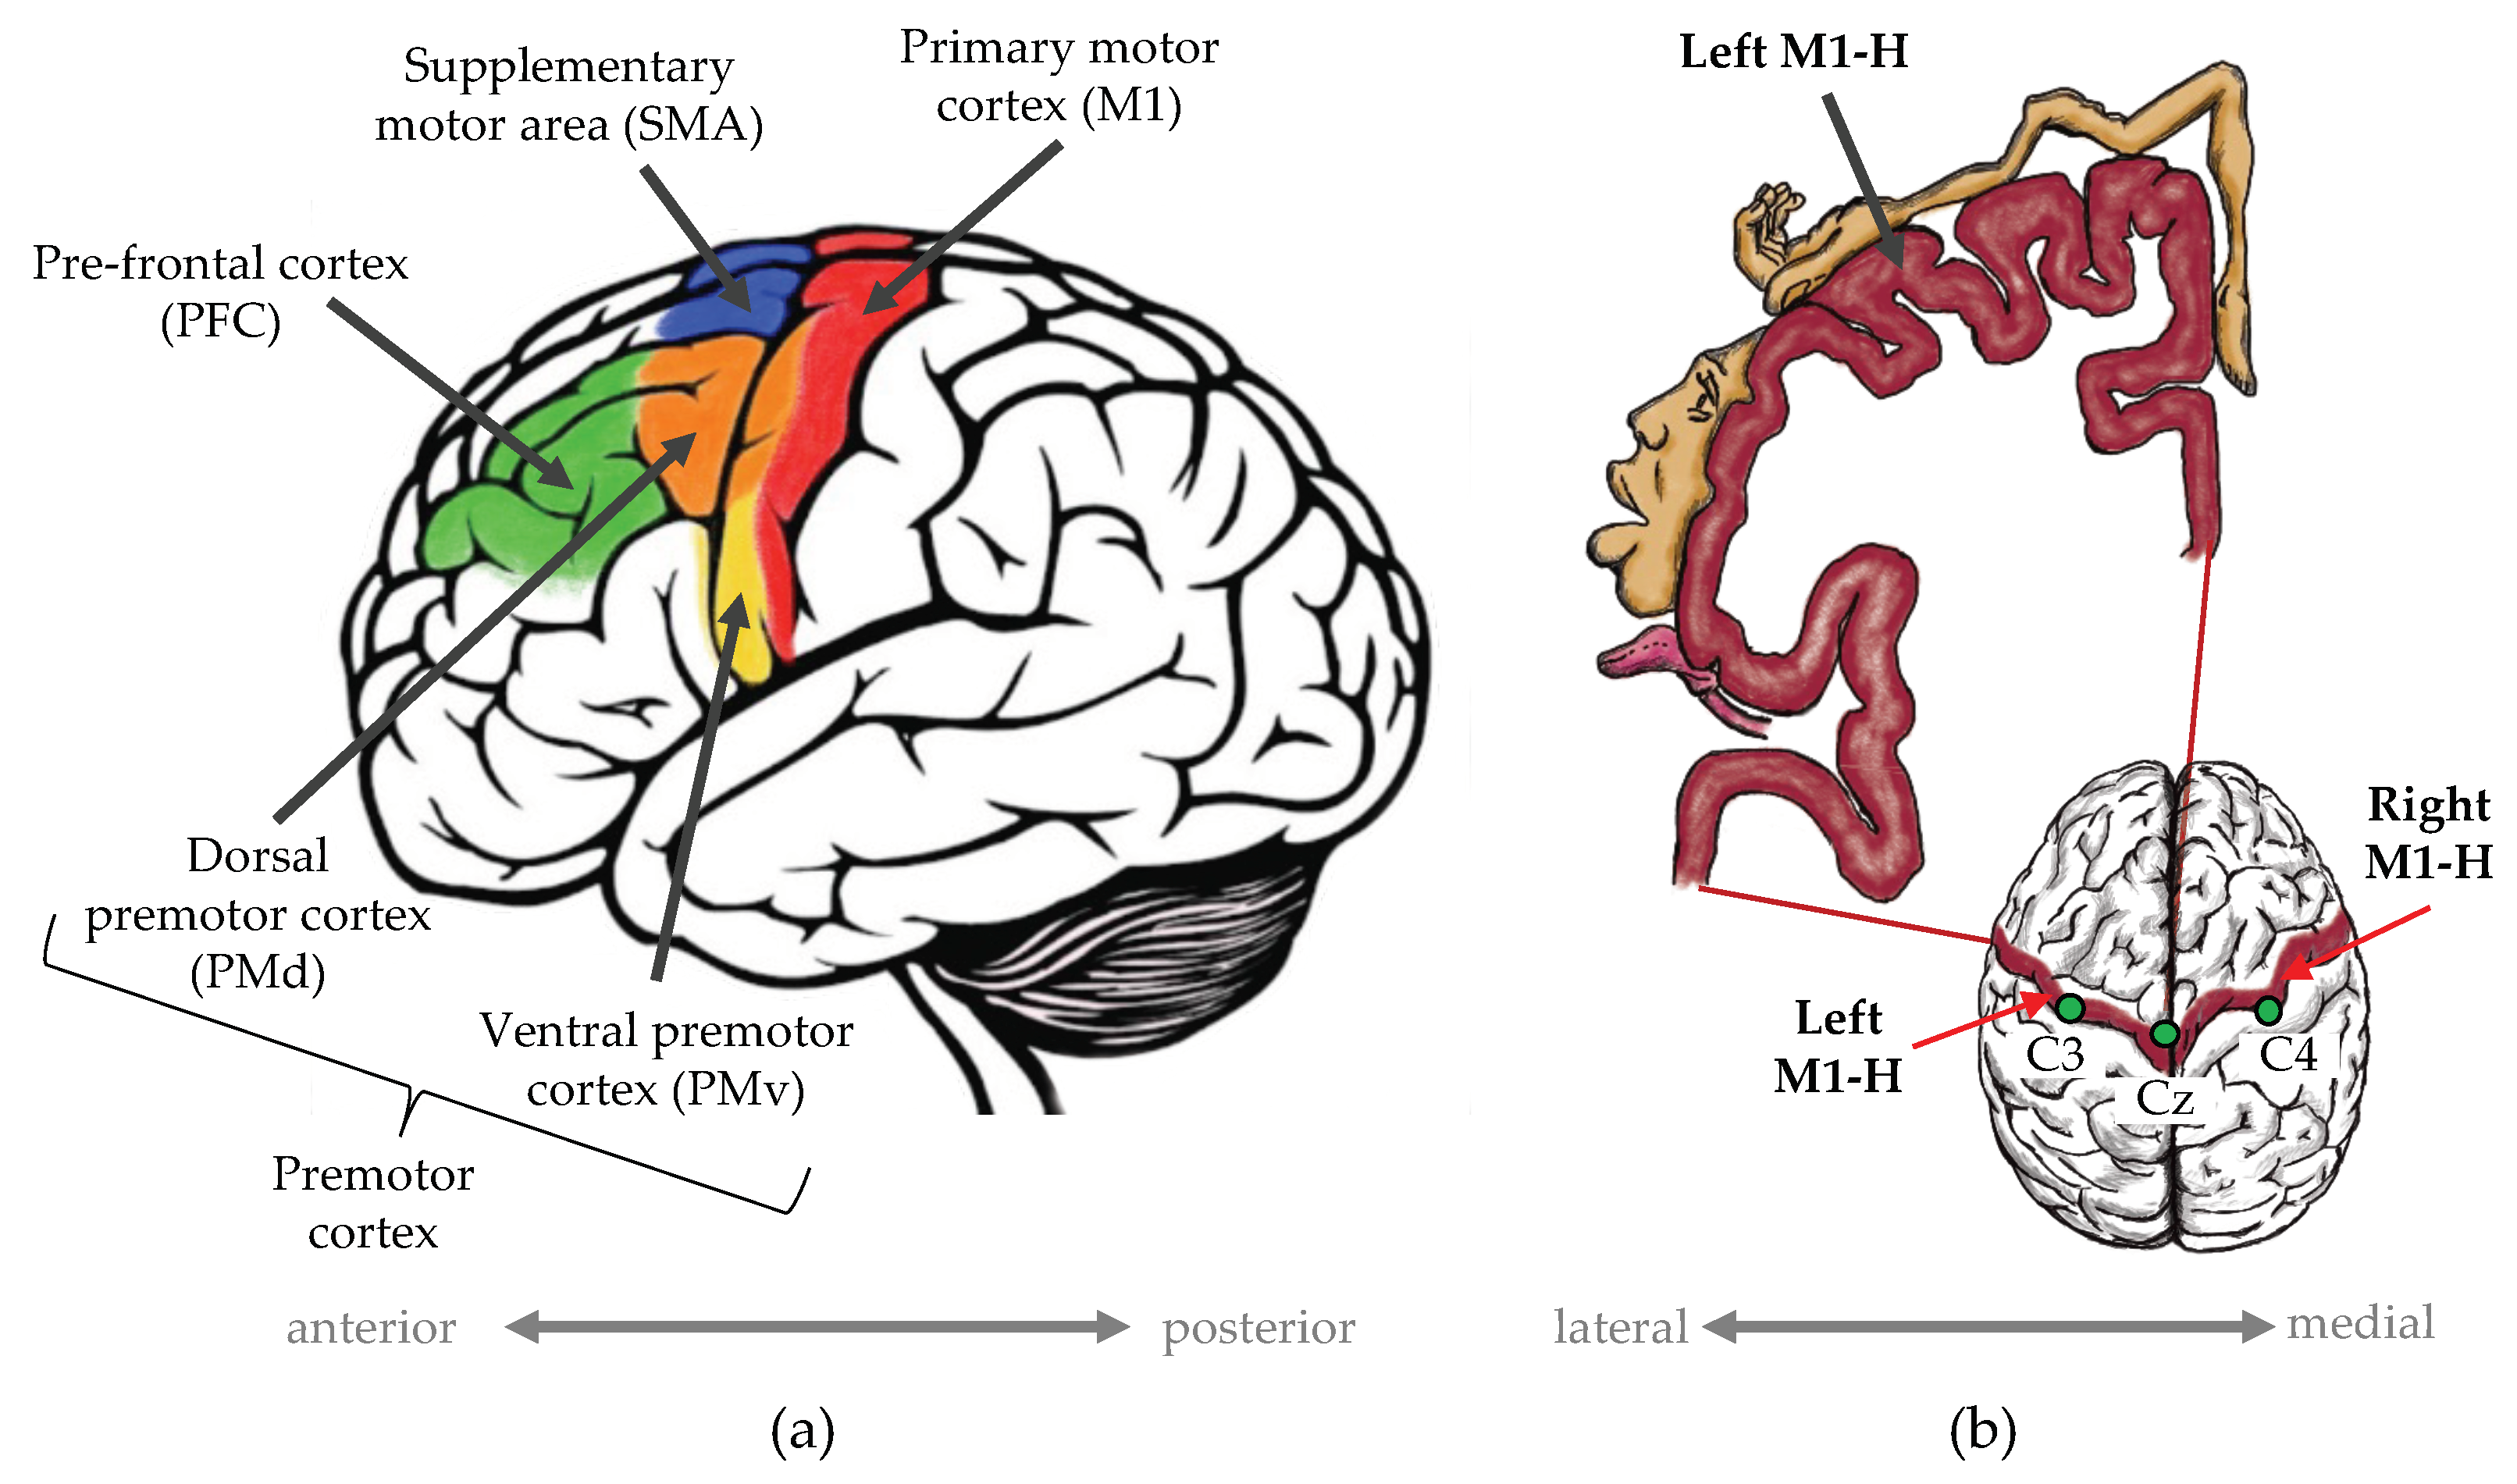
2.1. EEG Data Acquisition

| EEG system manufacturer | Brain Products actiCHamp amplifier (Brain Products GmbH, Gilching, Germany). |
| Description of EEG channels | 128 active electrodes arranged according to the 10–5 system. |
| Description of participants | 14 volunteers (8 males and 6 females)—all right-handed, healthy, with no prior wrist injuries and BCI training, between the ages of 20 and 30 years. |
| Brief motor task description | Real, isometric WE and WF, sustained at 15% of their respective maximum voluntary contractions (MVCs). Each movement repetition involved four stages or time segments (S1–S4) separated by four visual instructions (“Get Ready”, “Start Moving”, “Hold Movement”, and “Stop”). The timing and visual cues are shown in Figure 3. |
| Number of movement repetitions for each participant | 200 WE and 200 WF movements for RH. Same for the left hand. Each repetition formed a single trial. |
| EEG data sampling rate | 500 Hz. |

2.2. EEG Pre-Processing
- A high-pass filter at 0.5 Hz to remove DC shifts while aiming to retain most of the delta band frequencies (0–3.5 Hz);
- A low-pass filter at 99 Hz to remove high-frequency noise above 100 Hz without removing high-gamma information (51–90 Hz);
- A notch filter between 49 and 51 Hz to remove AC line noise.
2.3. Bandpass Frequency Filtering
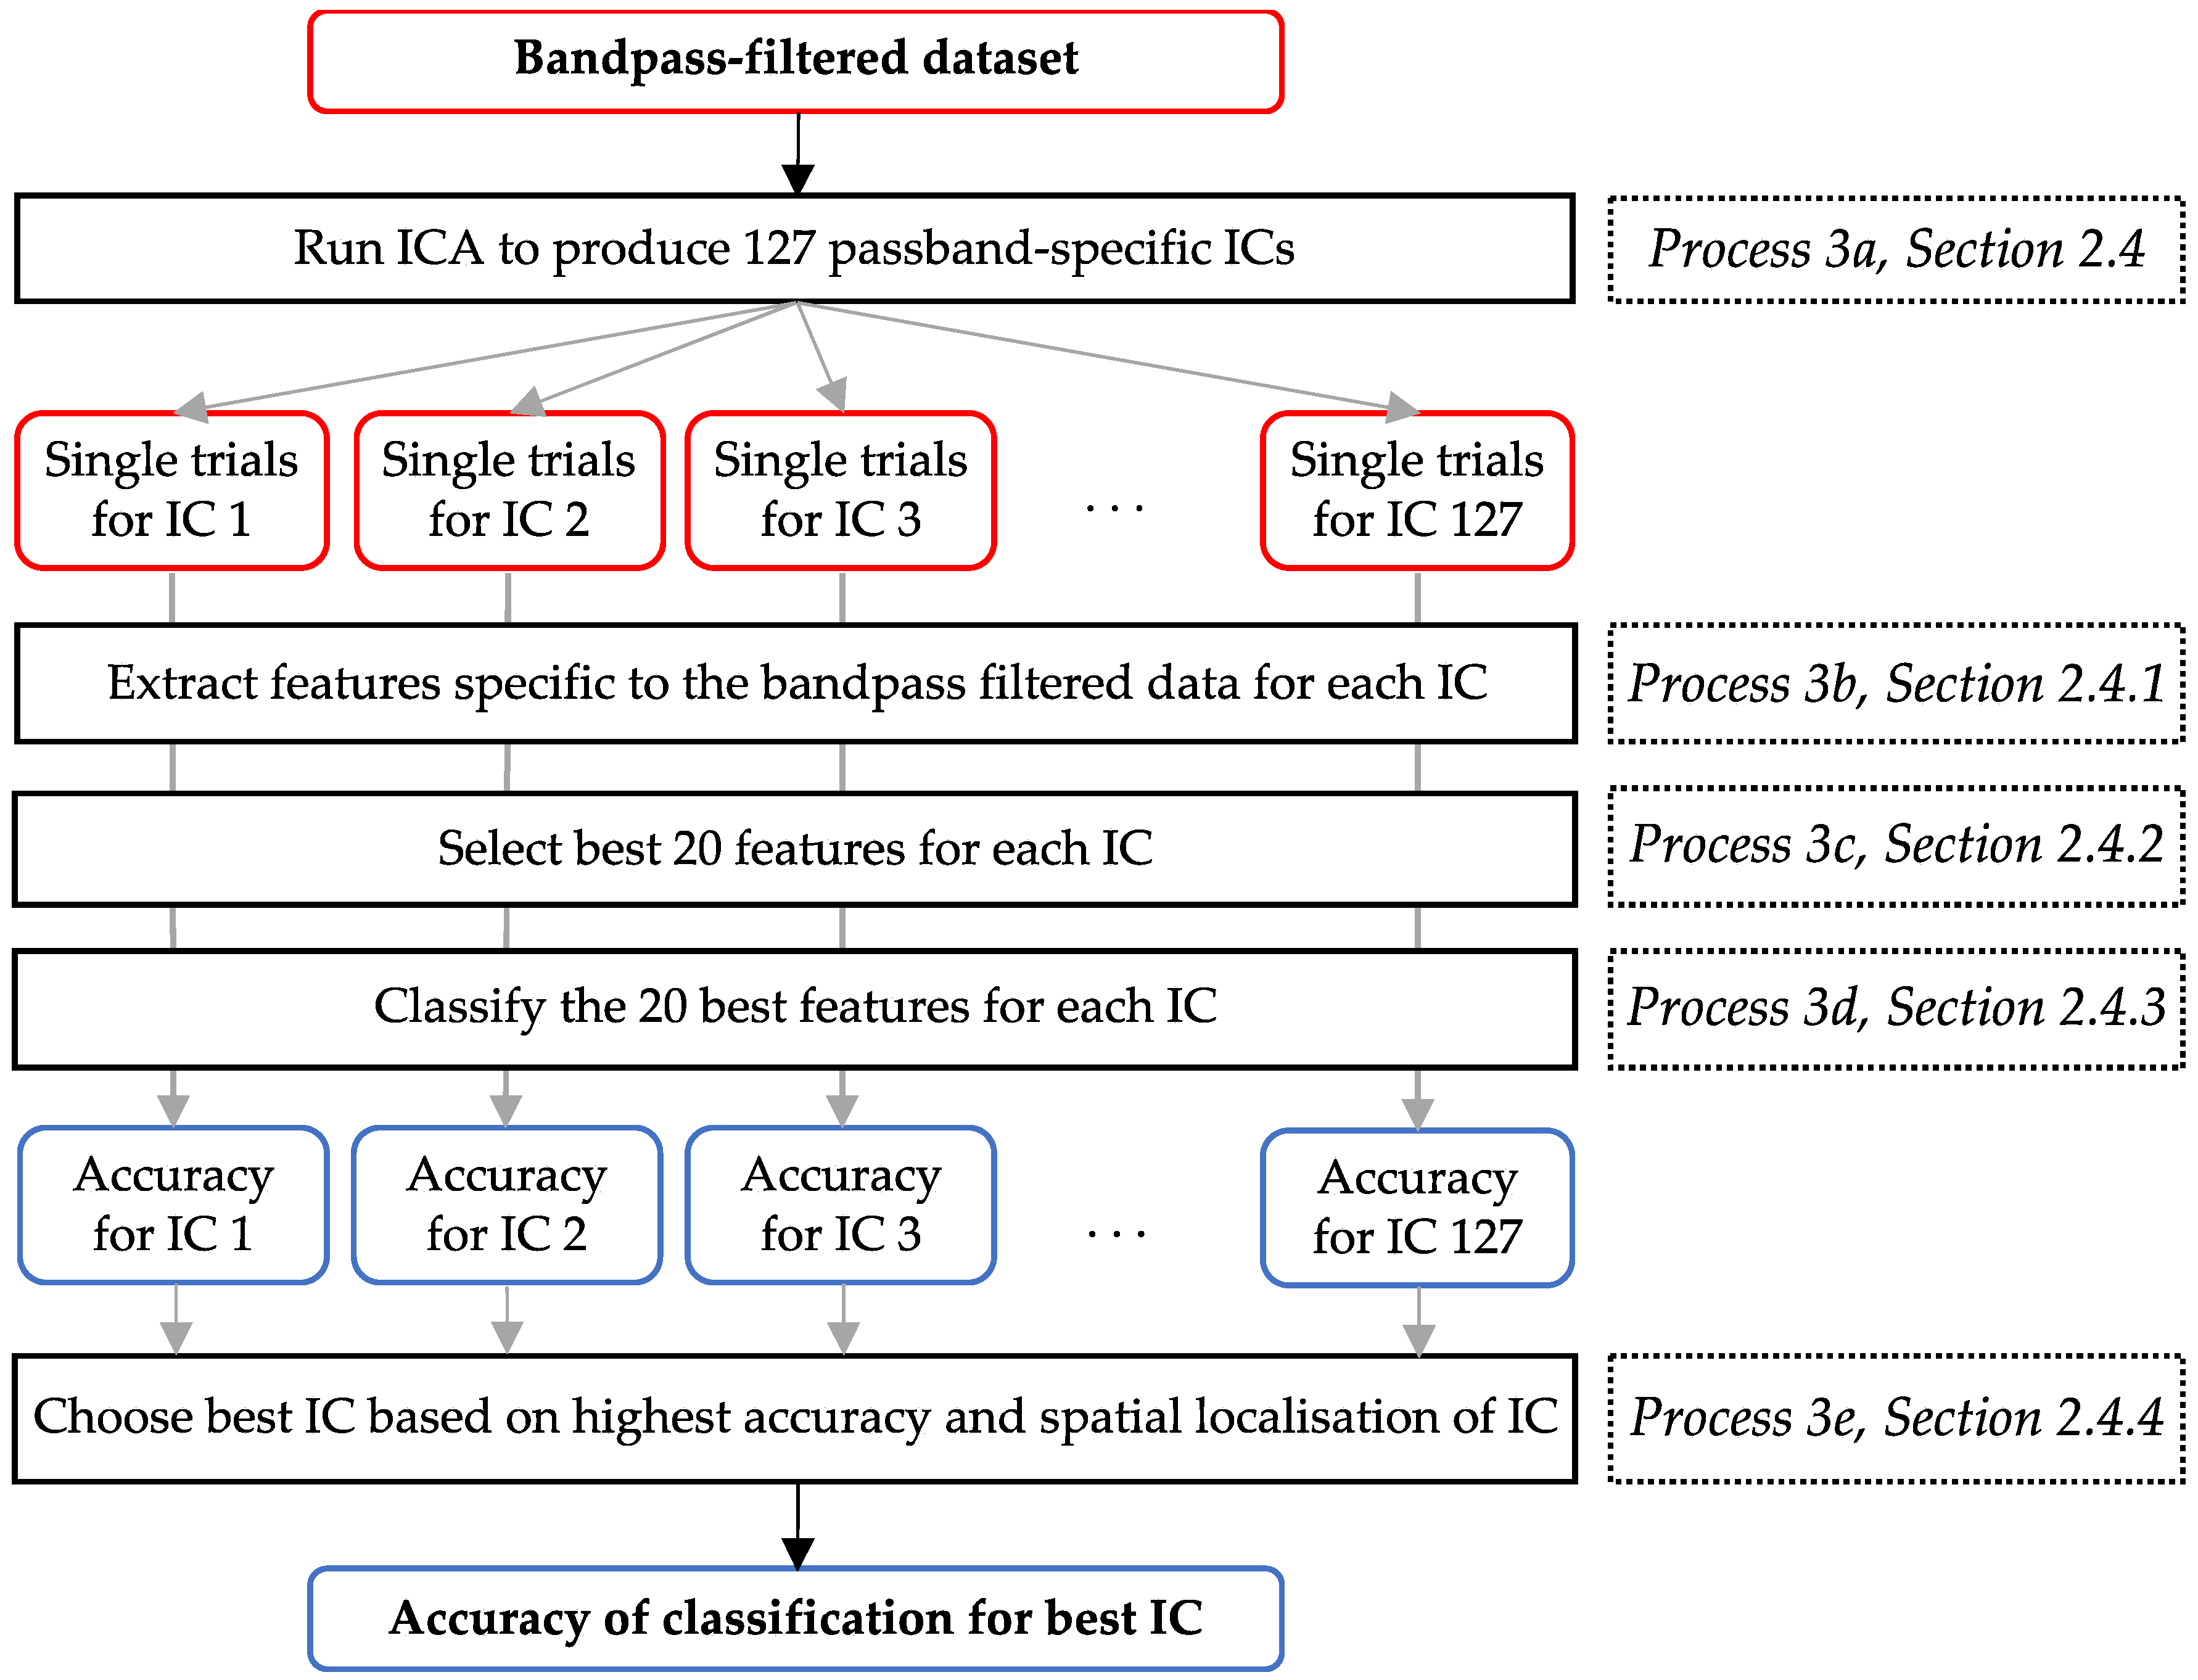
2.4. Spatial Filtering, Feature Extraction, Feature Selection, and Classification
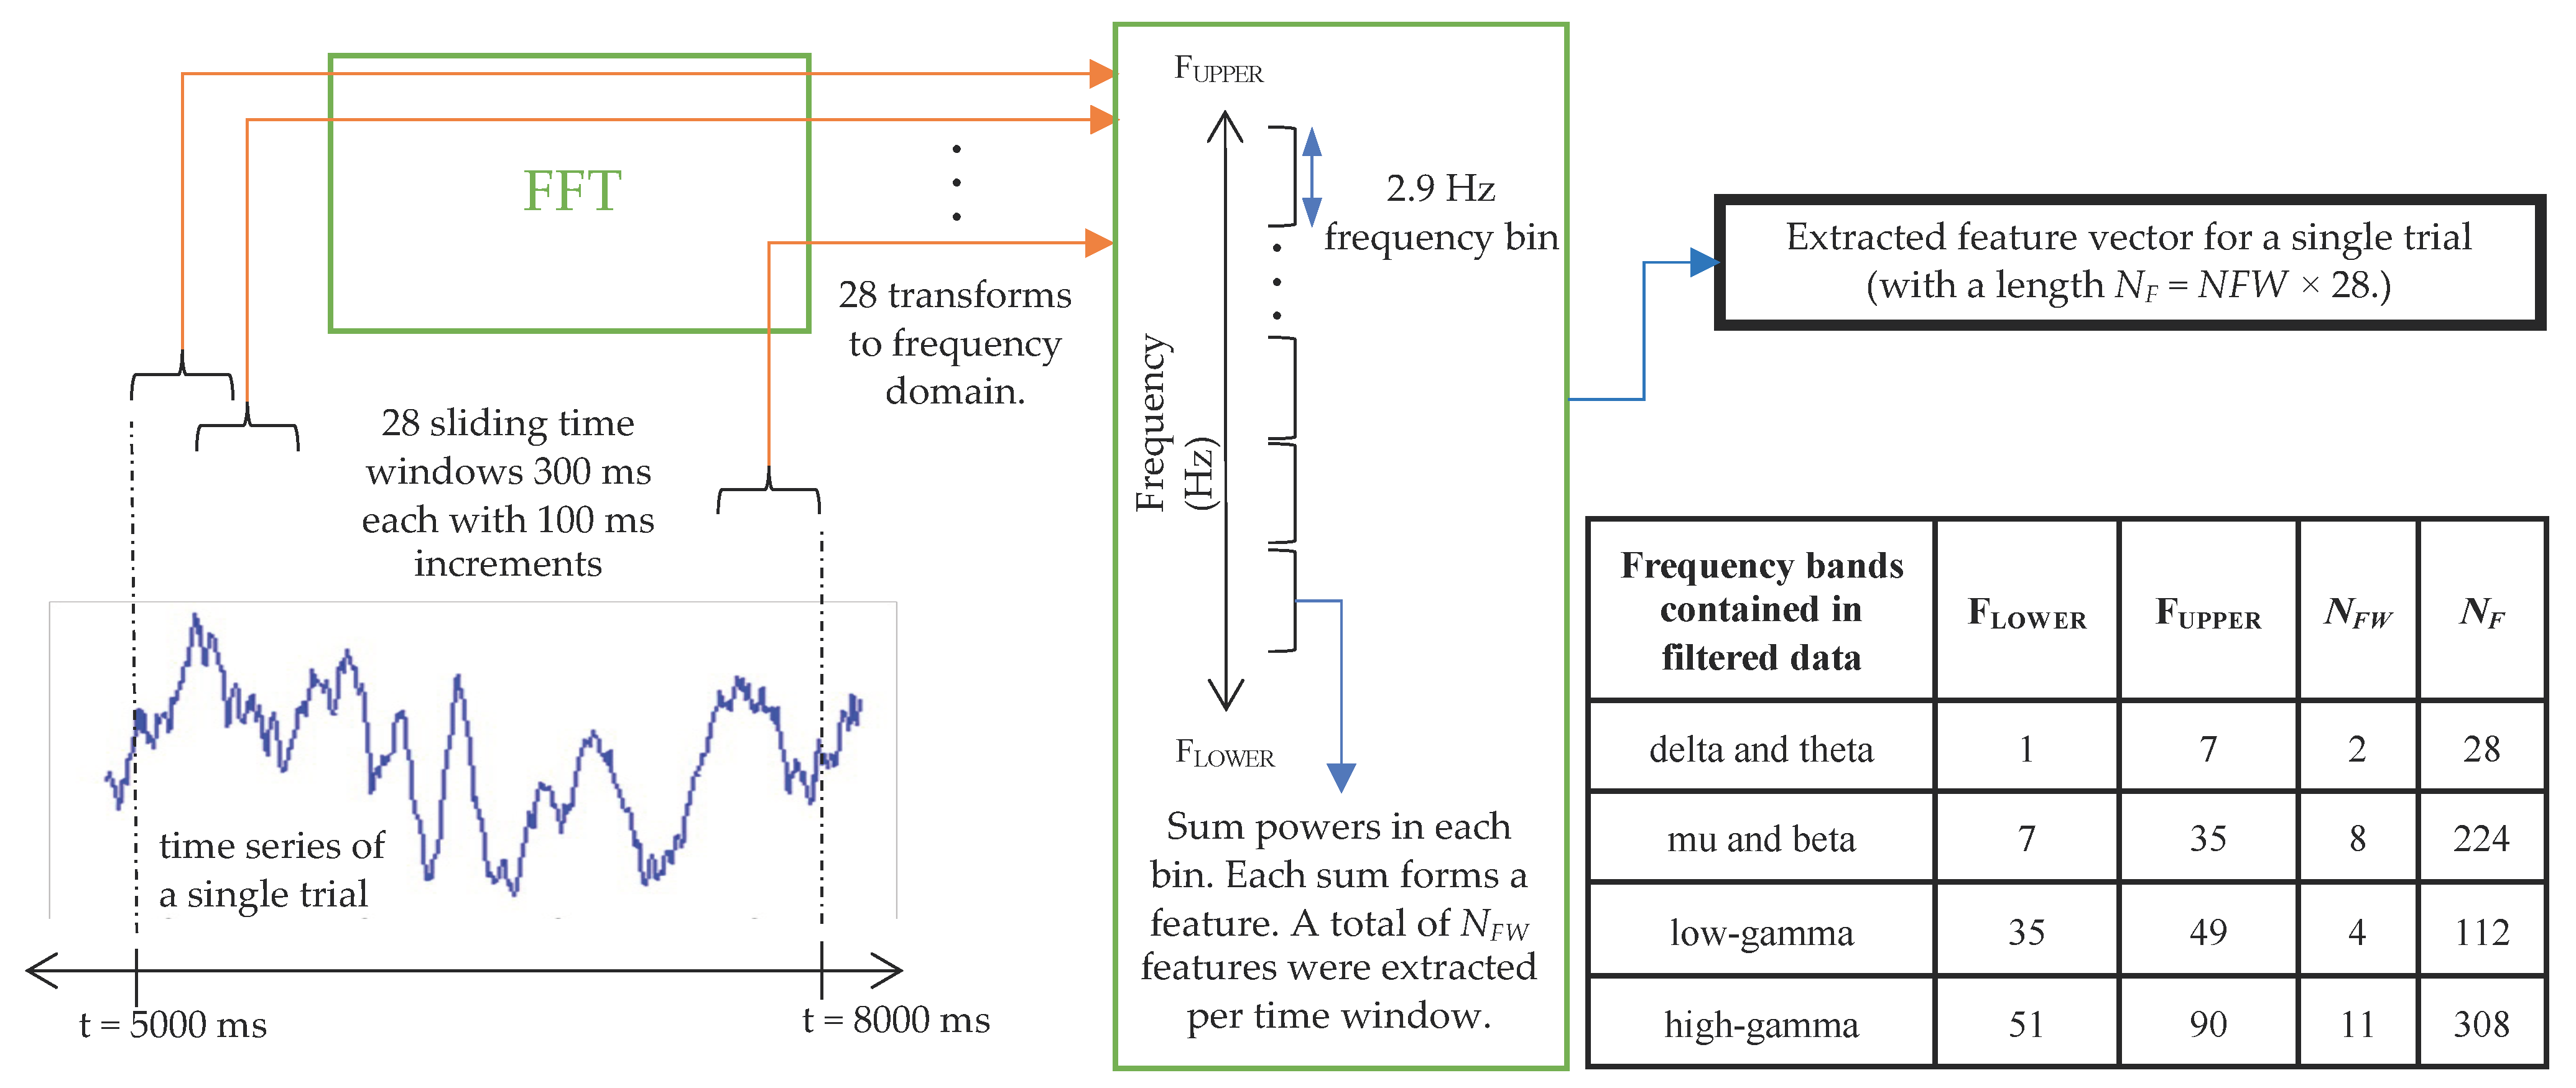
2.4.1. Feature Extraction
2.4.2. Feature Selection
2.4.3. Mahalanobis Distance Clustering Classification
2.4.4. Determining the Best-Performing IC
2.4.5. Analysis of ROIs
2.4.6. Frequency Band Analysis of the Classification Accuracies
3. Results
4. Discussion
5. Conclusions
Author Contributions
Funding
Institutional Review Board Statement
Informed Consent Statement
Data Availability Statement
Acknowledgments
Conflicts of Interest
References
- Rybski, M. Kinesiology for Occupational Therapy; Slack: Thorofare, NJ, USA, 2004; ISBN 1-55642-491-4. [Google Scholar]
- Trombly, C.A.; Radomski, M.V. (Eds.) Occupational Therapy for Physical Dysfunction, 5th ed.; Lippincott Williams & Wilkins: Philadelphia, PA, USA, 2002; ISBN 0-7817-2461-9. [Google Scholar]
- Nelson, D.L.; Mitchell, M.A.; Groszewski, P.G.; Pennick, S.L.; Manske, P.R. Wrist Range of Motion in Activities of Daily Living. In Advances in the Biomechanics of the Hand and Wrist; Schuind, F., An, K.N., Cooney, W.P., Garcia-Elias, M., Eds.; Springer: Boston, MA, USA, 1994; pp. 329–334. ISBN 978-1-4757-9109-9. [Google Scholar]
- Gates, D.H.; Walters, L.S.; Cowley, J.; Wilken, J.M.; Resnik, L. Range of Motion Requirements for Upper-Limb Activities of Daily Living. Am. J. Occup. Ther. 2015, 70, 7001350010p1. [Google Scholar] [CrossRef]
- McConnell, A.; Moioli, R.; Brasil, F.; Vallejo, M.; Corne, D.; Vargas, P.; Stokes, A. Robotic Devices and Brain-Machine Interfaces for Hand Rehabilitation Post-Stroke. J. Rehabil. Med. 2017, 49, 449–460. [Google Scholar] [CrossRef]
- Bertels, T.; Schmalz, T.; Ludwigs, E. Objectifying the Functional Advantages of Prosthetic Wrist Flexion. JPO J. Prosthet. Orthot. 2009, 21, 74–78. [Google Scholar] [CrossRef]
- Carey, S.L.; Lura, D.J.; Highsmith, M.J. Differences in Myoelectric and Body-Powered Upper-Limb Prostheses: Systematic Literature Review. J. Rehabil. Res. Dev. 2015, 52, 247–262. [Google Scholar] [CrossRef]
- Roche, A.D.; Rehbaum, H.; Farina, D.; Aszmann, O.C. Prosthetic Myoelectric Control Strategies: A Clinical Perspective. Curr. Surg. Rep. 2014, 2, 44. [Google Scholar] [CrossRef]
- Fang, Y.; Hettiarachchi, N.; Zhou, D.; Liu, H. Multi-Modal Sensing Techniques for Interfacing Hand Prostheses: A Review. IEEE Sens. J. 2015, 15, 6065–6076. [Google Scholar] [CrossRef]
- Wolpaw, J.R.; Birbaumer, N.; McFarland, D.J.; Pfurtscheller, G.; Vaughan, T.M. Brain–Computer Interfaces for Communication and Control. Clin. Neurophysiol. 2002, 113, 767–791. [Google Scholar] [CrossRef]
- Xu, S.; Liu, Y.; Lee, H.; Li, W. Neural Interfaces: Bridging the Brain to the World beyond Healthcare. Exploration 2024, 4, 20230146. [Google Scholar] [CrossRef]
- Shih, J.J.; Krusienski, D.J.; Wolpaw, J.R. Brain-Computer Interfaces in Medicine. Mayo Clin. Proc. 2012, 87, 268–279. [Google Scholar] [CrossRef]
- Suwannarat, A.; Pan-ngum, S.; Israsena, P. Comparison of EEG Measurement of Upper Limb Movement in Motor Imagery Training System. Biomed. Eng. OnLine 2018, 17, 103. [Google Scholar] [CrossRef]
- Wierzgała, P.; Zapała, D.; Wojcik, G.M.; Masiak, J. Most Popular Signal Processing Methods in Motor-Imagery BCI: A Review and Meta-Analysis. Front. Neuroinformatics 2018, 12, 78. [Google Scholar] [CrossRef]
- Abiri, R.; Borhani, S.; Sellers, E.W.; Jiang, Y.; Zhao, X. A Comprehensive Review of EEG-Based Brain–Computer Interface Paradigms. J. Neural Eng. 2019, 16, 011001. [Google Scholar] [CrossRef]
- Vuckovic, A. Non-Invasive BCI: How Far Can We Get with Motor Imagination? Clin. Neurophysiol. 2009, 120, 1422–1423. [Google Scholar] [CrossRef]
- Vuckovic, A.; Sepulveda, F. Delta Band Contribution in Cue Based Single Trial Classification of Real and Imaginary Wrist Movements. Med. Biol. Eng. Comput. 2008, 46, 529–539. [Google Scholar] [CrossRef] [PubMed]
- Navarro, I.; Hubais, B.; Sepulveda, F. A Comparison of Time, Frequency and ICA Based Features and Five Classifiers for Wrist Movement Classification in EEG Signals. In Proceedings of the 2005 IEEE Engineering in Medicine and Biology 27th Annual Conference, Shanghai, China, 17–18 January 2006; pp. 2118–2121. [Google Scholar]
- Khan, Y.U.; Sepulveda, F. Brain–Computer Interface for Single-Trial EEG Classification for Wrist Movement Imagery Using Spatial Filtering in the Gamma Band. IET Signal Process. 2010, 4, 510. [Google Scholar] [CrossRef]
- Vučković, A.; Sepulveda, F. A Two-Stage Four-Class BCI Based on Imaginary Movements of the Left and the Right Wrist. Med. Eng. Phys. 2012, 34, 964–971. [Google Scholar] [CrossRef]
- Mohamed, A.K.; Marwala, T.; John, L.R. Towards Improved EEG Interpretation for the Control of a Prosthetic/Orthotic Hand Using a BCI: Single-Trial Right and Left Hand Discrimination. In Proceedings of the Twenty-Second Annual Symposium of the Pattern Recognition Association of South Africa, Vanderbijlpark, South Africa, 22–25 November 2011; pp. 101–107. [Google Scholar]
- Bhattacharyya, S.; Pal, M.; Konar, A.; Tibarewala, D.N. An Interval Type-2 Fuzzy Approach for Real-Time EEG-Based Control of Wrist and Finger Movement. Biomed. Signal Process. Control 2015, 21, 90–98. [Google Scholar] [CrossRef]
- Edelman, B.J.; Baxter, B.; He, B. EEG Source Imaging Enhances the Decoding of Complex Right-Hand Motor Imagery Tasks. IEEE Trans. Biomed. Eng. 2016, 63, 4–14. [Google Scholar] [CrossRef]
- Mohamed, A.-K.; Aswat, M.; Aharonson, V. Low-Cost Dynamometer for Measuring and Regulating Wrist Extension and Flexion Motor Tasks in Electroencephalography Experiments. Sensors 2024, 24, 5801. [Google Scholar] [CrossRef]
- Nicolas-Alonso, L.F.; Gomez-Gil, J. Brain Computer Interfaces, a Review. Sensors 2012, 12, 1211–1279. [Google Scholar] [CrossRef]
- Aflalo, T.N.; Graziano, M.S.A. Possible Origins of the Complex Topographic Organization of Motor Cortex: Reduction of a Multidimensional Space onto a Two-Dimensional Array. J. Neurosci. 2006, 26, 6288–6297. [Google Scholar] [CrossRef]
- Cieslik, E.C.; Zilles, K.; Grefkes, C.; Eickhoff, S.B. Dynamic Interactions in the Fronto-Parietal Network during a Manual Stimulus–Response Compatibility Task. NeuroImage 2011, 58, 860–869. [Google Scholar] [CrossRef]
- Dum, R.P.; Strick, P. Frontal Lobe Inputs to the Digit Representations of the Motor Areas on the Lateral Surface of the Hemisphere. J. Neurosci. 2005, 25, 1375–1386. [Google Scholar] [CrossRef]
- Grefkes, C.; Eickhoff, S.B.; Nowak, D.A.; Dafotakis, M.; Fink, G.R. Dynamic Intra- and Interhemispheric Interactions during Unilateral and Bilateral Hand Movements Assessed with fMRI and DCM. NeuroImage 2008, 41, 1382–1394. [Google Scholar] [CrossRef]
- Ledberg, A.; Bressler, S.L.; Ding, M.; Coppola, R.; Nakamura, R. Large-Scale Visuomotor Integration in the Cerebral Cortex. Cereb. Cortex 2007, 17, 44–62. [Google Scholar] [CrossRef]
- Luu, T.P.; Nakagome, S.; He, Y.; Contreras-Vidal, J.L. Real-Time EEG-Based Brain-Computer Interface to a Virtual Avatar Enhances Cortical Involvement in Human Treadmill Walking. Sci. Rep. 2017, 7, 8895. [Google Scholar] [CrossRef]
- Bönstrup, M.; Schulz, R.; Feldheim, J.; Hummel, F.C.; Gerloff, C. Dynamic Causal Modelling of EEG and fMRI to Characterize Network Architectures in a Simple Motor Task. NeuroImage 2016, 124, 498–508. [Google Scholar] [CrossRef]
- Herz, D.M.; Christensen, M.S.; Reck, C.; Florin, E.; Barbe, M.T.; Stahlhut, C.; Pauls, K.A.M.; Tittgemeyer, M.; Siebner, H.R.; Timmermann, L. Task-Specific Modulation of Effective Connectivity during Two Simple Unimanual Motor Tasks: A 122-Channel EEG Study. NeuroImage 2012, 59, 3187–3193. [Google Scholar] [CrossRef]
- Larsen, L.H.; Zibrandtsen, I.C.; Wienecke, T.; Kjaer, T.W.; Langberg, H.; Nielsen, J.B.; Christensen, M.S. Modulation of Task-Related Cortical Connectivity in the Acute and Subacute Phase after Stroke. Eur. J. Neurosci. 2018, 47, 1024–1032. [Google Scholar] [CrossRef]
- Nettersheim, F.S.; Loehrer, P.A.; Weber, I.; Jung, F.; Dembek, T.A.; Pelzer, E.A.; Dafsari, H.S.; Huber, C.A.; Tittgemeyer, M.; Timmermann, L. Dopamine Substitution Alters Effective Connectivity of Cortical Prefrontal, Premotor, and Motor Regions during Complex Bimanual Finger Movements in Parkinson’s Disease. NeuroImage 2019, 190, 118–132. [Google Scholar] [CrossRef]
- Ahn, M.; Ahn, S.; Hong, J.H.; Cho, H.; Kim, K.; Kim, B.S.; Chang, J.W.; Jun, S.C. Gamma Band Activity Associated with BCI Performance: Simultaneous MEG/EEG Study. Front. Hum. Neurosci. 2013, 7, 848. [Google Scholar] [CrossRef] [PubMed]
- Grosse-Wentrup, M.; Schölkopf, B.; Hill, J. Causal Influence of Gamma Oscillations on the Sensorimotor Rhythm. NeuroImage 2011, 56, 837–842. [Google Scholar] [CrossRef] [PubMed]
- Engel, A.K.; Fries, P. Beta-Band Oscillations—Signalling the Status Quo? Curr. Opin. Neurobiol. 2010, 20, 156–165. [Google Scholar] [CrossRef]
- Cebolla, A.M.; Cheron, G. Sensorimotor and Cognitive Involvement of the Beta–Gamma Oscillation in the Frontal N30 Component of Somatosensory Evoked Potentials. Neuropsychologia 2015, 79, 215–222. [Google Scholar] [CrossRef] [PubMed]
- Korik, A.; Sosnik, R.; Siddique, N.; Coyle, D. Decoding Imagined 3D Hand Movement Trajectories From EEG: Evidence to Support the Use of Mu, Beta, and Low Gamma Oscillations. Front. Neurosci. 2018, 12, 130. [Google Scholar] [CrossRef]
- de Klerk, C.C.J.M.; Johnson, M.H.; Southgate, V. An EEG Study on the Somatotopic Organisation of Sensorimotor Cortex Activation during Action Execution and Observation in Infancy. Dev. Cogn. Neurosci. 2015, 15, 1–10. [Google Scholar] [CrossRef]
- Mayka, M.A.; Corcos, D.M.; Leurgans, S.E.; Vaillancourt, D.E. Three-Dimensional Locations and Boundaries of Motor and Premotor Cortices as Defined by Functional Brain Imaging: A Meta-Analysis. NeuroImage 2006, 31, 1453–1474. [Google Scholar] [CrossRef]
- Kim, Y.K.; Park, E.; Lee, A.; Im, C.-H.; Kim, Y.-H. Changes in Network Connectivity during Motor Imagery and Execution. PLoS ONE 2018, 13, e0190715. [Google Scholar] [CrossRef]
- Rizzolatti, G.; Fogassi, L.; Gallese, V. Motor and Cognitive Functions of the Ventral Premotor Cortex. Curr. Opin. Neurobiol. 2002, 12, 149–154. [Google Scholar] [CrossRef]
- Oostenveld, R.; Praamstra, P. The Five Percent Electrode System for High-Resolution EEG and ERP Measurements. Clin. Neurophysiol. 2001, 112, 713–719. [Google Scholar] [CrossRef]
- Mohamed, A.K.; Marwala, T.; John, L.R. Single-Trial EEG Discrimination between Wrist and Finger Movement Imagery and Execution in a Sensorimotor BCI. In Proceedings of the 2011 Annual International Conference of the IEEE Engineering in Medicine and Biology Society, Boston, MA, USA, 30 August–3 September 2011; pp. 6289–6293. [Google Scholar]
- Mohamed, A.K.; John, L.R. Single-Trial EEG Discrimination between Five Hand Movement Imagery and Execution: Towards the Control of a Prosthetic/Orthotic Hand Using a Brain-Computer Interface. In Proceedings of the 2014 PRASA, RobMech and AfLaT International Joint Symposium, Cape Town, South Africa, 27–28 November 2014; pp. 25–30. [Google Scholar]
- Mohamed, A.-K.; Aharonson, V. Four-Class BCI Discrimination of Right and Left Wrist and Finger Movements. IFAC-Pap 2021, 54, 91–96. [Google Scholar] [CrossRef]
- Delorme, A.; Makeig, S. EEGLAB: An Open Source Toolbox for Analysis of Single-Trial EEG Dynamics Including Independent Component Analysis. J. Neurosci. Methods 2004, 134, 9–21. [Google Scholar] [CrossRef] [PubMed]
- Malmivuo, J.; Plonsey, R. Bioelectromagnetism. 13. Electroencephalography. In Bioelectromagnetism—Principles and Applications of Bioelectric and Biomagnetis Fields; Oxford University Press: Oxford, UK, 1995; pp. 247–264. ISBN 978-0-19-505823-9. [Google Scholar]
- Dornhege, G.; Blankertz, B.; Curio, G.; Müller, K.-R. Combining Features for BCI. In Proceedings of the Advances in Neural Information Processing Systems, Vancouver, BC, Canada, 9–14 December 2002; pp. 1115–1122. [Google Scholar]
- Gu, Y.; Dremstrup, K.; Farina, D. Single-Trial Discrimination of Type and Speed of Wrist Movements from EEG Recordings. Clin. Neurophysiol. 2009, 120, 1596–1600. [Google Scholar] [CrossRef]
- Bashashati, A.; Fatourechi, M.; Ward, R.K.; Birch, G.E. A Survey of Signal Processing Algorithms in Brain–Computer Interfaces Based on Electrical Brain Signals. J. Neural Eng. 2007, 4, R32–R57. [Google Scholar] [CrossRef] [PubMed]
- Chaumon, M.; Bishop, D.V.M.; Busch, N.A. A Practical Guide to the Selection of Independent Components of the Electroencephalogram for Artifact Correction. J. Neurosci. Methods 2015, 250, 47–63. [Google Scholar] [CrossRef]
- Niedermeyer, E.; Lopes da Silva, F.H. (Eds.) Electroencephalography: Basic Principles, Clinical Applications, and Related Fields, 5th ed.; Lippincott Williams & Wilkins: Philadelphia, PA, USA, 2005; ISBN 0-7817-5126-8. [Google Scholar]
- Yang, K.; Tong, L.; Shu, J.; Zhuang, N.; Yan, B.; Zeng, Y. High Gamma Band EEG Closely Related to Emotion: Evidence From Functional Network. Front. Hum. Neurosci. 2020, 14, 89. [Google Scholar] [CrossRef]
- Seeber, M.; Scherer, R.; Wagner, J.; Solis-Escalante, T.; Müller-Putz, G.R. High and Low Gamma EEG Oscillations in Central Sensorimotor Areas Are Conversely Modulated during the Human Gait Cycle. NeuroImage 2015, 112, 318–326. [Google Scholar] [CrossRef]
- Gull, M.A.; Elahi, H.; Marwat, M.; Waqar, S. A New Approach to Classification of Upper Limb and Wrist Movements Using EEG Signals. In Proceedings of the 2017 13th IASTED International Conference on Biomedical Engineering (BioMed), Innsbruck, Austria, 20–21 February 2017; pp. 181–194. [Google Scholar]
- Haitsma, J.; Kalker, T. A Highly Robust Audio Fingerprinting System With an Efficient Search Strategy. J. New Music Res. 2003, 32, 211–221. [Google Scholar] [CrossRef]
- Bai, O.; Lin, P.; Vorbach, S.; Li, J.; Furlani, S.; Hallett, M. Exploration of Computational Methods for Classification of Movement Intention during Human Voluntary Movement from Single Trial EEG. Clin. Neurophysiol. 2007, 118, 2637–2655. [Google Scholar] [CrossRef]
- Chatterjee, R.; Maitra, T.; Hafizul Islam, S.; Hassan, M.M.; Alamri, A.; Fortino, G. A Novel Machine Learning Based Feature Selection for Motor Imagery EEG Signal Classification in Internet of Medical Things Environment. Future Gener. Comput. Syst. 2019, 98, 419–434. [Google Scholar] [CrossRef]
- Adewuyi, A.A.; Hargrove, L.J.; Kuiken, T.A. Evaluating EMG Feature and Classifier Selection for Application to Partial-Hand Prosthesis Control. Front. Neurorobotics 2016, 10, 15. [Google Scholar] [CrossRef]
- Nielsen, F.; Boltz, S.; Schwander, O. Bhattacharyya Clustering with Applications to Mixture Simplifications. In Proceedings of the 2010 20th International Conference on Pattern Recognition, Istanbul, Turkey, 23–26 August 2010; pp. 1437–1440. [Google Scholar]
- Lotte, F.; Congedo, M.; Lécuyer, A.; Lamarche, F.; Arnaldi, B. A Review of Classification Algorithms for EEG-Based Brain–Computer Interfaces. J. Neural Eng. 2007, 4, R1–R13. [Google Scholar] [CrossRef]
- De Maesschalck, R.; Jouan-Rimbaud, D.; Massart, D.L. The Mahalanobis Distance. Chemom. Intell. Lab. Syst. 2000, 50, 1–18. [Google Scholar] [CrossRef]
- Babiloni, F.; Bianchi, L.; Semeraro, F.; del R. Millan, J.; Mourino, J.; Cattini, A.; Salinari, S.; Marciani, M.G.; Cincotti, F. Mahalanobis Distance-Based Classifiers Are Able to Recognize EEG Patterns by Using Few EEG Electrodes. In Proceedings of the 2001 Conference Proceedings of the 23rd Annual International Conference of the IEEE Engineering in Medicine and Biology Society, Istanbul, Turkey, 23–26 October 2001; Volume 1, pp. 651–654. [Google Scholar]
- Hawkins, D. Identification of Outliers; Monographs on Statistics and Applied Probability; Springer: Houten, The Netherlands, 1980; ISBN 978-94-015-3996-8. [Google Scholar]
- Chen, C.-C.; Kiebel, S.J.; Kilner, J.M.; Ward, N.S.; Stephan, K.E.; Wang, W.-J.; Friston, K.J. A Dynamic Causal Model for Evoked and Induced Responses. NeuroImage 2012, 59, 340–348. [Google Scholar] [CrossRef] [PubMed]
- Loehrer, P.A.; Nettersheim, F.S.; Jung, F.; Weber, I.; Huber, C.; Dembek, T.A.; Pelzer, E.A.; Fink, G.R.; Tittgemeyer, M.; Timmermann, L. Ageing Changes Effective Connectivity of Motor Networks during Bimanual Finger Coordination. NeuroImage 2016, 143, 325–342. [Google Scholar] [CrossRef]
- Herz, D.M.; Siebner, H.R.; Hulme, O.J.; Florin, E.; Christensen, M.S.; Timmermann, L. Levodopa Reinstates Connectivity from Prefrontal to Premotor Cortex during Externally Paced Movement in Parkinson’s Disease. NeuroImage 2014, 90, 15–23. [Google Scholar] [CrossRef]
- Shallice, T. The Fractionation of Supervisory Control. In The cognitive Neurosciences, 3rd ed.; Boston Review: Cambridge, MA, USA, 2004; pp. 943–956. ISBN 978-0-262-07254-0. [Google Scholar]
- Degirmenci, M.; Yuce, Y.K.; Perc, M.; Isler, Y. Statistically Significant Features Improve Binary and Multiple Motor Imagery Task Predictions from EEGs. Front. Hum. Neurosci. 2023, 17, 1223307. [Google Scholar] [CrossRef]
- Hu, L.; Gao, W.; Lu, Z.; Shan, C.; Ma, H.; Zhang, W.; Li, Y. Subject-Independent Wearable P300 Brain–Computer Interface Based on Convolutional Neural Network and Metric Learning. IEEE Trans. Neural Syst. Rehabil. Eng. 2024, 32, 3543–3553. [Google Scholar] [CrossRef]
- Lotte, F.; Bougrain, L.; Cichocki, A.; Clerc, M.; Congedo, M.; Rakotomamonjy, A.; Yger, F. A Review of Classification Algorithms for EEG-Based Brain–Computer Interfaces: A 10 Year Update. J. Neural Eng. 2018, 15, 031005. [Google Scholar] [CrossRef]
- Nguyen, V.T.; Breakspear, M.; Cunnington, R. Reciprocal Interactions of the SMA and Cingulate Cortex Sustain Premovement Activity for Voluntary Actions. J. Neurosci. 2014, 34, 16397–16407. [Google Scholar] [CrossRef]
- Mu, W.; Wang, J.; Wang, L.; Wang, P.; Han, J.; Niu, L.; Bin, J.; Liu, L.; Zhang, J.; Jia, J.; et al. A Channel Selection Method for Motor Imagery EEG Based on Fisher Score of OVR-CSP. In Proceedings of the 2023 11th International Winter Conference on Brain-Computer Interface (BCI), Gangwon, Republic of Korea, 20 February 2023; IEEE: Piscataway, NJ, USA, 2023; pp. 1–4. [Google Scholar]

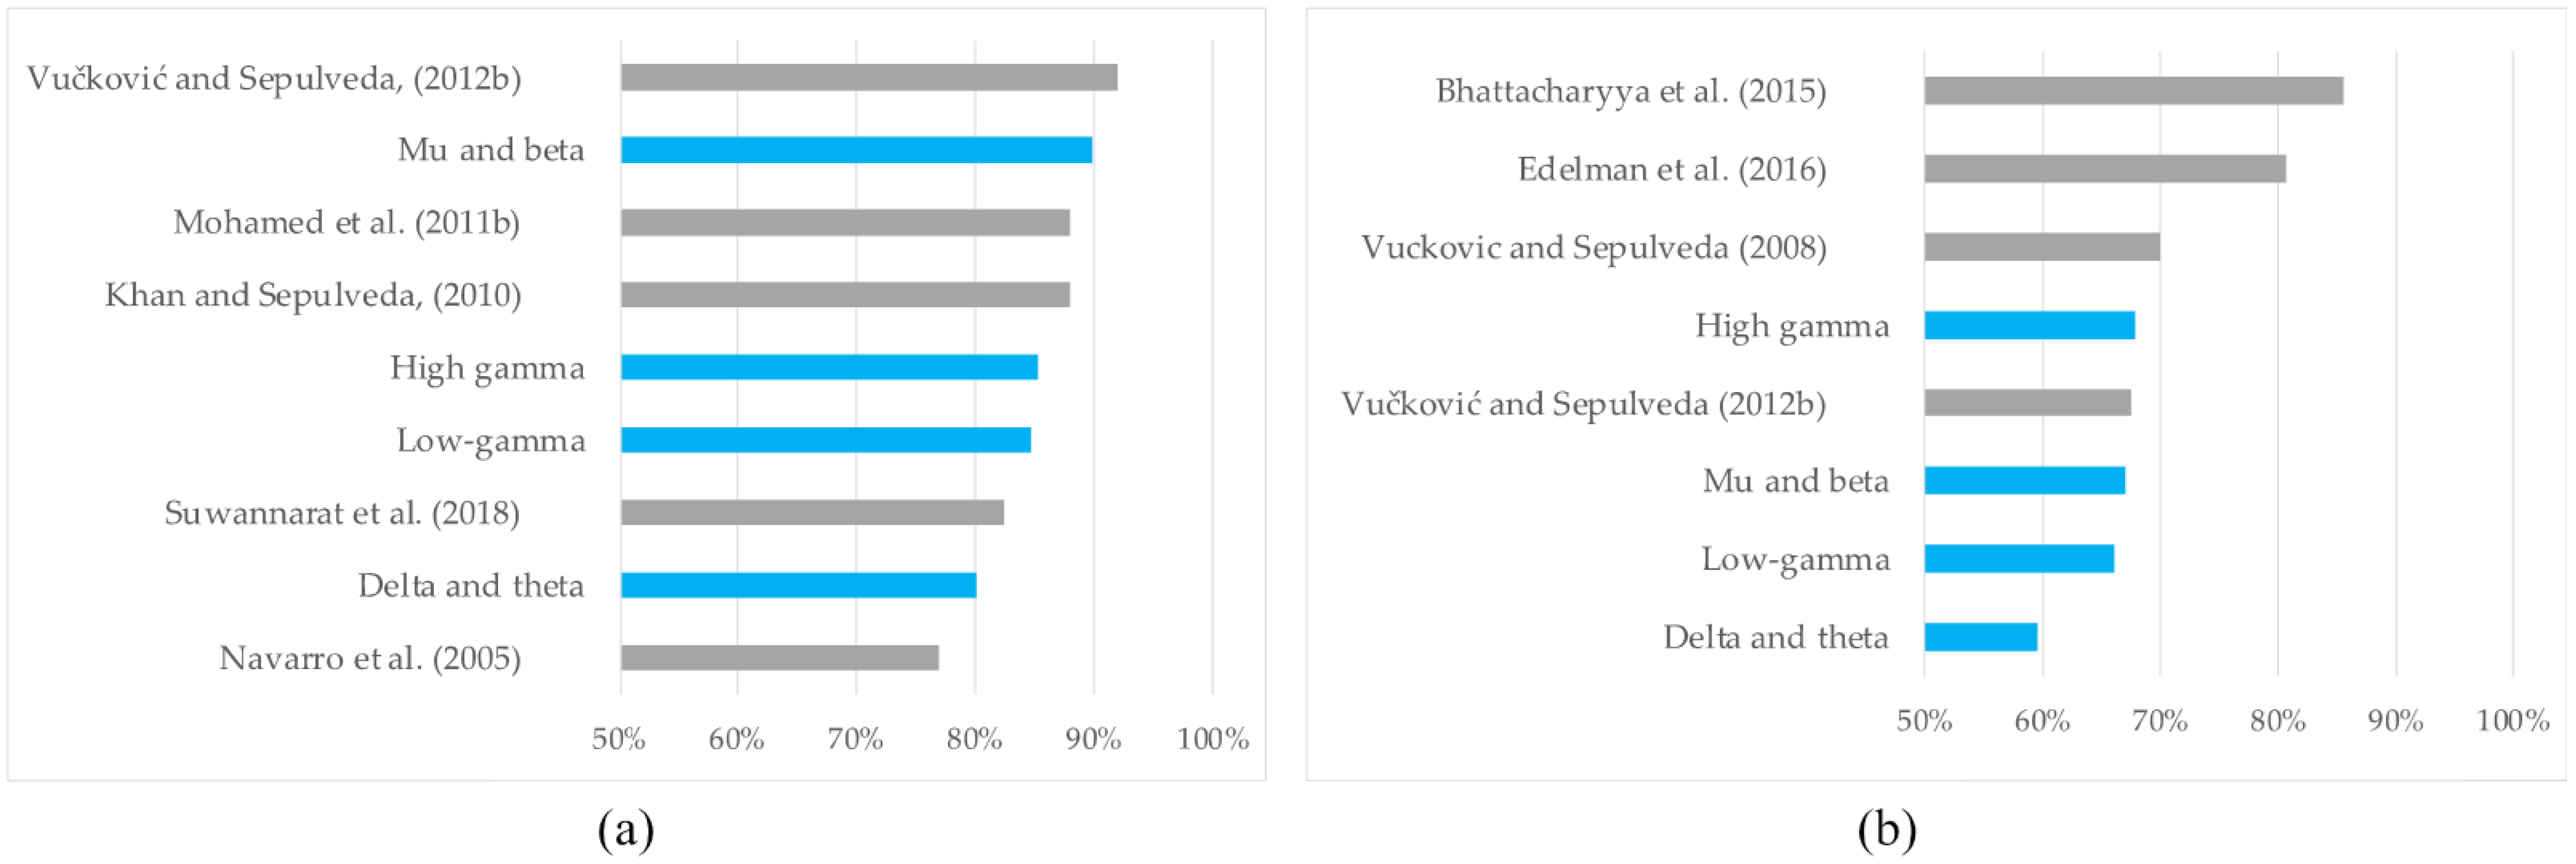
| Type of Wrist Motor Tasks Classified | Classification Accuracy | Prominent Frequencies | Reference |
|---|---|---|---|
| RH vs. LH groupings of WE, WF, WS, and WP; real and imagined movements | 77% mean across participants using independent component analysis | Theta, mu, and beta | [18] |
| RH vs. LH WE; imagined movements RH vs. LH WF; imagined movements | 88% mean across participants | Low gamma (<50 Hz) | [19] |
| RH vs. LH groupings of WE and WF; imagined movements | 83% mean across participants | Mu and beta | [13] |
| RH vs. LH groupings of WE and WF; imagined movements | 92% mean across participants | Mu and beta | [20] |
| RH vs. LH groupings of WE, WF, FF, FE, and TR; real and imagined movements | 88% mean across participants | Mu and beta | [21] |
| Unilateral WE vs. WF; real and imagined movements | 70% and 80% means across participants (real and imagined, respectively) | Delta | [17] |
| Unilateral WE vs. WF; imagined movements | 67.5% mean across participants | Delta, low gamma, and high gamma (>60 Hz) | [20] |
| Unilateral WE vs. WF; imagined movements | 85.48% mean across participants | Mu and beta | [22] |
| Unilateral WE vs. WF vs. WS vs. WS; RH imagined movements | 80.6% mean considering only WE and WF classes | Mu and beta | [23] |
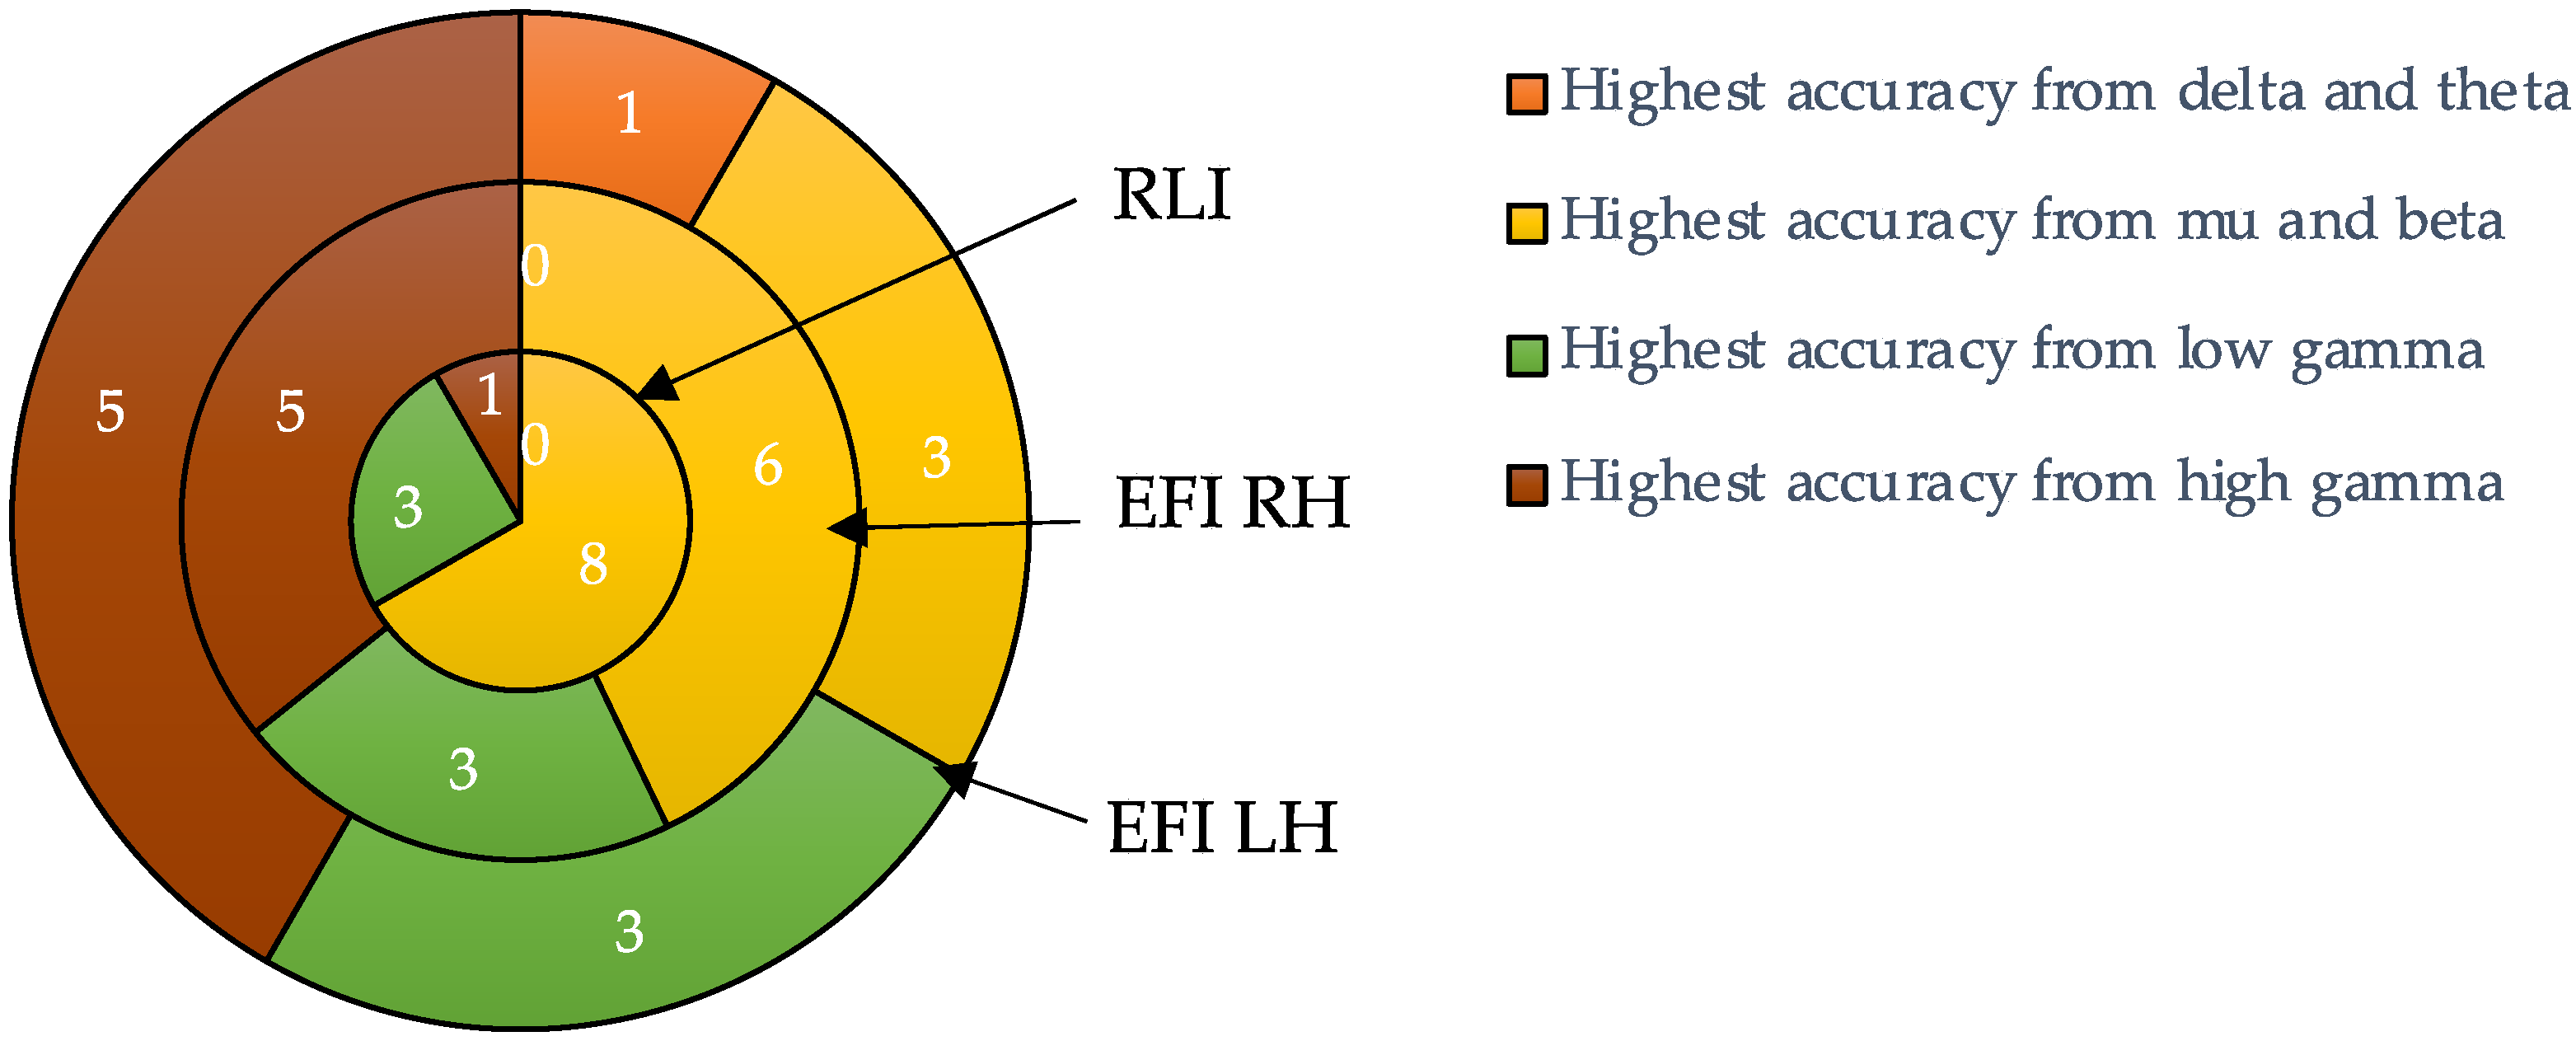
| Participant Number | Delta and Theta (1–7 Hz) | Mu and Beta (8–35 Hz) | Low Gamma (36–49 Hz) | High Gamma (51–90 Hz) | Maximum of All Bands |
|---|---|---|---|---|---|
| 1 | 74.53 | 90.00 | 89.22 | 90.00 | 90.00 |
| 2 | 65.84 | 81.36 | 80.34 | 70.54 | 81.36 |
| 3 | 80.60 | 91.88 | 88.02 | 89.32 | 91.88 |
| 4 | 81.60 | 85.32 | 87.56 | 85.13 | 87.56 |
| 5 | 83.35 | 91.04 | 92.41 | 88.26 | 92.41 |
| 6 | 79.47 | 94.44 | 83.88 | 84.06 | 94.44 |
| 7 | 78.93 | 99.74 | 92.30 | 94.16 | 99.74 |
| 8 | 82.04 | 87.79 | 77.48 | 80.18 | 87.79 |
| 9 | 87.91 | 99.44 | 87.76 | 91.75 | 99.44 |
| 10 | 81.09 | 87.25 | 83.57 | 78.17 | 87.25 |
| 11 | 78.57 | 78.66 | 82.69 | 78.38 | 82.69 |
| 12 | 87.68 | 91.65 | 71.83 | 93.64 | 93.64 |
| Mean (SD) | 80.13 (5.84) | 89.88 (6.39) | 84.76 (6.10) | 85.30 (7.27) | 90.68 (5.78) |
| Participant Number | Delta and Theta (1–7 Hz) | Mu and Beta (8–35 Hz) | Low Gamma (36–49 Hz) | High Gamma (51–90 Hz) | Maximum of All Bands | |||||
|---|---|---|---|---|---|---|---|---|---|---|
| RH | LH | RH | LH | RH | LH | RH | LH | RH | LH | |
| 1 | 55.50 | 63.45 | 62.03 | 65.08 | 62.07 | 65.52 | 66.67 | 63.21 | 66.67 | 65.52 |
| 2 | 55.88 | 56.71 | 66.55 | 61.38 | 66.03 | 61.38 | 68.93 | 66.61 | 68.93 | 66.61 |
| 3 | 59.38 | 58.06 | 78.35 | 65.33 | 72.91 | 67.97 | 78.14 | 65.83 | 78.35 | 67.97 |
| 4 | 59.62 | 74.50 | 76.12 | 79.80 | 74.91 | 75.67 | 74.85 | 78.41 | 76.12 | 79.80 |
| 5 | 57.58 | 56.59 | 58.02 | 57.64 | 63.00 | 58.79 | 60.15 | 62.82 | 63.00 | 62.82 |
| 6 | 55.58 | 56.25 | 59.46 | 57.67 | 63.67 | 62.02 | 62.48 | 62.91 | 63.67 | 62.91 |
| 7 | 62.61 | 67.03 | 79.27 | 69.44 | 80.15 | 67.48 | 76.38 | 68.93 | 80.15 | 69.44 |
| 8 | 56.93 | 56.20 | 71.00 | 74.05 | 67.27 | 70.16 | 69.47 | 71.79 | 71.00 | 74.05 |
| 9 | 57.04 | 56.21 | 58.00 | 61.76 | 59.56 | 62.48 | 60.40 | 71.05 | 60.40 | 71.05 |
| 10 | 56.31 | 57.96 | 74.29 | 62.31 | 62.50 | 64.12 | 67.25 | 59.05 | 74.29 | 64.12 |
| 11 | 56.90 | 75.41 | 55.38 | 68.83 | 58.52 | 63.65 | 60.19 | 66.86 | 60.19 | 75.41 |
| 12 | 55.90 | 57.20 | 68.31 | 73.11 | 64.59 | 72.72 | 65.10 | 76.00 | 68.31 | 76.00 |
| 13 | 61.64 | N/A | 71.80 | N/A | 66.67 | N/A | 64.14 | N/A | 71.80 | N/A |
| 14 | 58.26 | N/A | 67.39 | N/A | 65.64 | N/A | 76.59 | N/A | 76.59 | N/A |
| Mean (SD) | 57.79 (2.25) | 61.30 (7.20) | 67.57 (7.99) | 66.37 (6.86) | 66.25 (6.01) | 66.00 (4.98) | 67.91 (6.40) | 67.79 (5.72) | 69.96 (6.61) | 69.64 (5.64) |
| Mean (SD) | 59.55 (5.35) | 66.79 (7.37) | 66.12 (6.01) | 67.85 (5.98) | 69.80 (6.06) | |||||
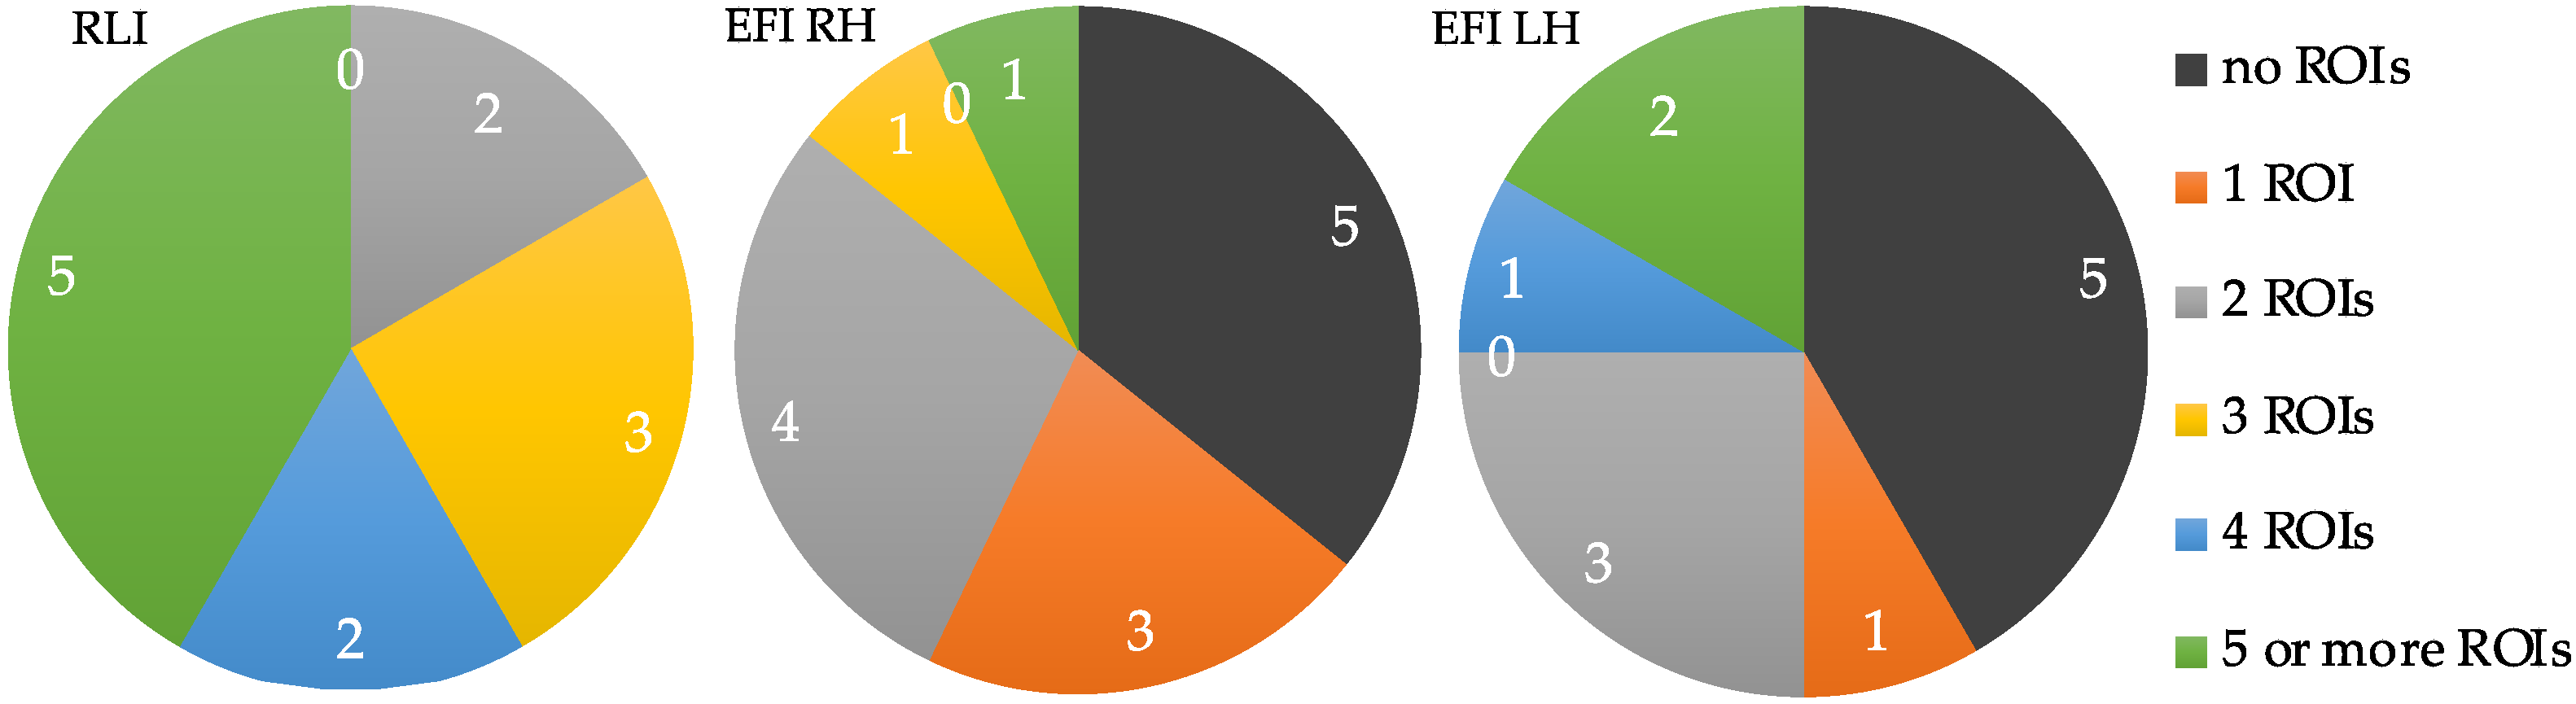
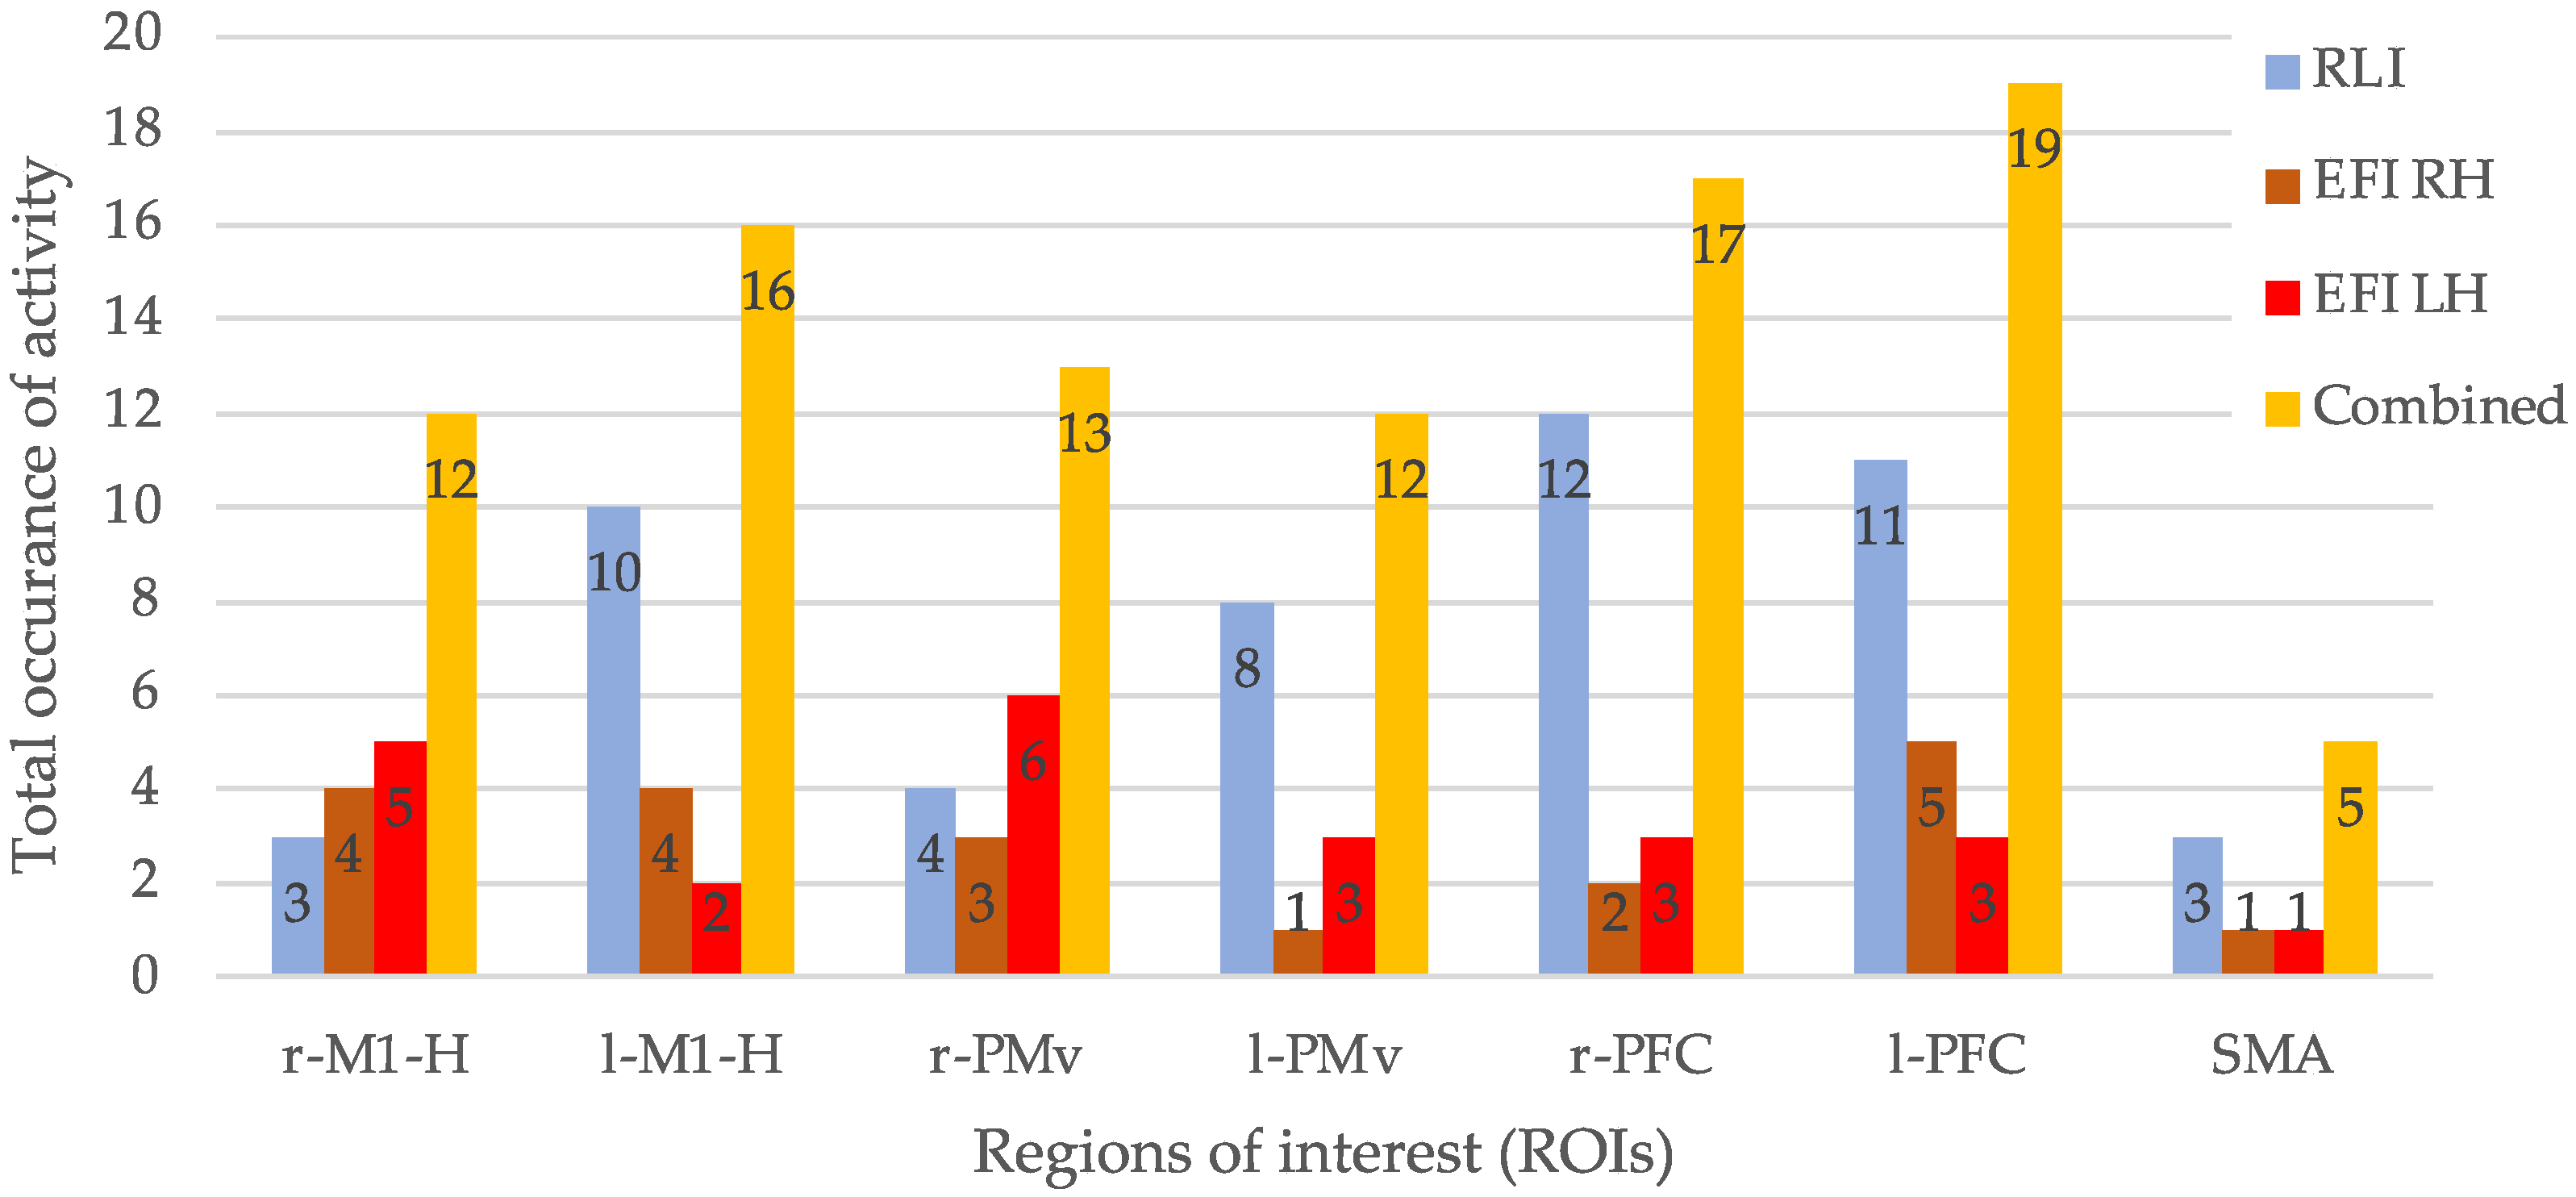
| P | r-M1-H | l-M1-H | r-PMv | l-PMv | r-PFC | l-PFC | SMA | T1 |
|---|---|---|---|---|---|---|---|---|
| 1 | x | x | 2 | |||||
| 2 | x | x | 2 | |||||
| 3 | x | x | x | 3 | ||||
| 4 | x | x | x | 3 | ||||
| 5 | x | x | x | x | x | 5 | ||
| 6 | x | x | x | x | 4 | |||
| 7 | x | x | x | 3 | ||||
| 8 | x | x | x | x | x | x | 6 | |
| 9 | x | x | x | x | x | x | x | 7 |
| 10 | x | x | x | x | 4 | |||
| 11 | x | x | x | x | x | 5 | ||
| 12 | x | x | x | x | x | x | x | 7 |
| T2 | 3 | 10 | 4 | 8 | 12 | 11 | 3 | 51 |
| P | r-M1-H | l-M1-H | r-PMv | l-PMv | r-PFC | l-PFC | SMA | T1 | ||||||||
|---|---|---|---|---|---|---|---|---|---|---|---|---|---|---|---|---|
| Hand | RH | LH | RH | LH | RH | LH | RH | LH | RH | LH | RH | LH | RH | LH | RH | LH |
| 1 | 0 | 0 | ||||||||||||||
| 2 | x | x | 2 | 0 | ||||||||||||
| 3 | x | x | x | x | x | x | x | 6 | 1 | |||||||
| 4 | x | x | x | x | x | x | x | x | x | 3 | 6 | |||||
| 5 | 0 | 0 | ||||||||||||||
| 6 | 0 | 0 | ||||||||||||||
| 7 | x | x | x | 1 | 2 | |||||||||||
| 8 | x | x | x | x | x | x | 2 | 4 | ||||||||
| 9 | x | x | 0 | 2 | ||||||||||||
| 10 | x | 1 | 0 | |||||||||||||
| 11 | x | x | x | x | x | x | 0 | 6 | ||||||||
| 12 | x | x | x | 1 | 2 | |||||||||||
| 13 | N/A | N/A | N/A | N/A | x | N/A | x | N/A | N/A | 2 | 0 | |||||
| 14 | N/A | x | N/A | N/A | N/A | N/A | x | N/A | N/A | 2 | 0 | |||||
| T2 | 4 | 5 | 4 | 2 | 3 | 6 | 1 | 3 | 2 | 3 | 5 | 3 | 1 | 1 | 20 | 23 |
Disclaimer/Publisher’s Note: The statements, opinions and data contained in all publications are solely those of the individual author(s) and contributor(s) and not of MDPI and/or the editor(s). MDPI and/or the editor(s) disclaim responsibility for any injury to people or property resulting from any ideas, methods, instructions or products referred to in the content. |
© 2025 by the authors. Licensee MDPI, Basel, Switzerland. This article is an open access article distributed under the terms and conditions of the Creative Commons Attribution (CC BY) license (https://creativecommons.org/licenses/by/4.0/).
Share and Cite
Mohamed, A.-K.; Aharonson, V. Single-Trial Electroencephalography Discrimination of Real, Regulated, Isometric Wrist Extension and Wrist Flexion. Biomimetics 2025, 10, 187. https://doi.org/10.3390/biomimetics10030187
Mohamed A-K, Aharonson V. Single-Trial Electroencephalography Discrimination of Real, Regulated, Isometric Wrist Extension and Wrist Flexion. Biomimetics. 2025; 10(3):187. https://doi.org/10.3390/biomimetics10030187
Chicago/Turabian StyleMohamed, Abdul-Khaaliq, and Vered Aharonson. 2025. "Single-Trial Electroencephalography Discrimination of Real, Regulated, Isometric Wrist Extension and Wrist Flexion" Biomimetics 10, no. 3: 187. https://doi.org/10.3390/biomimetics10030187
APA StyleMohamed, A.-K., & Aharonson, V. (2025). Single-Trial Electroencephalography Discrimination of Real, Regulated, Isometric Wrist Extension and Wrist Flexion. Biomimetics, 10(3), 187. https://doi.org/10.3390/biomimetics10030187