

Biocompatible Copolymerized Gold Nanoclusters: Anti-TNF-α siRNA Binding, Cellular Uptake, Cytotoxicity, Oxidative Stress and Cell Cycle Effects In Vitro


Abstract
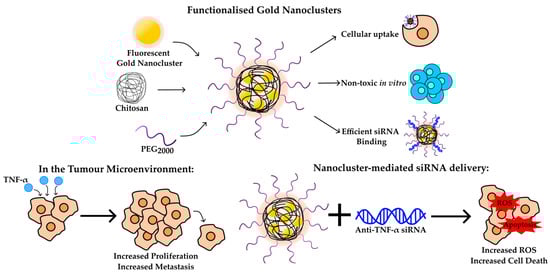
1. Introduction
2. Materials and Methods
2.1. Materials
2.2. Synthesis, Functionalisation of AuNCs and Nanocomplex Formulation
2.2.1. Synthesis of AuNCs
2.2.2. Functionalisation of AuNC
2.2.3. Preparation of Nanocomplexes
2.3. Characterisation of Nanoclusters and Nanocomplexes
2.4. Binding Studies
2.4.1. Band Shift Assay
2.4.2. Ethidium Bromide (EB) Intercalation Assay
2.4.3. Nuclease Protection Assay
2.5. Cell Viability Studies
2.5.1. Cytotoxicity Assay
2.5.2. Apoptosis Studies
2.6. Cellular Uptake
2.7. Flow Cytometry Studies
2.7.1. Caspase 3/7 Analysis
2.7.2. Cell Cycle Analysis
2.7.3. Oxidative Stress Analysis
2.8. Statistical Analysis
3. Results and Discussion
3.1. Characterisation
3.1.1. Optical Characterisation
3.1.2. FTIR
3.1.3. Sizing and Zeta Potential
3.2. Binding Studies
3.2.1. Band Shift Assay
3.2.2. EB Intercalation Assay
3.2.3. Nuclease Protection Assay
3.3. Cytotoxicity Studies
3.3.1. MTT Cytotoxicity Assay
3.3.2. Apoptosis Studies
3.4. Cellular Uptake
3.5. Flow Cytometry Studies
3.5.1. Caspase 3/7 Activity
3.5.2. Cell Cycle Analysis
3.5.3. Oxidative Stress
4. Conclusions
Author Contributions
Funding
Institutional Review Board Statement
Informed Consent Statement
Data Availability Statement
Conflicts of Interest
Abbreviations
| AO | Acridine orange |
| AuNC | Gold nanoclusters |
| CS | Chitosan |
| EB | Ethidium bromide |
| FAuNC | Functionalised gold nanoclusters |
| FTIR | Fourier-transform infrared spectroscopy |
| NTA | Nanoparticle tracking analysis |
| PEG | Polyethylene glycol |
| RNAi | RNA interference |
| ROS | Reactive oxygen species |
| siRNA | Small interfering RNA |
| TEM | Transmission electron microscopy |
| TNBC | Triple-negative breast cancer |
| TNF-α | Tumour necrosis factor α |
| UV-Vis | Ultraviolet–visible spectroscopy |
References
- Koo, J.; Palli, S.R. Recent Advances in Understanding of the Mechanisms of RNA Interference in Insects. Insect Mol. Biol. 2025, 34, 491–504. [Google Scholar] [CrossRef] [PubMed]
- Hung, Y.; Slotkin, R. The Initiation of RNA Interference (RNAi) in Plants. Curr. Opin. Plant Biol. 2021, 61, 102014. [Google Scholar] [CrossRef] [PubMed]
- Friedrich, M.; Aigner, A. Therapeutic siRNA: State-of-the-Art and Future Perspectives. Biodrugs 2022, 36, 549–571. [Google Scholar] [CrossRef]
- Babu, A.; Muralidharan, R.; Amreddy, N.; Mehta, M.; Munshi, A.; Ramesh, R. Nanoparticles for SiRNA-Based Gene Silencing in Tumor Therapy. IEEE Trans. Nanobiosci. 2016, 15, 849–863. [Google Scholar] [CrossRef]
- Kaur, N.; Aditya, R.N.; Singh, A.; Kuo, T.R. Biomedical Applications for Gold Nanoclusters: Recent Developments and Future Perspectives. Nanoscale Res. Lett. 2018, 13, 302. [Google Scholar] [CrossRef]
- Li, D.; Chen, Z.; Mei, X. Fluorescence Enhancement for Noble Metal Nanoclusters. Adv. Colloid Interface Sci. 2017, 250, 25–39. [Google Scholar] [CrossRef]
- Yang, T.-Q.; Peng, B.; Shan, B.-Q.; Zong, Y.-X.; Jiang, J.-G.; Wu, P.; Zhang, K. Origin of the Photoluminescence of Metal Nanoclusters: From Metal-Centered Emission to Ligand-Centered Emission. Nanomaterials 2020, 10, 261. [Google Scholar] [CrossRef] [PubMed]
- Gao, Z.; Hao, Y.; Zheng, M.; Chen, Y. A Fluorescent Dye with Large Stokes Shift and High Stability: Synthesis and Application to Live Cell Imaging. RSC Adv. 2017, 7, 7604–7609. [Google Scholar] [CrossRef]
- Wang, Y.; Wang, X.; Ma, X.; Chen, Q.; He, H.; Nau, W.M.; Huang, F. Coassembly of Gold Nanoclusters with Nucleic Acids: Sensing, Bioimaging, and Gene Transfection. Part. Part. Syst. Charact. 2019, 36, 1900281. [Google Scholar] [CrossRef]
- Lei, Y.; Tang, L.; Xie, Y.; Xianyu, Y.; Zhang, L.; Wang, P.; Hamada, Y.; Jiang, K.; Zheng, W.; Jiang, X. Gold Nanoclusters-Assisted Delivery of NGF SiRNA for Effective Treatment of Pancreatic Cancer. Nat. Commun. 2017, 8, 15130. [Google Scholar] [CrossRef]
- Tao, Y.; Li, Z.; Ju, E.; Ren, J.; Qu, X. Polycations-Functionalized Water-Soluble Gold Nanoclusters: A Potential Platform for Simultaneous Enhanced Gene Delivery and Cell Imaging. Nanoscale 2013, 5, 6154–6160. [Google Scholar] [CrossRef]
- Sun, Y.; Wang, D.; Zhao, Y.; Zhao, T.; Sun, H.; Li, X.; Wang, C.; Yang, B.; Lin, Q. Polycation-Functionalized Gold Nanodots with Tunable near-Infrared Fluorescence for Simultaneous Gene Delivery and Cell Imaging. Nano Res. 2018, 11, 2392–2404. [Google Scholar] [CrossRef]
- Li, W.; Liu, Q.; Shi, J.; Xu, X.; Xu, J. The Role of TNF-α in the Fate Regulation and Functional Reprogramming of Mesenchymal Stem Cells in an Inflammatory Microenvironment. Front. Immunol. 2023, 14, 1074863. [Google Scholar] [CrossRef] [PubMed]
- Montfort, A.; Colacios, C.; Levade, T.; Andrieu-Abadie, N.; Meyer, N.; Ségui, B. The TNF Paradox in Cancer Progression and Immunotherapy. Front. Immunol. 2019, 10, 1818. [Google Scholar] [CrossRef] [PubMed]
- Carswell, E.A.; Old, L.J.; Kassel, R.L.; Green, S.; Fiore, N.; Williamson, B. An Endotoxin Induced Serum Factor That Cuases Necrosis of Tumors. Proc. Natl. Acad. Sci. USA 1975, 72, 3666–3670. [Google Scholar] [CrossRef]
- Cruceriu, D.; Baldasici, O.; Balacescu, O.; Berindan-Neagoe, I. The Dual Role of Tumor Necrosis Factor-Alpha (TNF-α) in Breast Cancer: Molecular Insights and Therapeutic Approaches. Cell. Oncol. 2020, 43, 1–18. [Google Scholar] [CrossRef]
- Mercogliano, M.F.; Bruni, S.; Elizalde, P.V.; Schillaci, R. Tumor Necrosis Factor α Blockade: An Opportunity to Tackle Breast Cancer. Front. Oncol. 2020, 10, 584. [Google Scholar] [CrossRef]
- Rai, S.R.; Bhattacharyya, C.; Sarkar, A.; Chakraborty, S.; Sircar, E.; Dutta, S.; Sengupta, R. Glutathione: Role in Oxidative/Nitrosative Stress, Antioxidant Defense, and Treatments. ChemistrySelect 2021, 18, 4566–4590. [Google Scholar] [CrossRef]
- Zhang, Z.; Zhang, L.; Li, C.; Xie, X.; Li, G.; Hu, Z.; Li, S. Research Progress of Chitosan-Based Biomimetic Materials. Mar. Drugs 2021, 19, 372. [Google Scholar] [CrossRef]
- Dong, L.; Li, Y.; Cong, H.; Yu, B.; Shen, Y. A Review of Chitosan in Gene Therapy: Developments and Challenges. Carbohydr. Polym. 2024, 324, 121562. [Google Scholar] [CrossRef]
- Shi, L.; Zhang, J.; Zhao, M.; Tang, S.; Cheng, X.; Zhang, W.; Li, W.; Liu, X.; Peng, H.; Wang, Q. Effects of Polyethylene Glycol on the Surface of Nanoparticles for Targeted Drug Delivery. Nanoscale 2021, 13, 10748–10764. [Google Scholar] [CrossRef]
- Zhu, J. Bioactive modification of poly(ethylene glycol) hydrogels for tissue engineering. Biomaterials 2010, 31, 4639–4656. [Google Scholar] [CrossRef]
- Ramnandan, D.; Mokhosi, S.; Daniels, A.; Singh, M. Chitosan, Polyethylene glycol and Polyvinyl alcohol modified MgFe2O4 ferrite magnetic nanoparticles in Doxorubicin delivery: A comparative study in vitro. Molecules 2021, 26, 3893. [Google Scholar] [CrossRef]
- Luo, Z.; Yuan, X.; Yu, Y.; Zhang, Q.; Leong, D.T.; Lee, J.Y.; Xie, J. From Aggregation-Induced Emission of Au(I)–Thiolate Complexes to Ultrabright Au(0)@Au(I)–Thiolate Core–Shell Nanoclusters. J. Am. Chem. Soc. 2012, 134, 16662–16670. [Google Scholar] [CrossRef] [PubMed]
- Goswami, N.; Lin, F.; Liu, Y.; Leong, D.T.; Xie, J. Highly Luminescent Thiolated Gold Nanoclusters Impregnated in Nanogel. Chem. Mater. 2016, 28, 4009–4016. [Google Scholar] [CrossRef]
- Singh, M. Assessing nucleic acid: Cationic nanoparticle interaction for gene delivery. In Bio-Carrier Vectors; Narayanan, K., Ed.; Springer: New York, NY, USA, 2021; Volume 2211, pp. 43–55. [Google Scholar]
- Maiyo, F.; Moodley, R.; Singh, M. Cytotoxicity, antioxidant and apoptosis studies of Quercetin-3-O-glucoside and 4-(β-D-Glucopyranosyl-1→4-α-L-Rhamnopyranosyloxy)-benzyl isothiocyanate from Moringa oleifera. Anti-Cancer Agents Med. Chem. 2015, 16, 648–656. [Google Scholar] [CrossRef]
- McKinnon, K.M. Flow Cytometry: An Overview. Curr. Protoc. Immunol. 2018, 120, 5.1.1–5.1.11. [Google Scholar] [CrossRef] [PubMed]
- Pyo, K.; Thanthirige, V.D.; Kwak, K.; Pandurangan, P.; Ramakrishna, G.; Lee, D. Ultrabright Luminescence from Gold Nanoclusters: Rigidifying the Au(I)-Thiolate Shell. J. Am. Chem. Soc. 2015, 137, 8244–8250. [Google Scholar] [CrossRef]
- Chen, W.; Tu, X.; Guo, X. Fluorescent Gold Nanoparticles-Based Fluorescence Sensor for Cu2+ Ions. Chem. Commun. 2009, 13, 1736–1738. [Google Scholar] [CrossRef]
- Xia, J.; Wang, X.; Zhu, S.; Liu, L.; Li, L. Gold Nanocluster-Decorated Nanocomposites with Enhanced Emission and Reactive Oxygen Species Generation. ACS Appl. Mater. Interfaces 2019, 11, 7369–7378. [Google Scholar] [CrossRef]
- Ju, E.; Li, T.; Ramos Da Silva, S.; Gao, S.J. Gold Nanocluster-Mediated Efficient Delivery of Cas9 Protein through PH-Induced Assembly-Disassembly for Inactivation of Virus Oncogenes. ACS Appl. Mater. Interfaces 2019, 11, 34717–34724. [Google Scholar] [CrossRef]
- Li, Q.; Pan, Y.; Chen, T.; Du, Y.; Ge, H.; Zhang, B.; Xie, J.; Yu, H.; Zhu, M. Design and Mechanistic Study of a Novel Gold Nanocluster-Based Drug Delivery System. Nanoscale 2018, 10, 10166–10172. [Google Scholar] [CrossRef] [PubMed]
- Zhang, X.D.; Wu, D.; Shen, X.; Liu, P.X.; Fan, F.Y.; Fan, S.J. In Vivo Renal Clearance, Biodistribution, Toxicity of Gold Nanoclusters. Biomaterials 2012, 33, 4628–4638. [Google Scholar] [CrossRef] [PubMed]
- Wang, J.; Wang, Z.Y.; Li, S.J.; Zang, S.Q.; Mak, T.C.W. Carboranealkynyl-Protected Gold Nanoclusters: Size Conversion and UV/Vis–NIR Optical Properties. Angew. Chem. Int. Ed. 2021, 60, 5959–5964. [Google Scholar] [CrossRef]
- Liang, H.F.; Smith, C.T.G.; Mills, C.A.; Silva, S.R.P. The Band Structure of Graphene Oxide Examined Using Photoluminescence Spectroscopy. J. Mater. Chem. C Mater. 2015, 3, 12484–12491. [Google Scholar] [CrossRef]
- Mourdikoudis, S.; Pallares, R.M.; Thanh, N.T.K. Characterization Techniques for Nanoparticles: Comparison and Complementarity upon Studying Nanoparticle Properties. Nanoscale 2018, 10, 12871–12934. [Google Scholar] [CrossRef] [PubMed]
- Zhao, R.-X.; Liu, A.Y.; Wen, Q.L.; Wu, B.C.; Wang, J.; Hu, Y.L.; Pu, Z.F.; Ling, J.; Cao, Q. Glutathione Stabilized Green-Emission Gold Nanoclusters for Selective Detection of Cobalt Ion. Spectrochim. Acta A Mol. Biomol. Spectrosc. 2021, 254, 119628. [Google Scholar] [CrossRef]
- Negishi, Y.; Nobusada, K.; Tsukuda, T. Glutathione-Protected Gold Clusters Revisited: Bridging the Gap between Gold(I)-Thiolate Complexes and Thiolate-Protected Gold Nanocrystals. J. Am. Chem. Soc. 2005, 127, 5261–5270. [Google Scholar] [CrossRef]
- Farrag, M.; Mohamed, R.A. Ecotoxicity of ∼1 Nm Silver and Palladium Nanoclusters Protected by L-Glutathione on the Microbial Growth under Light and Dark Conditions. J. Photochem. Photobiol. A Chem. 2016, 330, 117–125. [Google Scholar] [CrossRef]
- Parveen, S.; Sahoo, S.K. Long Circulating Chitosan/PEG Blended PLGA Nanoparticle for Tumor Drug Delivery. Eur. J. Pharmacol. 2011, 670, 372–383. [Google Scholar] [CrossRef]
- Queiroz, M.F.; Melo, K.; Sabry, D.; Sassaki, G.; Rocha, H. Does the Use of Chitosan Contribute to Oxalate Kidney Stone Formation? Mar. Drugs 2014, 13, 141–158. [Google Scholar] [CrossRef]
- Liu, H.; Zhao, Y.; Cheng, S.; Huang, N.; Leng, Y. Syntheses of Novel Chitosan Derivative with Excellent Solubility, Anticoagulation, and Antibacterial Property by Chemical Modification. J. Appl. Polym. Sci. 2012, 124, 2641–2648. [Google Scholar] [CrossRef]
- Zhang, C.; Li, C.; Liu, Y.; Zhang, J.; Bao, C.; Liang, S.; Wang, Q.; Yang, Y.; Fu, H.; Wang, K.; et al. Gold Nanoclusters-Based Nanoprobes for Simultaneous Fluorescence Imaging and Targeted Photodynamic Therapy with Superior Penetration and Retention Behavior in Tumors. Adv. Funct. Mater. 2015, 25, 1314–1325. [Google Scholar] [CrossRef]
- Yang, C.; Gao, S.; Dagnæs-Hansen, F.; Jakobsen, M.; Kjems, J. Impact of PEG Chain Length on the Physical Properties and Bioactivity of PEGylated Chitosan/SiRNA Nanoparticles in Vitro and in Vivo. ACS Appl. Mater. Interfaces 2017, 9, 12203–12216. [Google Scholar] [CrossRef]
- Jin, R. Quantum Sized, Thiolate-Protected Gold Nanoclusters. Nanoscale 2010, 2, 343–362. [Google Scholar] [CrossRef] [PubMed]
- Yahia-Ammar, A.; Sierra, D.; Mérola, F.; Hildebrandt, N.; Le Guével, X. Self-Assembled Gold Nanoclusters for Bright Fluorescence Imaging and Enhanced Drug Delivery. ACS Nano 2016, 10, 2591–2599. [Google Scholar] [CrossRef] [PubMed]
- Liu, J.; Liu, L.; Li, S.; Kang, Q.; Zhang, R.; Zhu, Z. Self-Assembled Nanogels of Luminescent Thiolated Silver Nanoclusters and Chitosan as Bactericidal Agent and Bacterial Sensor. Mater. Sci. Eng. C 2021, 118, 111520. [Google Scholar] [CrossRef]
- Zhu, J.; He, K.; Dai, Z.; Gong, L.; Zhou, T.; Liang, H.; Liu, J. Self-Assembly of Luminescent Gold Nanoparticles with Sensitive PH-Stimulated Structure Transformation and Emission Response toward Lysosome Escape and Intracellular Imaging. Anal. Chem. 2019, 91, 8237–8243. [Google Scholar] [CrossRef]
- Gounden, V.; Singh, M. Gold Nanoparticle-Based Hydrogel: Application in Anticancer Drug Delivery and Wound Healing In Vitro. Pharmaceutics 2025, 17, 633. [Google Scholar] [CrossRef]
- Ahmadi, F.; Oveisi, Z.; Samani, S.M.; Amoozgar, Z. Chitosan Based Hydrogels: Characteristics and Pharmaceutical Applications. Res. Pharm. Sci. 2015, 10, 1–16. [Google Scholar] [PubMed]
- Radnia, F.; Mohajeri, N.; Hashemi, F.; Imani, M.; Zarghami, N. Design and Development of Folate-Chitosan/CD Nanogel: An Efficient Fluorescent Platform for Cancer-Specific Delivery of AntimiR-21. React. Funct. Polym. 2021, 160, 104814. [Google Scholar] [CrossRef]
- Guaresti, O.; Maiz–Fernández, S.; Palomares, T.; Alonso–Varona, A.; Eceiza, A.; Pérez–Álvarez, L.; Gabilondo, N. Dual Charged Folate Labelled Chitosan Nanogels with Enhanced Mucoadhesion Capacity for Targeted Drug Delivery. Eur. Polym. J. 2020, 134, 109847. [Google Scholar] [CrossRef]
- Kumar, A.; Chowdhuri, A.R.; Laha, D.; Chandra, S.; Karmakar, P.; Sahu, S.K. One-Pot Synthesis of Carbon Dot-Entrenched Chitosan-Modified Magnetic Nanoparticles for Fluorescence-Based Cu2+ Ion Sensing and Cell Imaging. RSC Adv. 2016, 6, 58979–58987. [Google Scholar] [CrossRef]
- Neamtu, I.; Rusu, A.G.; Diaconu, A.; Nita, L.E.; Chiriac, A.P. Basic Concepts and Recent Advances in Nanogels as Carriers for Medical Applications. Drug Deliv. 2017, 24, 539–557. [Google Scholar] [CrossRef]
- Tamura, M.; Ichinohe, S.; Tamura, A.; Ikeda, Y.; Nagasaki, Y. In Vitro and in Vivo Characteristics of Core-Shell Type Nanogel Particles: Optimization of Core Cross-Linking Density and Surface Poly(Ethylene Glycol) Density in PEGylated Nanogels. Acta Biomater. 2011, 7, 3354–3361. [Google Scholar] [CrossRef] [PubMed]
- Rudzinski, W.E.; Palacios, A.; Ahmed, A.; Lane, M.A.; Aminabhavi, T.M. Targeted Delivery of Small Interfering RNA to Colon Cancer Cells Using Chitosan and PEGylated Chitosan Nanoparticles. Carbohydr. Polym. 2016, 147, 323–332. [Google Scholar] [CrossRef]
- Guo, J.; Cheng, W.P.; Gu, J.; Ding, C.; Qu, X.; Yang, Z.; O’Driscoll, C. Systemic Delivery of Therapeutic Small Interfering RNA Using a PH-Triggered Amphiphilic Poly-l-Lysine Nanocarrier to Suppress Prostate Cancer Growth in Mice. Eur. J. Pharm. Sci. 2012, 45, 521–532. [Google Scholar] [CrossRef]
- Daniels, A.N.; Singh, M. Sterically Stabilized SiRNA:Gold Nanocomplexes Enhance c-MYC Silencing in a Breast Cancer Cell Model. Nanomedicine 2019, 14, 1387–1401. [Google Scholar] [CrossRef]
- Venkatas, J.; Singh, M. Curcumin-Reduced Gold Nanoparticles Facilitate IL-12 Delivery to A Cervical Cancer In Vitro Cell Model. Nanomedicine 2023, 18, 945–960. [Google Scholar] [CrossRef] [PubMed]
- Hong, C.A.; Son, H.Y.; Nam, Y.S. Layer-by-Layer SiRNA/Poly(L-Lysine) Multilayers on Polydopamine-Coated Surface for Efficient Cell Adhesion and Gene Silencing. Sci. Rep. 2018, 8, 7738. [Google Scholar] [CrossRef] [PubMed]
- Zhang, W.; Zhou, Y.; Li, X.; Xu, X.; Chen, Y.; Zhu, R.; Yin, L. Macrophage-Targeting and Reactive Oxygen Species (ROS)-Responsive Nanopolyplexes Mediate Anti-Inflammatory SiRNA Delivery against Acute Liver Failure (ALF). Biomater. Sci. 2018, 6, 1986–1993. [Google Scholar] [CrossRef]
- Liu, Y.; Song, Z.M.; Deng, X.; Cui, Y.; Yang, Y.F.; Han, K.; Jin, R.; Wang, H.; Liu, Y.; Cao, A. Chitosan-Coated Red Fluorescent Protein Nanoparticle as a Potential Dual-Functional SiRNA Carrier. Nanomedicine 2015, 10, 2005–2016. [Google Scholar] [CrossRef]
- Guzman-Villanueva, D.; El-Sherbiny, I.M.; Vlassov, A.V.; Herrera-Ruiz, D.; Smyth, H.D.C. Enhanced Cellular Uptake and Gene Silencing Activity of SiRNA Molecules Mediated by Chitosan-Derivative Nanocomplexes. Int. J. Pharm. 2014, 473, 579–590. [Google Scholar] [CrossRef]
- ISO 10993-5:2009; Biological Evaluation of Medical Devices—Part 5: Tests for In Vitro Cytotoxicity. ISO: Geneva, Switzerland, 2009.
- Weiss, A.M.; Lopez, M.A.; Rawe, B.W.; Manna, S.; Chen, Q.; Mulder, E.J.; Rowan, S.J.; Esser-Kahn, A.P. Understanding How Cationic Polymers’ Properties Inform Toxic or Immunogenic Responses via Parametric Analysis. Macromolecules 2023, 56, 7286–7299. [Google Scholar] [CrossRef]
- Duan, Y.; Duan, R.; Liu, R.; Guan, M.; Chen, W.; Ma, J.; Chen, M.; Du, B.; Zhang, Q. Chitosan-Stabilized Self-Assembled Fluorescent Gold Nanoclusters for Cell Imaging and Biodistribution in Vivo. ACS Biomater. Sci. Eng. 2018, 4, 1055–1063. [Google Scholar] [CrossRef]
- Zhuang, Q.; Jia, H.; Du, L.; Li, Y.; Chen, Z.; Huang, S.; Liu, Y. Targeted Surface-Functionalized Gold Nanoclusters for Mitochondrial Imaging. Biosens. Bioelectron. 2014, 55, 76–82. [Google Scholar] [CrossRef]
- Bugwandeen, A.; Singh, K.; Daniels, A.; Singh, D.; David, L.L.; Singh, M. In Vitro Cytotoxicity profiles of some Polymers and Inorganic Nanoparticles commonly used in Nanomedicine. Curr. Topics Toxicol. 2023, 19, 1–11. [Google Scholar]
- Cao, S.; Bi, Z.; Li, Q.; Zhang, S.; Singh, M.; Chen, J.D. Shape memory and antibacterial chitosan-based cryogel with hemostasis and skin wound repair. Carbohydr. Polym. 2023, 305, 120545. [Google Scholar] [CrossRef] [PubMed]
- Gounden, V.; Singh, M. Hydrogels and Wound Healing: Current and future prospects. Gels 2024, 10, 43. [Google Scholar] [CrossRef] [PubMed]
- Liu, K.; Liu, P.; Liu, R.; Wu, X. Dual AO/EB Staining to Detect Apoptosis in Osteosarcoma Cells Compared with Flow Cytometry. Med. Sci. Monit. Basic Res. 2015, 21, 15–20. [Google Scholar] [CrossRef] [PubMed]
- Lekshmi, A.; Varadarajan, S.N.; Lupitha, S.S.; Indira, D.; Ann Mathew, K.; Nair, A.C.; Nair, M.; Prasad, T.; Sekar, H.; Gopalakrishnan, A.K.; et al. A Quantitative Real-Time Approach for Discriminating Apoptosis and Necrosis. Cell Death Discov. 2017, 3, 16101. [Google Scholar] [CrossRef] [PubMed]
- Wright, L.; Joyce, P.; Barnes, T.J.; Lundmark, R.; Bergström, C.A.S.; Hubert, M.; Prestidge, C.A. A Comparison of Chitosan, Mesoporous Silica and Poly(Lactic-Co-Glycolic) Acid Nanocarriers for Optimising Intestinal Uptake of Oral Protein Therapeutics. J. Pharm. Sci. 2021, 110, 217–227. [Google Scholar] [CrossRef]
- Rejman, J.; Oberle, V.; Zuhorn, I.S.; Hoekstra, D. Size-Dependent Internalization of Particles via the Pathways of Clathrin- and Caveolae-Mediated Endocytosis. Biochem. J. 2004, 377, 159–169. [Google Scholar] [CrossRef]
- Pereira, P.; Pedrosa, S.S.; Wymant, J.M.; Sayers, E.; Correia, A.; Vilanova, M.; Jones, A.T.; Gama, F.M. SiRNA Inhibition of Endocytic Pathways to Characterize the Cellular Uptake Mechanisms of Folate-Functionalized Glycol Chitosan Nanogels. Mol. Pharm. 2015, 12, 1970–1979. [Google Scholar] [CrossRef]
- Chithrani, B.D.; Ghazani, A.A.; Chan, W.C.W. Determining the Size and Shape Dependence of Gold Nanoparticle Uptake into Mammalian Cells. Nano Lett. 2006, 6, 662–668. [Google Scholar] [CrossRef]
- Lojk, J.; Strojan, K.; Miš, K.; Bregar, B.V.; Hafner Bratkovič, I.; Bizjak, M.; Pirkmajer, S.; Pavlin, M. Cell Stress Response to Two Different Types of Polymer Coated Cobalt Ferrite Nanoparticles. Toxicol. Lett. 2017, 270, 108–118. [Google Scholar] [CrossRef] [PubMed]
- Limbach, L.K.; Li, Y.; Grass, R.N.; Brunner, T.J.; Hintermann, M.A.; Muller, M.; Gunther, D.; Stark, W.J. Oxide Nanoparticle Uptake in Human Lung Fibroblasts: Effects of Particle Size, Agglomeration, and Diffusion at Low Concentrations. Environ. Sci. Technol. 2005, 39, 9370–9376. [Google Scholar] [CrossRef] [PubMed]
- Sabuncu, A.C.; Grubbs, J.; Qian, S.; Abdel-Fattah, T.M.; Stacey, M.W.; Beskok, A. Probing Nanoparticle Interactions in Cell Culture Media. Colloids Surf. B Biointerfaces 2012, 95, 96–102. [Google Scholar] [CrossRef]
- Shannahan, J.H.; Lai, X.; Ke, P.C.; Podila, R.; Brown, J.M.; Witzmann, F.A. Silver Nanoparticle Protein Corona Composition in Cell Culture Media. PLoS ONE 2013, 8, e74001. [Google Scholar] [CrossRef]
- Shirmohammadi, E.; Ebrahimi, S.E.S.; Farshchi, A.; Salimi, M. The Efficacy of etanercept as anti-breast cancer treatment Is attenuated by residing macrophages. BMC Cancer 2020, 20, 836. [Google Scholar] [CrossRef]
- Yu, M.; Zhou, X.; Niu, L.; Lin, G.; Huang, J.; Zhou, W.; Gan, H.; Wang, J.; Jiang, X.; Yin, B.; et al. Targeting Transmembrane TNF-α Suppresses Breast Cancer Growth. Cancer Res. 2013, 73, 4061–4074. [Google Scholar] [CrossRef]
- Pileczki, V.; Braicu, C.; Gherman, C.; Berindan-Neagoe, I. TNF-α Gene Knockout in Triple Negative Breast Cancer Cell Line Induces Apoptosis. Int. J. Mol. Sci. 2012, 14, 411–420. [Google Scholar] [CrossRef]
- Dai, X.; Zhang, J.; Arfuso, F.; Chinnathambi, A.; Zayed, M.; Alharbi, S.A.; Kumar, A.P.; Ahn, K.S.; Sethi, G. Targeting TNF-Related Apoptosis-Inducing Ligand (TRAIL) Receptor by Natural Products as a Potential Therapeutic Approach for Cancer Therapy. Exp. Biol. Med. 2015, 240, 760. [Google Scholar] [CrossRef] [PubMed]
- Ledoux, A.C.; Perkins, N.D. NF-ΚB and the Cell Cycle. Biochem. Soc. Trans. 2014, 42, 76–81. [Google Scholar] [CrossRef]
- Mussbacher, M.; Salzmann, M.; Brostjan, C.; Hoesel, B.; Schoergenhofer, C.; Datler, H.; Hohensinner, P.; Basílio, J.; Petzelbauer, P.; Assinger, A.; et al. Cell Type Specific Roles of Nf-Kb Linking Inflamation and Thrombosis. Front. Immunol. 2019, 10, 85. [Google Scholar] [CrossRef]
- Wu, X.; Wu, M.Y.; Jiang, M.; Zhi, Q.; Bian, X.; Xu, M.D.; Gong, F.R.; Hou, J.; Tao, M.; Shou, L.M.; et al. TNF-α Sensitizes Chemotherapy and Radiotherapy against Breast Cancer Cells. Cancer Cell Int. 2017, 17, 13. [Google Scholar] [CrossRef]
- Shen, N.; Liu, S.; Cui, J.; Li, Q.; You, Y.; Zhong, Z.; Cheng, F.; Guo, A.Y.; Zou, P.; Yuan, G.; et al. Tumor Necrosis Factor α Knockout Impaired Tumorigenesis in Chronic Myeloid Leukemia Cells Partly by Metabolism Modification and MiRNA Regulation. Onco Targets Ther. 2019, 12, 2355–2364. [Google Scholar] [CrossRef]
- Zhang, Z.; Lin, G.; Yan, Y.; Li, X.; Hu, Y.; Wang, J.; Yin, B.; Wu, Y.; Li, Z.; Yang, X.P. Transmembrane TNF-Alpha Promotes Chemoresistance in Breast Cancer Cells. Oncogene 2018, 37, 3456–3470. [Google Scholar] [CrossRef]
- Morgan, M.J.; Liu, Z.G. Reactive Oxygen Species in TNFα-Induced Signaling and Cell Death. Mol. Cells 2010, 30, 1–12. [Google Scholar] [CrossRef] [PubMed]
- Mattos, B.R.; Bonacio, G.F.; Vitorino, T.R.; Garcia, V.T.; Amaral, J.H.; Dellalibera-Joviliano, R.; Franca, S.C.; Tanus-Santos, J.E.; Rizzi, E. TNF-α Inhibition Decreases MMP-2 Activity, Reactive Oxygen Species Formation and Improves Hypertensive Vascular Hypertrophy Independent of Its Effects on Blood Pressure. Biochem. Pharmacol. 2020, 180, 114121. [Google Scholar] [CrossRef] [PubMed]
- Carvalho-Galvão, A.; Guimarães, D.D.; De Brito Alves, J.L.; Braga, V.A. Central Inhibition of Tumor Necrosis Factor Alpha Reduces Hypertension by Attenuating Oxidative Stress in the Rostral Ventrolateral Medulla in Renovascular Hypertensive Rats. Front. Physiol. 2019, 10, 491. [Google Scholar] [CrossRef] [PubMed]
- Zhang, C.; Shu, W.; Zhou, G.; Lin, J.; Chu, F.; Wu, H.; Liu, Z. Anti-TNF-α Therapy Suppresses Proinflammatory Activities of Mucosal Neutrophils in Inflammatory Bowel Disease. Mediat. Inflamm. 2018, 2018, 3021863. [Google Scholar] [CrossRef]
- Kastl, L.; Sauer, S.W.; Ruppert, T.; Beissbarth, T.; Becker, M.S.; Süss, D.; Krammer, P.H.; Gülow, K. TNF-α Mediates Mitochondrial Uncoupling and Enhances ROS-Dependent Cell Migration via NF-ΚB Activation in Liver Cells. FEBS Lett. 2014, 588, 175–183. [Google Scholar] [CrossRef] [PubMed]
- Trachootham, D.; Alexandre, J.; Huang, P. Targeting Cancer Cells by ROS-Mediated Mechanisms: A Radical Therapeutic Approach? Nat. Rev. Drug Discov. 2009, 8, 579–591. [Google Scholar] [CrossRef] [PubMed]
- Martino, E.; Vuoso, D.C.; D’Angelo, S.; Mele, L.; D’Onofrio, N.; Porcelli, M.; Cacciapuoti, G. Annurca Apple Polyphenol Extract Selectively Kills MDA-MB-231 Cells through ROS Generation, Sustained JNK Activation and Cell Growth and Survival Inhibition. Sci. Rep. 2019, 9, 13045. [Google Scholar] [CrossRef] [PubMed]
- Zhang, X.; Wang, X.; Wu, T.; Li, B.; Liu, T.; Wang, R.; Liu, Q.; Liu, Z.; Gong, Y.; Shao, C. Isoliensinine Induces Apoptosis in Triple-Negative Human Breast Cancer Cells through ROS Generation and P38 MAPK/JNK Activation. Sci. Rep. 2015, 5, 12579. [Google Scholar] [CrossRef]
- Alsaedi, I.I.J.; Taqi, Z.J.; Hussien, A.M.A.; Sulaiman, G.M.; Jabir, M.S. Graphene Nanoparticles Induces Apoptosis in MCF-7 Cells through Mitochondrial Damage and NF-KB Pathway. Mater. Res. Express 2019, 6, 095413. [Google Scholar] [CrossRef]
- Hamaguchi, T.; Wakabayashi, H.; Matsumine, A.; Sudo, A.; Uchida, A. TNF Inhibitor Suppresses Bone Metastasis in a Breast Cancer Cell Line. Biochem. Biophys. Res. Commun. 2011, 407, 525–530. [Google Scholar] [CrossRef]
- Subramoniam, A.; Asha, V.V.; Nair, S.A.; Sasidharan, S.P.; Sureshkumar, P.K.; Rajendran, K.N.; Karunagaran, D.; Ramalingam, K. Chlorophyll Revisited: Anti-Inflammatory Activities of Chlorophyll a and Inhibition of Expression of TNF-α Gene by the Same. Inflammation 2012, 35, 959–966. [Google Scholar] [CrossRef]


| siRNA Reagent | Sequence (5′–3′) |
|---|---|
| siGENOME non-targeted siRNA | UAGCGACUAAACACAUCAA |
| ON-TARGET plus Human TNF SMARTpool siRNA | GCCCGACUAUCUCGACUUU |
| GCGUGGAGCUGAGAGAUAA | |
| UGACAAGCCUGUGCCCAU | |
| CCAGGGACCUGUGUGUAAU |
| Nanocluster | Nanocomplex | ||||
|---|---|---|---|---|---|
| TEM Size (nm ± SD) | Hydrodynamic Size (nm ± SD) | Zeta Potential (mV ± SD) | Hydrodynamic Size (nm ± SD) | Zeta Potential (mV ± SD) | |
| AuNC | 1.86 ± 0.45 | 73.6 ± 4.7 | −19.5 ± 7.5 | - | - |
| AuCS | (single) 1.82 ± 0.37 (gel) 21.23 ± 3.83 | 267.8 ± 34.4 | 31.9 ± 0.1 | 97.7 ± 8.0 | −8.0 ± 0.2 |
| AuCS-1% PEG | 1.89 ± 0.29 | 194.5 ± 24.7 | 13.9 ± 0.3 | 108.5 ± 16.2 | −0.8 ± 0.9 |
| AuCS-2% PEG | 1.99 ± 0.38 | 97.5 ± 9.2 | 17.1 ± 2.2 | 151.5 ± 0.3 | −1.6 ± 0.0 |
| Nanocomplex | siRNA:FAuNC (w/w) at Endpoint | Maximum Dye Displacement (% ± SD) |
| AuCS | 1:33 | 95.6 ± 2.1 |
| AuCS-1% PEG | 1:45.6 | 84.4 ± 1.8 |
| AuCS-2% PEG | 1:55.1 | 80.6 ± 2.9 |
| Treatment | Apoptotic Index |
|---|---|
| Control | 0.03 |
| Free siRNA | 0.02 |
| LF3K | 0.04 |
| AuCS | 0.03 |
| AuCS-1% PEG | 0.02 |
| AuCS-2% PEG | 0.04 |
Disclaimer/Publisher’s Note: The statements, opinions and data contained in all publications are solely those of the individual author(s) and contributor(s) and not of MDPI and/or the editor(s). MDPI and/or the editor(s) disclaim responsibility for any injury to people or property resulting from any ideas, methods, instructions or products referred to in the content. |
© 2025 by the authors. Licensee MDPI, Basel, Switzerland. This article is an open access article distributed under the terms and conditions of the Creative Commons Attribution (CC BY) license (https://creativecommons.org/licenses/by/4.0/).
Share and Cite
Padayachee, J.; Singh, M. Biocompatible Copolymerized Gold Nanoclusters: Anti-TNF-α siRNA Binding, Cellular Uptake, Cytotoxicity, Oxidative Stress and Cell Cycle Effects In Vitro. Biomimetics 2025, 10, 812. https://doi.org/10.3390/biomimetics10120812
Padayachee J, Singh M. Biocompatible Copolymerized Gold Nanoclusters: Anti-TNF-α siRNA Binding, Cellular Uptake, Cytotoxicity, Oxidative Stress and Cell Cycle Effects In Vitro. Biomimetics. 2025; 10(12):812. https://doi.org/10.3390/biomimetics10120812
Chicago/Turabian StylePadayachee, Jananee, and Moganavelli Singh. 2025. "Biocompatible Copolymerized Gold Nanoclusters: Anti-TNF-α siRNA Binding, Cellular Uptake, Cytotoxicity, Oxidative Stress and Cell Cycle Effects In Vitro" Biomimetics 10, no. 12: 812. https://doi.org/10.3390/biomimetics10120812
APA StylePadayachee, J., & Singh, M. (2025). Biocompatible Copolymerized Gold Nanoclusters: Anti-TNF-α siRNA Binding, Cellular Uptake, Cytotoxicity, Oxidative Stress and Cell Cycle Effects In Vitro. Biomimetics, 10(12), 812. https://doi.org/10.3390/biomimetics10120812