Article

Jewish Presence in the Land of Israel in the 19th Century: Insights from the Montefiore Censuses

by
Raquel Levy-Toledano
1,2,3,*,
Wim Penninx
4 and
Sergio DellaPergola
2,5
1
Independent Researcher, 92100 Boulogne Billancourt, France
2
International Institute of Jewish Genealogy, Mevasseret Zion 40083, Israel
3
Cercle de Généalogie Juive, 75010 Paris, France
4
Independent Researcher, 2623 Delft, The Netherlands
5
The Avraham Harman Institute of Contemporary Jewry, The Hebrew University of Jerusalem, Mt. Scopus, Jerusalem 91905, Israel
*
Author to whom correspondence should be addressed.
Genealogy 2025, 9(3), 72; https://doi.org/10.3390/genealogy9030072
Submission received: 9 June 2025 / Revised: 27 June 2025 / Accepted: 9 July 2025 / Published: 17 July 2025

Abstract

This article presents a new evaluation and analysis of the five censuses undertaken at the initiative of philanthropist Sir Moses Montefiore among the Jewish population of Palestine/the Land of Israel between 1839 and 1875. The main purpose of the censuses was to ascertain the composition and needs of a generally poor Jewish population in order to better provide to its welfare. The information collected concerned basic demographic characteristics, countries of origin—namely along the main divide of Ashkenazi and Sephardi/Mizrahi Jews—and periods of immigration, social composition, and religiosity. By combining the different censuses into an integrated database, the authors are able to show changes intervening over time not only regarding the aggregate population, but also concerning individual and household profiles. The data aggregation allows us to better understanding the material conditions of the Jewish population and to outline with greater accuracy the relationship between socio-cultural communities and socio-economic stratification. The analysis unveiled the patterns of Jewish immigration all along the surveyed period and its variations by size and by countries of origin. These data provide important evidence concerning the overall Jewish presence in the Land of Israel and demonstrate that immigration was a significant factor well before the formal beginning of Aliyah in the early 1880s. No such analysis of the whole set of Montefiore censuses had been performed previously. The findings will prove very useful to historians and social scientists in their further investigation of the area and its populations in the 19th century.

1. Introduction

1.1. Early Population Patterns in Palestine/the Land of Israel

This article presents a new evaluation and analysis of the censuses undertaken at the initiative of Sir Moses Montefiore among the Jewish population of Palestine/the Land of Israel. The period of time covered by these data, and their retrospective projection, roughly ranges between 1800 and 1880.
Over a long time-span between the early Middle Ages and the beginning of emancipation at end of the 18th century, diasporic Jewish communities were small, geographically sparse, dependent on the variable tolerance of local rulers, and often subject to discrimination and expulsions—hence inherently unstable and mobile. The total population of Palestine/the Land of Israel (here used interchangeably) was most of the time small and underdeveloped, ranging between 150,000 in the 14th century after the black death to 275,000 in 1800, the vast majority of which were Arabs, mostly Muslims with Christian minorities (Bachi 1977; Dulska 2015, 2017; McEvedy and Jones 1978; DellaPergola 2021). A small permanent Jewish settlement existed, estimated at 7000 at the end of both the 12th and the 18th centuries, with periodical ups and downs. Some increase had occurred after the year 1500, following the expulsion of Jews from the Iberian Peninsula (Lewis 1952). Jewish subsistence mostly relied on donations from the diaspora, with minuscule numbers of travelers and immigrants continuously arriving and being offset by very high levels of mortality.
By the 19th century, the Jewish world was experiencing significant changes. While pogroms and persecutions remained common in Russia, where the largest share of world Jews were concentrated (Weinryb 1972), the emancipation of Jews was advancing in most parts of Europe, allowing Jews to integrate more fully into secular society and favoring international migrations within Europe, to the United States and to the Land of Israel (DellaPergola 2024a). Intercontinental migrations of Jews were indeed becoming more frequent, also owing to improved means of maritime transportation. While we have sparse and unsystematic data about Jewish migrations during the earlier decades of the 19th century, it is estimated that between 1840 and 1880, 221,000 Jews emigrated overseas—200,000 of them to the United States, 5000 to other countries in the Americas, 10,000 to Palestine, and 6000 to other countries (Lestschinsky 1960). Jewish mass migration would later hugely expand, with 765,000 migrants in 1881–1900, 1.7 million in 1901–1920, and 1.1 million in 1921–1939 (Schmelz and DellaPergola 2006).
Between 1840 and 1880, the Land of Israel attracted only a minor trickle of 4.5% of the total Jewish migration, and this share even diminished in the following years, at least until the early 1930s (Schmelz and DellaPergola 2006). It was only after independence in 1948 that Israel would become the main recipient of global Jewish migration (DellaPergola 2020). Although one of the motivations of European Jews to emigrate to the Land of Israel was the return to Zion, long before the emergence of Zionism, the growing secularization of Jewish life in Europe might have raised concerns within Orthodox communities, leading some Jews to seek environments where their religious identity could be preserved. The Ashkenazi Jews who emigrated to the Land of Israel during this period were primarily from these Orthodox communities (Kessler 2016).
Sephardic Jews, particularly those from North Africa, practiced a mystic form of Judaism deeply tied to messianic expectations (Stillman 1979a). Their love for Zion and their belief in imminent redemption were the primary drivers behind their migration to the Land of Israel (Ben Ya’akov 1994). Unlike their Ashkenazi counterparts, who faced the cultural challenge of secularization, Sephardic Jews often endured the hardships of political instability, persecution, and extreme poverty under the dhimmi system (Stillman 1979b). French presence, especially in North Africa, and colonization, especially in Algeria, introduced forms of modernization which attracted parts of the local Jewish populations.
The Jewish communities in the Land of Israel, like the rest of the Ottoman Empire, were part of a diverse and multi-ethnic society. Arabs, Christians, Druzes, and other minorities coexisted with Jewish populations, with each group navigating the political and social structures of the empire (McCarthy 1990). These interactions, alongside the challenges posed by natural disasters, like the 1837 earthquake in Safed and geopolitical changes such as the French invasion of Algeria, influenced the demographic shifts and migration patterns of Jews throughout the 19th century.
According to most witnesses, the Jewish population was poor if not miserable. In the words of one traveler who visited the place in 1854 as an envoy of the daily New York Herald Tribune:
“The sedentary population of Jerusalem numbers about 15,500 souls, of whom 4000 are Mussulmans and 8000 Jews. The Mussulmans, forming about a fourth part of the whole, and consisting of Turks, Arabs and Moors, are, of course, the masters in every respect, as they are in no way affected with the weakness of their Government at Constantinople. Nothing equals the misery and the sufferings of the Jews at Jerusalem, inhabiting the most filthy quarter of the town, called hareth-el-yahoud, the quarter of dirt, between the Zion and the Moriah, where their synagogues are situated—the constant objects of Mussulman oppression and intolerance, insulted by the Greeks, persecuted by the Latins, and living only upon the scanty alms transmitted by their European brethren. The Jews, however, are not natives, but from different and distant countries, and are only attracted to Jerusalem by the desire of inhabiting the Valley of Jehosaphat, and to die in the very places where the redemptor is to be expected. “Attending their death,” says a French author, “they suffer and pray. Their regards turned to that mountain of Moriah, where once rose the temple of Solomon, and which they dare not approach, they shed tears on the misfortunes of Zion, and their dispersion over the world.” To make these Jews more miserable, England and Prussia appointed, in 1840, an Anglican bishop at Jerusalem, whose avowed object is their conversion. He was dreadfully thrashed in 1845, and sneered at alike by Jews, Christians and Turks. He may, in fact, be stated to have been the first and only cause of a union between all the religions at Jerusalem” (Marx 1854).

1.2. Sir Moses Montefiore

Sir Moses Montefiore (1784–1885), a prominent Jewish philanthropist from Great Britain, with roots in the Sephardic Jewish community of Leghorn—the new port in Tuscany developed by the Medici family during the 16th century—was deeply concerned with the welfare of Jews all over the world. His role was pivotal in shaping the infrastructure of Jewish life in the Land of Israel (then part of the Ottoman Empire). Montefiore traveled several times to the Land of Israel from 1827 to 1875. His trips there were driven by his philanthropic, religious, and diplomatic goals, aimed at improving Jewish life and laying the groundwork for the future resettlement of Jews (Montefiore and Montefiore 1890). In 1840, at the time of the Damascus blood libel, he actively intervened to protect the safety of Jewish communities in the Levant (Frankel 1997). Among other philanthropic initiatives, Montefiore built the first neighborhood out of the walls of Jerusalem’s old city, known as Mishkenot Sha’ananim. Montefiore was possibly the most prominent among several philanthropists, investors, religious leaders and other intellectuals who manifested renewed interest toward the Land of Israel and its Jewish settlement during the 19th century (Glass and Kark 1991; Kark 1994).
To better apprehend the living conditions of Jews and their needs, Montefiore commissioned five censuses of the Jewish population living in the Land of Israel and in a few cities of Lebanon, including three surveys of the Jewish religious institutions, and one census in Alexandria.
The Montefiore censuses recorded a profusion of details, including personal and family particulars, occupations and countries of origin, and surveys of Jewish religious institutions (The Montefiore Endowment n.d.). Along with materials from the Ottoman archives, they constitute the main historical source and a unique sociological and genealogical record of Jewish life in this area at that time (Ben Ya’akov 2001). Kessler (2016) has conducted an initial analysis of these censuses which provides basic findings on the Jewish population of the whole Land of Israel before what is commonly called the First Aliyah in 1882, i.e., the first of a series of immigration waves which substantially increased the local Jewish population. Montefiore’s censuses focused, in particular, on Jewish ethnicity (namely, countries of origin), past immigration trends, socio-economic status, and factors influencing full time Torah study. It is noteworthy that none of the extensive publications on the demographics of the Land of Israel during the Ottoman period make systematic reference to the Montefiore censuses. This suggests that despite the wealth of information they provide, these censuses have been only partially utilized for studying the Jewish presence in the Land of Israel in the 19th century (Schmelz 1985, 1992).
Although the Montefiore censuses provided extensive information on the Sephardic and Mizrahi population in the 19th century Land of Israel, beyond the work of Ben Ya’akov (1994, 2001, 2004, 2006, 2012) on North African Jews, relatively little is known about their presence in the region during that period.
In this article, we aim to shed light on Jewish communities and Jews living in Palestine before the First Aliyah (“Aliyah” in Hebrew means “ascent” and immigration of Jewish people to the Land of Israel/Palestine, referring to the traditional pilgrimage to Jerusalem). It examines their demography, immigration patterns, occupations, and socio-economic status using data from the Montefiore censuses.

2. Materials and Methods

2.1. Censuses

Montefiore’s censuses consisted of six censuses of Jewish inhabitants of the Land of Israel together, with those of Alexandria and a few Lebanese cities. They were taken in 1839, 1840, 1849, 1855, 1866 and 1875 (see Appendix A and Figure 1 for location). The scope of this article focuses on the inhabitants of the Land of Israel (i.e., the censuses of 1839, 1849, 1855, 1866 and 1875). Thus, the analysis excluded the 1840 census taken in Alexandria and Jewish inhabitants of Lebanon. The surveys of Jewish religious institutions that were also performed in 1855, 1866 and 1875 are not part of the analysis in this article either, and may be treated in a separate study.
The database accessible on the Montefiore Endowment website included personal information on the family, on the head of household (here- and thereafter HH) and on all individuals living under the same roof. However, some information was not reported (i.e., surname of HH and family members for Ashkenazim, occupation or information on family members, etc.). Information reported in the censuses (see Figure 2) and accessible on Montefiore endowment includes:
  • Year of the census.
  • City of residence.
  • Kolel: the community in which the family lived. The type of community (i.e., Ashkenazi or Sephardi) was reported. Of note, in Montefiore censuses, all non-Ashkenazi communities were grouped under Sephardim.
  • ID number of the family within a census and ID number of each individuals.
  • For each individual living under the same roof, the following was reported:
    Name: given name and surname;
    Gender;
    Family status (single, married, orphan, widow, etc.);
    City and country of origin: the city reported may have been a person’s last place of residence before coming to the Land of Israel, rather than the actual place of birth (The Montefiore Endowment n.d.);
    Year of arrival in the Land of Israel: allowing for estimation of the age of arrival in the Land of Israel;
    Age: allowing for estimation of year of birth;
  • Occupation: reported for the HH, rarely for other family members.
  • Economic status: mainly possessions of the HH.
  • Note: the censuses generally provide additional information on the socio-economic status of the HH and the family.
Although the participants received money, according to Montefiore Endowment’s estimation, the number of non-participants was minimal (about 1%) as all members of each community participated, and not just the poorer ones.
The Montefiore censuses used two numerical systems, that of households and that of individuals (see specimen in Figure 2). In each census, each household was attributed an identification (ID) number and each individual belonging to that household had a distinct ID number. When we sorted these ID numbers in ascending order, we noticed that individuals belonging to the same community had similar and consecutive IDs. The addresses of households are not systematically indicated in the censuses, but are sometimes mentioned in the “notes” section. When an address is mentioned (e.g., Courtyard 1, Courtyard 2, etc.), the household IDs follow each other in groups. Similarly, when, in this Kolel, we examined the IDs of the orphans, their IDs followed one another. Although it is difficult to ascertain, as the addresses of the orphans are very rarely mentioned, it suggests that orphans lived in groups in dwellings reserved to them.
The censuses were taken in a variety of Hebrew scripts. They were transliterated in modern Hebrew font and translated in English in 2008 by a team of volunteers of the Israel Genealogical Society. Although official transliteration rules from Hebrew to English were applied, different spellings were found for a given individual, family or surname, leading to correction and harmonization.

2.2. Analysis of the Data

2.2.1. Ashkenazi and Sephardi Communities
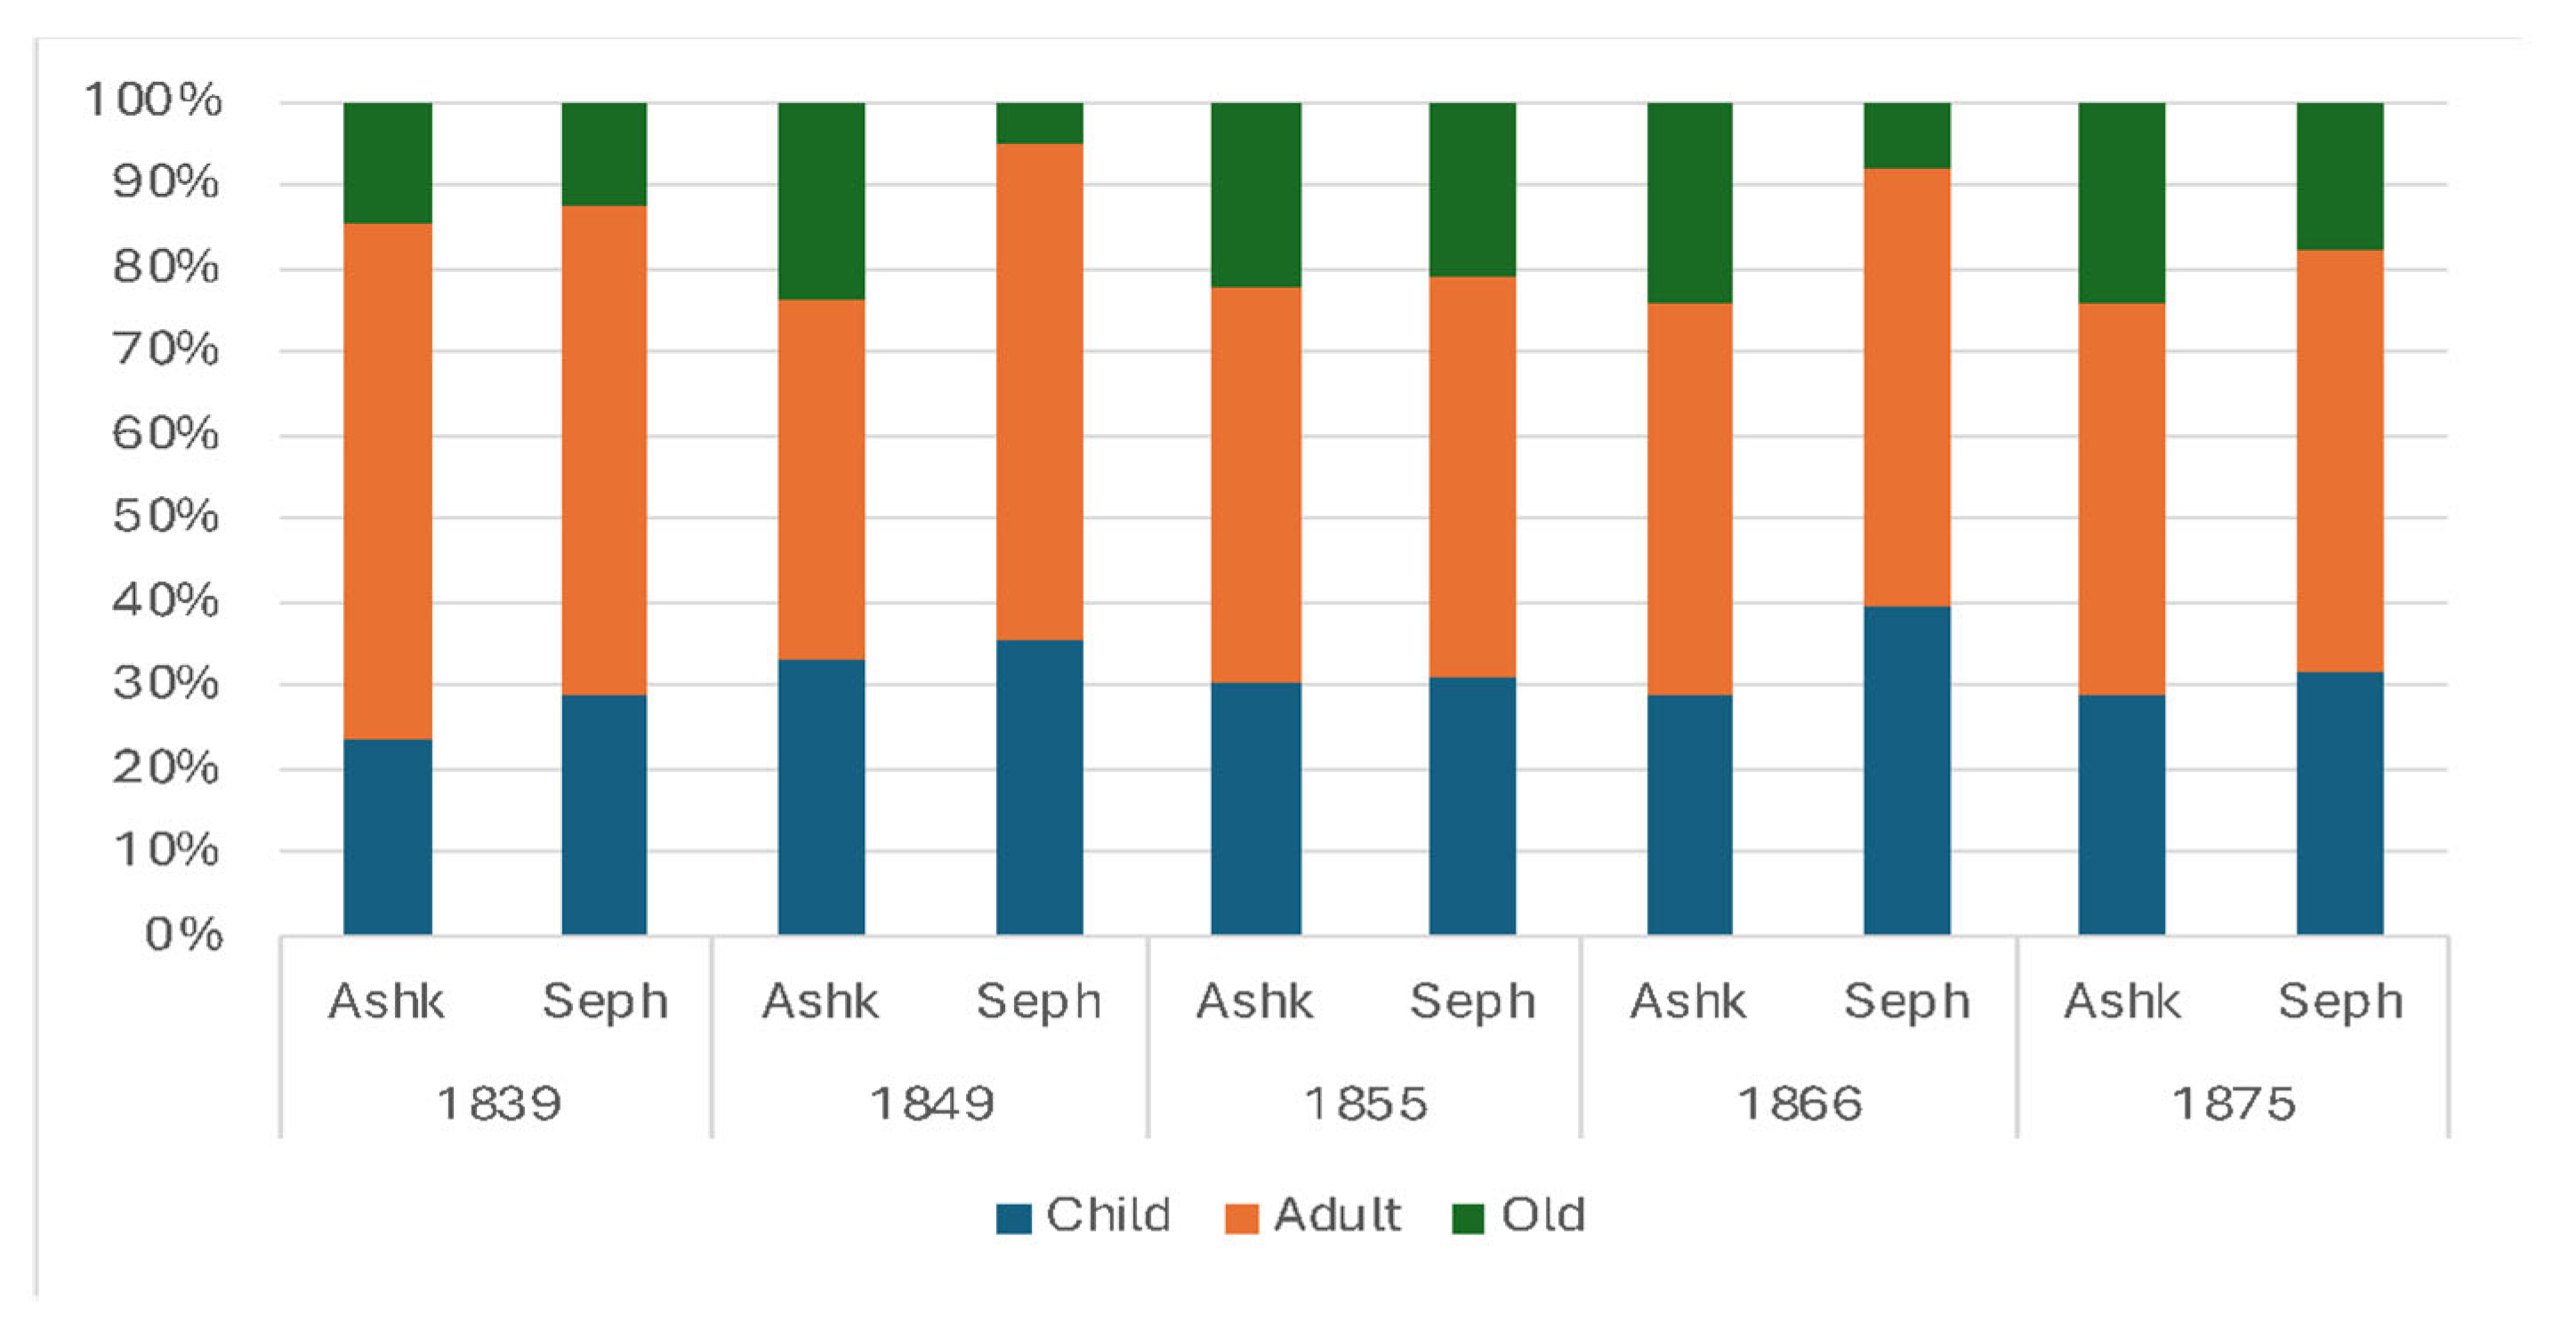
Although the name of each community (i.e., Kolel) was reported for each recorded individual in Montefiore, the scribes who registered the Jewish population of the Land of Israel divided it into Sephardim and Ashkenazim (The Montefiore Endowment n.d.). While the geographical origins of Ashkenazim were well identified, all the other Jews, including Sephardim from the Balkans, and Mughrabim from North Africa, as well as Oriental Jews from Iraq, Kurdistan, Persia, Afghanistan, etc., were all put under a single category—Sephardim. We follow this rule in this article—although it can be interpreted as reductive. All individuals in the household were considered to be of the same origin as the HH.
For a few entries, there was no indication allowing for determination of whether the HH was Sephardi or Ashkenazi (no indication given on the Kolel or on the country of birth and the surname was not specific to a given category). They were labeled “Unknown”. Considering the low number of “Unknown”, (i.e., 41 out 24,584 HH), they were not included in the analysis.

2.2.2. Age

The demographic analysis was performed both on HH and on all individuals censused.
Age, besides more detailed classifications, was broken down by categories:
  • Child: individuals aged less than 15 years old or listed as “child” in the censuses;
  • Adult: individuals aged between 15 and 49 years old or listed as “single” “married” or “widow”, when age was not reported;
  • Old: individuals aged more than 50 years old or when “date of arrival” or a mention in “note” gave an indication that age was more than 50 years old.

2.2.3. Occupations

The classification of occupations used was adapted from the work of McCarthy (1990), as his study analyzed the population of Palestine in the late Ottoman period, which was close to that of the Montefiore censuses.
This classification can be found in Appendix A.
For the current analysis, occupations were further classified as follows:
  • Intellectual occupation: religious occupation, students, clerical work, education, community service, health and medicine, public officials, art and other liberal professions;
  • Physical occupation: domestic services, craftsmen and small jobs, transport and communication (donkey drivers), other industries (workers);
  • Business: building industry, commerce, mechanical industry, wood manufacture, printing and stationery industries, financial services;
  • Clothing: clothing and millinery industries, leather and textile industries;
  • Food industry;
  • Persons with no occupation and dependents.

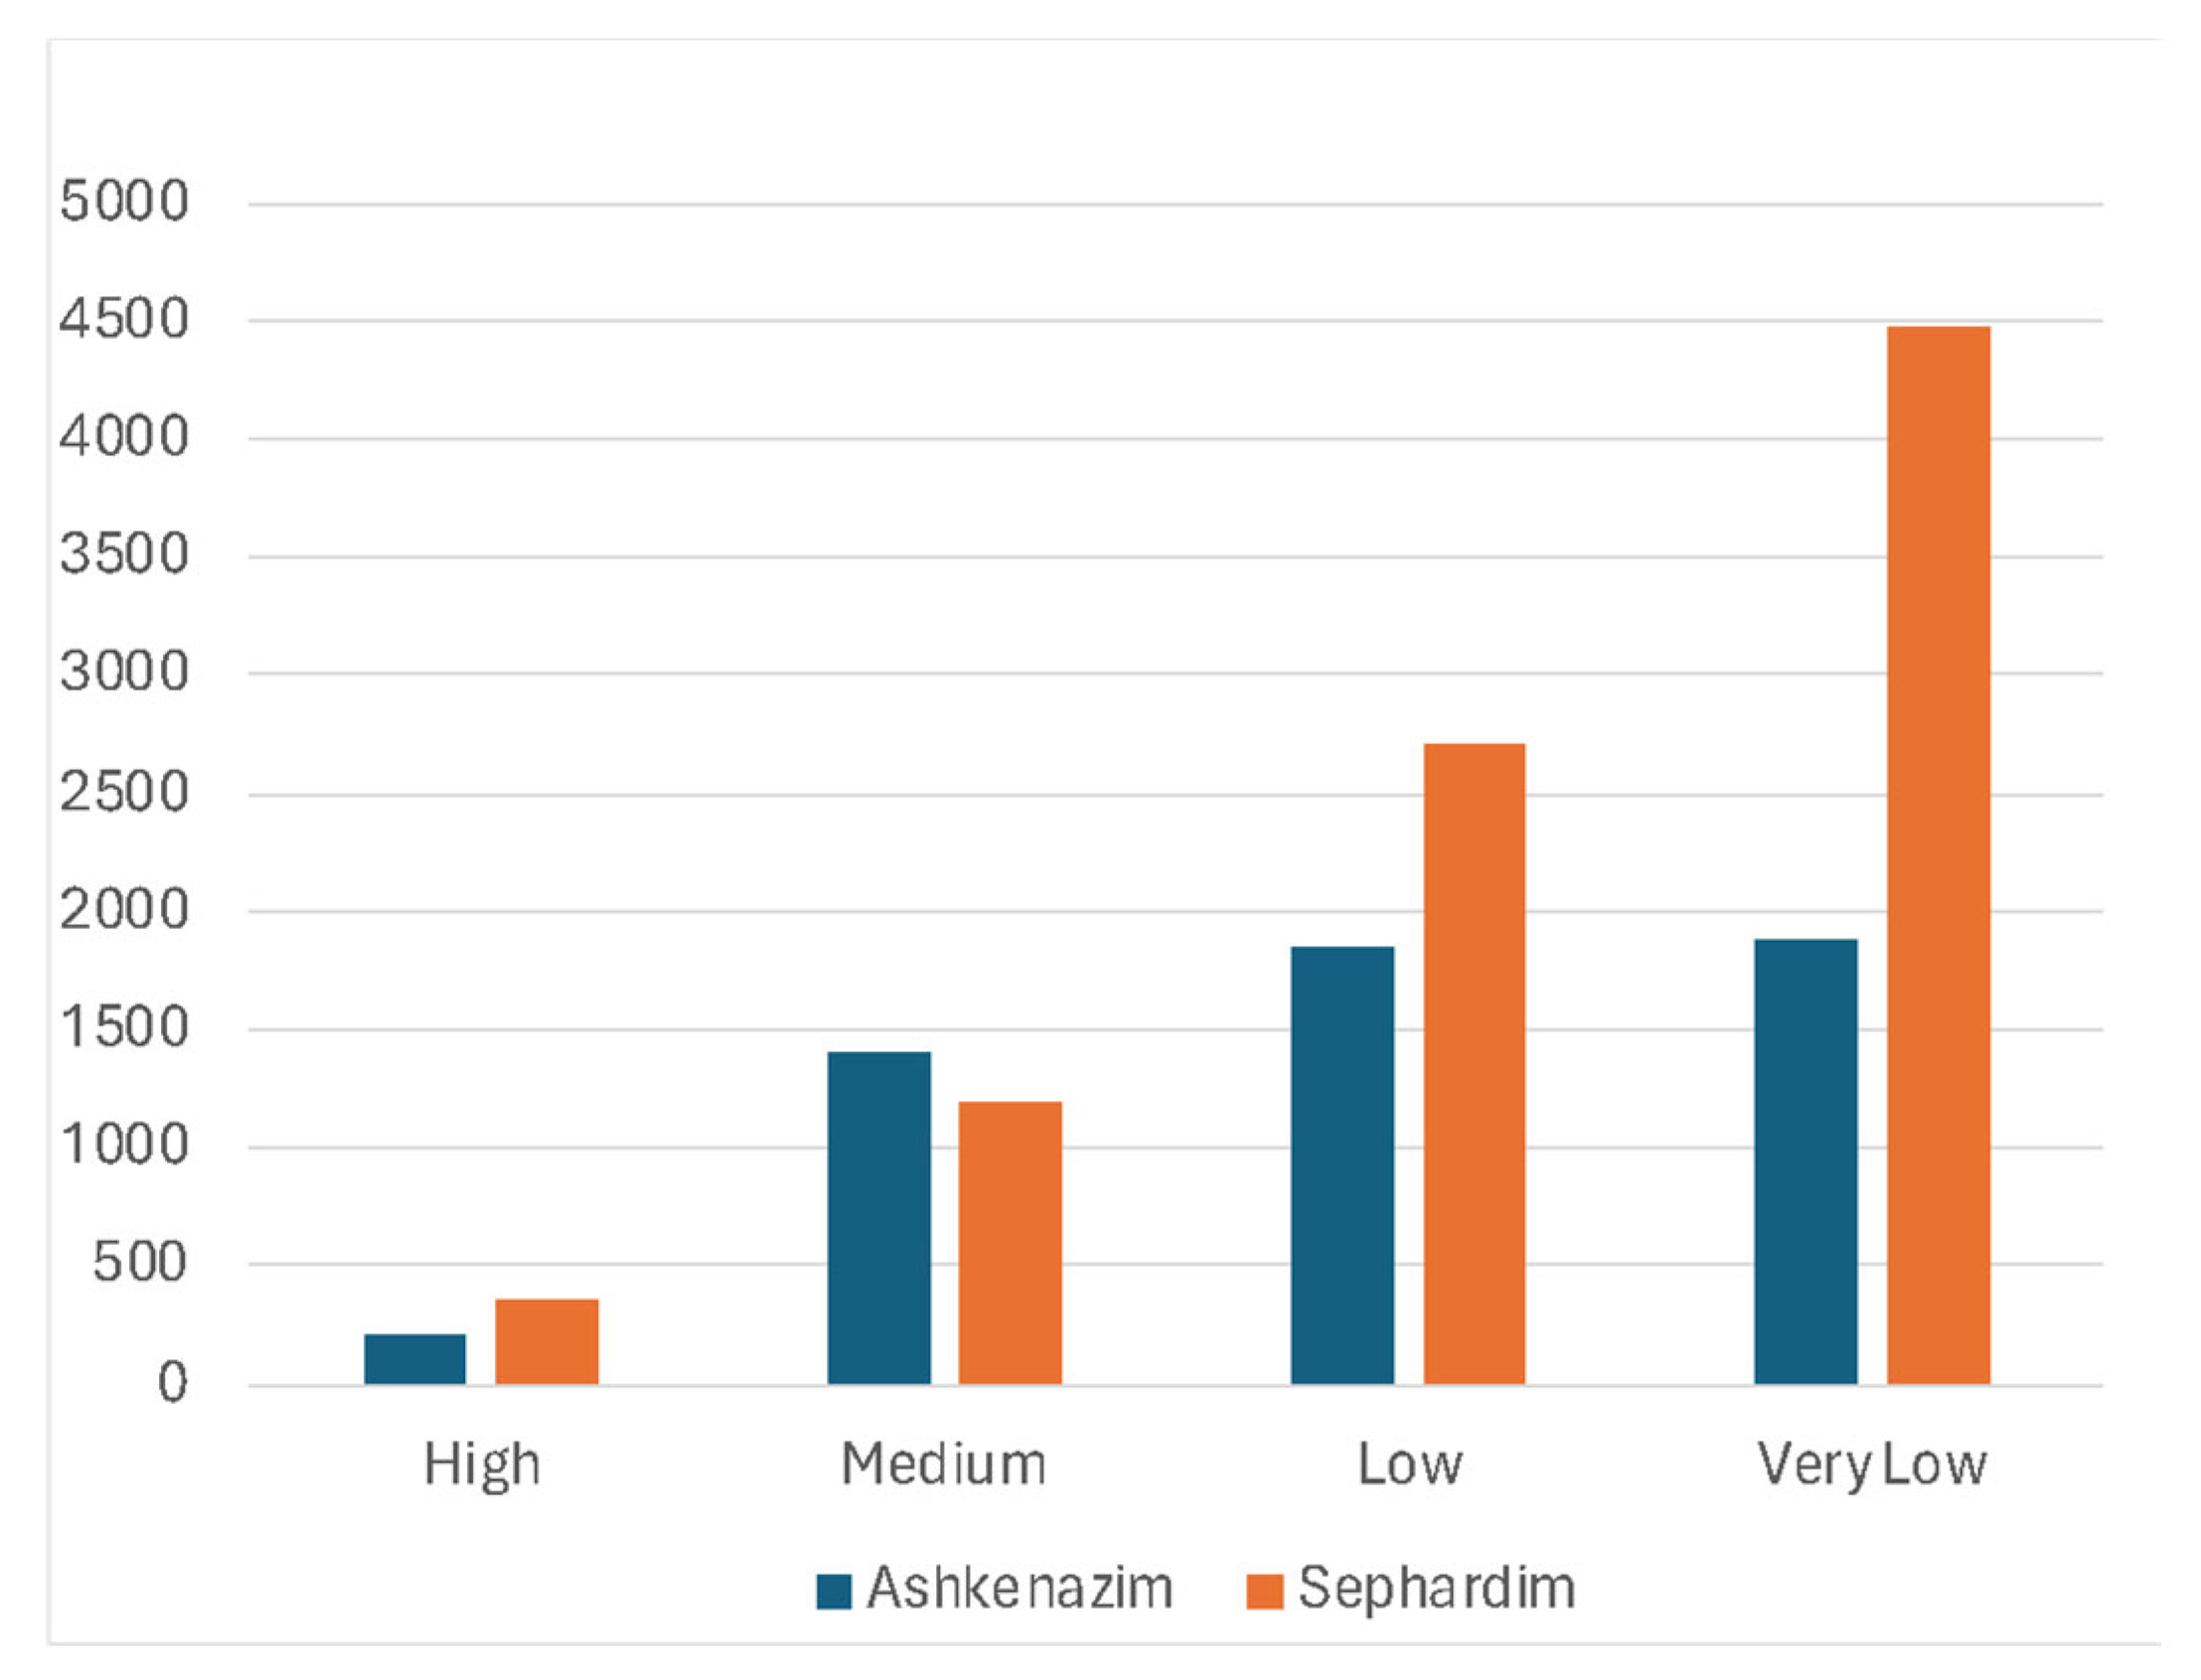
2.2.4. Socio-Economic Status

The socio-economic status was assessed by the occupation of the HH, his annual income and his possessions, as mentioned in the section “economic status” or in “notes”. Based on the notes, it was concluded that a minimum annual income of 3000 Grushs would sufficiently cover a family’s living needs.
Four categories of socio-economic status were considered throughout the censuses:
  • High: income or possessions of HH more than 10,000 Grushs;
  • Medium: income or possessions of HH from 3000 to 10,000 Grushs;
  • Low: income or possessions of HH between 2000 and 3000 Grushs or when it is mentioned in the note that the family is needy despite apparent correct income;
  • Very low: income or possessions of HH below 2000 Grushs or when “very poor” or “destitute” is mentioned in “notes”.
In the censuses, money and possessions were given in several currencies. They were converted into Grushs according to corresponding tables of conversion (see Appendix A).

2.2.5. Continuity of Residence and Duration of Stay

Continuity of residence and duration of stay in the Land of Israel was analyzed across the various censuses by sorting all the individuals (i.e., HH and family members) censused by their given name and their surname and by comparing place of birth, age, year of arrival, family composition, occupation, and the given name of family members of individuals bearing the same full name and appearing in more than one census. The continuity of residence and duration of stay could only be assessed for Sephardim, as surnames were generally not mentioned for Ashkenazim (see Section 3.3.9).
When the same individual appeared in several censuses, it was assumed that this individual and his family were present in the Land of Israel during these censuses and during the time in between these censuses. In some occurrences, it allowed for adding year of birth, year of arrival, or country of origin when omitted in a census and mentioned in another one.
Duration of stay in the Land of Israel was estimated by the difference between the date individuals were first censused and the date they were last censused. Lengths of stay were deliberately calculated in increments of 5 or 10 years (i.e., 5, 10, 15, 20, 25 and 35 years) rather than exact duration (i.e., 6, 9, 14 years). The mean and median duration of stay of individuals living in the Land of Israel before 1875 census were calculated. The 1875 census was excluded from this calculation of median and mean duration.

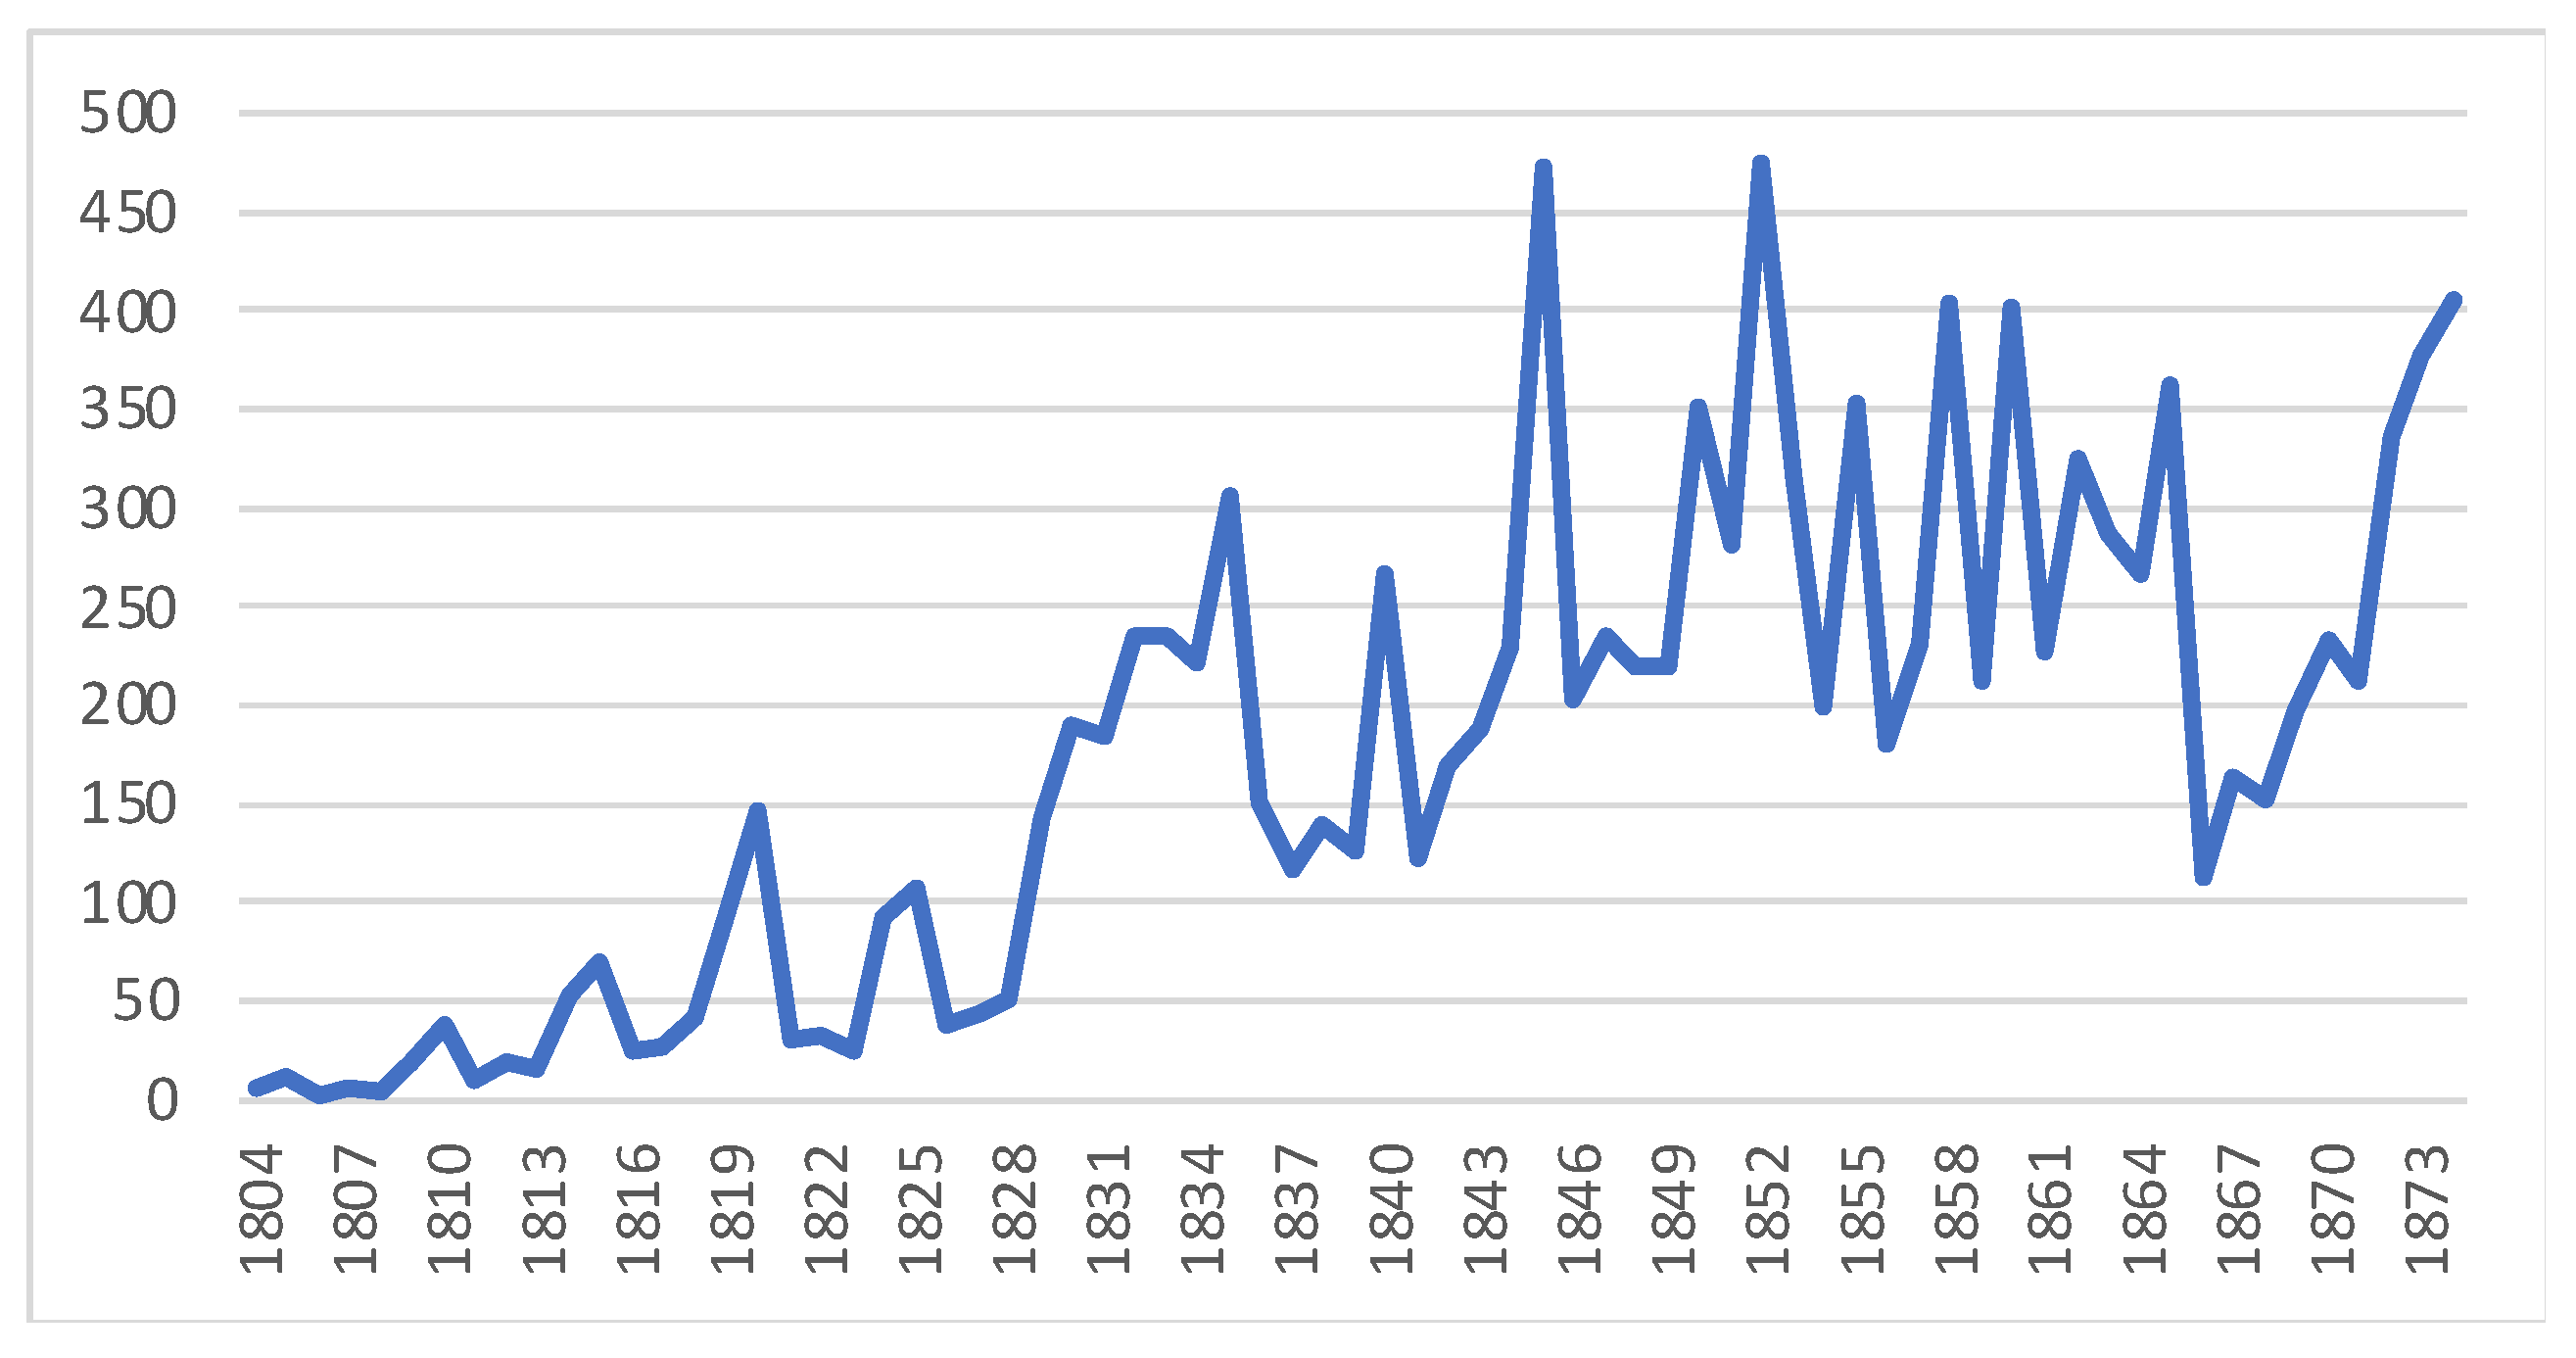
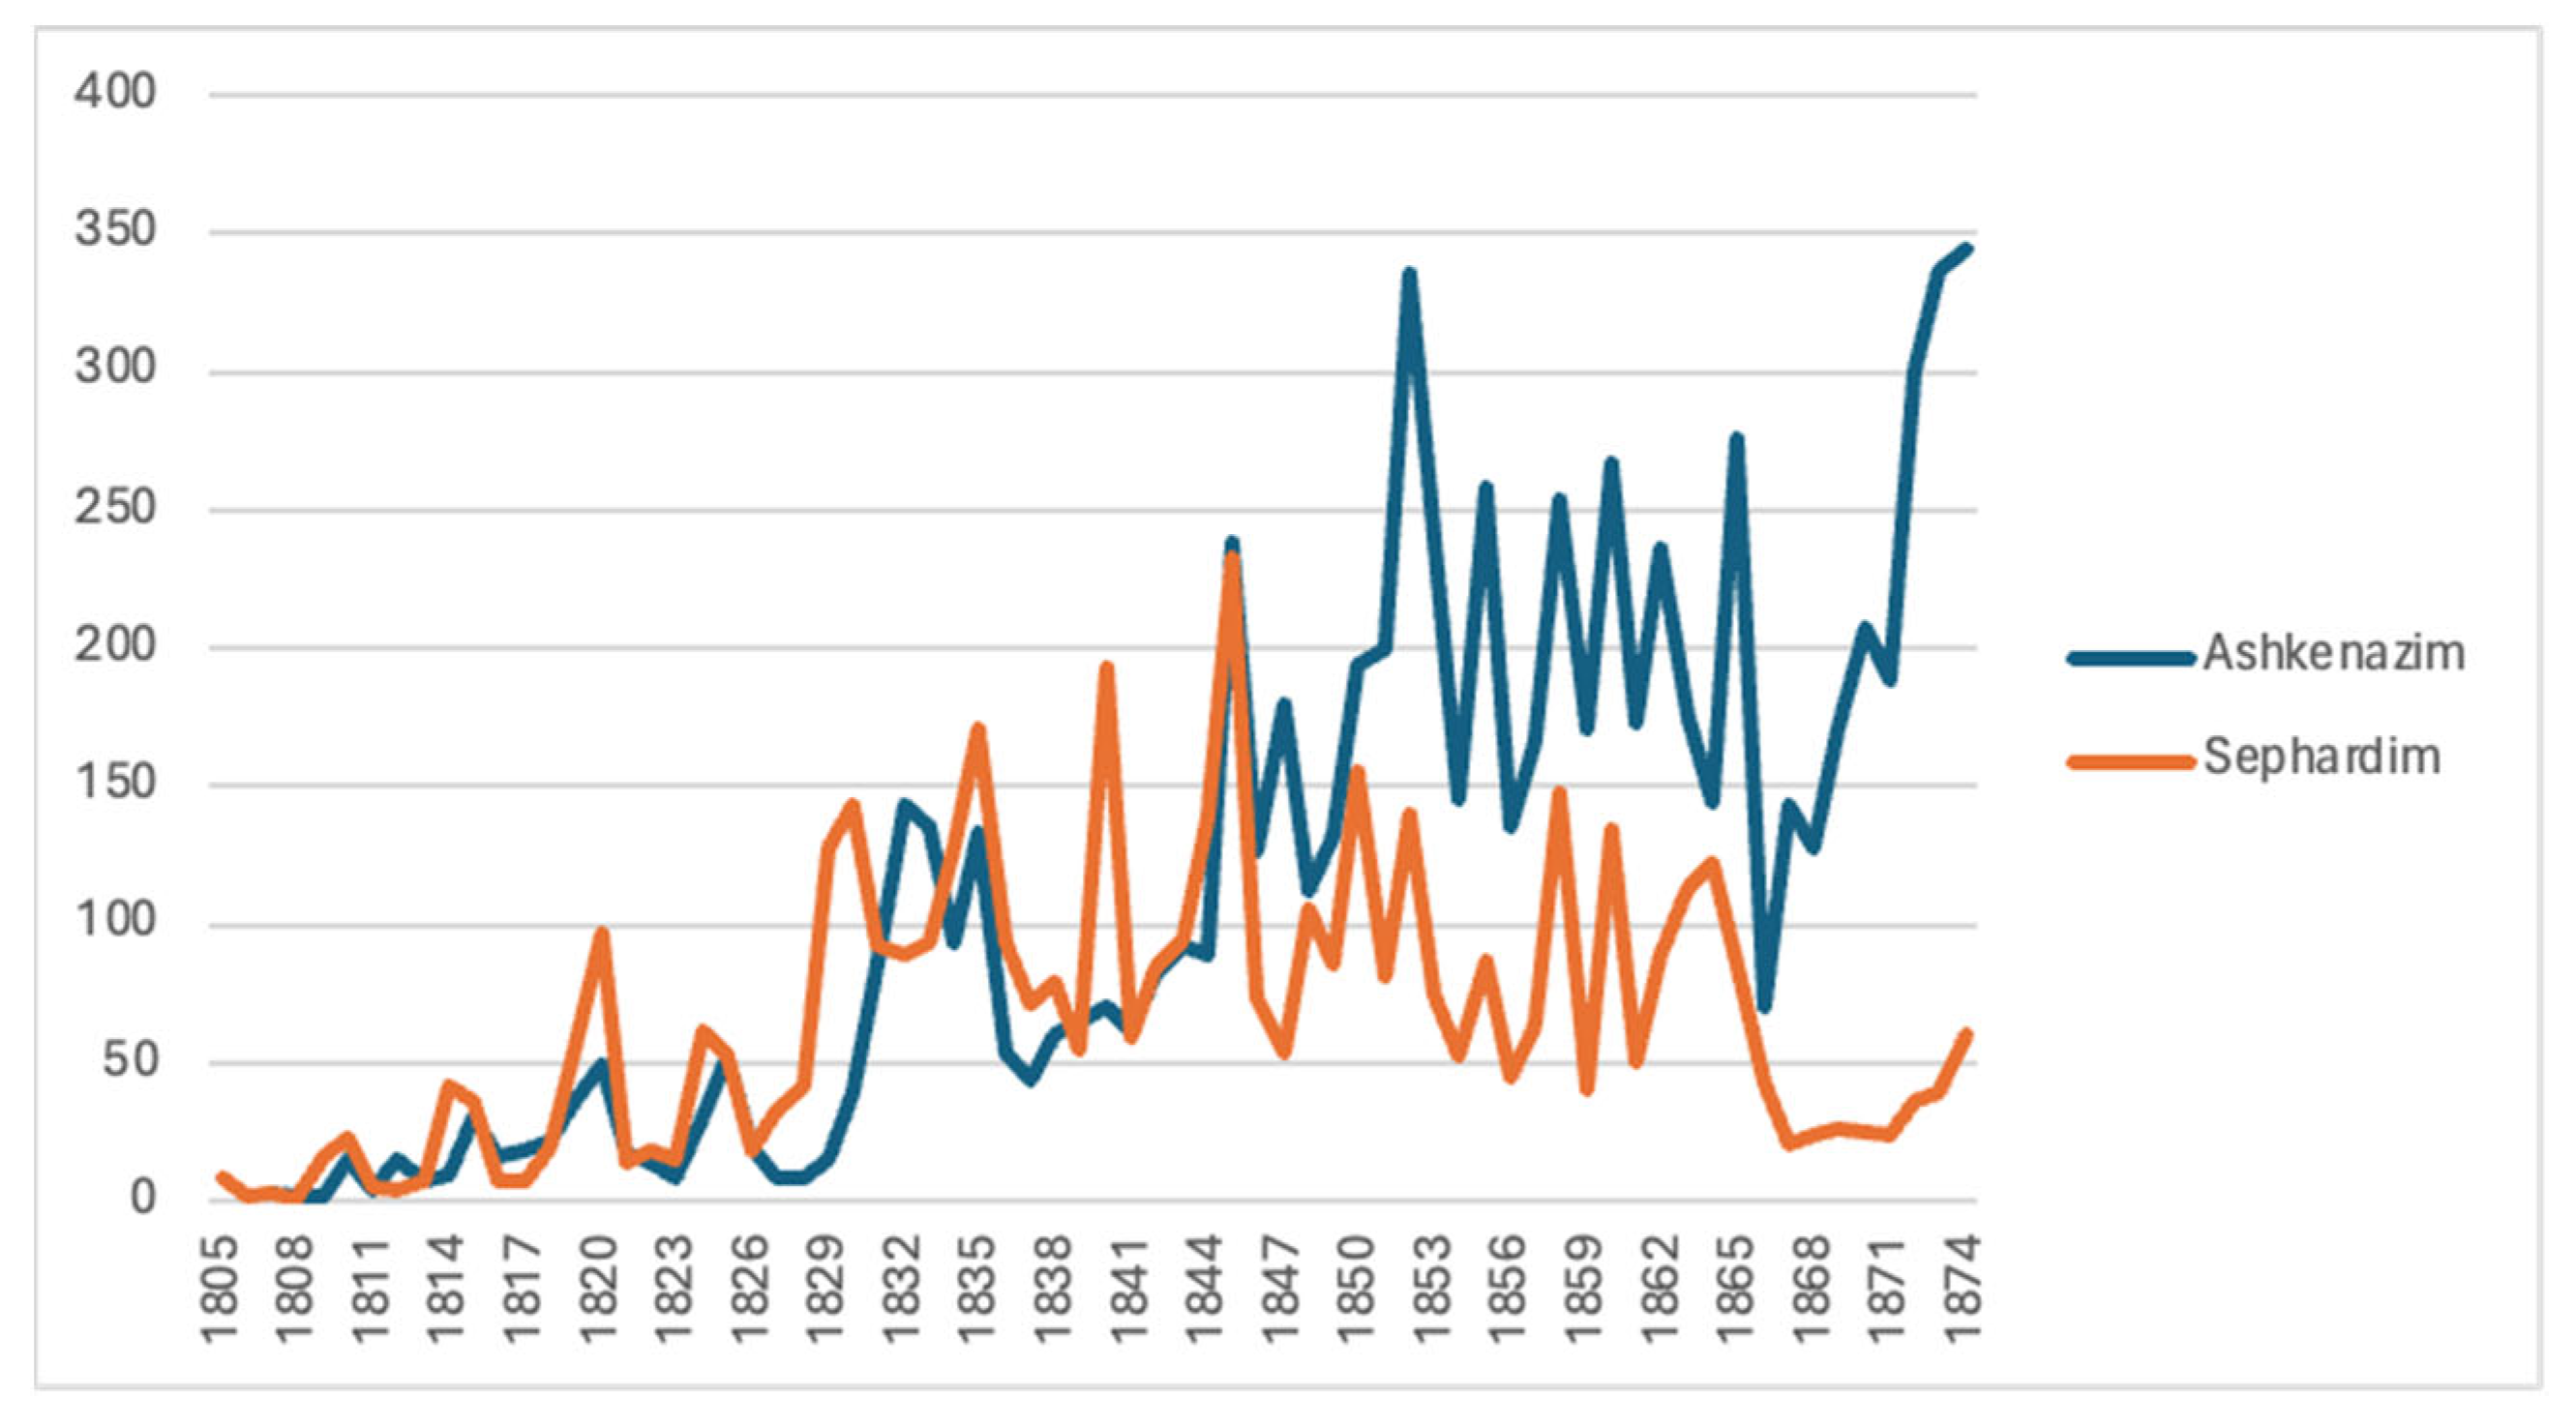
2.2.6. Waves of Immigration

The waves of immigration into the Land of Israel were assessed on HH born abroad (excluding HH born in the Land of Israel) with a reported date of arrival in the Land of Israel. They were assessed considering all the five censuses, which resulted in sometimes counting the same individuals more than once. However, considering that this applied to all HH censused, this should not affect the shape of the immigration waves to a major extent. However, to avoid this caveat and to assess the late waves of immigrations more precisely, waves of immigration were also evaluated based on the 1875 census only.

3. Results

3.1. Number of Entries and Quality of the Data

We analyzed 24,584 family groups (10,706 Ashkenazim and 13,814 Sephardim) corresponding each to a HH and totalizing 55,582 entries (i.e., individuals) recorded in the five censuses.
To evaluate the quality and robustness of the data, we assessed the amount of missing data for HHs in each analyzed category (see Table A1).
As stated in the work of Beider (2023), while many Ashkenazim probably received or adopted a surname in their country of origin, their vast majority (in our analyses, 95% of HH) did not report it and chose to follow the traditional Jewish naming pattern (i.e., given name and patronymics only). The reasons for omitting this adopted surname are unclear. Ignoring the official hereditary family names they were forced to adopt in their native country could be interpreted as a way to emancipate themselves from some of the obligations exerted by the rulers of their country of origin. In The Montefiore Endowment website, it is mentioned that some religious Jews were reluctant to be censused as this could be similar to be counted, which is discouraged according to Jewish law. Not being reported by their surname could have been a way of circumventing this issue. In contrast, very few Sephardim, mostly widows and orphans, omitted their surname.
Missing information on date of arrival was assessed on HH born outside the Land of Israel (out of a total number of 9539 Ashkenazim and 10,651 Sephardim).
While age and date of arrival in the Land of Israel were more frequently reported for Ashkenazim, Ashkenazim were less prone than Sephardim to reveal the amount of their ownings. As a result, the economic status of Ashkenazim was less frequently assessed.
Ashkenazim more frequently reported their date of arrival in the 1875 census than Sephardim. Therefore, waves of immigration in the Land of Israel of Sephardim during the whole 19th century could not be determined with accuracy (see, however, Ben Ya’akov 1994, 2001).

3.2. Population and Demography

3.2.1. Population Reported in Montefiore Censuses

As outlined in the Census Location section of Appendix A and as seen in Table 1, not all cities were surveyed at every census. For example, Acre was not surveyed in 1866 and 1875, and Haifa was not surveyed in 1849 and was only partially surveyed in 1866. Similarly, smaller cities such as Pekiin, Ramla, Shfaram, and Shkhem were not included in all censuses. In addition, in the 1875 census, Montefiore Endowment reported no record of Safed Sephardi population and fewer records than expected of Ashkenazim in Tiberias (Table A8).
Kessler (2016) estimated the population of cities not included in the censuses by extrapolating the expected growth for these populations. While this approach appears reasonable, at least two of these extrapolations (specifically for Shfaram and Ramla) might be inaccurate. In his travel notes on Palestine, Finn (1868) indicated that around 1850, thirty Algerian Jewish families lived in Shfaram as agriculturalists. However, he mentioned that they later moved to Haifa, leaving only two families in Shfaram. Additionally, our research found that several families who resided in Shfaram in 1849 and 1855 had moved to Haifa and Tiberias by 1875. It is thus likely that no censuses were conducted in Shfaram in 1866 and 1875, as the Jewish population had largely left by then. Similarly, Guérin (1868) recorded numbers of Muslims, Greek Orthodox, and Catholics in Ramla in 1863, but no Jews.
In his travel notes, Finn (1868) mentioned several rural villages, such as Tabor and Bokeah of Upper Galilee, where he met Jews cultivating the land. It is not known whether these villages of Upper Galilee were included in 1866 and 1875 censuses.
In this study, by analyzing the continuity of residence in the Land of Israel, we found that a fair number of individuals recorded in the early censuses (1839 and/or 1849) and in the later censuses (i.e., 1866 and/or 1875) were missing from the mid-period censuses (i.e., 1849, 1855, and/or 1866; see Table A4). Although some of these individuals could have temporarily moved abroad or to cities that were not surveyed, it is more likely that either not all individuals were consistently recorded across all census periods or that some records were lost (or were never collected) and were thus not available in Montefiore Endowment.
Since it seems difficult to accurately estimate the Jewish population of cities for which data are missing, in this article, we only report the data collected from Montefiore Endowment. The number of individuals living in the Land of Israel per city and per census collected from Montefiore Endowment is detailed in Table 1.
If we exclude the extrapolated data, these figures are almost identical to those already published, based on Montefiore censuses (Kessler 2016; Beider 2023), and are coherent with previous and contemporary estimates according to Kessler (2016).

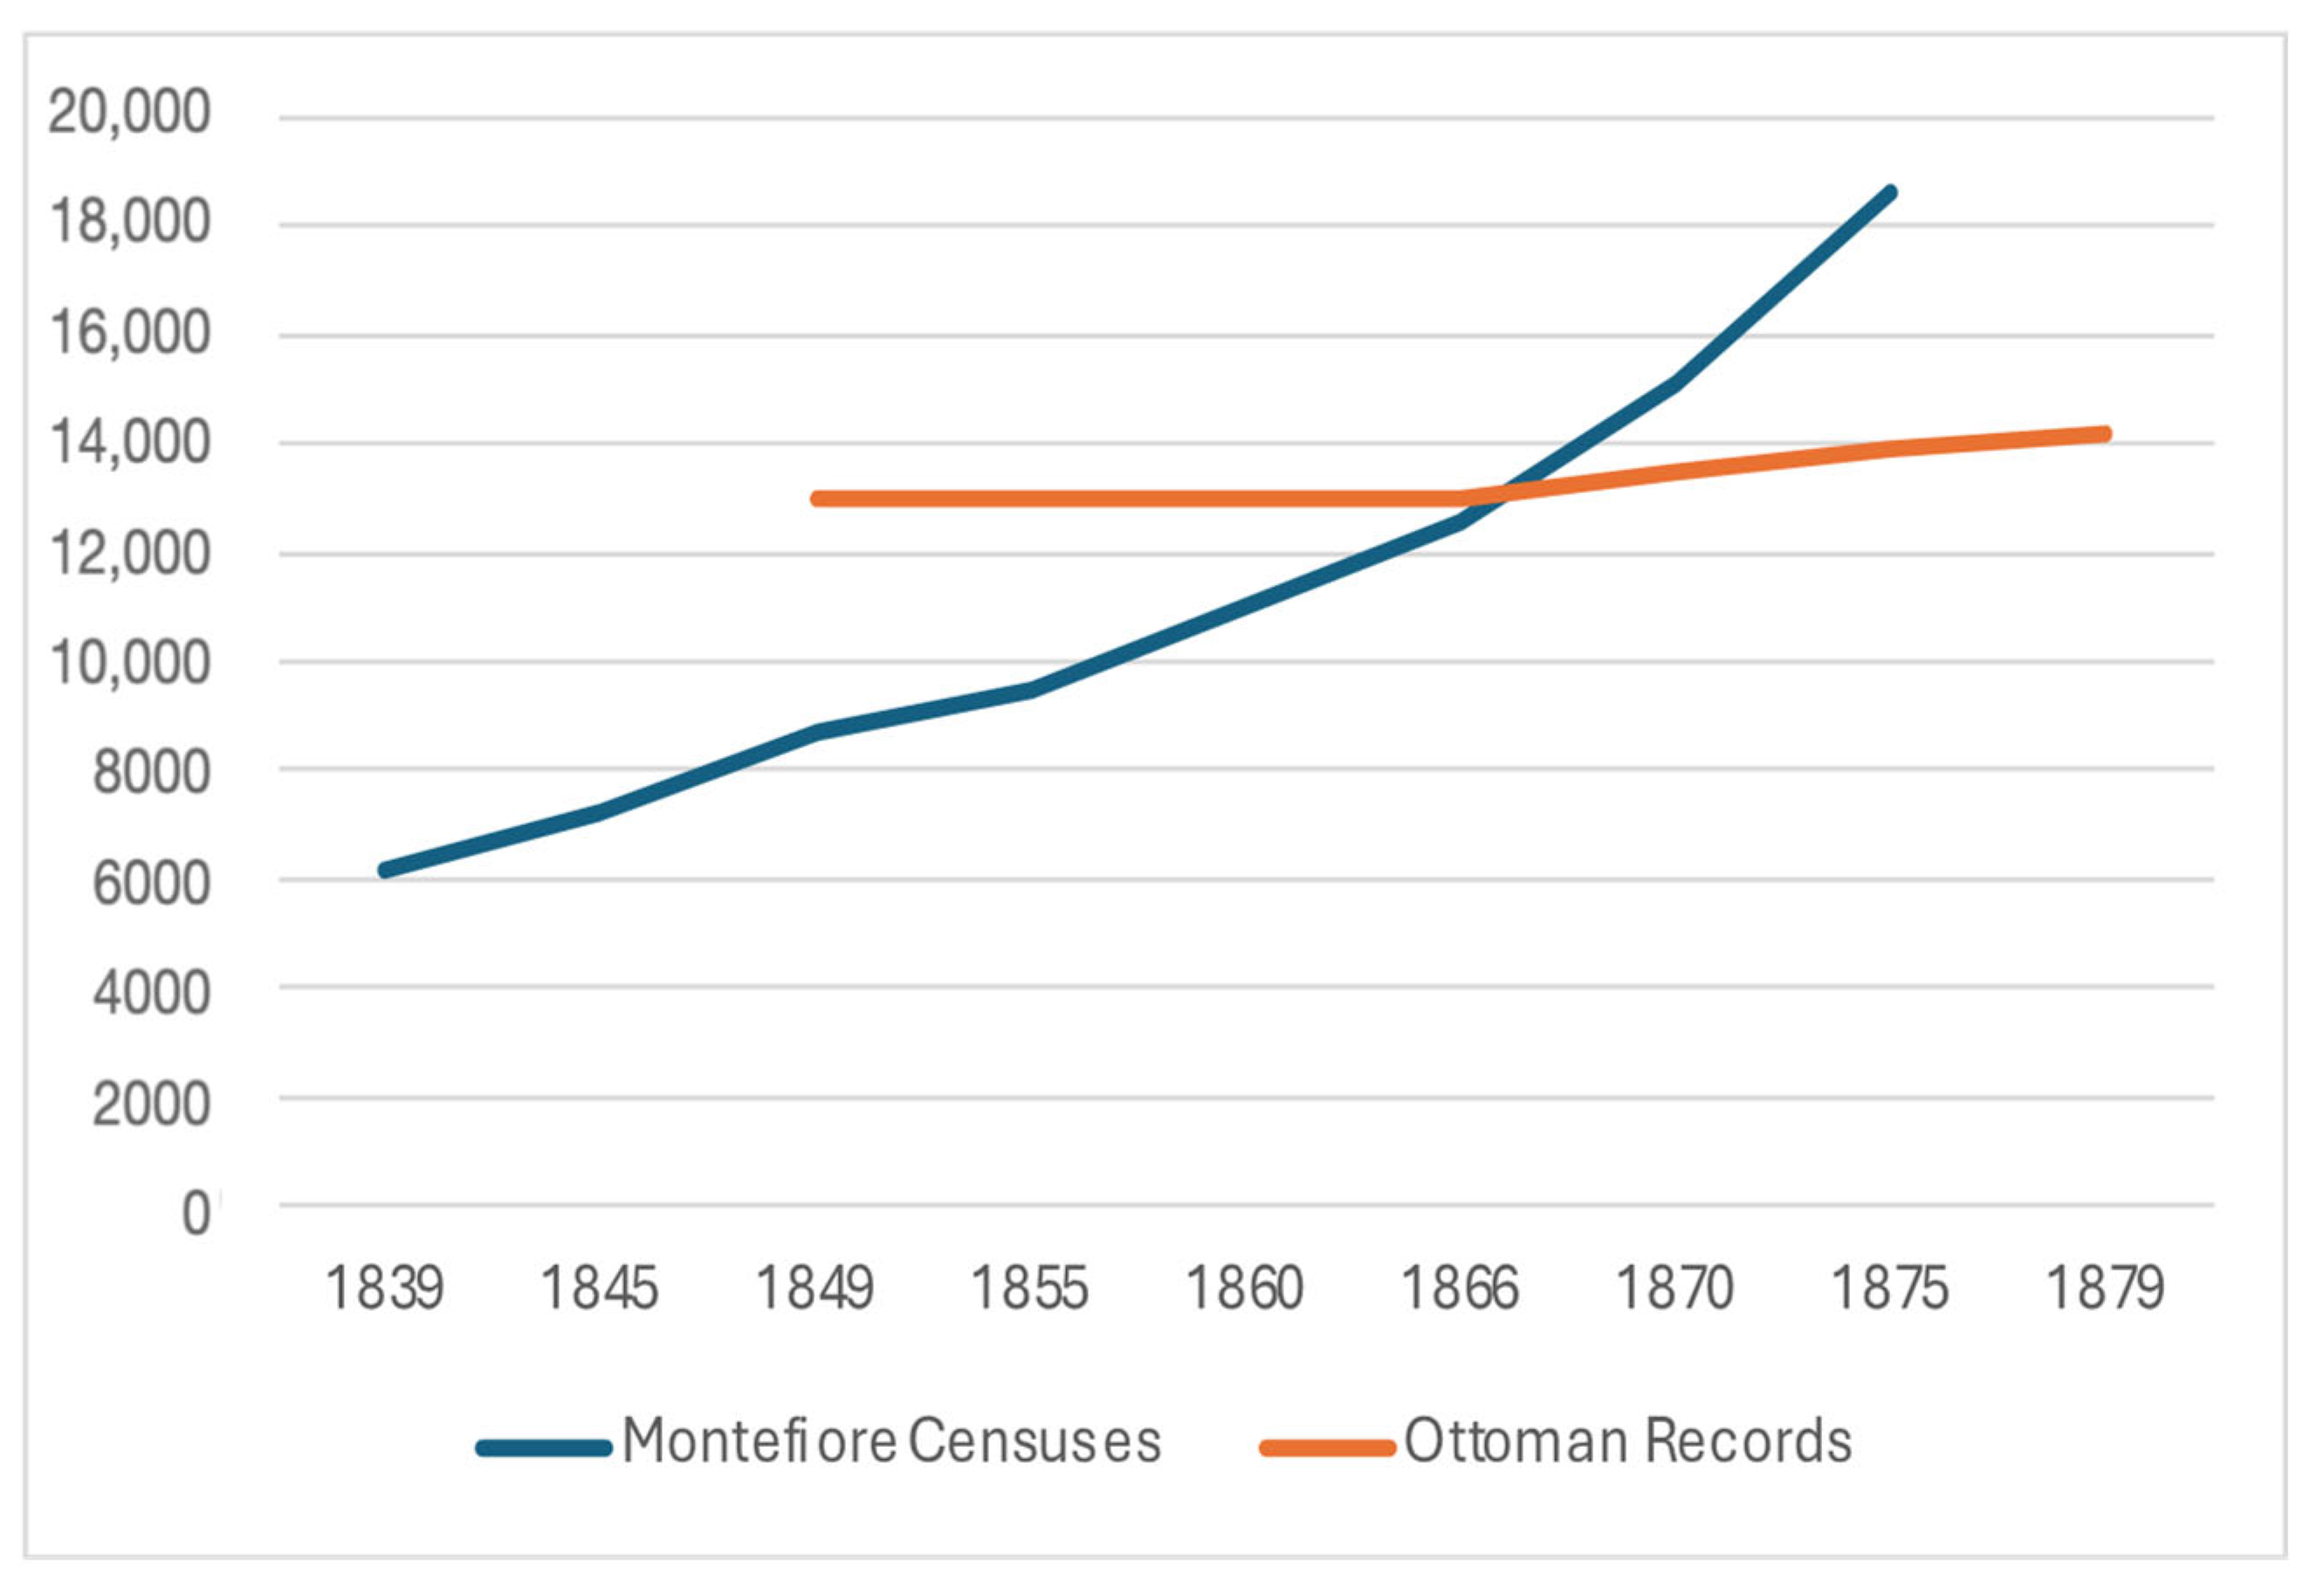
3.2.2. Comparison with Previous Records and Censuses

The presence of Jews in the Land of Israel before the immigration wave commonly known as the First Aliyah of 1882 is poorly documented. The Jewish population in the Land of Israel, as reported by travelers, was estimated to be composed of approximately 10,000 individuals in 1834, 10,000 to 17,000 in 1840, 11,800 in 1845, 10,500 in 1856, and 12,000 in 1868 (McCarthy 1990). Although these estimates by travelers are very uncertain and do not inform on possible population growth, these first published figures on Jewish residents in Palestine are fairly consistent with those derived from Montefiore censuses. Roberto Bachi estimated the total Jewish population at 6700 in 1800, 42,900 in 1890, and 94,000 in 1914 (Bachi 1977). The Jewish population that lived in religious centers, including Jerusalem, Safed and Tiberias, was estimated as follows: 6500 in 1800, 7000 in 1840, 12,750 in 1860, 23,000 in 1880, 34,000 in 1890, 46,100 in 1900, and 57,500 in 1910 (Bachi 1977).
The Ottoman regime continuously recorded Ottoman province population, including Palestine, mostly for tax purposes. However, satisfactory registration of the population of Palestine did not begin until after 1860. Before then, there were sporadic numbering of urban households broken down by administrative divisions, cities and sometimes religion leading to statistical records (McCarthy 1990). The first record reported that included Palestine was that of Syria in 1868–1869. To give a perspective of the Jewish presence in Palestine, we compared the number of Jewish households reported in this first Ottoman statistical report to that of 1866 Montefiore census (Table 2).
Comparing the geographical distributions according to the two sources, the Montefiore census of 1866 shows the clear dominance of the number of Jerusalem over Safed, with Tiberias a distant third. According to the 1868–1869 Ottoman statistics, Safed was by far the largest Jewish center, followed at distance by Jerusalem and Tiberias. Regarding the total households, Hebron appears as the largest city, followed by Gaza, Safed, and Jerusalem. However, the number of 3000 households reported for Hebron seems suspiciously rounded. Round figures, including the Ottoman numbers of Jewish households for Tiberias and Jerusalem, should always be treated with diffidence.
As in other Ottoman provinces, registration did not approach completeness until about 1880. Figure 3 shows the number of Jews and the growth of the Jewish population as derived from Montefiore censuses compared to the number of Jews as interpreted by McCarthy (1990) from the first Ottoman records.
It appears from Table 2 that the number of Jewish households as reported in 1868–1869 and interpreted by McCarthy (1990) was underestimated by more than half. This is probably due to the incompleteness of Ottoman records and the interpretation of McCarthy (which has been criticized by Schmelz (1992), and by DellaPergola (1992)). Although the 1868–1869 Ottoman records were incomplete, they suggest that the number of Jewish households outnumbered the number of other ethnic households in at least two large cities of Palestine (i.e., Safed and Tiberias). The comparison with 1866 Montefiore census suggests that this might also be the case for Jerusalem (Ben Arieh 1984; Schmelz 1987). In contrast, the Jewish presence was minimal in other large cities (i.e., Gaza, Nazareth and Nablus).
Likewise, McCarthy’s (1990) reports on the Ottoman records did not reflect the growth of the Jewish population in Palestine during the second half of the 19th Century (Figure 3) compared to that observed when analyzing Montefiore censuses. This confirms that these records were much less accurate and complete than Montefiore censuses. In his review of McCarthy’s publication, Schmelz (1992) highlights the incompleteness and the inaccuracy of the data published.
Of note, in an attempt to compare the population living in the Land of Israel in 1875, as reported in Montefiore Census, to that reported in Ottoman records, Kessler (2016) used “1871–1872” Ottoman statistics. However, the Ottoman records he used for that comparison were not those of 1871–1872, but rather those labelled “1886–1892” in the work of McCarthy (1990), and thus after the First Aliya had started. Although one might have expected that the growth of the Jewish population would have accelerated during that period, the author reports that it remained much lower than the population censused in the 1875 by Montefiore.
Thus, all comparisons with Ottoman statistics suggest that the recording by Ottoman authorities were incomplete and underestimated the Jewish population living in the Land of Israel during the second half of the 19th century. More interestingly, this suggests that the migration of Jews from European countries, North Africa and the Middle East to the Land of Israel in the 19th century was at least underestimated, if not ignored. As highlighted by Schmelz’s (1992) review, the Montefiore censuses represent more reliable historical evidence of the Jewish presence in the Land of Israel. It clearly shows that the growth of the Jewish population in the Land of Israel in the 19th century was not only the result of natural growth but resulted mainly from the immigration of Jews to the Land of Israel in the 19th century before the so-called First Aliyah of 1882.

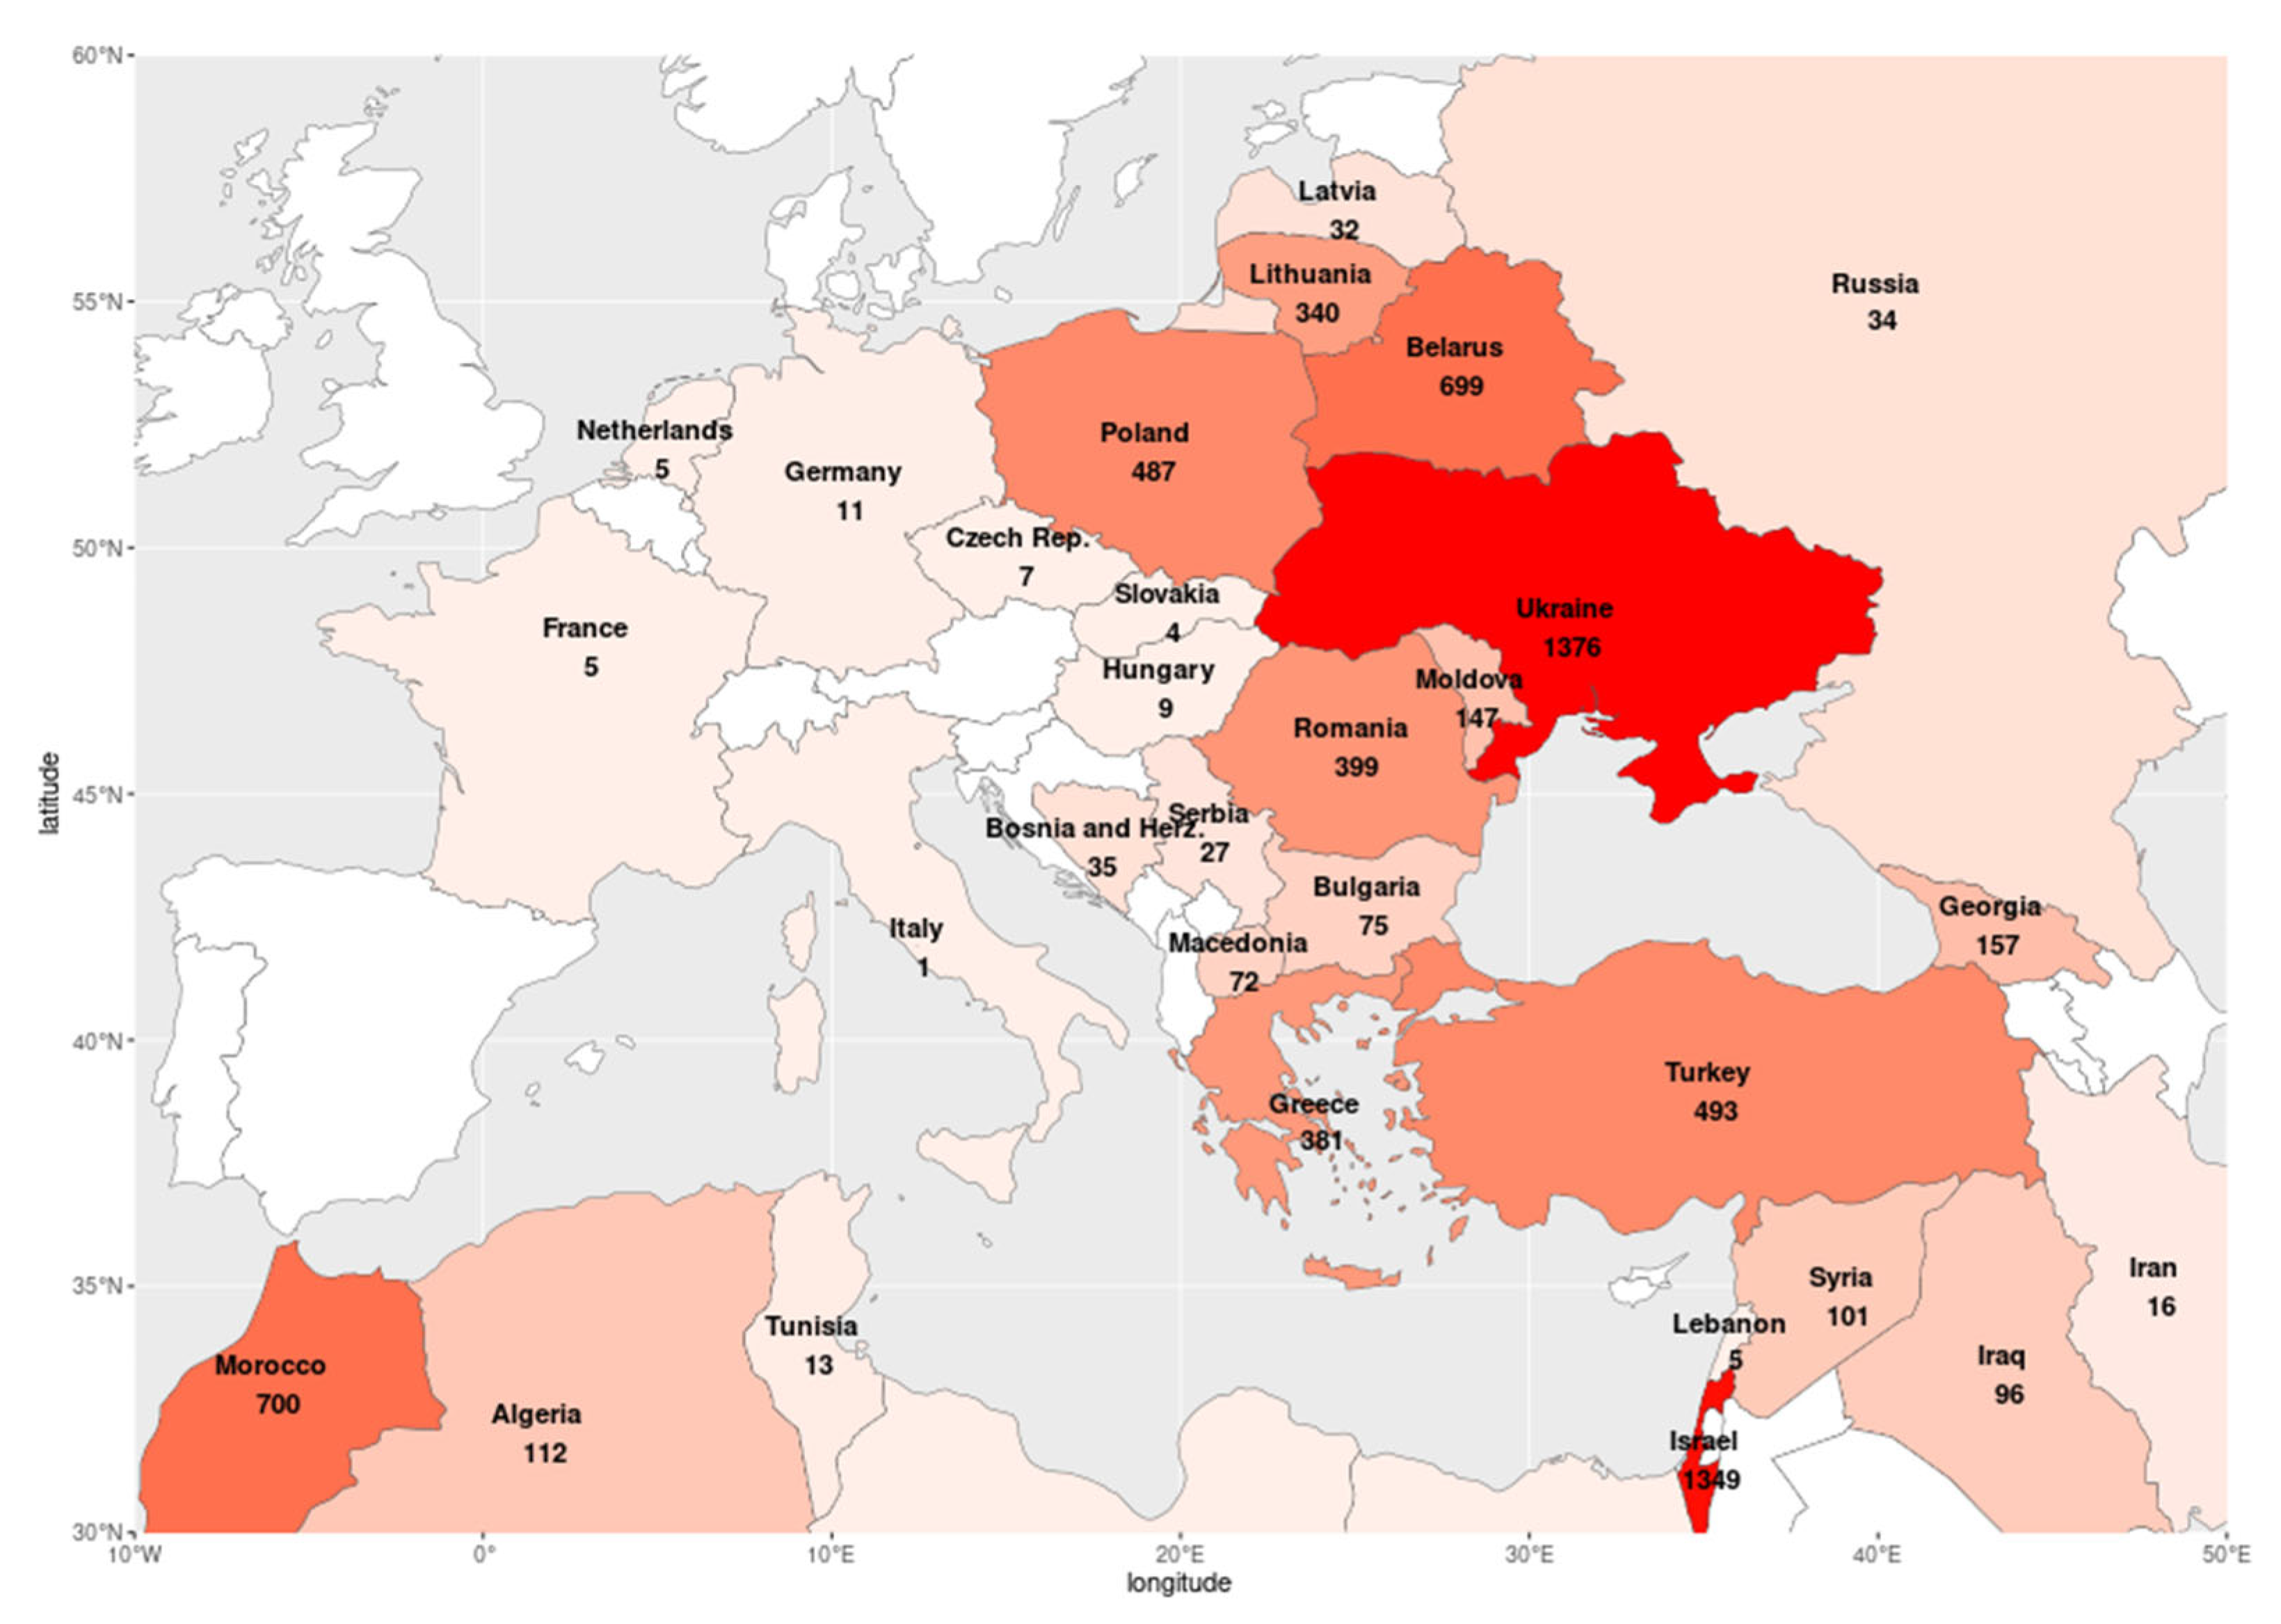
3.2.3. Geographic Distribution of Places of Birth

The place of birth was generally recorded in Montefiore censuses. This allowed for determining the country of birth of the vast majority of HH censused (Table A1) and, where appropriate, determining the country of origin of the whole Jewish population living in the Land of Israel during the 19th century. As the borders of the countries in Eastern Europe changed dramatically in the last 150 years, Montefiore Endowment chose to refer to the present country boundaries in their database. This solution is evidently unsatisfactory for the purposes of the present article. A better solution would be to display at least two maps, one at the time of the earliest census in 1839 and one at the time of the latest census in 1875. However, keeping in mind that boundary changes repeatedly occurred during the specified lag of years, especially in Central and Eastern Europe, and considering the structure of the available database and the need to provide a realistic geopolitical view of the distribution of the Jewish population, we opted for presenting two maps. The first map (Figure 4) presents geographical boundaries as of the situation at the time of present writing. The second map (Figure 5) presents the distribution of the Jewish population in the areas of highest concentration in Europe, according to the administrative boundaries that existed around 1900—at the time of the Russian Census of 1897 and the Austro-Hungarian Census of 1900.
Figure 4 shows the geographic distribution of countries of birth of HH censused in 1875, which has the most comprehensive data.
A few countries are not visible in Figure 4: Gibraltar (8 HH), Caucasus Emirate (1 HH), Saudi Arabia (1 HH), USA (1 HH), India (2 HH), Uzbekistan (10 HH), Yemen (9 HH), and Cuba (6 HH). For 1014 HH out of 8236, we were not able to determine a country of birth (12%).
Figure 5 shows the percentages of Jews among the total population of the regions where most of the Jewish diaspora was concentrated during the second half of the 19th century. The map displays the 7 million (66%) out of 10.6 million Jews who lived worldwide around 1900 (Lestschinsky 1929). It outlines the major internal administrative regions within the Hapsburg and within the Tzarist Empires, with an emphasis on the Eastern areas of the former, and the Western areas of the latter. Outlined in particular is the so-called Pale of Settlement—the area of forced residence for Jews in Russia. The most notable areas with highest relative concentrations of Jews, above 15% of the total population, comprised most of Poland and the whole of Belarus. Other areas with 10% or more of Jews included Poland’s southern areas, Galicia, Bukovina, Moldavia, Lithuania, Volhynia, Kiev, Podolia, Bessarabia, and Kherson. The predominant area of Jewish settlement comprised a large band descending from the Baltic Sea in the Northwest to the Black Sea in the Southeast.
Immigrant Jews were selectively coming into the Land of Israel from the different countries of origin, and from the different provinces within each country. These comprised relatively large groups from Eastern Europe, the Ottoman Empire and the Maghreb. Smaller numbers of immigrants came from communities like Iran, Yemen, Uzbekistan and India. The data suggest that at least a few immigrants came from most existing Jewish communities in the diaspora. In fact, virtually all countries in Eastern Europe, the Balkans, the Middle East, and North Africa are listed, including small numbers for several Western European countries. The Americas are represented by the USA (one entry in 1855) and Cuba (six in 1875). Overall, considering the growing and eventually overwhelming predominance of Eastern European Jews among the total Jewish diaspora in the course and toward the end of the 19th century, one would expect a higher representation of Jews from those areas among the population covered in the Montefiore censuses.
Of note, in the 1875 census, the two main countries of birth of HH are Ukraine (17% of the HH—according to the present boundaries) and the Land of Israel (16%), followed by Belarus, Morocco, Turkey, and Poland, all of which had about 500 or more individuals. In the 1839 census, the country of birth of HH was mainly the Land of Israel (25%), the Ottoman Empire (Turkey, 12%; Greece, 8%) and Algeria (7%). Table A2 lists the largest cities of birth of HH censused in 1875. In 1849, and mostly in 1866, the city of birth was not recorded for a large number of individuals censused; so, these values are lower than the actual figures. Looking at the larger population of the 1875 census, Jerusalem was by far the primary city of birth (726 entries). Other cities of birth with more than 100 entries were Thessaloniki (254), Istanbul (246), Safed (212), Tiberias (158), Rabat (141), Meknes (140), Iasi (119), and Pinsk (117). Vilnius was the city of birth of the majority of the 340 Jews born in Lithuania.
Figure 6 shows the percentage of individuals born in the Land of Israel recorded (out of the total number of individuals with recorded place of birth) in each census. Unsurprisingly, it decreased as the number of immigrants increased (i.e., from the 1839 census to the 1875 census). The number of individuals born in the Land of Israel can be found in Table A3.

3.2.4. Continuity of Residence in the Land of Israel

As the vast majority of Ashkenazim did not declare surnames, continuity of residence across the different censuses could be assessed only in Sephardim with given name and surname.
Out of close to 31,000 entries of Sephardic Jews censused in all Montefiore census, continuity of residence could be determined for 27,900 entries of individual censused for which both given name and surname were reported. By matching given names and surnames and all other family characteristics, we were able to identify 4257 distinct individuals that were censused at two, three, four or all five censuses. They corresponded to 11,011 entries in the censuses. Thus, continuity of residence could be assessed in less than 30% of all the entries of Sephardim, either because the name was too common to be able to distinguish individuals—for instance, there were 2531 entries bearing the surname Cohen of which 146 were “Abraham Cohen”—or because their duration of stay did not span two census dates (i.e., death or return to the country of origin). The details of continuity of residence are shown in Table A4.
Of the 4257 distinct individuals and 1493 distinct HH whose continuity of residence could be assessed through more than one census, respectively, 3604 (84.7%) and 1263 (84.6%) could be retrieved in two or more consecutive censuses. Among the total 1493 households, 59 (4.0%) appeared in all five censuses, 135 (9.0%) in four censuses, 267 (17.9%) in three censuses, and 802 (53.7%) in two censuses.
On the other hand, 653 individuals (15.3%) and 230 HH (15.4%) had a discontinued stay through the censuses period, i.e., they were missing in at least one census in-between two censuses in which they were counted. Although some of these individuals could have temporarily left the Land of Israel, it is unlikely that they all did. It is thus possible that they were missed at one or more census. Likewise, our analysis might have missed few entries of individuals at some time points, but we do not think it was a rule. The most plausible explanation is that either Montefiore censuses were not complete and did not censused the whole population, or some records were lost. This seems to be the case, for example, with the recordings of the entire Sephardic population of Safed in the 1875 census. Thus, our analysis suggests that the records of a fairly large number of individuals were not located and are missing from the Montefiore Endowment site either because these individuals were not censused or because their records were lost.
In addition, when assessing the continuity of residence by checking presence of given surnames throughout consecutive censuses, it appears that about 10% of the surnames that were recorded at two or more censuses were not recorded in between two censuses. Most of the time, the census in which they were not recorded was the 1866 census. This further supports the assumption that the census coverage—mostly the 1866 census—was incomplete and that the Jewish population in the Land of Israel was probably underestimated on that occasion.

3.2.5. Duration of Stay in the Land of Israel

The approach used to estimate duration of stay in the Land of Israel was similar to that used to assess continuity of stay. As for continuity of stay, it could be only assessed for Sephardim (4257 distinct individuals out of 31,000 entries). Table A5 shows the dates at which these individuals were censused and Figure 7 shows the approximate duration of stay.
As length of stay of individuals being present (i.e., censused) in the Land of Israel in 1875 does not reflect accurately duration of stay, we deliberately excluded them and considered only individuals that were last censused in 1866 in the present analysis to assess most common and average length of stay. These corresponded to 2257 Sephardim out 4257 for which duration of stay could be assessed. The most common length of stay ending mostly in 1855 or 1866 was 10 years, and the average length of stay was approximately 11.5 years.
More than 50% of individuals and HH (respectively, 53% and 57%) for whom duration of stay could be assessed were not reported in the 1875 census, suggesting that they either left the Land of Israel to go back to their original country or died before 1875.

3.2.6. Retrospective Insights on Jewish Population Size

Data on duration of stay of HH born in the Land of Israel allow for a retrospective evaluation of the Jewish presence in the Land of Israel before 1810. Of note, HHs who appeared in more than one census were counted once. In all five censuses, there were 589 distinct HH born in the Land of Israel between 1749 and 1809 (315 in 1839, 71 in 1849, 145 in 1855, 31 in 1866 and 27 in the 1875 census). The vast majority were Sephardim and only 34 HH were Ashkenazim (6%). The reported cities of birth of HH born in the Land of Israel before 1809 was Jerusalem (51%), Safed (12%), Hebron (10%), Acre (8%), Tiberias (5%), Pekiin (5%), Shfaram (5%), and Gaza (2%).
According to McCarthy (1990) and other authors, the Jewish presence in Palestine before 1800 was limited to a small Jewish community descending from refugees of the Iberian Peninsula and infused by Jewish pilgrims and students who came to the Holy Land to study and pray or to die. They were primarily urban, living essentially in Safed, where the religious Jews gathered, but also in Jerusalem, Hebron and Tiberias. According to Beider (2023), the Jewish population of the Land of Israel was concentrated in five cities (i.e., Jerusalem, Safed, Hebron, Acre and Tiberias) and about 5000 Jews lived in Jerusalem in 1770. While the Montefiore censuses were intended to determine the needs of the Jews living in the land of Israel by counting the Jewish population, the Ottoman censuses and statistics were primarily intended to collect taxes. It is likely that, for this reason, some Jews were reluctant to be registered by the Ottoman authorities. Furthermore, it seems that women and children were not included in some of these statistics. This probably explains why Ottoman censuses and statistics are imprecise and incomplete.
However, even if the number of Jews was underestimated in Ottoman statistics, it nevertheless gives an approximation of the proportion of Jews compared to the general population in the region. Thus, in 1868–1869, the proportion of Jews in the urban part of the Land of Israel was about 14%, if we refer to Ottoman statistics (McCarthy 1990). Some cities, such as Safed and Tiberias, according to the McCarthy study, were predominantly Jewish. Furthermore, in 1882 (McCarthy 1990), the proportion of Jews in the provinces of Jerusalem, Tiberias and Balqa compared to the total population would have been of the order of 2.3%, with the highest percentages observed in Jerusalem (9%) and Tiberias (13%). It should be noted in this regard that, in his comparisons with the Ottoman census of 1886–1892, Kessler (2016) overestimated the percentage of Jews by reporting only the number of men in the overall population, omitting women. McCarthy’s estimates, too, are not entirely free from inconsistencies (DellaPergola 1992).
Although Jews were more willing to be counted by Sir Montefiore’s representatives since they were to receive monetary compensation, some, for religious reasons, refused to participate in the censuses. According to the Montefiore Endowment, this represented a small proportion of the Jewish population. However, the data on continuity of residence in the Land of Israel (see Section 3.2.3) clearly show that Montefiore’s censuses were not complete and/or suggest that some records were lost. For instance, while the number of Sephardi households censused in Safed was greater than 1200 in 1866, none were censused there in 1875 (Table A8). Likewise, while the number of Ashkenazi households was 1050 in 1866, it was only 391 in 1875. If one adds to this the cities that were not censused at all dates and the data on discontinuity of residence, one can consider that the Jewish population of the Land of Israel was underestimated by 15 to 20% in the Montefiore censuses.
According to our estimate, the Jewish presence in the Land of Israel during the 18th century and before the waves of migration of the 19th century amounted to 2000–3000 persons. This population was essentially made up of Sephardic Jews. It was probably not limited to pilgrims or students.

3.3. Demographics

3.3.1. Jewish Population Size

As noted above, the Montefiore censuses testify to a growing Jewish population, the respective totals being as follows: 6178 in 1839, 8722 in 1849, 9474 in 1855, 12,584 in 1866, and 18,624 in 1875. The total number of individuals censused—including multiple counts—was therefore 55,582.

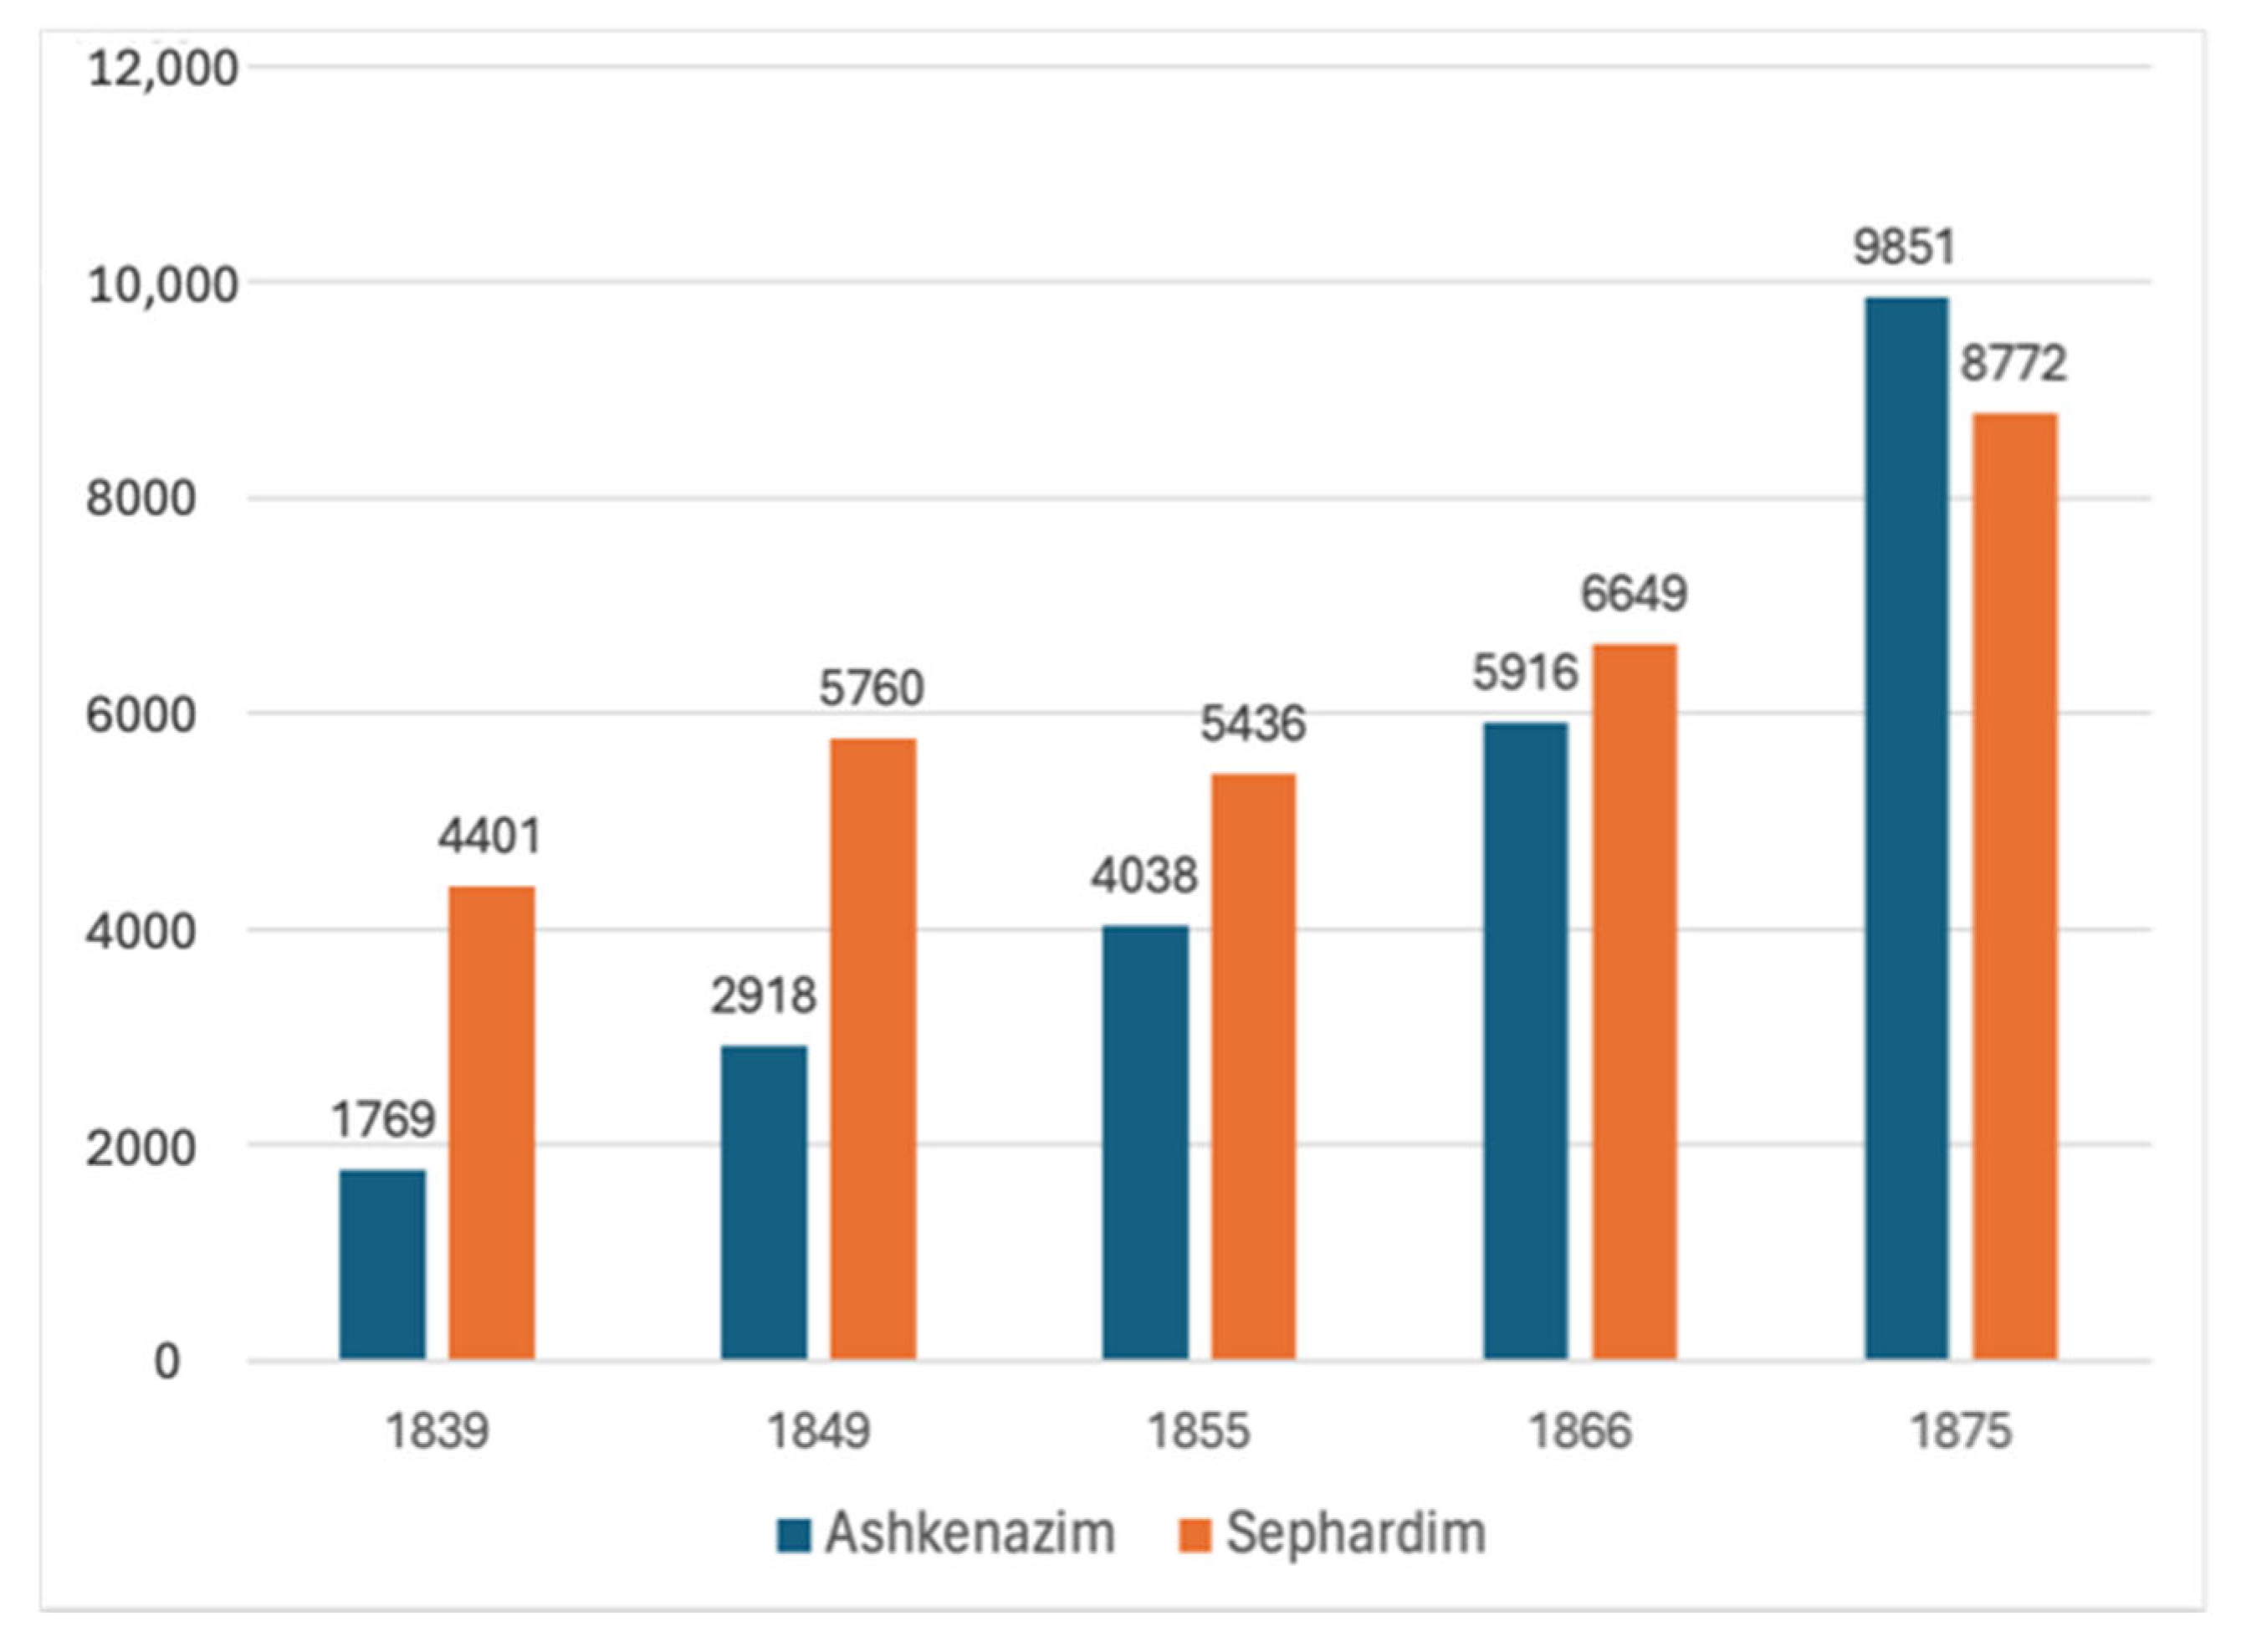
3.3.2. Number of Ashkenazim and Sephardim per Census Year
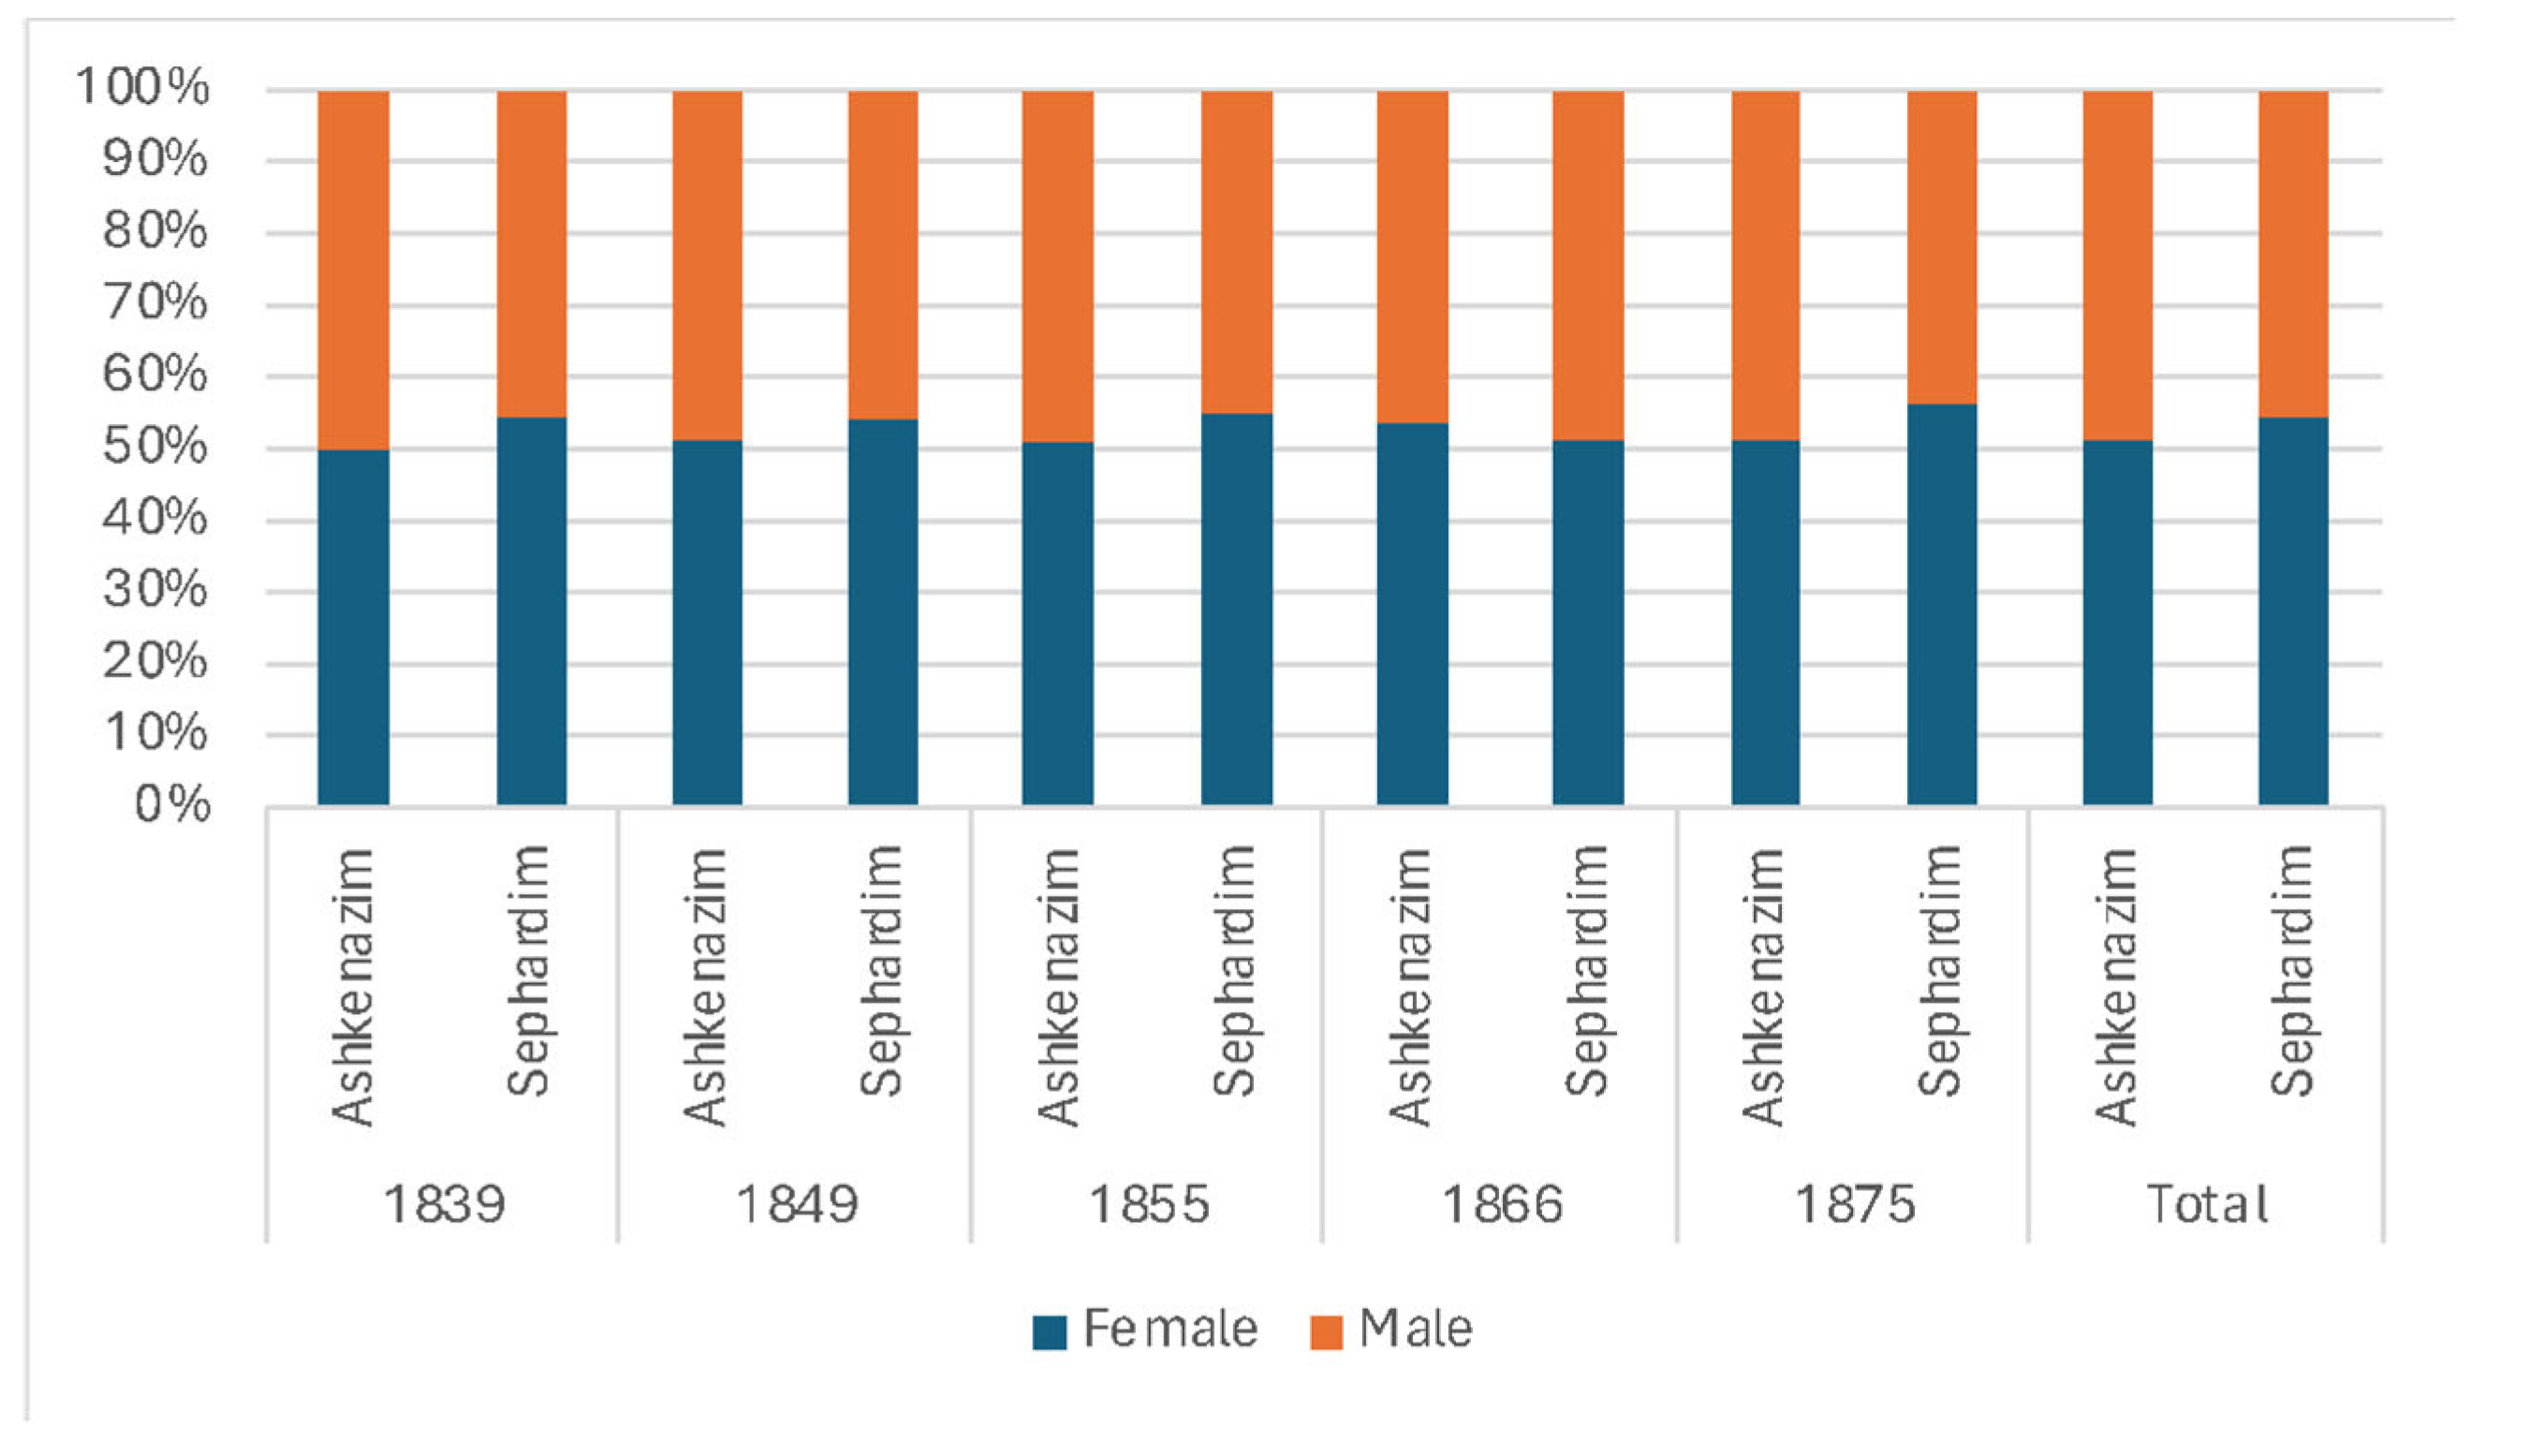
The number of Ashkenazim and Sephardim are reported in the Montefiore censuses (see Figure 8). As mentioned in the Methods section, following Montefiore census rule, we recorded everyone outside the Ashkenazi communities as Sephardim, which included not only North African Jews but also Mizrahim from Iraq, Iran, Syria, etc.
Although similar to those published by Kessler (2016), these figures are slightly different than those published by Beider (2023), who, in his analysis, made a distinction between “Sephardi”, “Maghrebi” (i.e., North African Jews) and “Georgian”. However, although this distinction is ethnographically correct, it does not reflect the reality as not all Jews of North African origin identified themselves as Maghrebi. In addition, the Maghrebi community started to organize itself only in 1849 and no data for this community are available in the 1875 census. As a result of this distinction, Beider (2023) concludes that the Ashkenazim already outnumbered Sephardim in 1866. In our opinion, and according to Figure 8, it is only in 1875 that the number of Ashkenazim exceeded that of broadly defined Sephardim, inasmuch as Sephardim living in Safed in 1875 were not included in the census of 1875 (Table A8).
The increase in the population observed throughout the five censuses was mainly due to immigration. Interestingly, the number of Sephardim increased between the first and last census by a factor of 2.0 over 36 years, while the growth of the Ashkenazim was much larger and increased by a factor of 5.6 in that same period. This difference highlights that the immigration waves of Ashkenazim were larger than those of Sephardim.

3.3.3. Gender

The gender distribution was fairly constant, about 50% for both sexes (Figure 9). In all censuses, the percentage of women in the Sephardi community was slightly above 50% and larger than in the Ashkenazi community. This is consistent with the larger number of Sephardic widows, as described in the work of Ben Ya’akov (2006).

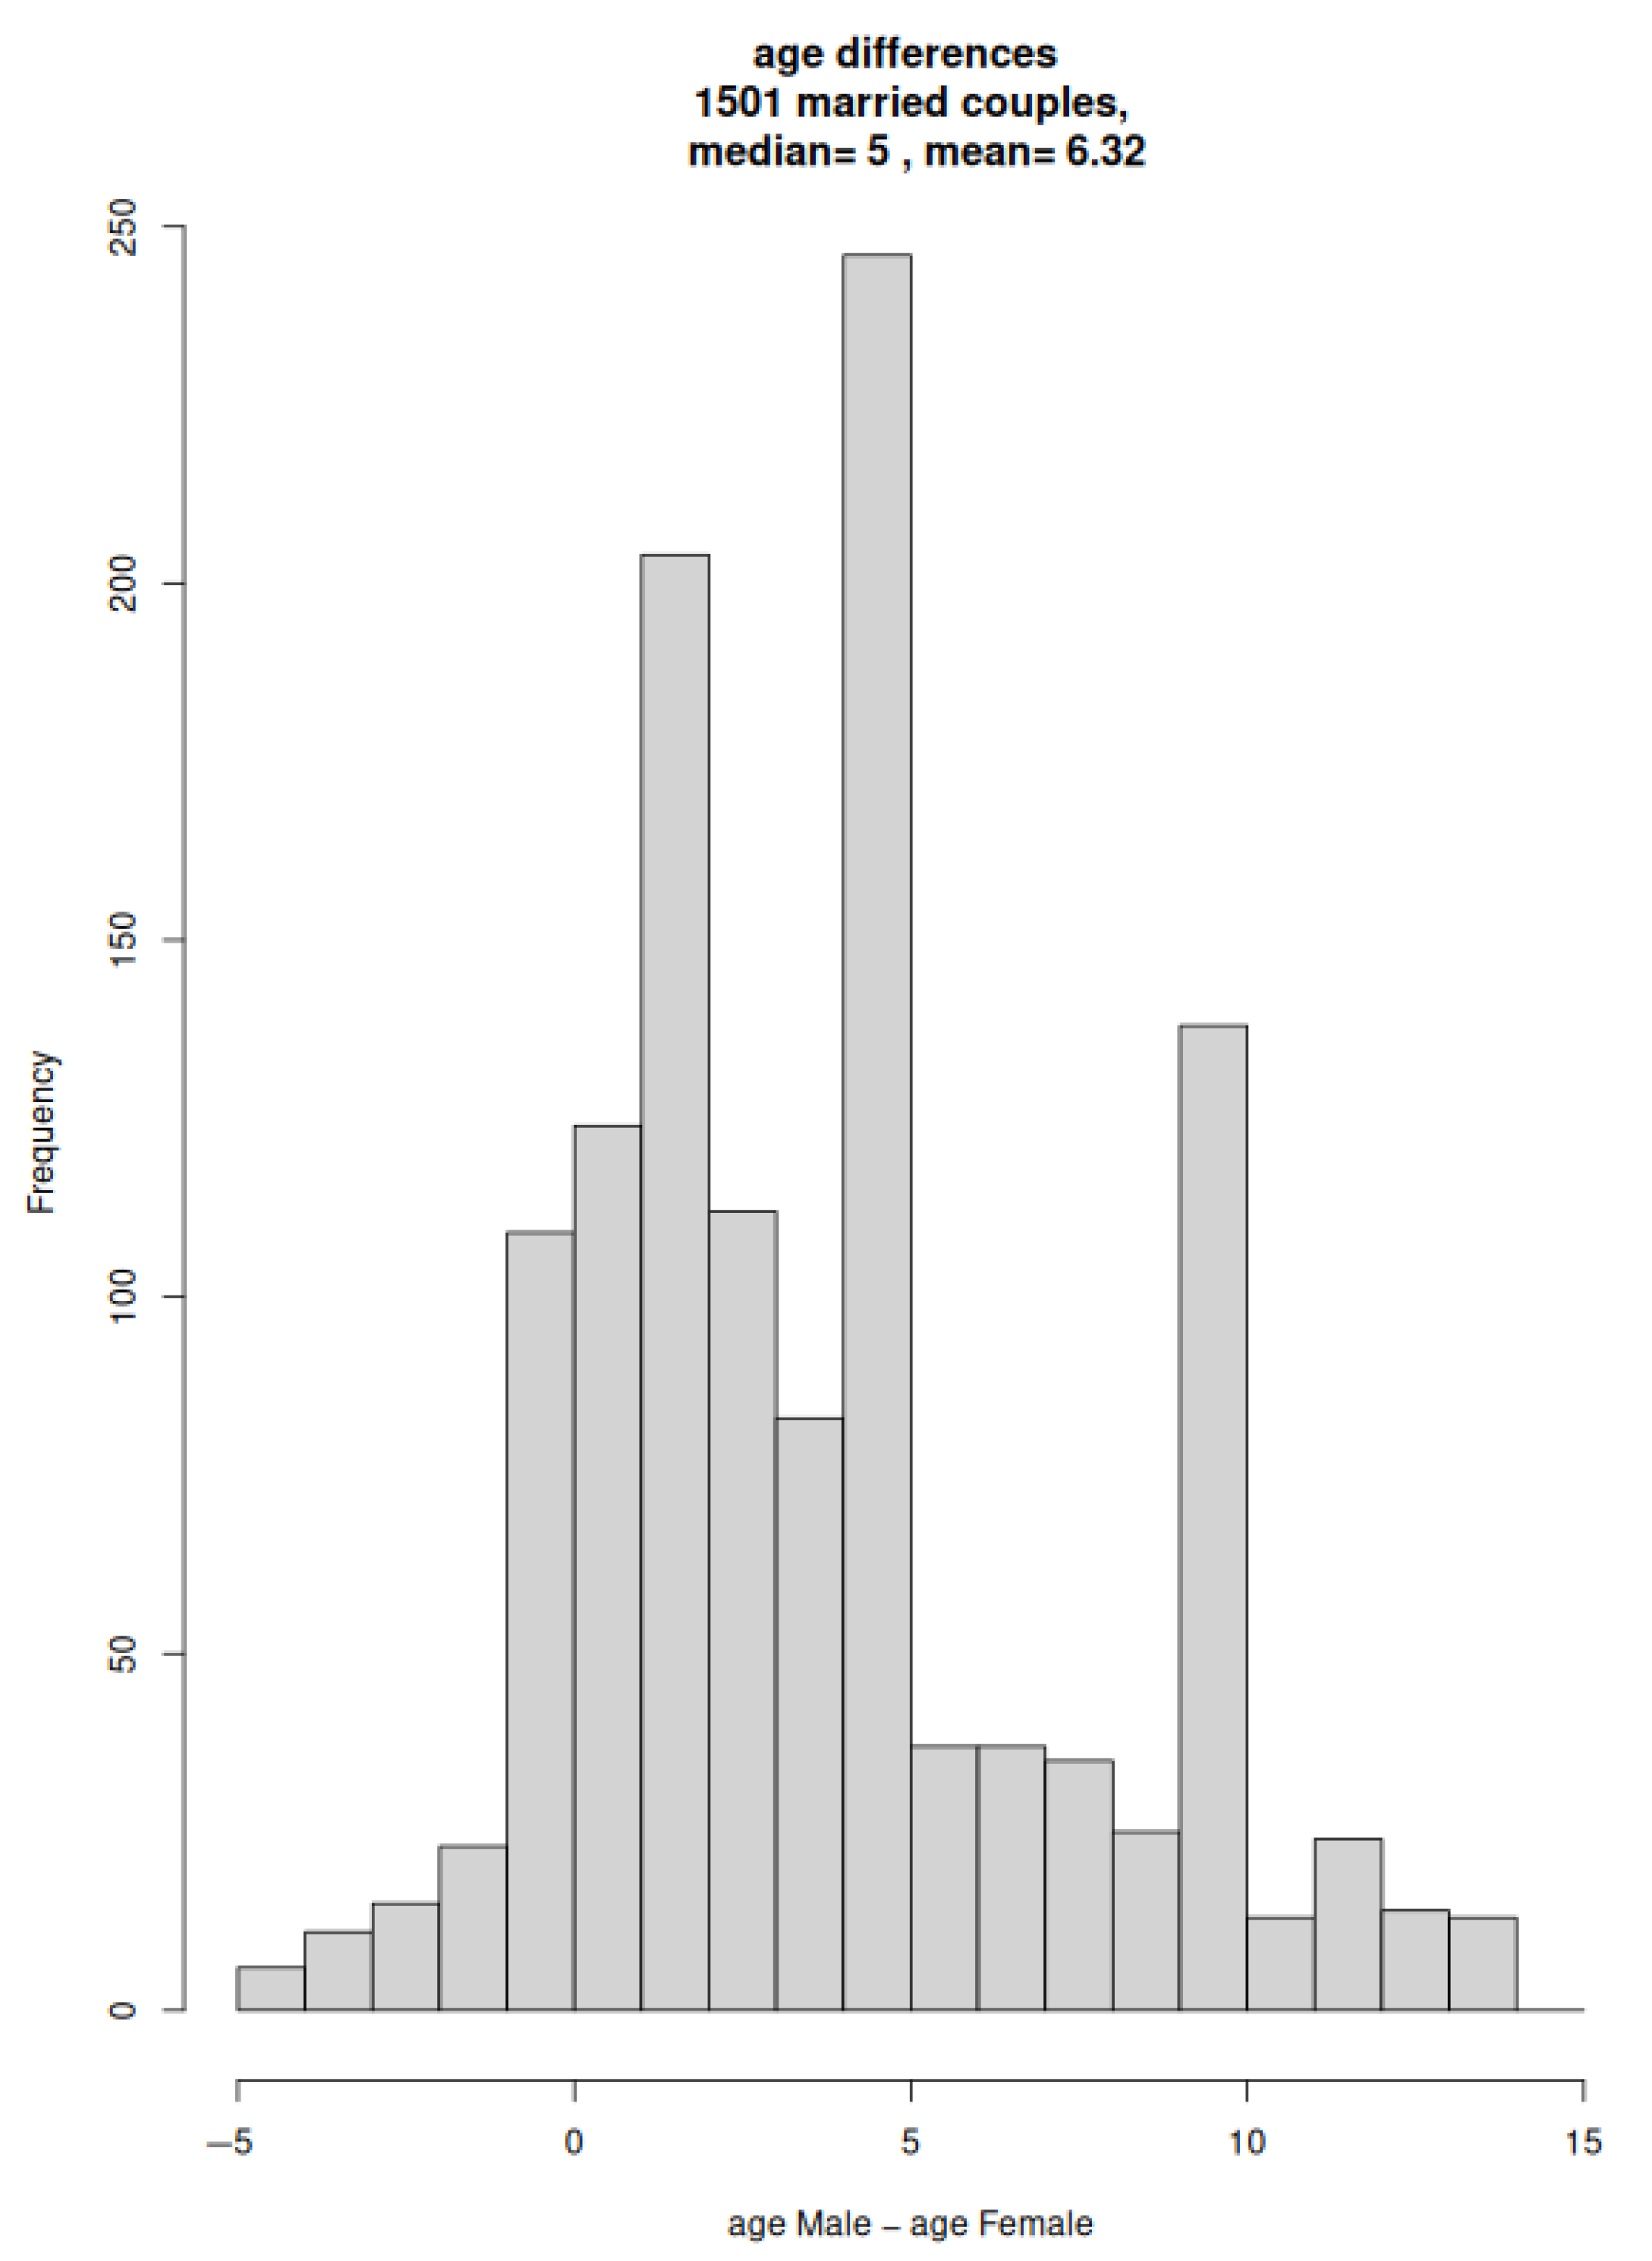
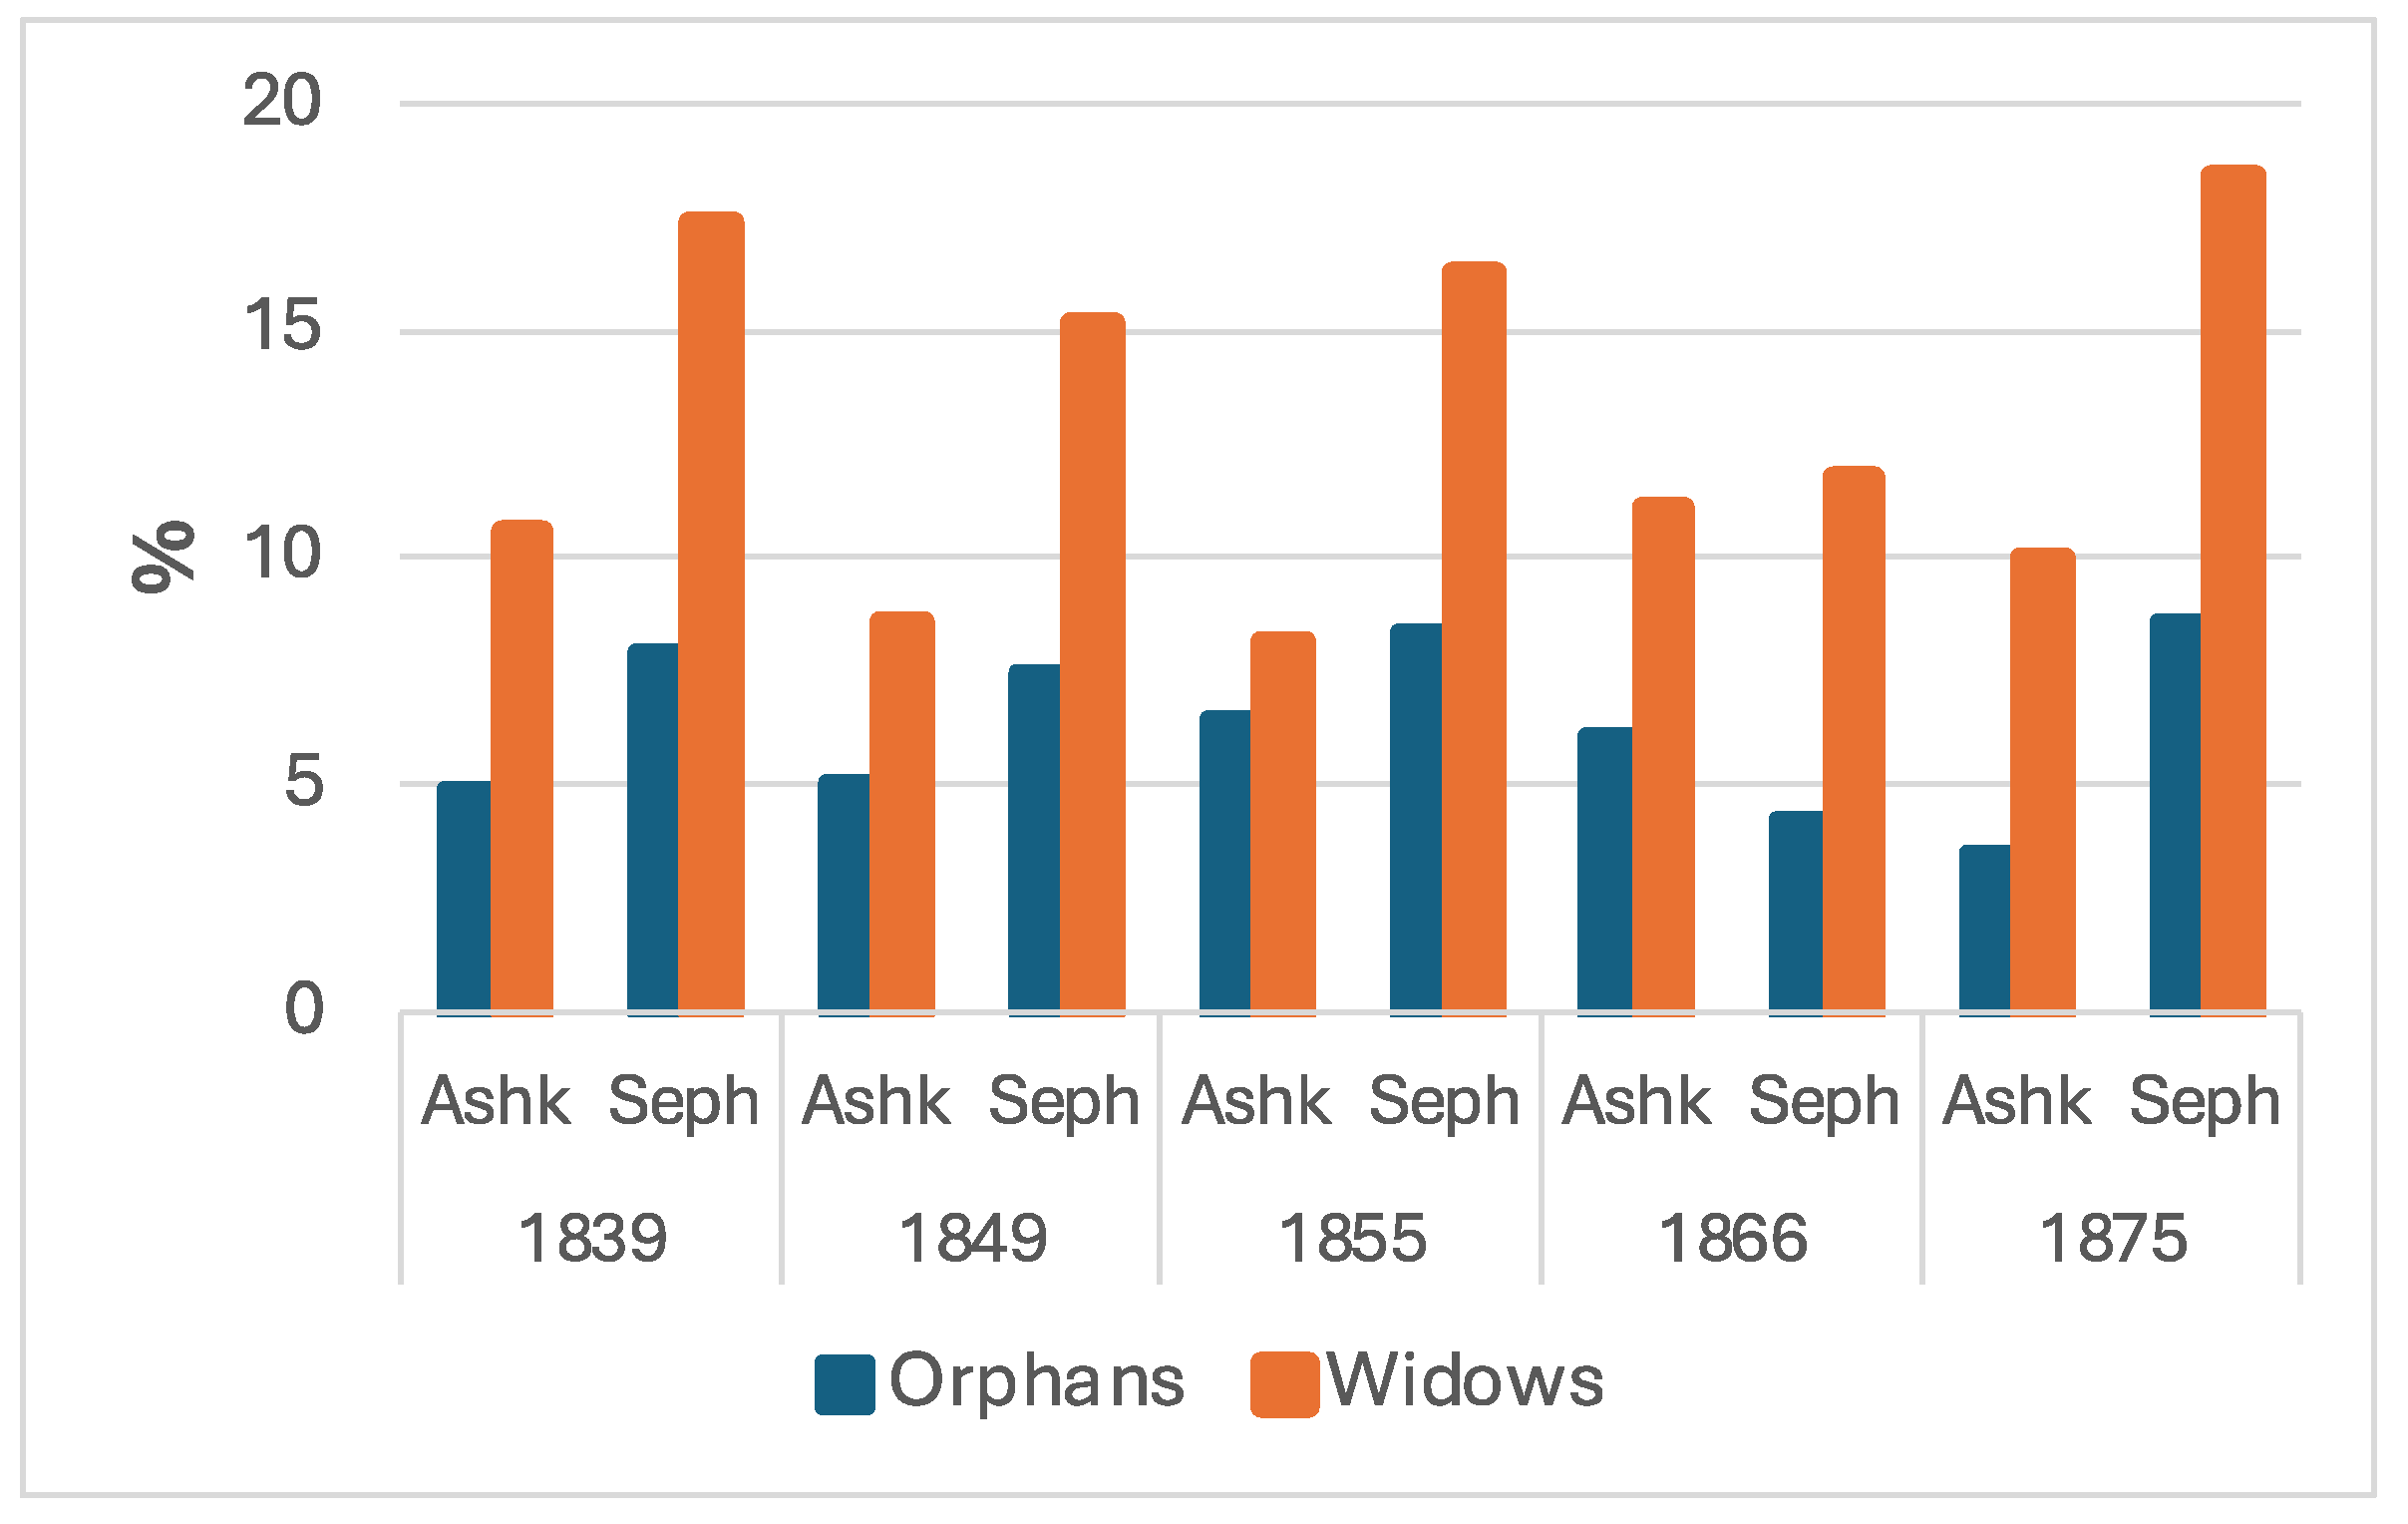
3.3.4. Marriage and Marital Status

Figure 10 reports the ratio of unmarried men and women among younger adults (aged more than 15 and less than 50) at each census and among the elderly people (individuals aged more than 50) in all censuses combined. The absolute numbers can be found in Table A7. The unmarried individuals reported here comprise all men and women described as ‘single’ in the censuses and identified as never-married. Widowers, widows, and all individuals living with their children (even if categorized as ‘single’ in a census) were not included.
Figure 10 clearly shows that among younger adults aged 15–50, unmarried men sharply outnumbered by far unmarried women. The percentages never-married among men, ranging between 10–15% and 20–25%, appear to be extremely high when compared to similar Jewish populations in a variety of geographical environments in the 19th century (DellaPergola 2024b). In fact, according to Jewish tradition, marriage was normatively mandatory and a great effort was deployed to find suitable marriage partners to each adult male and female, including through the active intermediary of match-makers. Even when age at marriage was higher among Jews in comparison with the non-Jewish environment, the eventual proportion ever-married was generally higher, approaching or surpassing 95% in Middle Eastern countries. The proportions of final bachelorhood in the range observed in the present data were sometimes observed among Jews in Central or Western Europe during the second half of the 19th century.
On the other hand, the very low shares of never-married women covered in the Montefiore censuses, never reaching 5% of younger adults, are consonant with prevailing Jewish marriage patterns in the past—especially among the more traditional strata. This would suggest that men might have immigrated to the Land of Israel young and unmarried and alone, while most women, excluding widows, arrived while already married. However, the percentage unmarried (overall and per census) of foreign-born men is very similar to that born in the Land of Israel.
In turn, the number of widowers is too small to be realistic. For example, in 1875, the number of reported widowed males is 1, 4, 4 in the age groups 40–50, 50–60 and 60+, while the number of singles is 27, 27 and 127. If we compare these figures with (female) widows, the gender gap seems unrealistic. We should consider the scenario that many were widowers but reported as single males. In other words, we should be aware that the registration may carry inaccuracies that we cannot control.
Figure 11 shows the detailed age combinations for 1501 married women with known age couples across all five censuses. It clearly appears that—reflecting a common pattern—husbands were generally older than wives. The average age among total married individuals across all five censuses together was 43.1 for 11,310 husbands with known age, and 38.3 for 1520 married women with known age. Of note, the age of men was more often reported than that of women, because men were more often HH (for which the reported data were generally more complete) than women. The median ages were 41 for husbands and 36 for wives. Therefore, husbands were older by about five years than wives on average. These data refer to all extant couples, regardless of possible remarriages. However, the detailed display shows a great variety of age combinations, including many couples with smaller age gaps, along with couples with husbands significantly older than their wives, and a minority of cases with wives older than husbands.
The total age gaps are synthetized in Figure 12. As noted, in the vast majority of couples (86.3%), the man was older than the woman, the opposite combination appeared among 6.5% of the couples, and in 7.2% of couples, both spouses were of the same age. The woman was older than the man by 5 years or less among 5.3% of couples, and by 6 years or more among 1.2% of couples, and the largest age gap involving an older woman was by 16 years. When the man was older than his wife, the most frequent age gap was 1 to 5 years (51.2% of couples), followed by 6 to 10 years (18.1% of couples), 11 to 15 years (7.2% of couples), 16 to 20 years (4.3% of couples), and more than 20 years (5.5% of couples), with the largest age gap being 48 years.
Another typological category of family status in Montefiore censuses was the orphans—to some extent related to young age and childhood. Figure 13 compares the ratio of orphans and widows of Sephardim and Ashkenazim communities to their respective total population.
Orphans appeared to constitute between 5% and 10% of the total population. Widowers ranged between 10% and 20% of the total. The ratios of orphans and widows (Figure 13), as well as their absolute number (Table A9), were generally higher in Sephardic communities compared to Ashkenazi communities, most significantly so in the case of widows.

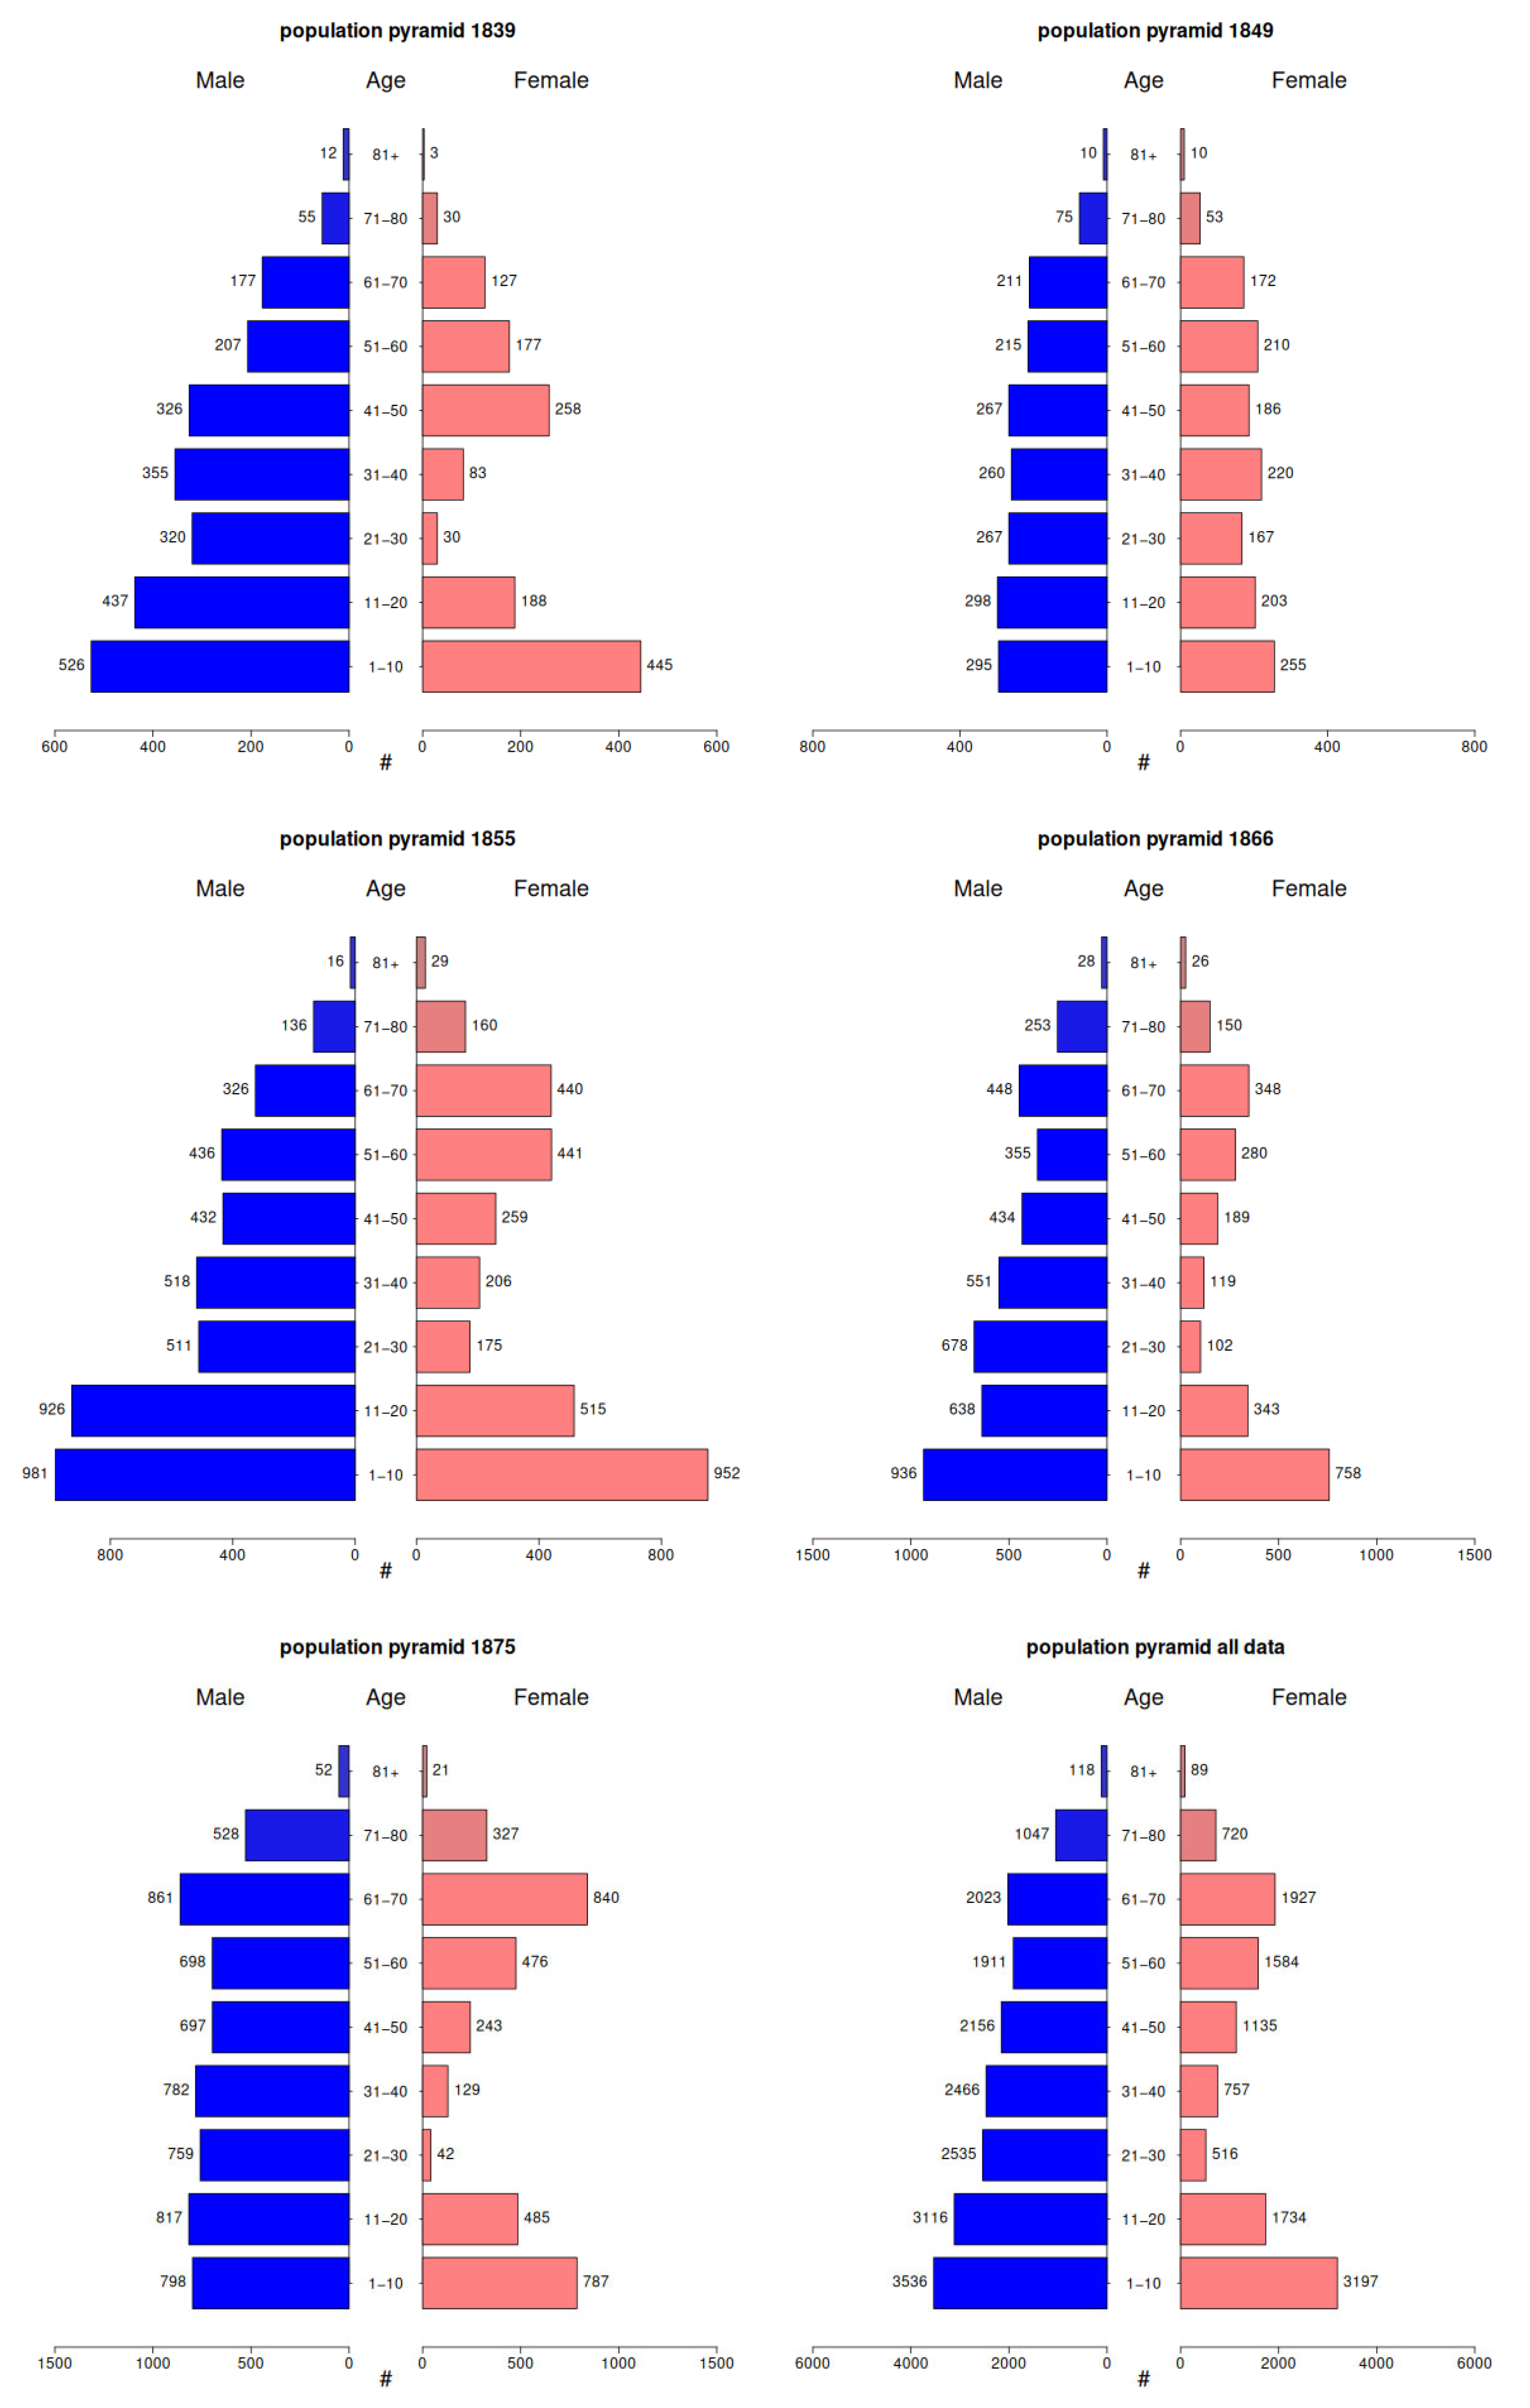
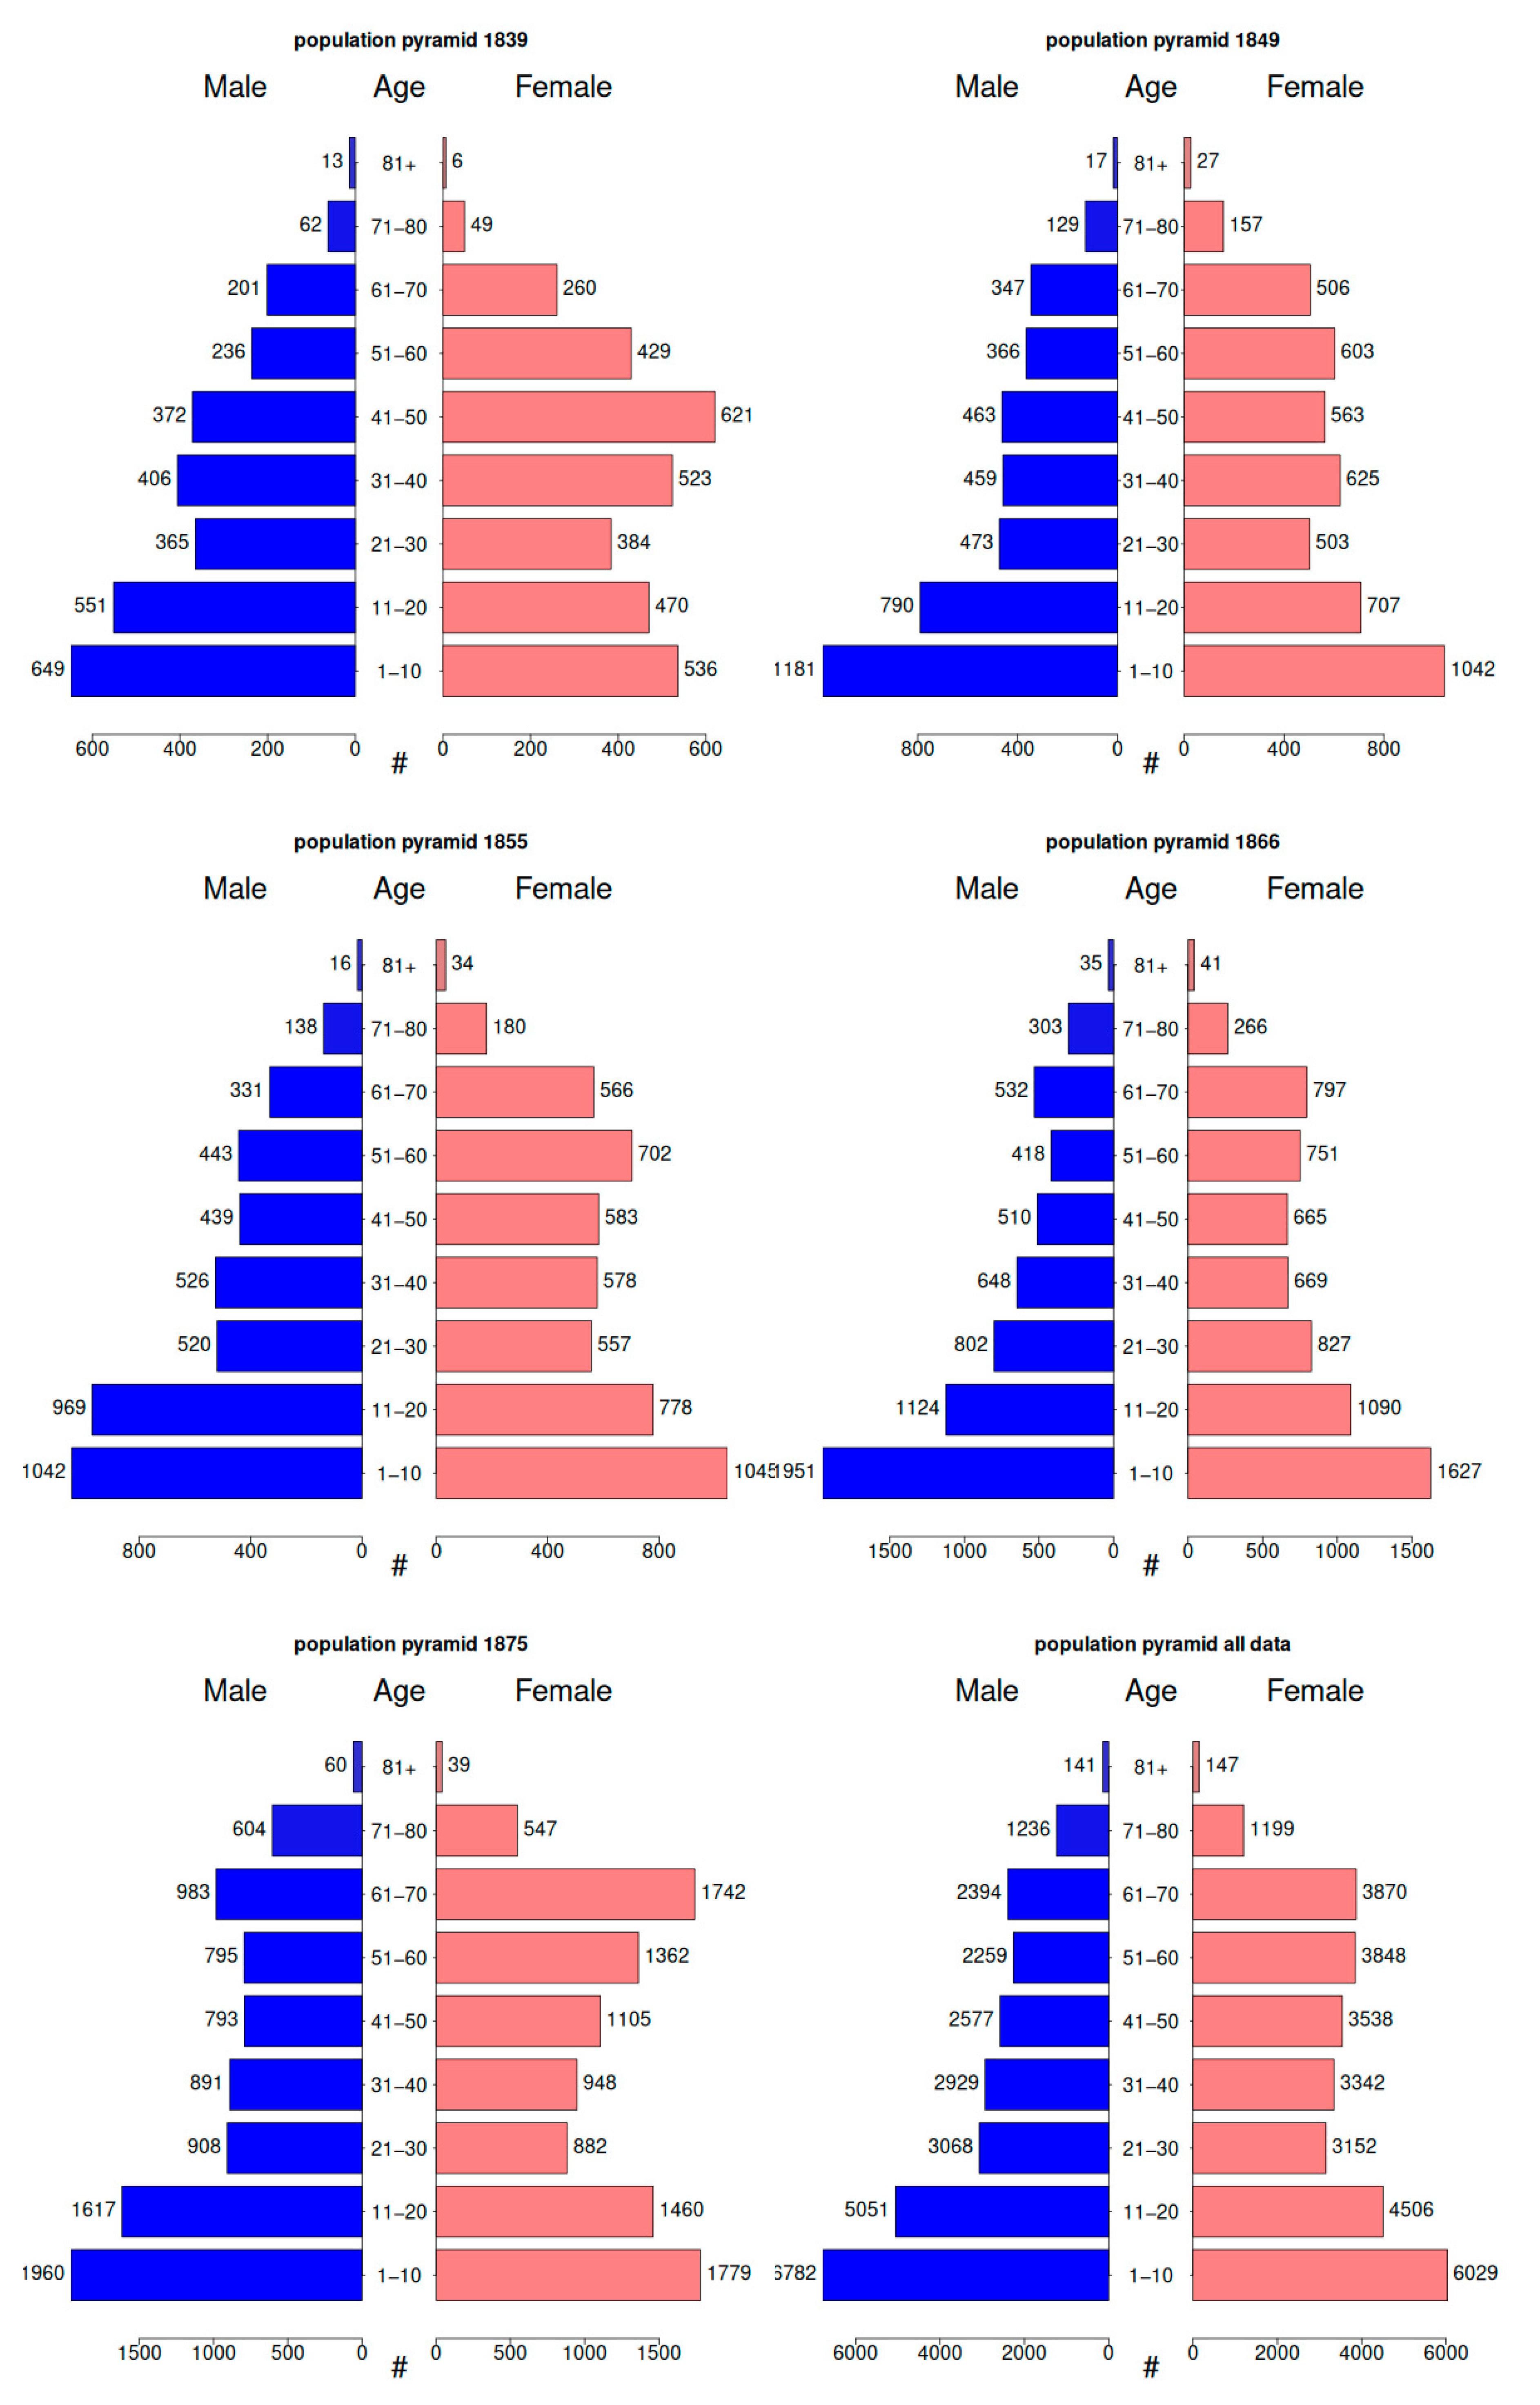
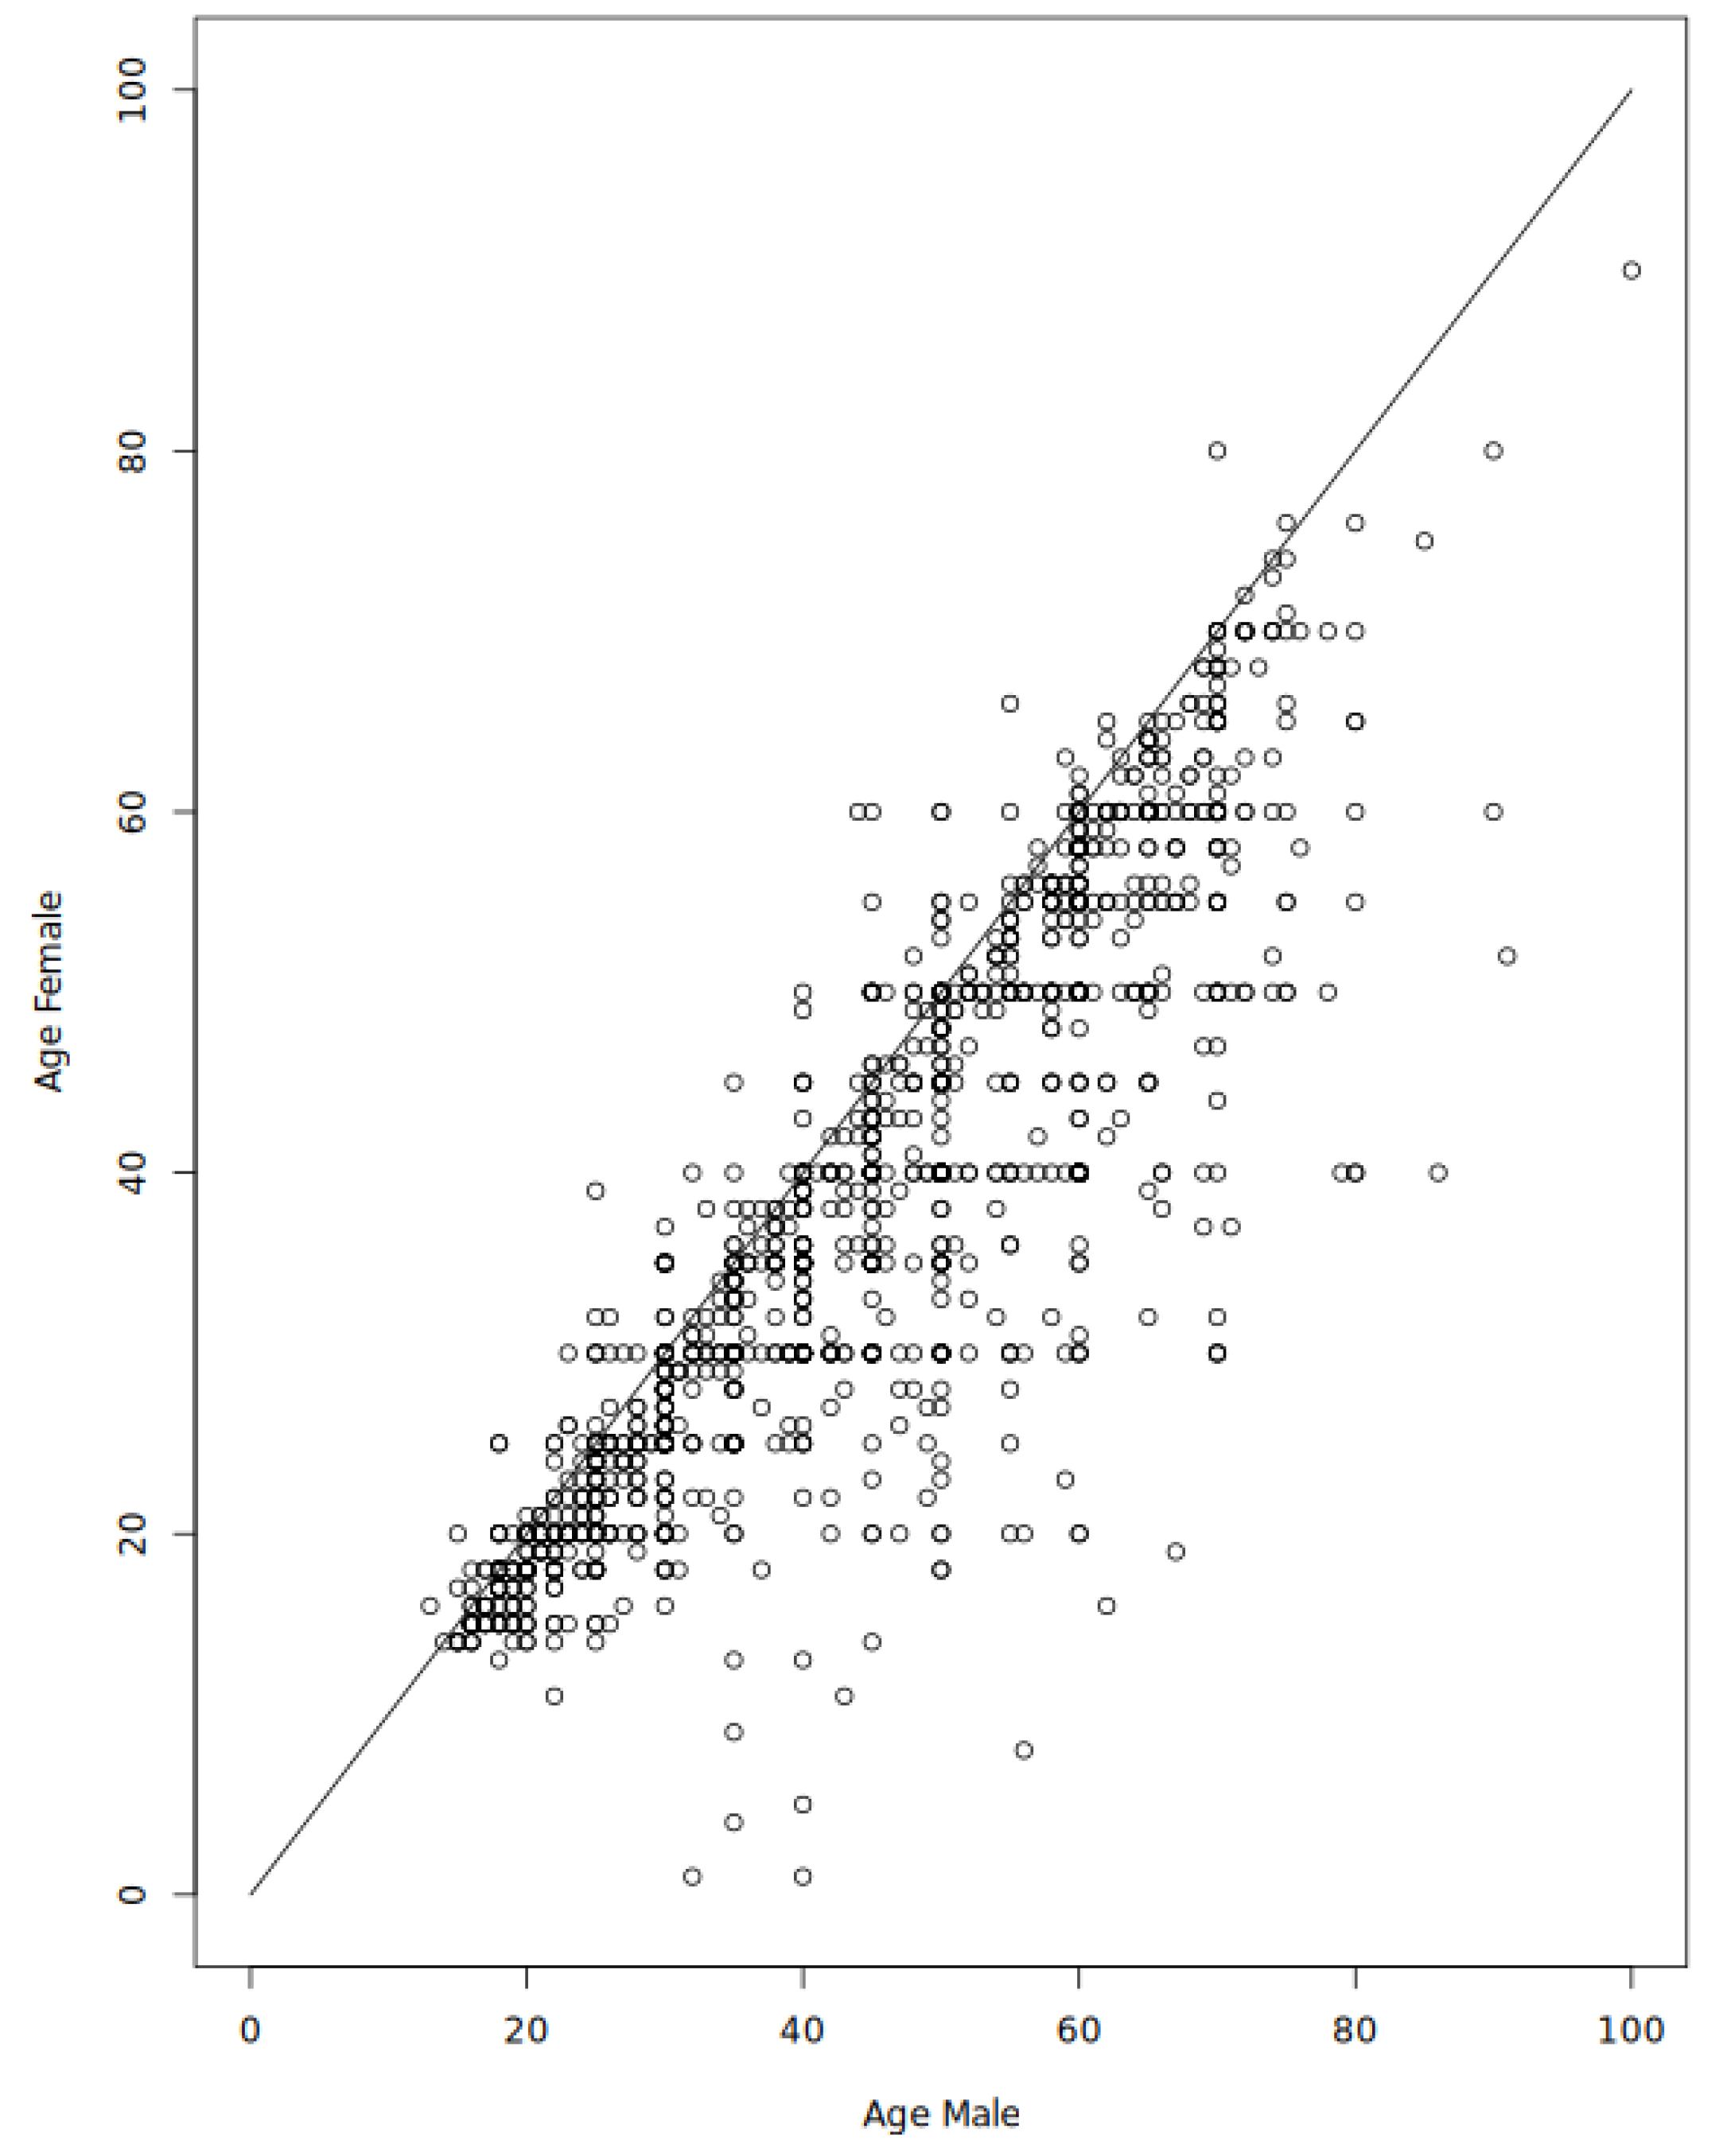
3.3.5. Age Composition

The age distribution of the whole population whose age could be ascertained in all censuses combined is shown is Figure 14. As expected, such combined age composition includes a large proportion of children and a tiny proportion of elders. There could also be a reporting bias introduced by the fact that having more children and aged individuals in a household implies that these individuals represent a cost to the households, with limited capacity for income. The initial objective of the census being to assess the needs of the population, one can think that either the person taking the census or the family (thinking that they might receive more money) might have been more prone to report the age of children and elderly than that of adults able to work.
However, a most notable feature is the sharp decline in the number of those between ages 20 and 50. Figure 13 shows the raw data as is available in the censuses. Below, we will see that systematic effects are present as a result of the incompleteness of the data on ages of portion of the population. As shown in Figure 16a, we made corrections for missing data and discuss the emerging age distribution.
The age distribution by category (i.e., child, <15; adult, >15 and <50; old, >50) of Ashkenazim and Sephardim throughout the different censuses is presented in Figure 15. The absolute numbers can be found in Table A6. The percentage of “children” (regardless of age) accounted for 25–35%, while that of old people accounted for 10–20%. Actually, among the 55,582 people covered in the five censuses (including those with missing ages), about 7500 (13.5%) were under the age of 10. Another 4800 (8.6%) were between 10 and 20. The proportion of children was indeed quite low and the percentage of elders above 60 (7.2% for all censuses combined) was quite high for a population in such an under-developed environment. These percentages would be consistent for a society with fairly low birth rates and low mortality rates and a stable but small population increase. A more plausible explanation would be a fairly high birth rate; high mortality rates, namely high infant mortality, reflecting the poor conditions in the countries of origin and in the Land of Israel itself (Schmelz 1971); significant re-migration of younger adults; and—in the latter circumstance—leaving behind the oldest. High mortality was a characteristic feature of Palestine/Eretz Israel during the 19th century (Schmelz 1990).
Kessler (2016) estimated the age of individuals when they moved to Palestine. On average, immigrants were 36 at the time of their arrival, and the most frequent age at arrival was 14–16. Thus, in contrast with the common view that, in the 19th century, individuals would immigrate to the Land of Israel to retire and to be buried there, the majority of HH or future HH were rather young when they arrived, and immigration occurred consistently from a young age to late 70s.
The data on ages reported so far, although illustrative of the demographic situation of Jews in 19th century Land of Israel/Palestine, are problematic because they are largely and selectively incomplete. In particular, age was not reported for the majority of married women, although with different incidence in the five censuses. The missing information is likely to significantly distort the overall picture of age composition. Therefore, we undertook an evaluation of the presumed “real” age distribution by inputting missing ages according to the following criteria:
  • For each typological category of family status such as child, orphan, single, and widowed, but with the exception of married adults, the cases with missing ages were assumed to distribute like those of the same category in the same census.
  • For married individuals with missing age but the age of whose spouse was known, the woman was assumed to be younger by five years, in conformity with the average age-gap of married adults when the age of both was reported. The imputation was carried out for each census separately.
The results of this age estimation procedure are exemplified for the two sexes together in Figure 16a,b with the data of all censuses combined. Figure 16a shows the absolute numbers and Figure 16b the corresponding percentage distributions. The detailed original and corrected age distributions, separately displaying the two sexes, are reported for each census and for all censuses combined in the Appendix B (see Figure A1, Figure A2, Figure A3 and Figure A4). In case sex was not present in the original data (which was the case for part of the children), they were assumed to distribute like those of the same group in the same census.
The first effect of the correction and procedure is the imputation of a significantly larger number of cases—55,058 versus 30,566. Only for a few hundred cases was it not possible to reasonably estimate an age. As will be noted more clearly in the Appendix B Figure A1, Figure A2, Figure A3 and Figure A4, most of the corrections concern the age of women. The display in Figure 16a,b only provides a general impression of the corrections introduced in the original data.
Regarding the age structure, the most visible effect of the correction for missing ages is an increase in the percentage of children below 10—from 22.0% of those with known ages in the original data to 23.3% in the corrected data. Similar correction results were seen for children and youths aged 10–19—from 15.9% to 17.4%. Modest percent increases also appear for all age groups between 20 and 50. Older age-groups experience a percent reduction when comparing the corrected with the original census data. The enlarged basis of the pyramidal age structure is representative of a demographic regime which still has to undergo the beginning of a transition to more controlled fertility. However, what remains quite unique in the corrected age composition is the persistence of a high proportion of mature adults and especially elders above age 60. Such structural feature confirms the well-known assumption of a tendency among older immigrants to stay in order to be buried in the Holy Land, along with a possibly higher migratory mobility into and out of the country among intermediate adult age cohorts. In other words, what is peculiar in these age structures is the abundance of people above 30 and the lack of a gradual diminution in the size of age cohorts as people are censused at older ages.

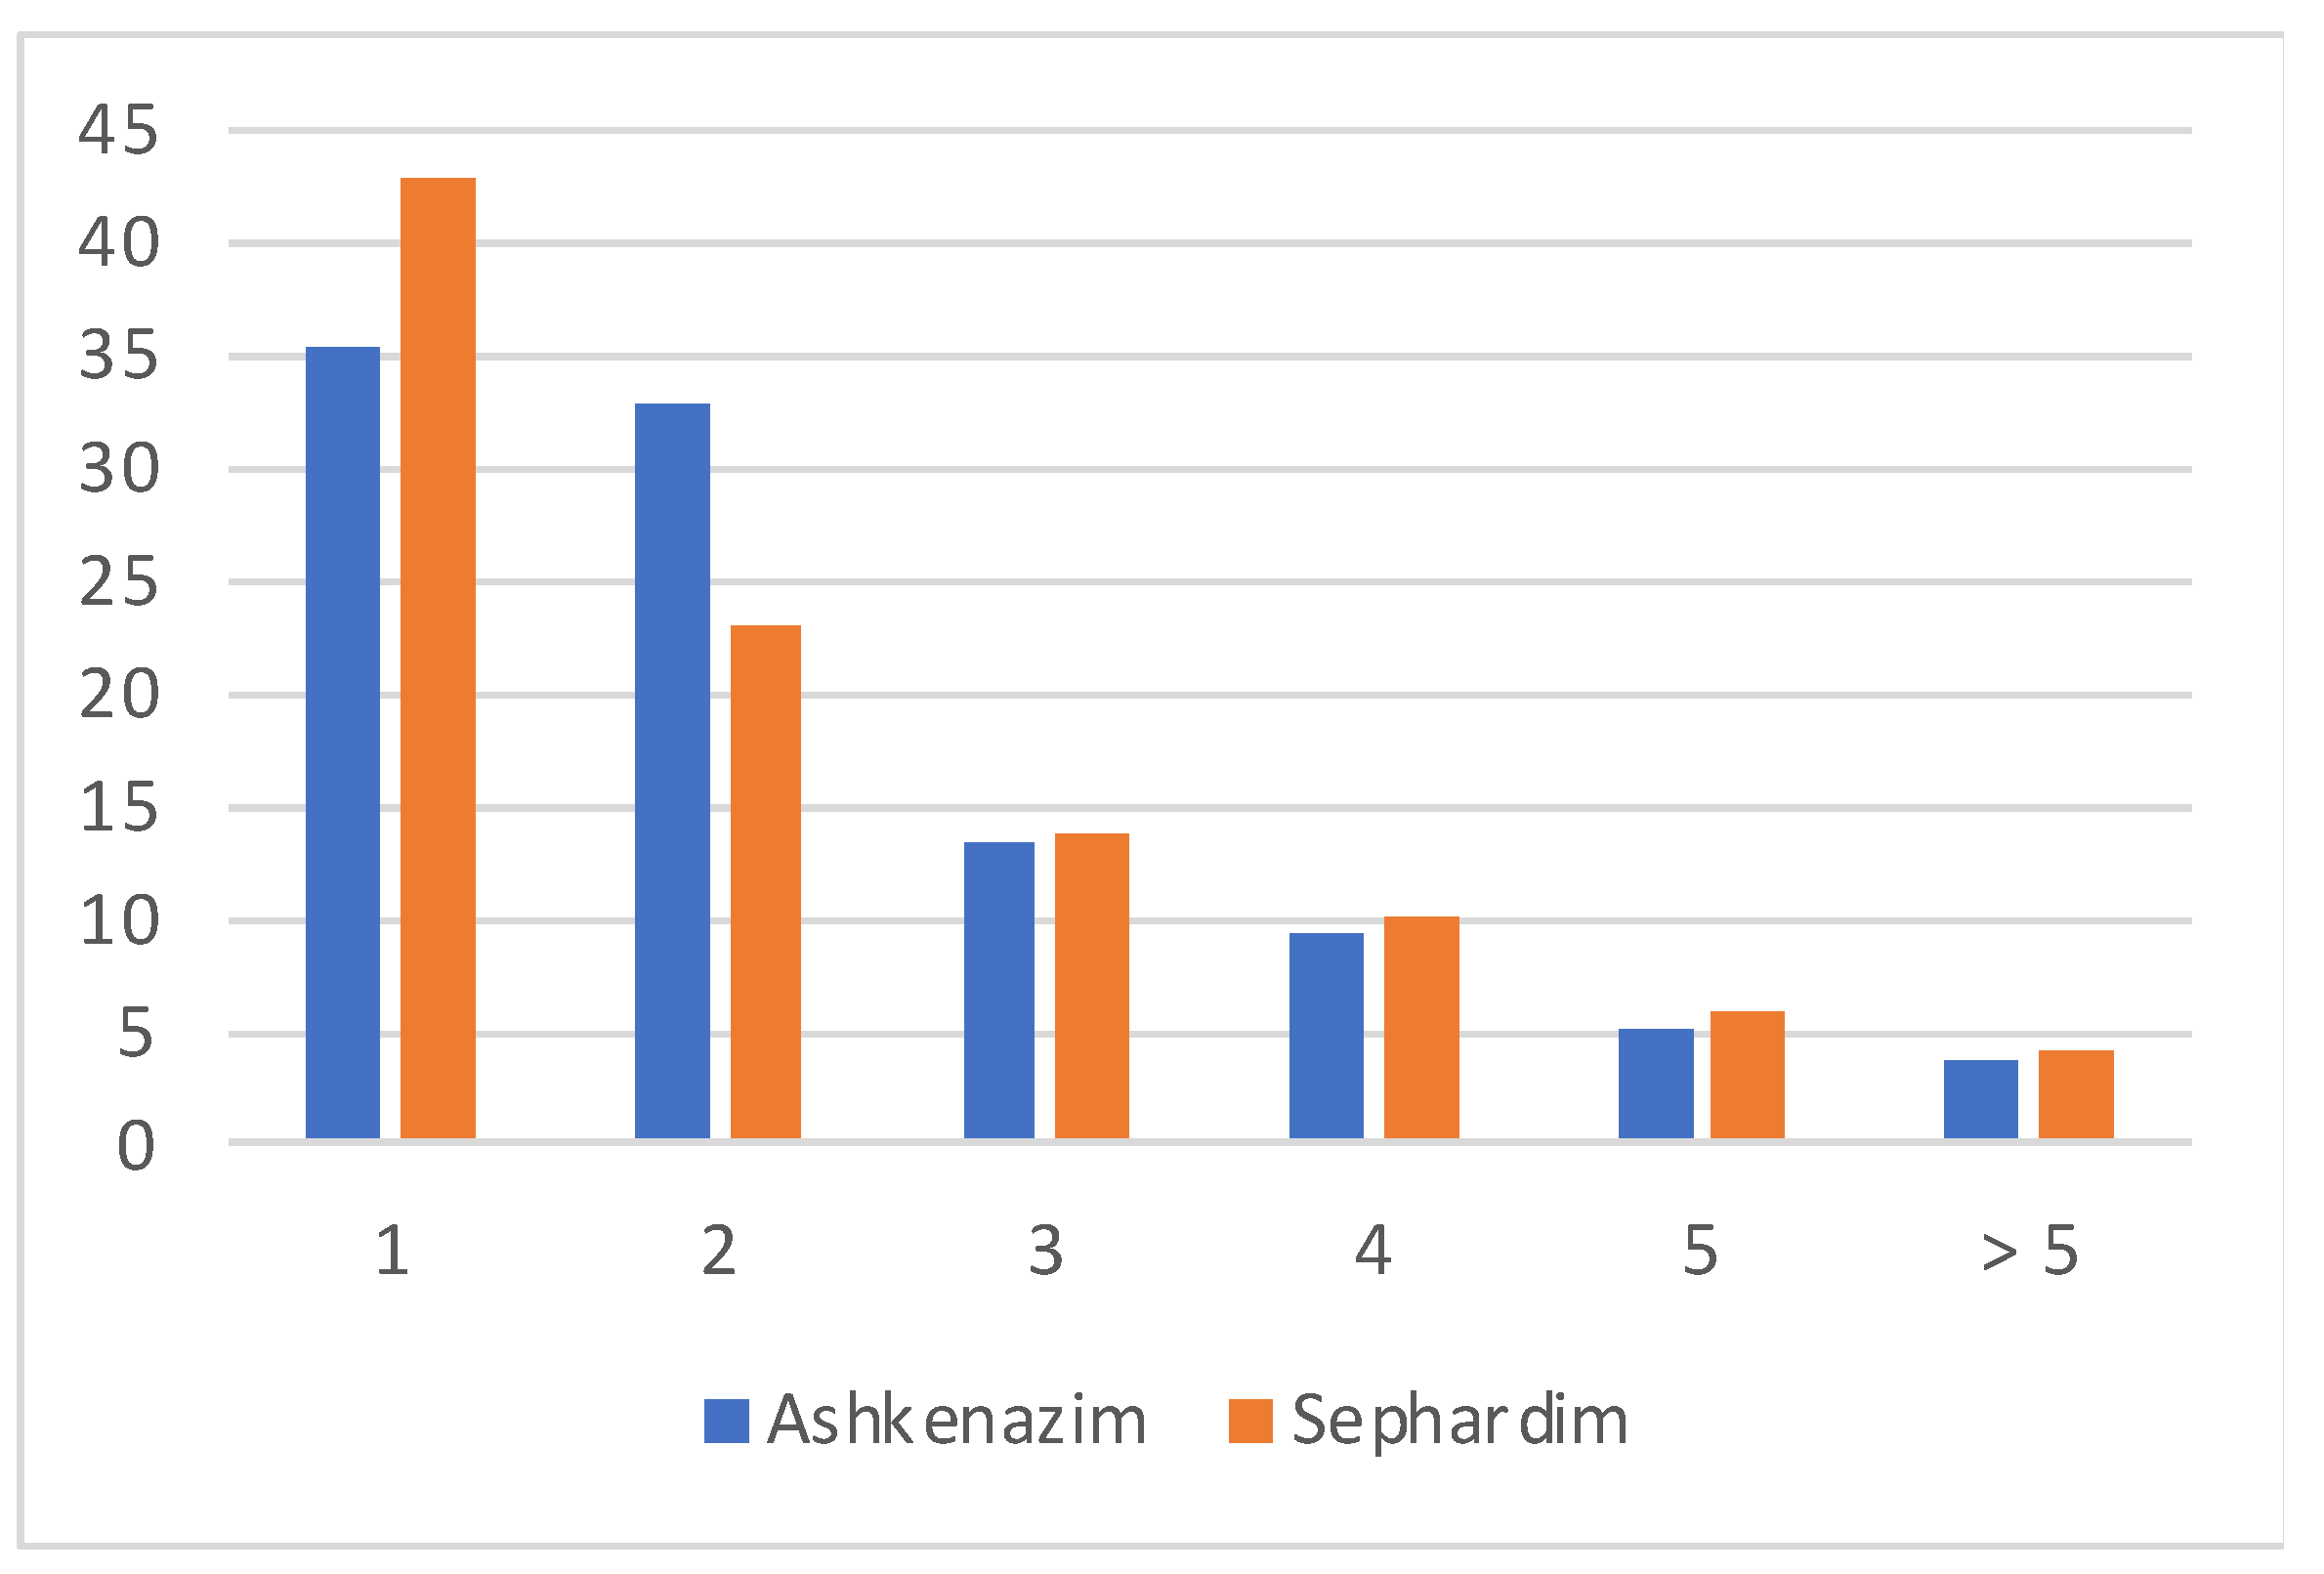
3.3.6. Family Composition

Recordings in Montefiore censuses were carried out per household. A household often consisted of two generations, the parents and their children. This allowed for determination of the number of individuals per household.
The family composition in the Ashkenazi and Sephardi groups is presented in Figure 17. The main difference between Ashkenazim and Sephardim is the larger percentage of the single-person family size of Sephardim. This is consistent with the larger number of Sephardic widows, as seen in Figure 13 and as described in Ben Ya’akov (2006). The predominance of 1- and 2-person households should be noted, in contrast to a diffused popular image of the prevalence of large families in the past.

3.3.7. Immigration Waves

While the number of HH born in the Land of Israel grew by a factor of two (from 779 to 1349) between 1835 and 1875, those born outside the Land of Israel increased by a factor close to 3.5 (i.e., from 1550 to 5880). Although these figures are probably underestimated, since the country of birth was not reported for 9% of Ashkenazim and 24% of Sephardim (Table A1), they confirm that population growth was largely attributable to immigration.
Figure 18 reflects the immigration waves as estimated by combining date of arrival in the Land of Israel in all censuses of all HH (Ashkenazim and Sephardim) born outside the Land of Israel for which this data is available. The data clearly show multiple waves of immigration during the 19th centuries. Since distinct waves of immigration were identified for Ashkenazim and Sephardim (Figure 19 and Figure 20), it should be possible to link them to potential events in the countries of origin. For instance, 250 Moroccan Jews immigrated to the Land of Israel in the 10 years following the bombardment of Essaouira (known then as Mogador) in 1844. The motive of migrations of these Jews to the Land of Israel was also due to “pull” ideological or religious reasons (Ben Ya’akov 1994), as well as to local reforms like the Turkish Tanzimat of the period 1839–1878 and to the “push” reasons linked to the status of Jews in their country of origin.
A large wave of Eastern European immigration known as the First Aliyah started in 1882 and doubled the country’s Jewish population by 1904 (Aaronsohn 1995). Most authors attributed the growth of the Jewish population in the Land of Israel to natural population growth throughout the 19th Century. However, Figure 18 instead suggests that this growth was mainly the result of immigration that occurred in constant and fluctuating waves of both Ashkenazim and Sephardim during the 19th century.
The wavelike pattern and timing of migration waves is especially noteworthy, as it points to continuity rather than discontinuity in the longer-term portrayal of Jewish migration to the Land of Israel (Alroey 2014; Gelber 2007). Zionist historiography has developed the concept of a First Aliyah, beginning with 1881 with the Hovevey Zion and Bilu movements, as the initial point of modern Jewish immigration. In reality, there were several waves of Aliyah throughout the 19th century, even if their numerical impact was smaller than the subsequent—numbered—waves. Notable immigration peaks appear in 1820, 1845, 1852, and 1874.
The immigration data revealed by the Montefiore censuses can be compared with a retrospective analysis of the Census of Eretz Israel undertaken by the Palestine Office of the World Zionist Organization in 1916–1918 (Palestine Office of the World Zionist Organization 1918–1919). By observing the number of surviving individuals by age and year of arrival in the country and estimating the likely number of intervening deaths and departures, it was possible to reconstruct how many had actually arrived in each given year (DellaPergola 2012). The results, while coming from two very different sources and estimations methods, are quite similar, with periodical increases and diminutions in similar years every decade or so. This seems to confirm the reaction of migrants to particular circumstances emerging in various regions of the diaspora and in the land of Israel. It also shows that the drive to Aliyah preexisted and was not a consequence of the mostly European, organized Zionist movement.
A limitation of the data in Figure 18 is that a given individual could have been registered at different censuses, so that it was not possible to assess accurately all immigration waves. Comparing immigration waves of Ashkenazim and Sephardim separately, as recorded in 1875 (Figure 19), with those appearing from all censuses combined (Figure 20) expectedly shows underreporting in 1875 from earlier periods due to death or remigration of former immigrants. In addition, the combined data allow for identifying early immigration waves that would not have been noticed otherwise for each of the two main Jewish population groups.

3.3.8. Occupation and Socio-Economic Status

Occupation
As mentioned in the Methods section, due to the very large number of occupation categories and to facilitate the analysis, we aggregated the occupations in six major classes: ‘Intellectual’ occupations, ‘Physical’ occupations, ‘Business’, ‘Clothing’, ‘Food industry’, and ‘Persons of no occupation and dependents’. Of note, since occupations related to Torah study were extremely frequent, when a HH reported two occupations, one related to Torah study and an additional occupation, the additional occupation was preferred over the Torah study occupation.
Figure 21 details the aggregated occupations of Ashkenazim and Sephardim HH per census year while all occupation categories are detailed in Table A10. It clearly shows a different distribution of major occupations between Ashkenazim and Sephardim throughout censuses. These distributions in Ashkenazim and Sephardim were fairly constant over census years. The main differences observed are between ‘Intellectual’ and ‘Physical’ occupations. Ashkenazim were twice as likely (range 50–70%) as Sephardim (range 25–40%) to have an ‘Intellectual’ occupation, while Sephardim more frequently (range 15–25%) had a ‘Physical’ occupation than Ashkenazim (range 2–8%). This is in line with the analysis focused on full-time Torah scholars conducted by Kessler (2016). He reports that Ashkenazim were more likely to be full-time Torah students than Sephardim. This is supported by the fact that Ashkenazim are more likely to be in Holy cities (i.e., Hebron, Safed and Jerusalem) which had a higher rate of Torah students.
The proportion of Sephardim having an occupation in ‘Business’ was slightly higher (range 20–30%) than that of Ashkenazim (15–20%), while there were no significant differences between Ashkenazim and Sephardim in ‘Clothing’ and ‘Food’ occupations. The proportion of ‘Persons of no occupation and dependents’ was generally higher among Sephardim, except in the 1875 census, where this proportion was higher among Ashkenazim.
Sephardic immigrants generally arrived in the Land of Israel earlier than Ashkenazim. Their contact to the Land of Israel was closer, as it was part of the larger Islamic world. They probably maintained part of their lifestyle and their occupation. In contrast, Ashkenazim migrated later. While they had a clearer choice to migrate to other countries, namely the U.S.A. (Linfield 1939), which had a mainly Christian governance, they chose the Land of Israel. This supports the idea that those Ashkenazim who chose to emigrate to the Land of Israel did so for religious and ideological reasons, which would have allowed them to pursue a more religious, and therefore intellectual, occupation. It is also likely that the profession they practiced upon their arrival in the Land of Israel was the same as the one they had in their country of origin, where professional choices were limited, and unlike Sephardim, certain occupations were restricted to them.
Socio-Economic Status
Socio-economic status was determined for about half of Jewish households (45% of Ashkenazim; 58% of Sephardim, see Table A1 “Missing data”) living in the Land of Israel in the 19th century and registered in the censuses. It was estimated by combining annual incomes, possessions, and other information mentioned in the “Economic status” and “Notes” sections recorded by the census-taker. This enabled us to categorize HH according to their “High”, “Medium”, “Low,” and “Very low” socio-economic status and to figure out in each community—i.e., Ashkenazi and Sephardi—how these statuses evolved throughout time.
The detailed results are shown on Table A11. While, overall, both Ashkenazi HH and Sephardi HH were poor or very poor (Figure 22), there were relatively poorer HH among Sephardim than among Ashkenazim. Indeed, the ratio of poor or very poor Sephardic HH over the population varied from 88 to 72%, while that of Ashkenazi HH varied from 80 to 55% (Figure 22). In contrast, more Ashkenazi HH than Sephardi HH relied on the Haluka for their living. Haluka (or Hallukkah, a Hebrew word meaning charitable distribution) was an organized collection of charity funds sent by the Jews of the diaspora for Jewish residents of the Land of Israel (Adler and Eisenstein 1901–1906). It was administered by the Kolelim (communities) that received the funds before distributing it weekly to the population. Haluka’s policy was intended, in priority, to support Torah students, poor widows and orphans, and temporary helpless men and to defray Jewish community expenses. In the censuses, it was almost exclusively mentioned as a source of income by Ashkenazi HH—472 out of 502 entries mentioning that the HH received money from the Haluka. This happened either simply because it did not occur to Sephardi HH to mention that they received money from the Haluka or because Sephardic Kolelim did not receive funds from the Sephardic diaspora to distribute to their community.
Both the Ashkenazi and the Sephardi communities had people of a large range of economic statuses (Figure 23 and Table A11). This probably contributed to a stable community and had a basis for expanding in future years. Some variability is suggested between the periods and the Sephardim and Ashkenazim, but it is unclear whether these differences reflect real variability or whether they are insignificant.

3.3.9. Surnames

The vast majority of Ashkenazim followed the traditional naming pattern, ignoring the surnames they received in their country of origin after they were forced to adopt hereditary surnames at the turn of the 19th century (Beider 2023). Only 5% (532 out of 10,706) of HH censused living in Ashkenazi communities bore surnames. Unsurprisingly, the most frequent surnames borne by HH were Cohen (N = 182), Levy (N = 58) and Katz (an abbreviation for Cohen Tzedek) (N = 18). The number of other surnames reported in the Ashkenazi communities was 163. These surnames were borne each by very few HH, rarely more than 5 HH.
In contrast, about 90% (12,458 out of 13,836) of Sephardic HH bore surnames indicating that the use of inherited surnames was already a strong tradition in their country of origin. Altogether, 1674 distinct surnames were reported being borne by Sephardic HH in Montefiore censuses. Of about the 1300 HH without surnames, more than 1000 were women and about 100 were orphans. Thus, only 2.5% of HH Sephardic adult males (200 HH out of about 7700) had no reported surname.
The 10 most common surnames reported by Sephardic HH were Cohen (N = 870), Levy (N = 555), Mizrahi (N = 381), Ashkenazi (N = 140), Hassan (N = 114), Bekhar (N = 99), Castel (N = 84), Meyuhas (N = 82), Harosh (N = 78), and Kimhi (N = 76).

4. Conclusions

The five censuses of the Jewish population of Palestine/Eretz Israel conducted at the initiative of the Jewish philanthropist Sir Moses Montefiore between 1835 and 1875 constitute a uniquely rich source of information on the demographic and socio-economic characteristics of this particular sub-population. The wealth of data from these censuses, while plagued by shortcomings and omissions, compare favorably with the parallel sources of data available from Ottoman censuses of the same period. Importantly, the censuses allow us to distinguish a number of different variables, processes and internal stratifications which are usually lost in the typical testimonies and travel reports by the direct observers of the scene in real time.
The Montefiore censuses offer an exceptional repertory of social and demographic information, and their quality compares well with that of other sources of the same period. Along with the great amount of detailed data, there are important lacunae due to data that are missing mostly because the information was not requested by the census takers. The original manuscript pages induce one to believe that different census takers were not always consistent in their mode of data collection. There were evident discrepancies between censuses taken in different years. In the analysis of the materials from the Montefiore censuses, therefore, two complementary strategies could be followed—as demonstrated in this study. The first was to faithfully represent the findings according to the original data of the five censuses. The second was to adjust the data to make them more complete, and hence more useful to the analysis of the topics being investigated.
Historical and bibliographical data confirm the Jewish presence in the Land of Israel long before the Montefiore censuses. These censuses support this by recording individuals born in Palestine before 1810. At the beginning of the 19th century, the Jewish population was mainly composed of Sephardim. The dominant Sephardic presence over the Ashkenazim continued until the late 1860s. If we exclude the Sephardic population not recorded in 1875 in Safed, the Jewish presence in the Land of Israel became predominantly Ashkenazi by 1875.
The Ottoman statistics were less accurate and exhaustive than the Montefiore censuses. They likely underestimated the Jewish population (and possibly also other population groups) living in the Land of Israel in the 19th century. Successive waves of migration from the beginning of the 19th century, as identified in this work, support that the Jewish population of the Land of Israel grew primarily through immigration waves rather than natural population growth. While Jewish immigrants came mainly from Eastern Europe, the Ottoman Empire, and North Africa, the censuses reported immigrants from most Jewish communities around the world, including those that were the most distant (e.g., the United States, India, Cuba, etc.). This arrival of Jews in Palestine well before the large wave of Eastern European immigration known as the First Aliyah that began in 1882, and to which most authors—customarily but not appropriately—attribute the beginning of the settlement of modern Israel, clearly shows that Jews immigrated to the land of Israel in successive waves well before 1882. This immigration was mainly Sephardic in the first half of the 19th century and became progressively mainly Ashkenazi by 1875. The oldest immigrants reported in the earliest Montefiore census of 1839 were born in the second half of the 18th century.
The composition of the Jewish population by countries of origin was relatively balanced, only gradually shifting from an initial Sephardi to a later Ashkenazi majority. But in view of the growing and eventually overwhelming predominance of Eastern European Jews among the total Jewish diaspora, it could be expected that the proportion of Ashkenazim in the censuses were much more predominant. The fact this was not the case indicates a selectively higher propensity among Sephardim to migrate to the Land of Israel.
Our analysis shows that the average length of stay for Jews in Israel was 10 years, with about 50% of the individuals recorded in the first censuses no longer present in 1875, suggesting that they either returned to their country of origin or died before 1875. While, as expected, the population was mainly composed of married couples with children, the proportion and absolute number of orphans and widows was high, often exceeding more than 30% of the population. This proportion was higher in the Sephardic community than in the Ashkenazi community.
The composition of households and the age of individuals suggest a society with a fairly high birth rate; and high mortality rate, reflecting the poor conditions in the countries of origin and in the Land of Israel itself, combined with significant re-migration of younger adults leaving behind the oldest and/or significant immigration of elderly people who chose to die and be buried in Israel. These patterns were clarified and confirmed after we undertook an estimation procedure aimed at overcoming the substantial number of cases with missing ages, especially among married women.
Jews living in Palestine in the 19th century were mostly poor or very poor, with a higher proportion of low-income households—more among Sephardim than among Ashkenazim—that lived mainly on charitable funds (e.g., Haluka). The most practiced occupation of Ashkenazim was intellectual professions related to the study of the Torah or teaching, while Sephardim most often had manual, physical, or trade-related occupations. This supports the idea that those Ashkenazim who chose to emigrate to the Land of Israel were part of the most religious group in their country of origin and did so for religious and ideological reasons. It is also likely that the profession they practiced upon their arrival in the Land of Israel was the same as the one they had in their country of origin. In contrast, the Sephardim who decided to emigrate to Palestine, even if they did so in part for religious reasons, were probably more representative than the Ashkenazim of their community of origin and therefore had various professions there which they maintained when they arrived in the Land of Israel.
Our analysis confirms Beider’s work (Beider 2023) showing different naming patterns of Ashkenazim and Sephardim. The former mostly did not declare definite surnames, although certain distinctive family names might have existed. The latter bore inherited surnames such as toponyms or descriptive of certain socio-economic conditions that, in some cases, appear to be very ancient.
Much additional work is still feasible on this rich database, such as a longitudinal analysis of characteristics of the same individual observed throughout different censuses. More light will be shed on the profile of the Jewish population in the Land of Israel during the 19th century by an additional analysis of the Montefiore censuses, which will focus on institutional frameworks and the web of relations that existed between Jewish leaders, private individuals, families, and welfare and religious bodies.

Author Contributions

R.L.-T. contributed to the conceptualization and methodology of the research, to the analysis of the results and to the article writing (original draft preparation, review and editing). W.P. contributed to access the data, to the analysis of the results and to the article writing (review and editing). S.D. contributed to the analysis of the results and to the article writing (original draft preparation, review and editing). All authors have read and agreed to the published version of the manuscript.

Funding

This research received no external funding.

Institutional Review Board Statement

Not applicable.

Informed Consent Statement

Not applicable.

Data Availability Statement

The data were extracted from The Montefiore Endowment website (https://www.montefioreendowment.org.uk/, last accessed on 13 July 2025) where there are archived.

Acknowledgments

The authors would like to thank Montefiore Endowment (https://www.montefioreendowment.org.uk/, last accessed on 13 July 2025) and particularly Sally Style, librarian/researcher at Montefiore Endowment, for granting authorization to use the Montefiore censuses’ data for this analysis.

Conflicts of Interest

The authors declare no conflicts of interest.

Appendix A. Methodological Details

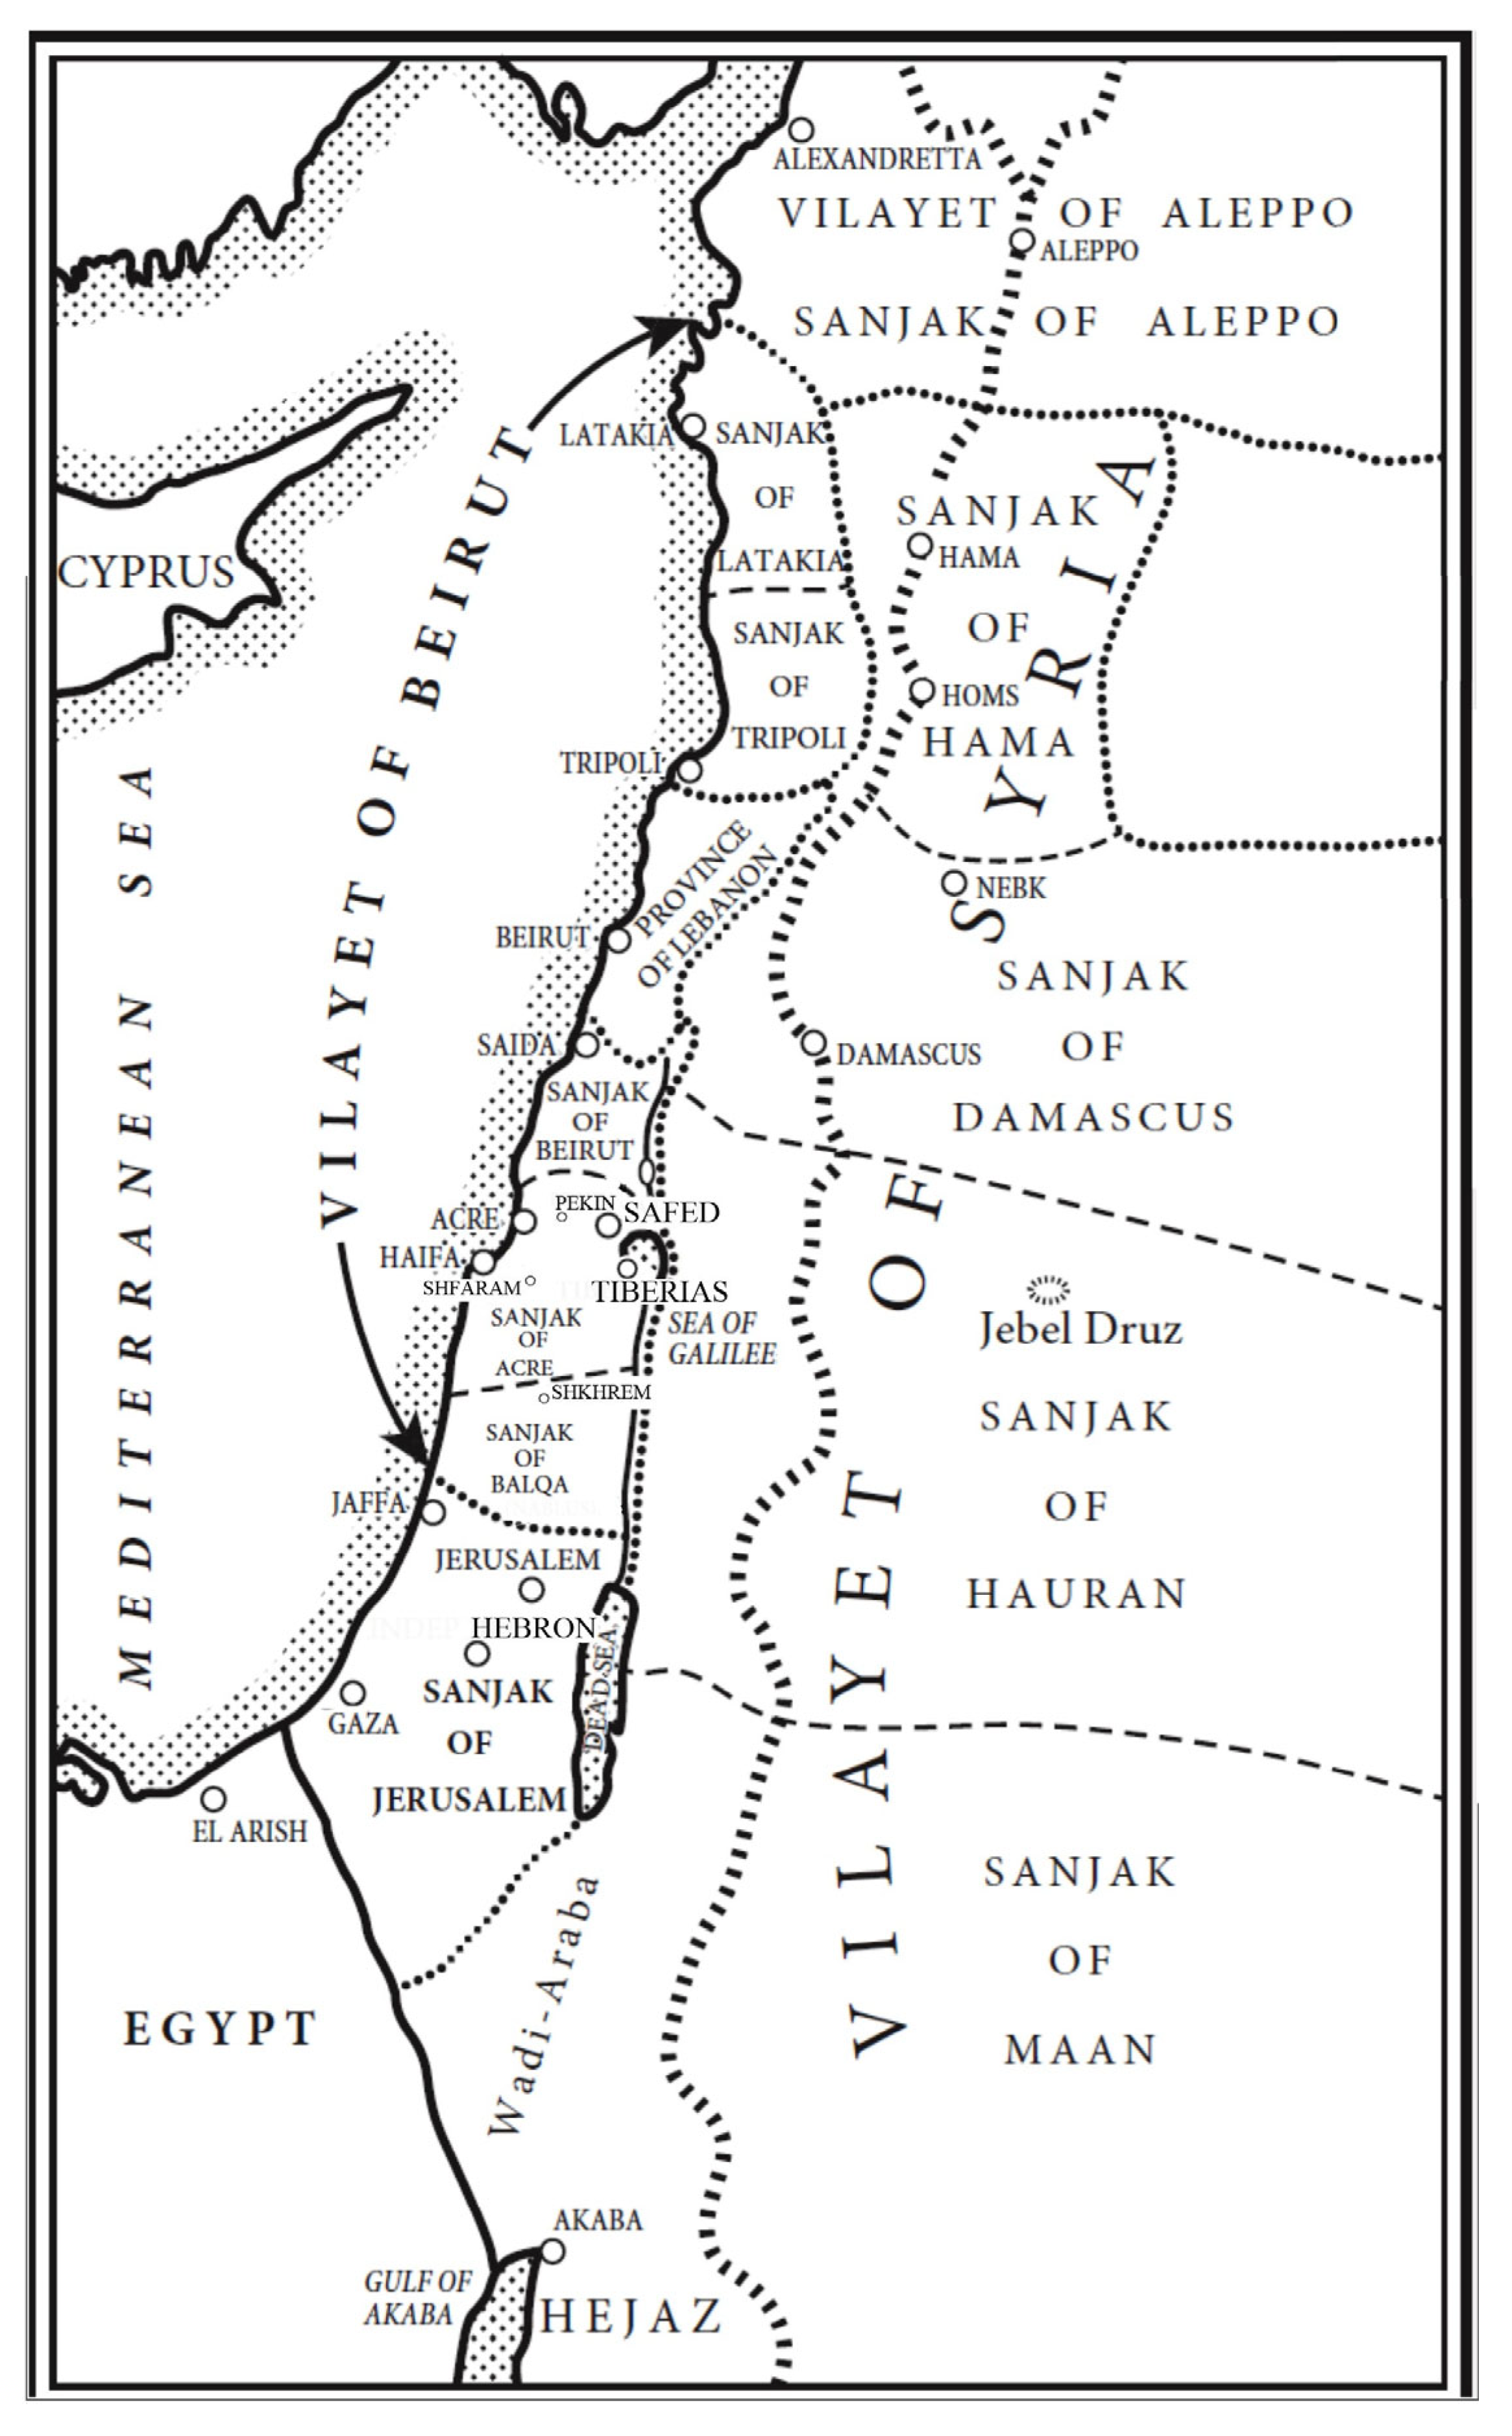
Appendix A.1. Census Locations

  • 1839: Acre, Haifa, Hebron, Jaffa, Jarmak (Lebanon), Jerusalem, Safed, Saida (Lebanon), Shfaram, Shkhem, Tiberias;
  • 1840: Alexandria (Egypt);
  • 1849: Acre, Beirut (Lebanon), Haifa, Hebron, Jaffa, Jerusalem, Ramla, Safed (includes Safed and amp; Tiberias and Safed and amp; Upper Galilee), Shfaram, Shkhem, Pekiin, Tiberias;
  • 1855: Acre, Haifa, Hebron (Hebron and amp; Jerusalem), Jaffa (includes Jaffa/Ramla), Jerusalem, Safed, Saida (Lebanon), Shfaram, Shkhem, Pekiin, Tiberias;
  • 1866: Haifa, Hebron, Jaffa, Jerusalem, Safed, Saida (Lebanon), Shkhem, Pekiin, Tiberias;
  • 1875: Haifa, Hebron, Jaffa, Jerusalem, Safed, Tiberias.

Appendix A.2. Classification of Occupations

Adapted from the work of McCarthy (1990). Some categories were added (in italic below) For some categories, specific occupations are mentioned.
  • Agriculture (dung carrier);
  • Extraction of minerals;
  • Manufacturing industries:
    Textile industries (blankets and pillow maker);
    Chemical industries;
    Wood manufacture (carpenter);
    Metal and mechanical industries (silversmith, jewel, watchmaker);
    Building industries (house painter);
    Printing and stationery industries (book binder and book seller);
    Food manufacture, fisherman (all food jobs and ritual slaughters);
    Clothing and millinery industries (hosiery, seamstress);
    Leather industries (shoemaker, cobbler);
    Other industries;
    Undefined industries;
  • Transport and communication (donkey driver);
  • Domestic service (servant, barber, bleacher);
  • Financial service (added; charity collection, emissaries);
  • Community service (added; charity distribution, good deeds doers, bath attendant);
  • Commerce (all buy and sell jobs, including food stores);
  • Clerical work (clerk, scribe, translator);
  • Public officials, police, army;
  • Craftsman and small jobs (grave digger, journeyman)
  • Professions and liberal arts:
    Medicine (health professional, bloodletting, pharmacist);
    Engineering;
    Education;
    Arts;
    Other liberal professions (homeowner, hostel, real estate);
    Religious occupations (rabbis, Torah scholar having no other occupations, mezuzot and Torah scribes, persons involved in the preparation of kosher meat, worshippers);
  • Students (any individuals who studied Torah not being a Torah scholar and having no other occupation);
  • Persons of no occupation and dependents (including “batlanim” for minyan and unemployed);
  • Unknown (including “agent” with no other precision).

Appendix A.3. Tables of Currency Conversion

As not all incomes and possessions mentioned in the censuses were reported in Grush, the currency used in the Land of Israel, they were all converted into Grush. The tables of currency conversion used in this study can be found in the following websites (all accessed in October 2024):
They led to the following conversion factors:
  • 1 Turkish Lira = 100 Grush.
  • 1 French Franc = 10 Grush.
  • 1 British Pound = 250 Grush.
  • 1 Ducat = 3000 Grush.
  • 1 Russian Rouble = 25 Grush.
  • 1 Austrian Gulden = 2500 Grush.
  • 1 French Napoleon = 2000 Grush.
  • 1 Thaler = 400 Grush.

Appendix B. Supplementary Data

Table A1. Missing data (HH).
AshkenazimSephardim
Surname95%3%
Place of birth9%24%
Age5%32%
Date of arrival (for HH not born in the Land of Israel)32%60%
Occupation44%50%
Economic status75%62%
Economic status as deduced from occupation and comments55%42%
Table A2. Place of birth per census year (HH)—countries ordered by decreasing population size in 1875.
Country18391849185518661875
Ukraine
  Berdychiv235826391
  Khotin215333315
  Kolomyya413182950
  Total (including other places)883756978251376
Land of Israel
  Jerusalem47887368296726
  Safed52110117253212
  Tiberias306560162158
  Hebron6996737669
  Total (including other places)7694838439071349
Belarus
  Shklow4433443832
  Pinsk1294131117
  Minsk1110254456
  Total (including other places)193160341414699
Morocco
  Meknes07265211140
  Rabat61741105141
  Marrakech84856518
  Total (including other places)31184224710558
Turkey
  Istanbul1775114828246
  Izmir7238662271
  Edirne471833661
  Total (including other places)35513230686493
Poland
  Kalisz118182520
  Warszawa09102133
  Total (including other places)3083141269487
Romania
  Iasi19317188119
  Botosani913183271
  Total (including other places)5189169235399
Greece
  Thessaloniki1884921664254
  Rhodos3812571780
  Total (including other places)25973300100381
Lithuania (mostly Vilnius)444262170340
North Africa (not else specified)67534658169
Georgia0887157
Moldova (mostly Chisinau)55585133147
Syria
  Aleppo6432772060
  Damascus1535634541
  Total (including other places)796714265101
Algeria (mostly Oran)21114623012590
Bulgaria (mostly Sofia)9623941675
North Macedonia (mostly Bitola)2913421372
Iraq1918283070
Bosnia2718371135
Russia7932034
Latvia1361532
Serbia (mostly Beograd)17326627
Kurdistan41101026
Iran620341416
Germany487911
Tunisia (mostly Djerba)1212462411
Uzbekistan (all in Bukhara)000010
Hungary2410339
Czechia0613167
Cuba00006
Lebanon01115175
Libya (mostly Tripoli)0101255
Netherlands02335
France31115
Slovakia5109204
India11132
Yemen21222
Italy (mostly Tuscany)160301
Portugal00200
Saudia Arabia00010
Estonia00100
USA00100
Austria63420
Gibraltar11600
Croatia20200
England10100
Unknown country6281778699011014
Table A3. Number of individuals born in the Land of Israel per census (all individuals among those with place of birth).
Census18391849185518661875All Censuses Combined
Total individuals
with known place of birth
2531255643494590742321,364
Individuals born in the Land of Israel805732109696714175012
Table A4. Continuity of residence in the Land of Israel (Sephardim only, all individuals and HH).
CensusesNumber of IndividualsHH
Continuous stay
  1839, 1849 281118
  1839, 1849, 1855357123
  1839, 1849, 1855, 186612541
  1839, 1849, 1855, 1866, 1875 24159
  1849, 1855725301
  1849, 1855, 186629595
  1849, 1855, 1866, 187532194
  1855, 186621181
  1855, 1866, 187515749
  1866, 1875891302
  Total continuous stay36041263
Discontinuous stay
  1839, 185512042
  1839, 1866166
  1839, 1875206
  1839, 1849, 1866,229
  1839, 1849, 1855, 18754012
  1839, 1849, 1866, 1875123
  1839, 1855, 1866258
  1839, 1855, 1866, 1875227
  1839, 1855, 1875167
  1839, 1866, 187542
  1849, 18667829
  1849, 18753012
  1849, 1855, 18756123
  1849, 1866, 18753711
  1855, 187515053
  Total discontinuous stay653230
Bold means emphasize.
Table A5. Duration of stay in the Land of Israel (Sephardim only, all individuals and HH).
Duration of StayCensus DatesIndividualsHH
10 y1839, 1849281118
15 y1839, 1849, 1855357123
25 y1839, 1849, 1855, 186612541
35 y1839, 1849, 1855, 1866, 187524159
5 y1849, 1855725301
15 y1849, 1855, 186629595
25 y1849, 1855, 1866, 187532194
10 y1855, 186621181
20 y1855, 1866, 187515749
10 y1866, 1875891302
15 y1839, 185512042
25 y1839, 1866166
35 y1839, 1875206
25 y1839, 1849, 1866,229
35 y1839, 1849, 1855, 18754012
35 y1839, 1849, 1866, 1875123
25 y1839, 1855, 1866258
35 y1839, 1855, 1866, 1875227
35 y1839, 1855, 1875167
35 y1839, 1866, 187542
15 y1849, 18667829
25 y1849, 18753012
25 y1849, 1855, 18756123
25 y1849, 1866, 18753711
20 y1855, 187515053
Table A6. Age category distribution (all individuals).
18391849185518661875
AshkSephAshkSephAshkSephAshkSephAshkSeph
Child41812739622039120416721694257227972749
Adult1090254812593400188725672743343745594340
Old2545346822748791112138849923011506
Ash: Ashkenazim; Seph: Sephardim.
Table A7. Unmarried adult men and women throughout censuses and unmarried old men and women in all censuses combined (all individuals).
Census18391849185518661875Old
MenWomenMenWomenMenWomenMenWomenMenWomenMenWomen
Total * 142222161878275219122523244037223267562851014324
Unmarried2032025528420109341985202436275
* With determined family status.
Table A8. Recorded Ashkenazim and Sephardim in the Land of Israel per city and census year.
18391849185518661875Total
AshkSephAshkSephAshkSephAshkSephAshkSeph
Acre 248 275 187 710
Haifa16123 15214 531836
Hebron1722461152312702492282804894502730
Jaffa 863237 3511518166431855
Jerusalem49124241171335116522882228234865202598728,928
Pekiin 76 63 60 199
Ramla 8 8
Safed61677010188401341717233712123753 12,604
Shfaram 106 118 114 338
Shkhem 75 70 59460 268
Tiberias4743236115547756611050103339111617033
Total176944012918576040385435591666499851877255,509
Ash: Ashkenazim; Seph: Sephardim.
Table A9. Orphans, female widows per census year.
18391849185518661875
AshkSephAshkSephAshkSephAshkSephAshkSeph
Orphans87348147429261456362284343756
Others *1494328825214415344740984899558085216405
Widows1877652508663308826557839871611
Total1768440129185710403854365916664798518772
Ash: Ashkenazim; Seph: Sephardim; * Individuals not identified as ‘Orphans’ or ‘Widows’.
Figure A1. Age composition of Jewish population, by sex, according to five censuses and all censuses combined—absolute numbers, original data. # indicates the number of people in the age group.
Genealogy 09 00072 g0a1
Figure A2. Age composition of Jewish population, by sex, according to five censuses and all censuses combined—absolute numbers, corrected data. # indicates the number of people in the age group.
Genealogy 09 00072 g0a2
Figure A3. Age composition of Jewish population, by sex, according to five censuses and all censuses combined—percentages, original data.
Genealogy 09 00072 g0a3
Figure A4. Age composition of Jewish population, by sex, according to five censuses and all censuses combined—percentages, corrected data.
Genealogy 09 00072 g0a4
Table A10. Occupation of Ashkenazim and Sephardim per census year (HH).
18391849185518661875Total
AshkSephAshkSephAshkSephAshkSephAshkSeph
Agriculture 2 17783122455
Art 23 22327324
Building industry292661111726989
Clerical work19161214151913133812171
Clothing and millinery industries2258347856116465414029633
Commerce4618828183572661493273903091943
Community service4222414196 17593
Craftsman and small jobs 348602012912588655462
Domestic service3621931210312048225766
Education252139185846913417733542
Financial service52412152164261632152
Food manufacture1059216638143601198258656
Health and medicine487811242111367137
Leather industries4339322468281116845422
Metal and mechanical industries18432144376244798848484
Other liberal profession 451116 44338
Persons of no occupation and dependents36412451814131195316681082
Printing and stationery industries738118322 486116
Public official, police, army2311212 4117
Religious occupation771622212811711763411014881542172
Students15519245912761293463645901922380
Textile industries15 1414647204102
Transport and communication323111218 351134138
Undefined industry4078 19271620200
Wood manufacture642711102716649156
Unknown4261131780129588168813299261431265811,512
Total 88221931263261517292357261926484213402324,542
Ash: Ashkenazim; Seph: Sephardim.
Table A11. Socio-economic status of Ashkenazim and Sephardim per census year (HH).
18391849185518661875
AshkSephAshkSephAshkSephAshkSephAshkSeph
High307143417524536107242
Medium89214229213233196342246524338
Low2142966462230360313579123021
Very Low46010791355458015421747011041623
ND259462766136111672071741108513111925
Total859219112102615172723572615264742134017
Ash: Ashkenazim; Seph: Sephardim; ND: not determined.

References

  1. Aaronsohn, Ron. 1995. The Beginnings of Modern Jewish Agriculture in Palestine: “Indigenous” versus “Imported”. Agricultural History 69: 438–53. [Google Scholar]
  2. Adler, Cyrus, and Judah Eisenstein. 1901–1906. Ḥaluḳḳah. In The Jewish Encyclopedia. Edited by Isidore Singer. New York: Funk & Wagnalls. Available online: https://www.jewishencyclopedia.com/articles/7115-halukkah (accessed on 13 July 2025).
  3. Alroey, Gur. 2014. An unpromising land: Jewish migration to Palestine in the early twentieth century. Redwood City: Stanford University Press. [Google Scholar]
  4. Bachi, Roberto. 1977. The Population of Israel. Jewish Population Studies 11. Paris: CICRED. Jerusalem: The Hebrew University of Jerusalem. [Google Scholar]
  5. Beider, Alexander. 2023. Surnames of Jewish People in the Land of Israel from the Sixteenth Century to the Beginning of the Twentieth Century. Genealogy 7: 49. [Google Scholar] [CrossRef]
  6. Ben Arieh, Yehoshua. 1984. Jerusalem in the 19th Century: The Old City. New York: St. Martin’s Press. [Google Scholar]
  7. Ben Ya’akov, Michal. 1994. The immigration of North African Jews to Nineteenth-century Eretz Israel: Origin and Destination. Proceedings of the Eleventh World Congress of Jewish Studies 3: 208–14. [Google Scholar]
  8. Ben Ya’akov, Michal. 2001. The Montefiore Census: The First Modern Census of Jews in Erez Israel. In Papers in Jewish Demography, 1997 ed. Edited by Sergio DellaPergola and Judith Even. Jewish Population Studies 29. Jerusalem: The Hebrew University of Jerusalem, Institute of Contemporary Jewry, pp. 79–87. [Google Scholar]
  9. Ben Ya’akov, Michal. 2004. Aliyah in the Lives of North African Jewish Widows: Realization of a Dream or Solution to a Problem? Nashim, a Journal of Jewish Women’s Studies & Gender Issues 8: 5–24. [Google Scholar]
  10. Ben Ya’akov, Michal. 2006. Widows in the North African Jewish Communities of Late Ottoman Palestine. Encyclopedia of Jewish Women’s Archive. Available online: https://jwa.org/encyclopedia/article/widows-in-north-african-jewish-communities-of-late-ottoman-palestine (accessed on 24 September 2024).
  11. Ben Ya’akov, Michal. 2012. Space and Place: North African Jewish Widows in Late-Ottoman Palestine. Journal of Women of the Middle East and the Islamic World 10: 37–58. [Google Scholar]
  12. DellaPergola, Sergio. 1983. La trasformazione demografica della diaspora ebraica. Torino: Loescher. [Google Scholar]
  13. DellaPergola, Sergio. 1992. Review of: Population of Palestine: Population History and Statistics of the Late Ottoman Period and the Mandate, by J. McCarthy. Studies in Zionism 13: 97–100. [Google Scholar]
  14. DellaPergola, Sergio. 2012. Some Reflections on Migration in Israel: Comparative Aspects. Hagira–Israel Journal of Migration 1: 5–31. (In Hebrew). [Google Scholar]
  15. DellaPergola, Sergio. 2020. Diaspora vs. Homeland: Development, Unemployment and Ethnic Migration to Israel, 1991–2019. Jewish Population Studies 31. Jerusalem: The Hebrew University, The Avraham Harman Institute of Contemporary Jewry. [Google Scholar]
  16. DellaPergola, Sergio. 2021. A Minimal Demographic History of Israel. In The Oxford Handbook of Israeli Politics and Society. Edited by Reuven Y. Hazan, Alan Dowty, Menachem Hofnung and Gideon Rahat. New York: Oxford University Press, pp. 35–57. [Google Scholar] [CrossRef]
  17. DellaPergola, Sergio. 2024a. Notes toward a Demographic History of the Jews. Genealogy 8: 2. [Google Scholar] [CrossRef]
  18. DellaPergola, Sergio. 2024b. Demography of the Jewish family: Continuities and discontinuities. In The Jewish Family in Global Perspective. Edited by Harriet Hartman. Cham: Springer, pp. 19–47. [Google Scholar]
  19. Dulska, Anna Katarzyna. 2015. Diaspora żydowska na Bliskim Wschodzie oczami sefardyjskiego podróżnika Beniamina z Tudeli. Kraków: Księgarnia Akademicka. [Google Scholar]
  20. Dulska, Anna Katarzyna. 2017. Abrahamic coexistence in the twelfth-century Middle East? Jews among Christians and Muslims in a travel account by a Navarrese Jew, Benjamin of Tudela. Journal of Beliefs & Values 38: 257–66. [Google Scholar] [CrossRef]
  21. Finn, James. 1868. Byeways in Palestine. London: James Nisbet & Co. [Google Scholar]
  22. Frankel, Jonathan. 1997. The Damascus Affair: “Ritual Murder”, Politics and the Jews in 1840. Cambridge: Cambridge University Press. [Google Scholar]
  23. Gelber, Yoav. 2007. The History of Jewish Historiography: From Apology to Denial. In Making Israel. Edited by Benny Morris. Ann Arbor: University of Michigan Press, pp. 47–80. [Google Scholar]
  24. Glass, Joseph B., and Ruth Kark. 1991. Sephardi entrepreneurs in Eretz Israel. The Amzalak Family 1816–1918. Jerusalem: The Magnes Press. [Google Scholar]
  25. Guérin, Honoré Victor. 1868. Description Géographique Historique et Archéologique de la Palestine. Paris: L’Imprimerie impériale, vol. 1: Judée, pt. 1. [Google Scholar]
  26. Kark, Ruth. 1994. American Consuls in the Holy Land. Detroit: Wayne State University Press. [Google Scholar]
  27. Kessler, Daniel. 2016. The Jewish community in nineteenth century Palestine: Evidence from the Montefiore censuses. Middle Eastern Studies 52: 996–1010. [Google Scholar] [CrossRef]
  28. Lestschinsky, Jacob. 1929. Die Umsiedlund und Umschichtung des jüdischen Volkes im Laufe des letzten Jahrhuderts. Weltwirtschaftsliches Archiv 20: 123–56. [Google Scholar]
  29. Lestschinsky, Jacob. 1960. Jewish migrations, 1840–1956. In The Jews: Their History, Culture and Religion, 3rd ed. Edited by Louis Finkelstein. New York: Harper, vol. 2, pp. 1536–96. [Google Scholar]
  30. Lewis, Bernard. 1952. Notes and Documents from the Turkish Archives: A Contribution to the History of the Jews in the Ottoman Empire. Jerusalem: The Israel Oriental Society, Oriental Notes and Studies, p. 3. [Google Scholar]
  31. Linfield, Harry S. 1939. The Jews of the United States number and distribution: Preliminary figures for 1937. The American Jewish Year Book 41: 181–86. [Google Scholar]
  32. Marx, Karl. 1854. Declaration of War. On the History of the Eastern Question. New York Daily Tribune, April 15. [Google Scholar]
  33. McCarthy, Justin. 1990. The Population of Palestine. Population History and Statistics of the Late Ottoman Period and the Mandate. New York and Oxford: Columbia University Press. [Google Scholar]
  34. McEvedy, Colin, and Richard Jones. 1978. Atlas of World Population History. Harmondsworth: Penguin. [Google Scholar]
  35. Montefiore, Moses, and Judith Cohen Montefiore. 1890. Diaries of Sir Moses and Lady Montefiore: Comprising Their Life and Work as Recorded in their Diaries from 1812 to 1883. Edited by Louis Loewe. Chicago: Belford-Clark Co. [Google Scholar]
  36. Palestine Office of the World Zionist Organization. 1918–1919. Sephirat Yehudey Eretz Israel [Enumeration of the Jews in Palestine]. Jaffa: Palestine Office of the World Zionist Organization. (In Hebrew) [Google Scholar]
  37. Schmelz, U. O. 1971. Infant and Early Childhood Mortality Among the Jews of the Diaspora. Jerusalem: The Hebrew University, Institute of Contemporary Jewry. [Google Scholar]
  38. Schmelz, U. O. 1985. The Place of the Montefiore Censuses in the History of the Jewish Population in Palestine. Tel Aviv: Montefiore Congress. (In Hebrew) [Google Scholar]
  39. Schmelz, U. O. 1987. Modern Jerusalem’s Demographic Evolution. Jerusalem: The Institute of Contemporary Jewry, The Hebrew University of Jerusalem, and The Jerusalem Institute for Israel Studies. [Google Scholar]
  40. Schmelz, U. O. 1990. Population Characteristics of Jerusalem and Hebron Regions according to Ottoman Census of 1905. In Ottoman Palestine 1800–1914: Studies in Economic and Social History. Edited by Gad Gilbar. Leiden: Brill, pp. 15–67. [Google Scholar]
  41. Schmelz, U. O. 1992. Review of: Population of Palestine: Population History and Statistics of the Late Ottoman Period and the Mandate, by J. McCarthy. Middle Eastern Studies 28: 803–7. [Google Scholar]
  42. Schmelz, U. O., and Sergio DellaPergola. 2006. Migration. In Encyclopedia Judaica, 2nd ed. Edited by Fred Skolnik. Farmington Hills: Thomson Gale, vol. 14, pp. 207–19. [Google Scholar]
  43. Stillman, Norman A. 1979a. Jews of the Maghreb in the Late Modern Era. In International Journal of Middle East Studies 11: 481–512. [Google Scholar]
  44. Stillman, Norman A. 1979b. The Jews of Arab Lands. A History and Source Book. Philadelphia: The Jewish Publication Society of America. ISBN 0-8276-0116-6. [Google Scholar]
  45. The Montefiore Endowment. n.d. Available online: https://www.montefioreendowment.org.uk/ (accessed on 24 September 2024).
  46. Weinryb, Bernard. 1972. The Jewish Population in Eastern Europe Between the Wars: Demographic and Social Trends. Jewish Social Studies 34: 139–60. [Google Scholar]
Figure 1. Map of Ottoman administrative divisions, showing censused cities—19th century.
Genealogy 09 00072 g001
Figure 2. Page of 1855 census ledger.
Genealogy 09 00072 g002
Figure 3. Comparison of growth of the Jewish population in the Land of Israel between the Montefiore censuses and the McCarthy interpretation of the first reports of Ottoman records together with published figures. Ottoman records adapted from Table 1.4D of the work of McCarthy (1990).
Genealogy 09 00072 g003
Figure 4. Geographic distribution of the places of birth of the Montefiore census of 1875. Countries in the map by present boundaries (2025). Numbers represent the number of heads of households born in that country. Color brightness increases with the number of HH born in that country.
Genealogy 09 00072 g004
Figure 5. Percentage of Jews relative to the total population of some provinces in Eastern Europe around 1900 (DellaPergola 1983). The dashed line indicates the boundaries of the area of forced Jewish settlement in Tsarist Russia. Russian Empire: 1. Warsaw; 2. Kalisz; 3. Piotrkow; 4. Kielce; 5. Radom; 6. Lublin; 7. Siedlce; 8. Płock; 9. Łomża; 10. Suwałki; 11. Kovno; 12. Vilna; 13. Grodno; 14. Minsk; 15. Vitebsk; 16. Mogilev; 17. Chernigov; 18. Volhynia; 19. Kiev; 20. Podolia; 21. Bessarabia; 22. Kherson; 23. Poltava; 24. Yekaterinoslav; 25. Taurida; 26. Courland; 27. Livonia. Austria-Hungary: 28. Galicia; 29. Bukovina; 30. Left bank of the Danube; 31. Right bank of the Danube; 32. Danube-Tisza; 33. Left bank of the Tisza; 34. Right bank of the Tisza; 35. Tisza-Maros; 36. Transylvania. Romania: 37. Oltenia; 38. Wallachia; 39. Moldavia; 40. Dobruja.
Genealogy 09 00072 g005
Figure 6. Percentage of all individuals born in the Land of Israel per census (all individuals).
Genealogy 09 00072 g006
Figure 7. Duration of stay (Sephardim, all individuals).
Genealogy 09 00072 g007
Figure 8. Number of Ashkenazim and Sephardim in the Land of Israel by census year (all individuals).
Genealogy 09 00072 g008
Figure 9. Gender distribution by census year (all individuals).
Genealogy 09 00072 g009
Figure 10. Ratio of unmarried adult men and women throughout censuses and all censuses combined and ratio of unmarried old men and old women in all censuses combined (all individuals). Adults: individuals aged between 15 and 50; Old: individuals aged more than 50.
Genealogy 09 00072 g010
Figure 11. Age combinations of married men and women for which age at census was reported (all censuses combined).
Genealogy 09 00072 g011
Figure 12. Age gaps between married men and women for which age at census was reported (all censuses combined).
Genealogy 09 00072 g012
Figure 13. Ratio of orphans and widows of Sephardim and Ashkenazim communities to their respective total population (all individuals). Ash: Ashkenazim; Seph: Sephardim.
Genealogy 09 00072 g013
Figure 14. Age distribution in all censuses combined (all individuals).
Genealogy 09 00072 g014
Figure 15. Age category distribution per census year (all individuals). Ash: Ashkenazim; Seph: Sephardim.
Genealogy 09 00072 g015
Figure 16. (a) Age composition, absolute numbers: original data, and data corrected after estimate of missing ages, all censuses combined. (b) Age composition, percentages: original data, and data corrected after estimate of missing ages, all censuses combined.
Genealogy 09 00072 g016
Figure 17. Family composition of Ashkenazim and Sephardim (all censuses combined).
Genealogy 09 00072 g017
Figure 18. Foreign-born HH by year of immigration (all censuses combined).
Genealogy 09 00072 g018
Figure 19. Foreign-born Ashkenazi and Sephardi HH by year of immigration (1875 census).
Genealogy 09 00072 g019
Figure 20. Foreign-born Ashkenazi and Sephardi HH by year of immigration (all censuses combined).
Genealogy 09 00072 g020
Figure 21. Aggregated occupations of Ashkenazim and Sephardim per census year (HH).
Genealogy 09 00072 g021
Figure 22. Socio-economic status of Ashkenazim and Sephardim per census year (HH).
Genealogy 09 00072 g022
Figure 23. Economic status of Ashkenazim and Sephardim (HH, all censuses combined).
Genealogy 09 00072 g023
Table 1. Recorded Jewish population in the Land of Israel in Montefiore censuses (all individuals).
City18391849185518661875
Acre248281187
Haifa139 15214531
Hebron418346519508939
Jaffa86264254538660
Jerusalem291545224534576811,189
Pekiin 766360
Ramla 897
Safed139118582059 *35493753
Shfaram106118114
Shkhem75845964
Tiberias8001165143620831552
Total61788722947412,58418,624
* This figure covers Safed and other locations of Upper Galilee. Bold means emphasize.
Table 2. Comparison of the number of households between 1866 Montefiore census and 1868–1869 Ottoman statistics.
CityJewish Households in 1866 Montefiore CensusJewish Households in 1868–1869 Ottoman StatisticsTotal Households in 1868–1869 Ottoman Statistics
Acre-6763
Gaza--2755
Haifa 78452
Hebron1972003000
Jaffa181-1141
Jerusalem25206302347
Nazareth--1368
Pekiin24-
Ramla 925
Safed146311972495
Shkhem (Nablus)21-1466
Tiberias863400625
Total5296243517,337
Bold means emphasize.
Disclaimer/Publisher’s Note: The statements, opinions and data contained in all publications are solely those of the individual author(s) and contributor(s) and not of MDPI and/or the editor(s). MDPI and/or the editor(s) disclaim responsibility for any injury to people or property resulting from any ideas, methods, instructions or products referred to in the content.

