
Predictors of Simulator Sickness Provocation in a Driving Simulator Operating in Autonomous Mode

 , ,
, , 
Abstract
:1. Introduction
1.1. Driving in a High-Fidelity Simulator
1.2. Simulator Sickness
1.3. Age and Sex
1.4. Visual Processing Speed and Acclimation Scenario
1.5. Rationale and Significance
1.6. Purpose
2. Materials and Methods
2.1. Ethics
2.2. Design
2.3. Recruitment
Participants
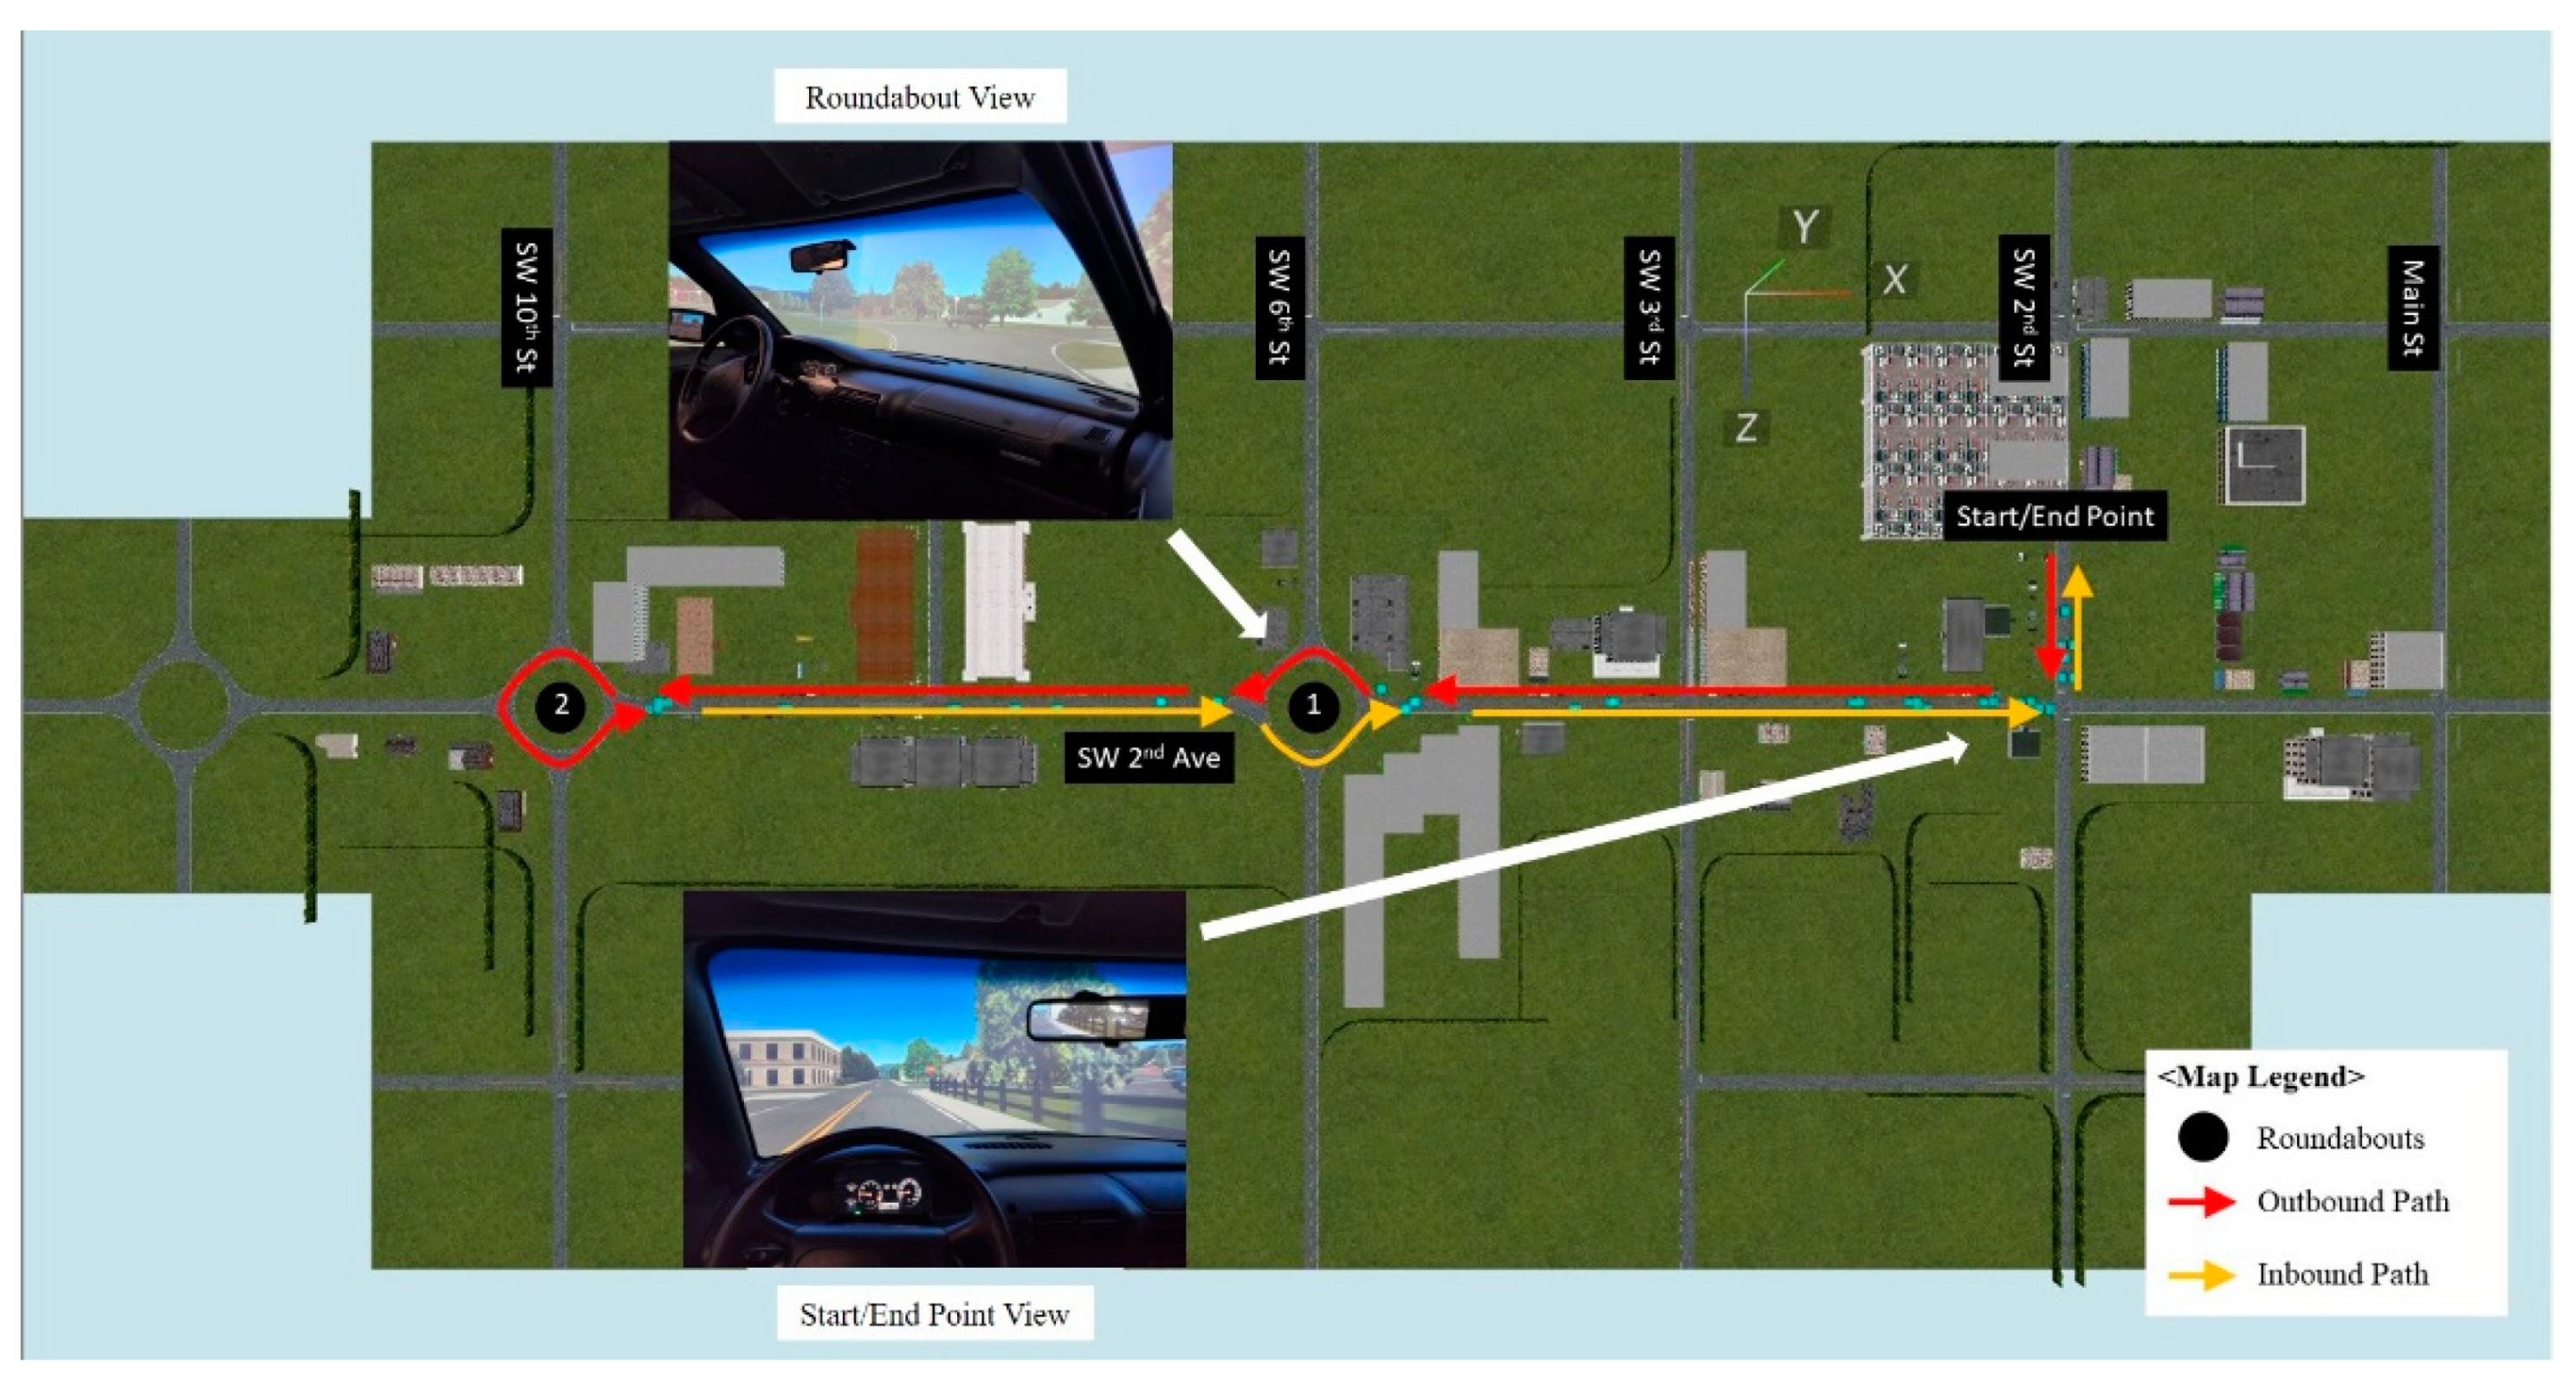
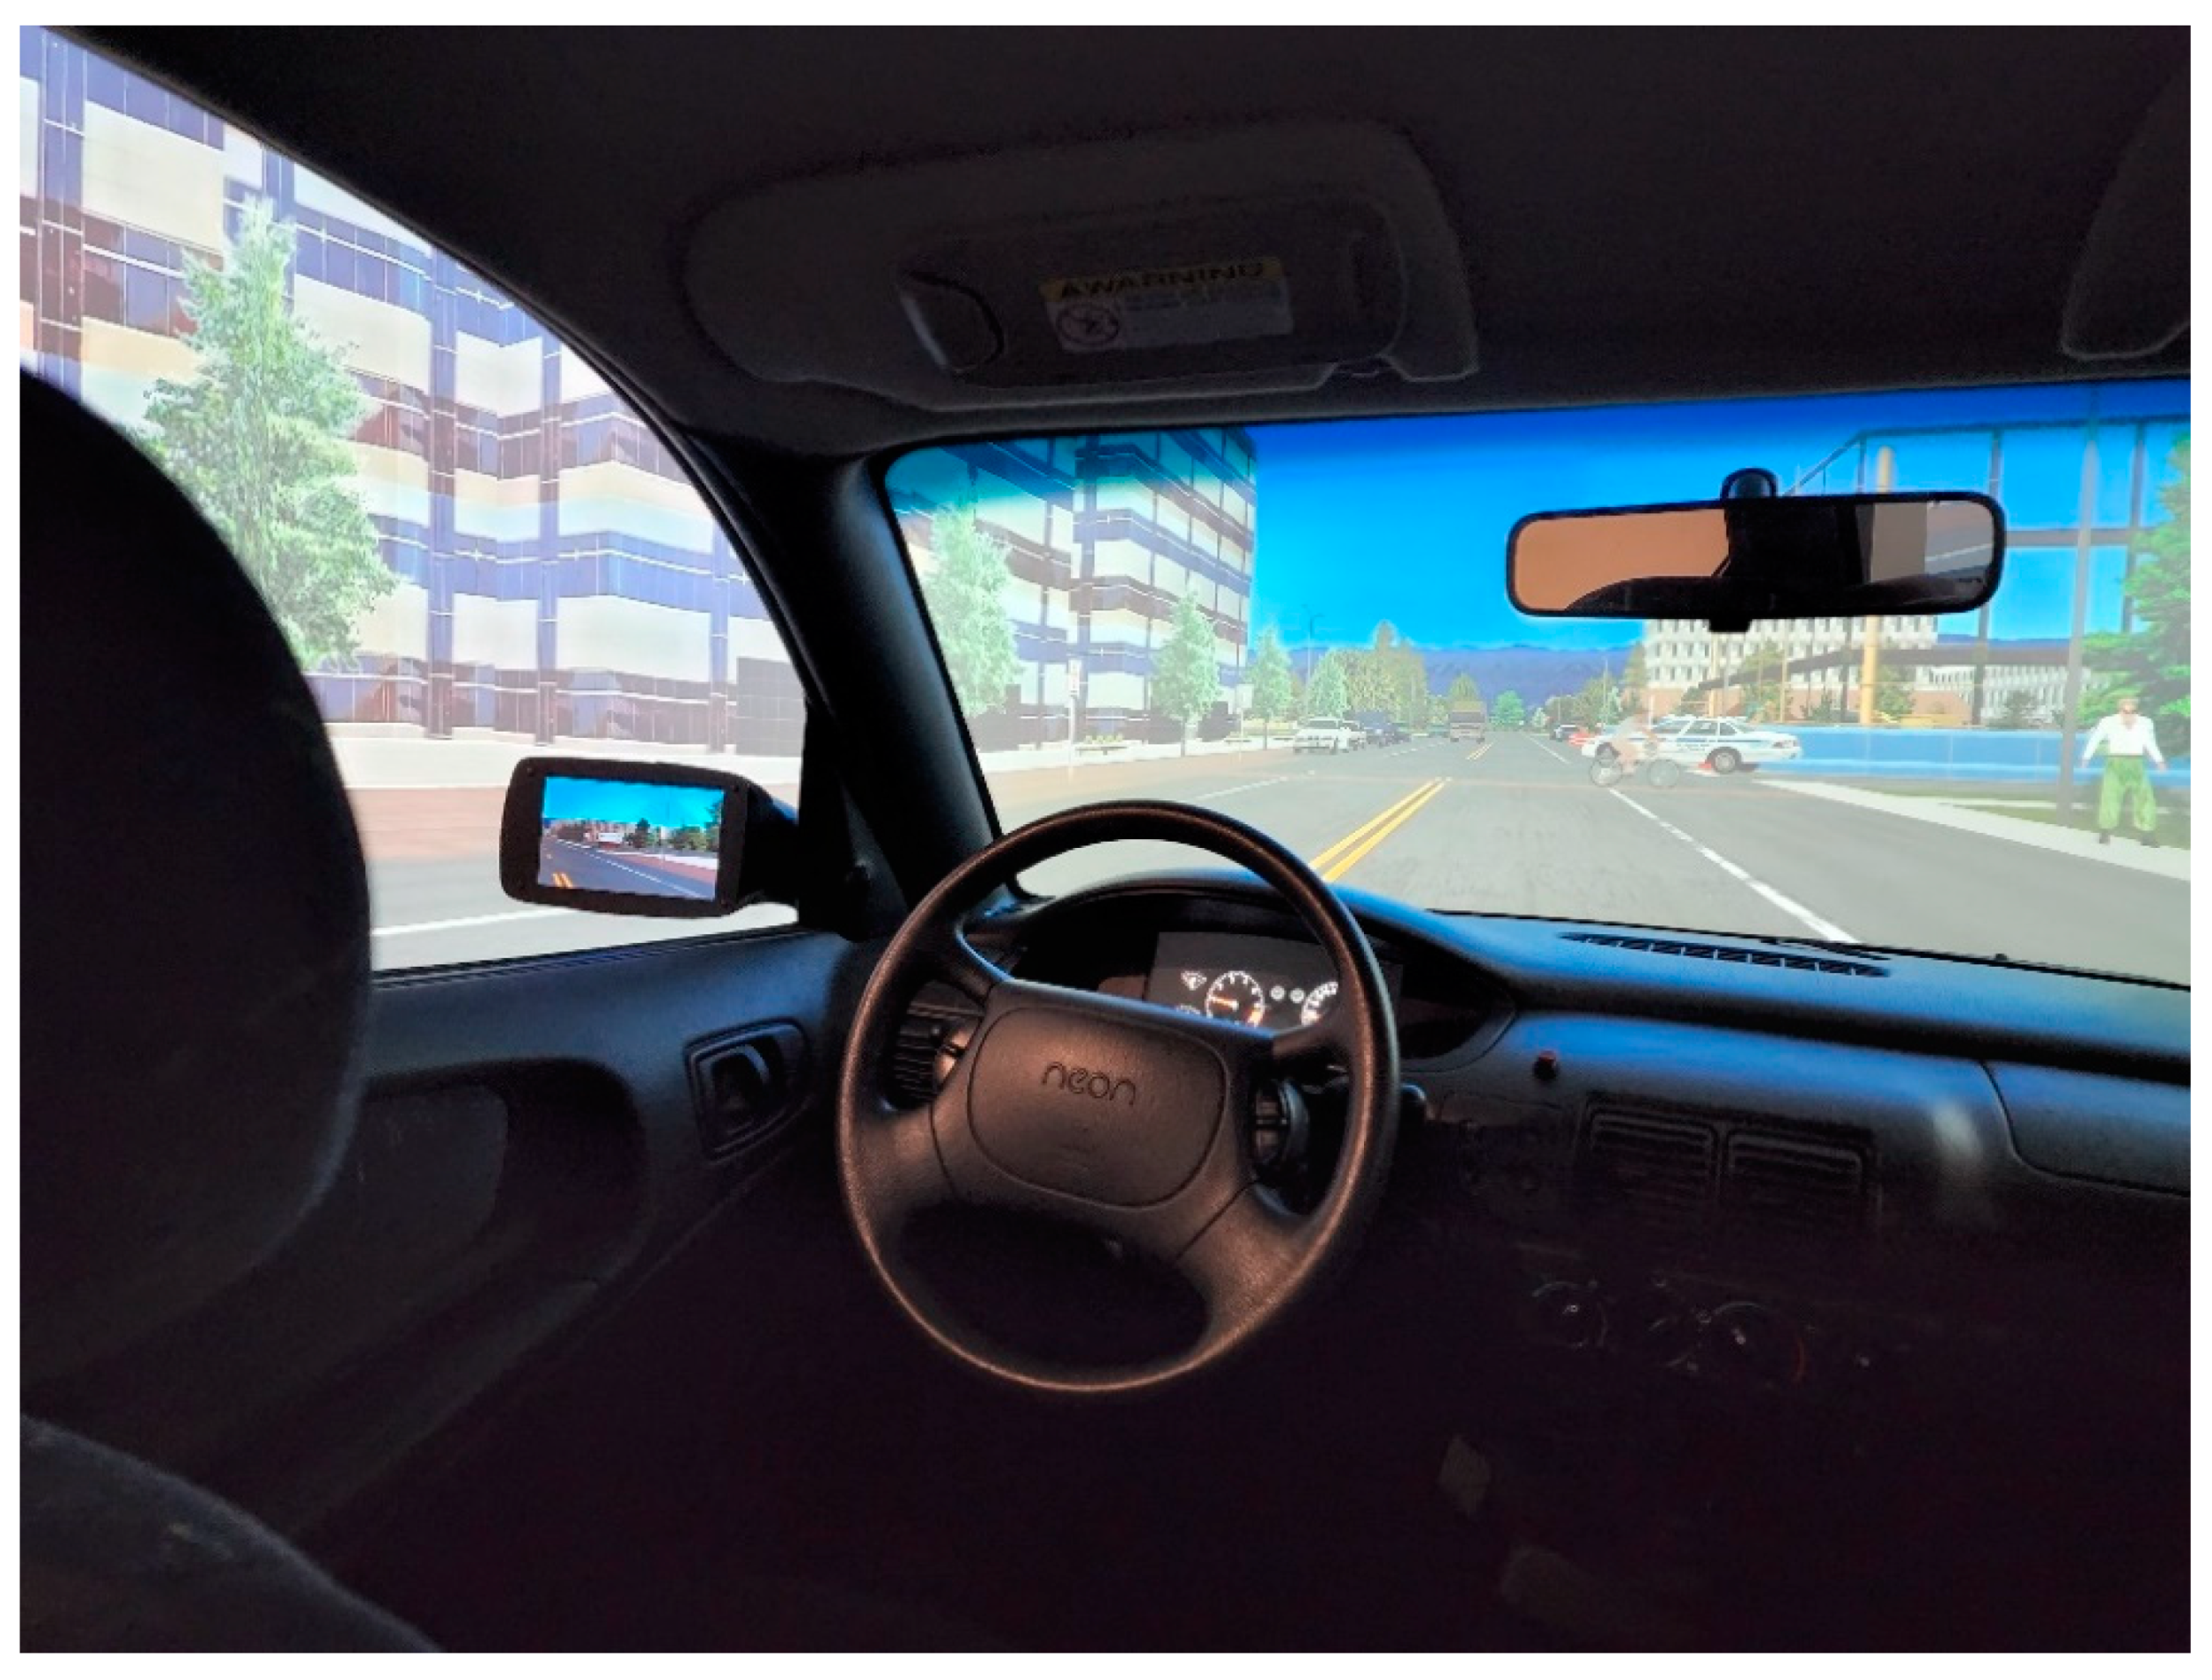
2.4. Setting
Equipment and Driving Simulator Scenario
2.5. Measurement
2.6. Procedure
2.7. Data Collection and Management
2.8. Data Analysis
3. Results
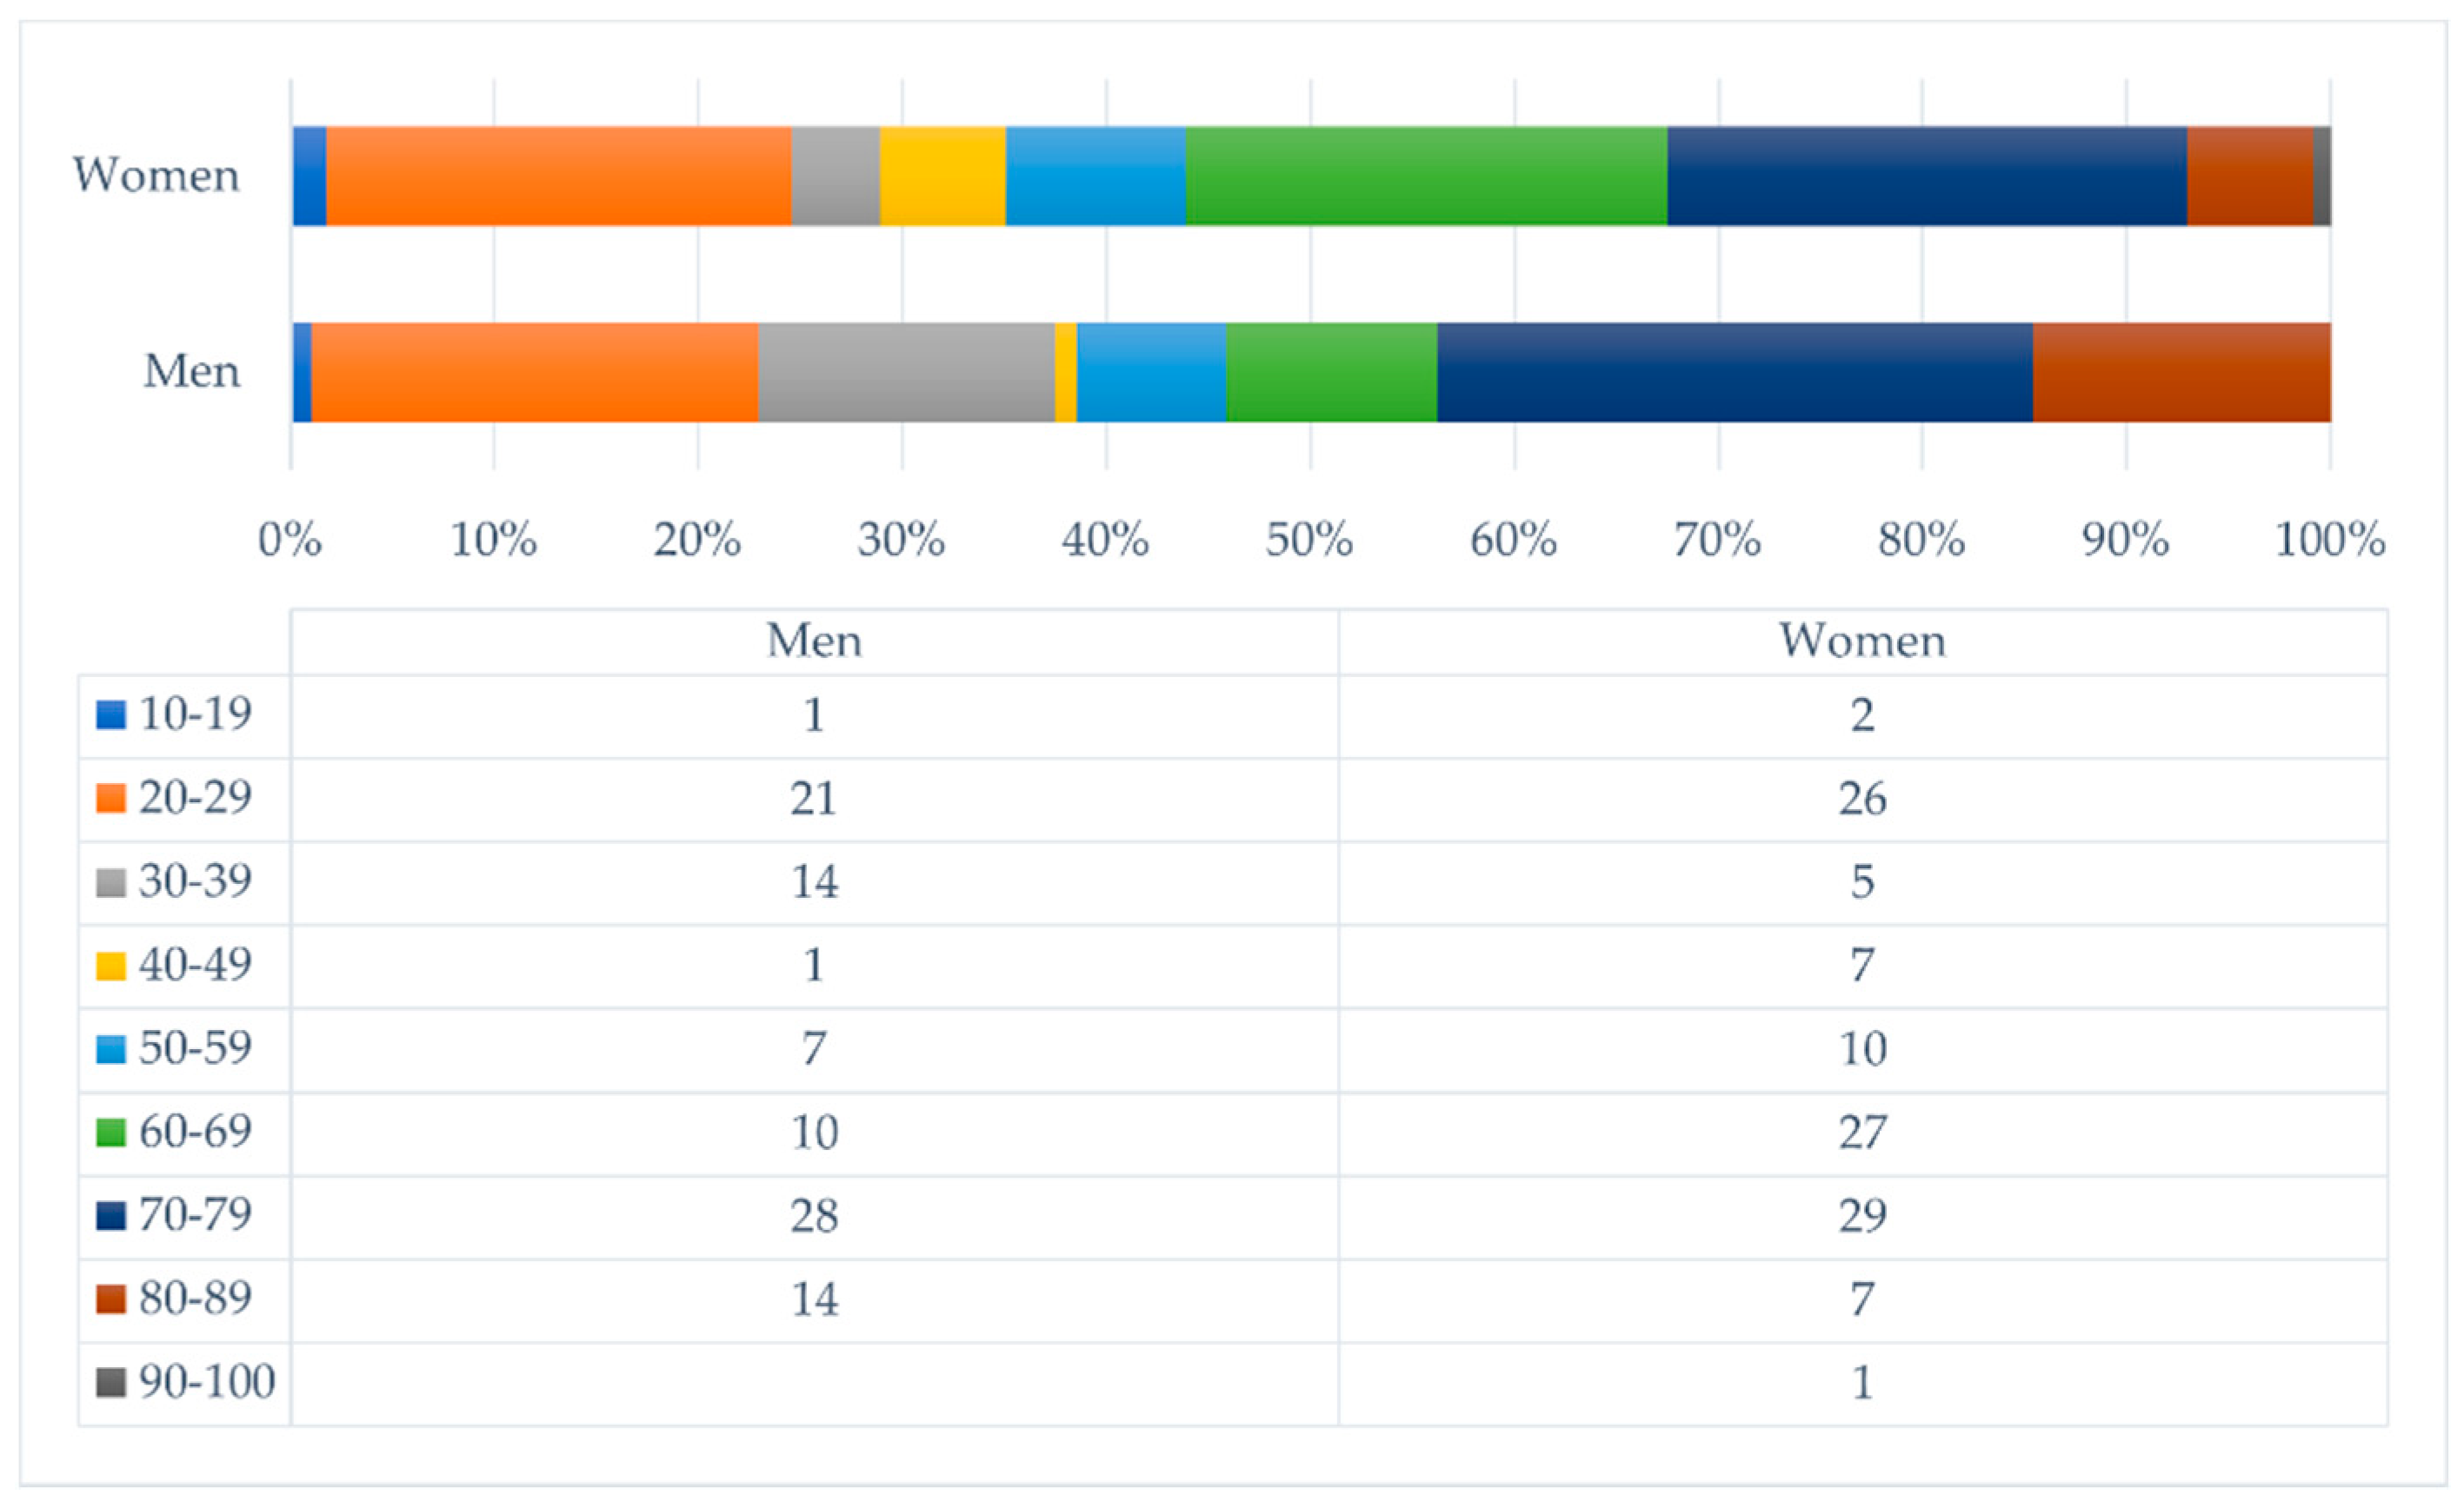
3.1. Demographics for Visual Processing Speed, Acclimation, and Simulator Sickness Provocation
3.2. Predictors of Simulator Sickness Provocation
4. Discussion
4.1. Age, Sex, Visual Processing Speed, Acclimation, and Simulator Sickness Provocation
4.2. Simulator Sickness Provocation
4.3. Limitations and Strengths
5. Conclusions
Author Contributions
Funding
Institutional Review Board Statement
Informed Consent Statement
Data Availability Statement
Acknowledgments
Conflicts of Interest
References
- Society of Automotive Engineers International. Taxonomy and Definitions for Terms Related to Driving Automation Systems for On-road Motor Vehicles (J3016_201806). Retrieved from Warrendale, PA, USA. Available online: https://doi.org/10.4271/j3016_201609 (accessed on 24 May 2022). [CrossRef]
- Ondruš, J.; Kolla, E.; Vertaľ, P.; Šarić, Ž. How do autonomous cars work? Transp. Res. Procedia 2020, 44, 226–233. [Google Scholar] [CrossRef]
- Bezai, N.E.; Medjdoub, B.; Al-Habaibeh, A.; Chalal, M.L.; Fadli, F. Future cities and autonomous vehicles: Analysis of the barriers to full adoption. Energy Built Environ. 2021, 2, 65–81. [Google Scholar] [CrossRef]
- Iskander, J.; Attia, M.; Saleh, K.; Nahavandi, D.; Abobakr, A.; Mohamed, S.; Asadi, H.; Khosravi, A.; Lim, C.P.; Hossny, M. From car sickness to autonomous car sickness: A review. Transp. Res. Part F Traffic Psychol. Behav. 2019, 62, 716–726. [Google Scholar] [CrossRef]
- Classen, S.; Hwangbo, S.W.; Mason, J.; Wersal, J.; Rogers, J.; Sisiopiku, V.P. Older drivers’ motion and simulator sickness before and after automated vehicle exposure. Safety 2021, 7, 26. [Google Scholar] [CrossRef]
- Haghzare, S.; Campos, J.L.; Bak, K.; Mihailidis, A. Older adults’ acceptance of fully automated vehicles: Effects of exposure, driving style, age, and driving conditions. Accid. Anal. Prev. 2021, 150, 105919. [Google Scholar] [CrossRef]
- Brooks, J.O.; Goodenough, R.R.; Crisler, M.C.; Klein, N.D.; Alley, R.L.; Koon, B.L.; Ellipsis Wills, R.F. Simulator sickness during driving simulation studies. Accid. Anal. Prev. 2010, 42, 788–796. [Google Scholar] [CrossRef]
- Classen, S.; Mason, J.; Hwangbo, S.W.; Wersal, J.; Rogers, J.; Sisiopiku, V. Older drivers’ experience with automated vehicle technology. J. Transp. Health 2021, 22, 101107. [Google Scholar] [CrossRef]
- Cassavaugh, N.D.; Domeyer, J.E.; Backs, R.W. Lessons learned regarding simulator sickness in older adult drivers. In Proceedings of the 6th International Conference, UAHCI 2011, Held as Part of HCI International 2011, Orlando, FL, USA, 9–14 July 2011; Springer Science & Business Media: Berlin/Heidelberg, Germany, July, 2011; pp. 263–269. [Google Scholar]
- Classen, S.; Bewernitz, M.; Shechtman, O. Driving simulator sickness: An evidence-based review of the literature. Am. J. Occup. Ther. 2011, 65, 179–188. [Google Scholar] [CrossRef] [Green Version]
- Matas, N.A.; Nettelbeck, T.; Burns, N.R. Dropout during a driving simulator study: A survival analysis. J. Saf. Res. 2015, 55, 159–169. [Google Scholar] [CrossRef]
- Trick, L.M.; Caird, J.K. Methodological issues when conducting research on older drivers. In Handbook of Driving Simulation for Engineering, Medicine, and Psychology; Fisher, D.L., Rizzo, M., Caird, J., Lee, J.D., Eds.; CRC Press: Boca Raton, FL, USA, 2011. [Google Scholar]
- Habekost, T.; Vogel, A.; Rostrup, E.; Bundesen, C.; Kyllingsbaek, S.; Garde, E.; Ryberg, C.; Waldemar, G.; Waldemar, G. Visual processing speed in old age. Scand. J. Psychol. 2013, 54, 89–94. [Google Scholar] [CrossRef]
- Kawano, N.; Iwamoto, K.; Ebe, K.; Aleksic, B.; Noda, A.; Umegaki, H.; Kuzuya, M.; Iidaka, T.; Ozaki, N. Slower adaptation to driving simulator and simulator sickness in older adults aging clinical and experimental research. Aging Clin. Exp. Res. 2012, 24, 285–289. [Google Scholar] [CrossRef] [PubMed]
- Domeyer, J.E.; Cassavaugh, N.D.; Backs, R.W. The use of adaptation to reduce simulator sickness in driving assessment and research. Accid. Anal. Prev. 2013, 53, 127–132. [Google Scholar] [CrossRef] [PubMed]
- Schweig, S.; Liebherr, M.; Schramm, D.; Brand, M.; Maas, N. The Impact of Psychological and Demographic Parameters on Simulator Sickness. In Proceedings of the 8th International Conference on Simulation and Modeling Methodologies, Technologies and Applications—Simultech, Simultech 2018, Porto, Portugal, 29–31 July; SCITEPRESS: Setúbal, Portugal, 2018; pp. 91–97. [Google Scholar]
- Van Driel, C.J.; Hoedemaeker, M.; Van Arem, B. Impacts of a congestion assistant on driving behaviour and acceptance using a driving simulator. Transp. Res. Part F Traffic Psychol. Behav. 2007, 10, 139–152. [Google Scholar] [CrossRef]
- Faust, K.; Casteel, C.; McGehee, D.V.; Ramirez, M.; Rohlman, D.S.; Peek-Asa, C. Examination of realism in a high-fidelity tractor driving simulator. J. Agric. Saf. Health 2020, 26, 123–137. [Google Scholar] [CrossRef] [PubMed]
- Danner, S.; Feierle, A.; Manger, C.; Bengler, K. Context-Adaptive Availability Notifications for an SAE Level 3 Automation. Multimodal Technol. Interact. 2021, 5, 16. [Google Scholar] [CrossRef]
- Roe, C.; Brown, T.; Watson, G. Factors associated with simulator sickness in a high-fidelity simulator. Education 2007, 251, 5A. [Google Scholar]
- Balk, S.A.; Bertola, M.A.; Inman, V.W. Simulator sickness questionnaire: Twenty years later. In Proceedings of the Seventh International Driving Symposium on Human Factors in Driver Assessment, Training and Vehicle Design, 2013 Driving Assessment Conference, Bolton Landing, NY, USA, 17–20 June 2013; Public Policy Center, University of Iowa: Iowa City, IA, USA, June, 2013; pp. 257–263. [Google Scholar]
- Keshavarz, B.; Ramkhalawansingh, R.; Haycock, B.; Shahab, S.; Campos, J.L. Comparing simulator sickness in younger and older adults during simulated driving under different multisensory conditions. Transp. Res. Part F Traffic Psychol. Behav. 2018, 54, 47–62. [Google Scholar] [CrossRef]
- Morris, D.M.; Erno, J.M.; Pilcher, J.J. Electrodermal response and automation trust during simulated self-driving car use. In Proceedings of the Human Factors and Ergonomics Society Annual Meeting, Austin, TX, USA, 9–13 October 2017; SAGE Publications: Los Angeles, CA, USA, September, 2017; Volume 61, pp. 1759–1762. [Google Scholar]
- Jäger, M.; Gruber, N.; Müri, R.; Mosimann, U.P.; Nef, T. Manipulations to reduce simulator-related transient adverse health effects during simulated driving. Med. Biol. Eng. Comput. 2014, 52, 601–610. [Google Scholar] [CrossRef]
- Jacobs, M.; van der Zwaan, K.F.; Hart, E.P.; Groeneveld, G.J.; Roos, R.A. Comparable rates of simulator sickness in Huntington’s disease and healthy individuals. Transp. Res. Part F Traffic Psychol. Behav. 2019, 60, 499–504. [Google Scholar] [CrossRef]
- Fisher, D.L.; Caird, J.K.; Rizzo, M.; Lee, J.D. Handbook of Driving Simulation for Engineering, Medicine and Psychology; CRC Press: Boca Raton, FL, USA, 2011. [Google Scholar]
- Classen, S.; Wersal, J.; Mason, J.; Rogers, J.; Sisiopiku, V. Face and content validity of an automated vehicle road course and a corresponding simulator scenario. Front. Future Transp. 2020, 1, 596620. [Google Scholar] [CrossRef]
- Reitan, R.M. Validity of the Trail Making Test as an indicator of organic brain damage. Percept. Mot. Ski. 1958, 8, 271–276. [Google Scholar] [CrossRef]
- Nasreddine, Z.S.; Phillips, N.A.; Bédirian, V.; Charbonneau, S.; Whitehead, V.; Collin, I.; Cummings, J.L.; Chertkow, H. The Montreal Cognitive Assessment, MoCA: A brief screening tool for mild cognitive impairment. J. Am. Geriatr. Soc. 2005, 53, 695–699. [Google Scholar] [CrossRef] [PubMed]
- Classen, S.; Mason, J.; Wersal, J.; Sisiopiku, V.; Rogers, J. Older drivers’ experience with automated vehicle technology: Interim analysis of a demonstration study. Front. Sustain. Cities 2020, 2, 27. [Google Scholar] [CrossRef]
- US Department of Health & Human Services. Clinical Research Study Investigator’s Toolbox. Available online: https://www.nia.nih.gov/research/clinical-research-study-investigators-toolbox#forms (accessed on 1 January 2021).
- Fals-Stewart, W. An interrater reliability study of the Trail Making Test (Parts A and B). Percept. Mot. Ski. 1992, 74, 39–42. [Google Scholar] [CrossRef]
- Wagner, S.; Helmreich, I.; Dahmen, N.; Lieb, K.; Tadić, A. Reliability of three alternate forms of the Trail Making Tests A and B. Arch. Clin. Neuropsychol. 2011, 26, 314–321. [Google Scholar] [CrossRef]
- Stern, E.B.; Akinwuntan, A.E.; Hirsch, P. Simulator sickness: Strategies for mitigation and prevention. In Driving Simulation for Assessment, Intervention, and Training: A Guide for Occupational Therapy and Health Care Professionals, 1st ed.; Classen, S., Ed.; American Occupational Therapy Press: North Bethesda, MD, USA, 2017; pp. 107–120. [Google Scholar]
- Harris, P.A.; Taylor, R.; Minor, B.L.; Elliott, V.; Fernandez, M.; O’Neal, L.; McLeod, L.; Delacqua, G.; Delacqua, F.; Kirby, J.; et al. The REDCap consortium: Building an international community of software platform partners. J. Biomed. Inform. 2019, 95, 103208. [Google Scholar] [CrossRef]
- Hocking, R.R. A Biometrics invited paper. The analysis and selection of variables in linear regression. Biometrics 1976, 32, 1–49. [Google Scholar] [CrossRef]
- R Core Team. R: A Language and Environment for Statistical Computing; R Foundation for Statistical Computing: Vienna, Austria, 2020; Available online: https://www.R-project.org/ (accessed on 9 July 2022).
- U.S. Census Bureau. How Do U.S. Populations Stack Up? Reading, Analyzing, and Creating Population Pyramids [Press release]. Available online: https://www.census.gov/programs-surveys/sis/activities/geography/pop-stackup.html (accessed on 13 July 2022).
- Ball, K.; Owsley, C.; Stalvey, B.; Roenker, D.L.; Sloane, M.E.; Graves, M. Driving avoidance and functional impairment in older drivers. Accid. Anal. Prev. 1998, 30, 313–322. [Google Scholar] [CrossRef]
- Classen, S.; Wang, Y.; Crizzle, A.M.; Winter, S.M.; Lanford, D.N. Predicting older driver on-road performance by means of the Useful Field of View and Trail Making Test Part B. Am. J. Occup. Ther. 2013, 67, 574–582. [Google Scholar] [CrossRef] [Green Version]
- Owsley, C.; Ball, K.; McGwin Jr, G.; Sloane, M.E.; Roenker, D.L.; White, M.F.; Overley, E.T. Visual processing impairment and risk of motor vehicle crash among older adults. JAMA 1998, 279, 1083–1088. [Google Scholar] [CrossRef]
- Stoner, H.A.; Fisher, D.L.; Mollenhauer, M. Simulator and scenario factors influencing simulator sickness. In Handbook of Driving Simulation for Engineering, Medicine, and Psychology; CRC Press: Boca Raton, FL, USA, 2011. [Google Scholar]


| Factor | Value | Frequency (%) |
|---|---|---|
| Sex | Male | 96 (46%) |
| Female | 114 (54%) | |
| Ethnicity | African American or Black | 20 (10%) |
| Asian/Pacific Islander | 39 (18%) | |
| Caucasian or White | 129 (61%) | |
| Hispanic or Latino | 14 (7%) | |
| Multiracial | 2 (1%) | |
| Would rather not say | 1 (1%) | |
| Other | 5 (2%) | |
| Education | No high school diploma | 1 (1%) |
| High school graduate or equivalent | 9 (4%) | |
| Some college credits | 30 (14%) | |
| Trade/Technical/Vocational training | 3 (2%) | |
| Associate degree | 21 (10%) | |
| Bachelor’s degree | 53 (25%) | |
| Master’s degree | 61 (29%) | |
| Doctorate/Professional degree | 32(15%) | |
| Marital Status | Single, never married | 69 (33%) |
| Married or domestic partnership | 108 (51%) | |
| Widowed | 12 (6%) | |
| Divorced | 21 (10%) | |
| Employment | Part-time | 25 (12%) |
| Full-time | 34 (16%) | |
| Retired | 92 (44%) | |
| Unable to work | 4 (2%) | |
| Student | 48 (23%) | |
| Homemaker | 5 (2%) | |
| Unemployed | 2 (1%) |
| Initial Full Models | Final Models after Backward Stepwise Removal | Final Models after Backward Stepwise Removal (With Age as a Categorical Variable) | ||||||||||||
|---|---|---|---|---|---|---|---|---|---|---|---|---|---|---|
| Queasiness | b | SE | p | Exp(B) | Queasiness | b | SE | p | Exp(B) | Queasiness | b | SE | p | Exp(B) |
| Age | −0.019 | 0.001 | 0.053 | 0.982 | Age | −0.018 | 0.01 | 0.054 | 0.982 | Age (Y + M) | 0.722 | 0.392 | 0.066 | 2.058 |
| Sex | −0.073 | 0.352 | 0.835 | 0.929 | Sex | - | - | - | - | Sex | - | - | - | - |
| TMT-A | 0.032 | 0.021 | 0.128 | 1.032 | TMT-A | 0.031 | 0.021 | 0.13 | 1.032 | TMT-A | 0.025 | 0.02 | 0.197 | 1.026 |
| Acc | 0.009 | 0.35 | 0.978 | 1.01 | Acc | - | - | - | - | Acc | - | - | - | - |
| Nausea | b | SE | p | Exp(B) | Nausea | b | SE | p | Exp(B) | Nausea | b | SE | p | Exp(B) |
| Age | 0.004 | 0.011 | 0.727 | 1.004 | Age | - | - | - | - | Age (Y + M) | −0.201 | 0.481 | 0.676 | 0.818 |
| Sex | 0.006 | 0.416 | 0.988 | 1.006 | Sex | - | - | - | - | Sex | - | - | - | - |
| TMT-A | 0.055 | 0.029 | 0.059 | 0.06 | TMT-A | 0.06 | 0.025 | 0.015 | 1.062 | TMT-A | 0.055 | 0.027 | 0.045 | 1.056 |
| Acc | 0.245 | 0.418 | 0.557 | 1.278 | Acc | - | - | - | - | Acc | - | - | - | - |
| Dizziness | b | SE | p | Exp(B) | Dizziness | b | SE | p | Exp(B) | Dizziness | b | SE | p | Exp(B) |
| Age | 0.016 | 0.008 | 0.06 | 1.016 | Age | 0.016 | 0.008 | 0.062 | 1.016 | Age (Y + M) | −0.577 | 0.36 | 0.109 | 0.562 |
| Sex | 0.227 | 0.324 | 0.483 | 1.255 | Sex | - | - | - | - | Sex | - | - | - | - |
| TMT-A | 0.04 | 0.021 | 0.049 | 1.041 | TMT-A | 0.041 | 0.021 | 0.047 | 1.042 | TMT-A | 0.048 | 0.019 | 0.011 | 1.050 |
| Acc | 0.083 | 0.032 | 0.798 | 1.087 | Acc | - | - | - | - | Acc | - | - | - | - |
| Sweatiness | b | SE | p | Exp(B) | Sweatiness | b | SE | p | Exp(B) | Sweatiness | b | SE | p | Exp(B) |
| Age | −0.018 | 0.014 | 0.198 | 0.982 | Age | - | - | - | - | Age (Y + M) | - | - | - | - |
| Sex | 0.394 | 0.53 | 0.45 | 0.457 | Sex | - | - | - | - | Sex | - | - | - | - |
| TMT-A | 0.054 | 0.036 | 0.129 | 1.056 | TMT-A | - | - | - | - | TMT-A | - | - | - | - |
| Acc | −0.058 | 0.526 | 0.912 | 0.944 | Acc | - | - | - | - | Acc | - | - | - | - |
Publisher’s Note: MDPI stays neutral with regard to jurisdictional claims in published maps and institutional affiliations. |
© 2022 by the authors. Licensee MDPI, Basel, Switzerland. This article is an open access article distributed under the terms and conditions of the Creative Commons Attribution (CC BY) license (https://creativecommons.org/licenses/by/4.0/).
Share and Cite
Hwangbo, S.W.; Classen, S.; Mason, J.; Yang, W.; McKinney, B.; Kwan, J.; Sisiopiku, V. Predictors of Simulator Sickness Provocation in a Driving Simulator Operating in Autonomous Mode. Safety 2022, 8, 73. https://doi.org/10.3390/safety8040073
Hwangbo SW, Classen S, Mason J, Yang W, McKinney B, Kwan J, Sisiopiku V. Predictors of Simulator Sickness Provocation in a Driving Simulator Operating in Autonomous Mode. Safety. 2022; 8(4):73. https://doi.org/10.3390/safety8040073
Chicago/Turabian StyleHwangbo, Seung Woo, Sherrilene Classen, Justin Mason, Wencui Yang, Brandy McKinney, Joseph Kwan, and Virginia Sisiopiku. 2022. "Predictors of Simulator Sickness Provocation in a Driving Simulator Operating in Autonomous Mode" Safety 8, no. 4: 73. https://doi.org/10.3390/safety8040073
APA StyleHwangbo, S. W., Classen, S., Mason, J., Yang, W., McKinney, B., Kwan, J., & Sisiopiku, V. (2022). Predictors of Simulator Sickness Provocation in a Driving Simulator Operating in Autonomous Mode. Safety, 8(4), 73. https://doi.org/10.3390/safety8040073