1. Introduction
Globally, road traffic remains one of the leading causes of death, with more than 1.35 million fatalities in 2018 [
1]. To counteract this trend, multiple countries have committed to the goal of Vision Zero—road traffic without fatalities or severe injuries. Both the European Union (EU) and Germany individually are pursuing this goal. The EU has set its goal of halving collisions with fatalities and severe injuries from 2020 to 2030 [
2]. Germany aims to reduce fatal collisions by 40% in the same period [
3]. However, the decrease in severe collisions has slowed in the last decade, both in the EU and Germany (see
Figure 1). This indicates that current efforts to increase road safety are not sufficient.
In many European countries, including Germany, road safety work is based on decade-old reactive approaches [
4]. For instance, in Germany, according to the Road Traffic Act (Straßenverkehrsordnung (StVO)), the road traffic authorities and the police are legally required to participate in local collision investigations. Collision commissions conduct the reactive investigations after collision black spots have been identified. Collision black spots are defined as locations where the number of collisions exceeds a threshold in a period of one, respectively three years [
5]. Other European countries follow similar approaches in black spot management [
6]. Although more sophisticated methods inspire state-of-the-art methods in black spot management, they are still reactive as they rely on collision data. Modern proactive approaches focus on the early detection (e.g., EDDA+ (Early Detection of Dangerous Areas in road traffic using smart data;
https://www.gefahrenstellen.de/about-us/ (accessed on 17 June 2022) [
7])) and the prediction of collision hot spots (based on temporal–spatial models [
8]).
Figure 1.
Number of fatal collisions in the EU and Germany from 2001 to 2020 (dottet lines = intermediate goal for reaching Vision Zero; data from eurostat [
9]).
Figure 1.
Number of fatal collisions in the EU and Germany from 2001 to 2020 (dottet lines = intermediate goal for reaching Vision Zero; data from eurostat [
9]).
From a methodological perspective, the reactive approaches mentioned above are problematic because focusing on collision data as a single source for traffic safety assessment has a significant drawback: Collisions are rare events, and therefore, it takes a long time until collision-prone areas are reliably detected. This practice is also questionable from an ethical and moral point of view because human damage must be accepted. Furthermore, because of collisions being rare events, collision data are subject to the effect of regression to the mean. For example, this effect must be considered in safety analyses with the empirical Bayes method [
10]. Additionally, collisions involving bicyclists in particular and collisions with slight personal damage are underreported [
11,
12,
13], which exacerbates the issues mentioned above. As a result, hazardous locations may remain undetected if collision data on them are erroneously not collected. Another shortcoming relates to the content of information. Information on the behavior of road users and reconstructions of collisions is often missing or only sparsely included in collision data [
14]. It is even more challenging to determine the actual causes and potential safety deficits.
New approaches and data sources are evolving to address these issues. As road traffic authorities in the EU and Germany are responsible for the construction, maintenance, and operation of roads, they are obliged to inspect the integrity of the planned and existing infrastructure. With its
Directive 2008/96/EC of the European Parliament and of the Council of 19 November 2008 on Road Infrastructure Safety Management [
15], the EU Commission now stipulates that road safety work should shift from a reactive towards a proactive approach. This is to prevent collisions before they happen, thus leading to a novel perspective that emphasizes the safety assessment of road traffic detached from collision data. Proactive safety ratings are carried out in many European countries with the European Road Assessment Programme (EuroRAP), which assesses major roads based on road inspection data [
16]. A further proactive approach is road safety audits conducted by certified road safety auditors [
17]. However, these approaches are usually only conducted on major roads.
Traffic conflict techniques take another approach to the proactive assessment of risks in road traffic. Here, observations of conflicts between individual road users serve as a surrogate for collisions [
18]. Several different surrogate safety measures (SSM) have been developed in the past decades to capture the spatial or temporal proximity between two road users. Widely used indicators are the time to collision (TTC) and the post encroachment time (PET) [
19]. These and other indicators can now be computed using video analysis, which helps reduce observer bias and improves the reliability and accuracy of conflict analysis [
20]. Observing road traffic conflicts allows us to collect the necessary data about road traffic safety risks at one specific location in a shorter time than with collision data.
Smart data analyses are another proactive method in contemporary road safety work of predicting and preventing road traffic collisions: For instance, in hot spot analyses and risk terrain modeling, various location- and time-based data sources such as (past) traffic collision data, weather data, traffic volume, geographic information, and socioeconomic data on road users are combined and analyzed to predict areas of risk [
8]. All of the abovementioned proactive approaches have in common that their methodologies do not involve road traffic users actively in the assessment process but instead focus on the quality of the infrastructure or observing road users’ behavior. In the present study, we aim at the road users’ knowledge and experience about their safety issues in road traffic and therefore introduce the approach of crowdsourcing in road traffic safety work.
1.1. Crowdsourcing Data in Road Safety Work
Since the beginning of the new millennium, crowdsourcing has become increasingly popular [
21,
22]. It is described as the participatory, digital, and voluntary work on a task posed by one or more individuals [
23]. The crowd working on the task contributes labor, money, knowledge, and/or experience in return for satisfying their needs (e.g., social recognition, community, safety). Related terms include citizen participation, citizen science, and volunteered geographic information [
24,
25]. Crowdsourcing yields desired results fast, on a large scale and, above all, at a low cost.
In terms of road safety work, crowdsourcing has been used recently, for example, to investigate underreporting in police collision data [
26] or to identify risk factors for bicyclist crashes [
27]. An essential requirement for crowdsourcing activities is the internet. However, crowds’ knowledge for improving traffic safety can also be accessed in analog ways [
28,
29]. Nevertheless, most platforms and studies that address self-reports in road safety work leverage digital crowdsourcing tools [
30,
31,
32,
33,
34,
35]. The widespread availability of smartphones and mobile networks facilitates this aspect.
Many obstacles yet counter the advantages of crowdsourcing. In data privacy, often nothing is known about the individual user, so it must be assumed that the crowd cannot represent the broad population [
36]. This can already be substantiated by the fact that digital affinity among women and older population groups is suspected to be lower, so that they might be underrepresented in crowds [
32,
37]. As with other crowdsourcing approaches, the strength of the low threshold for participation is also its weakness: The individual user’s contribution can be influenced and thus distorted by all conceivable factors. As part of EDDA+, stakeholders in road traffic safety work (e.g., researchers, authorities, and municipalities) were questioned about the EDDA+ concept [
7] and the potential contributions of collision data, kinematic car data, and reported danger spots to an overall hazard score. Most participants agreed that collision and kinematic car data were more reliable data sources for the hazard score than reported danger spots. However, most participants were optimistic about the active participation of road users, though some expressed concerns about the subjective nature of user reports and the potential for misuse.
Nevertheless, crowdsourcing data might be an early warning indicator in road safety work. As the crowd are the daily road users, they experience road traffic in various situations and conditions and therefore perceive risks before authorities and road safety auditors become aware of them. From this perspective, the systematic collection of road users’ experiences might be a valuable source for the early detection of danger spots when combined with collision data and kinematic car data. In the EDDA+ approach, hazard assessments will be calculated by blending road user reports, collision data, and kinematic car data [
7]. The resulting hazard maps can be used by various user groups involved in road safety work, such as local authorities, the police, research institutes, and road users.
1.2. Introduction to the Crowdsourcing Platform within EDDA+
For the systematic collection of road users’ knowledge and experiences, the web-based platform
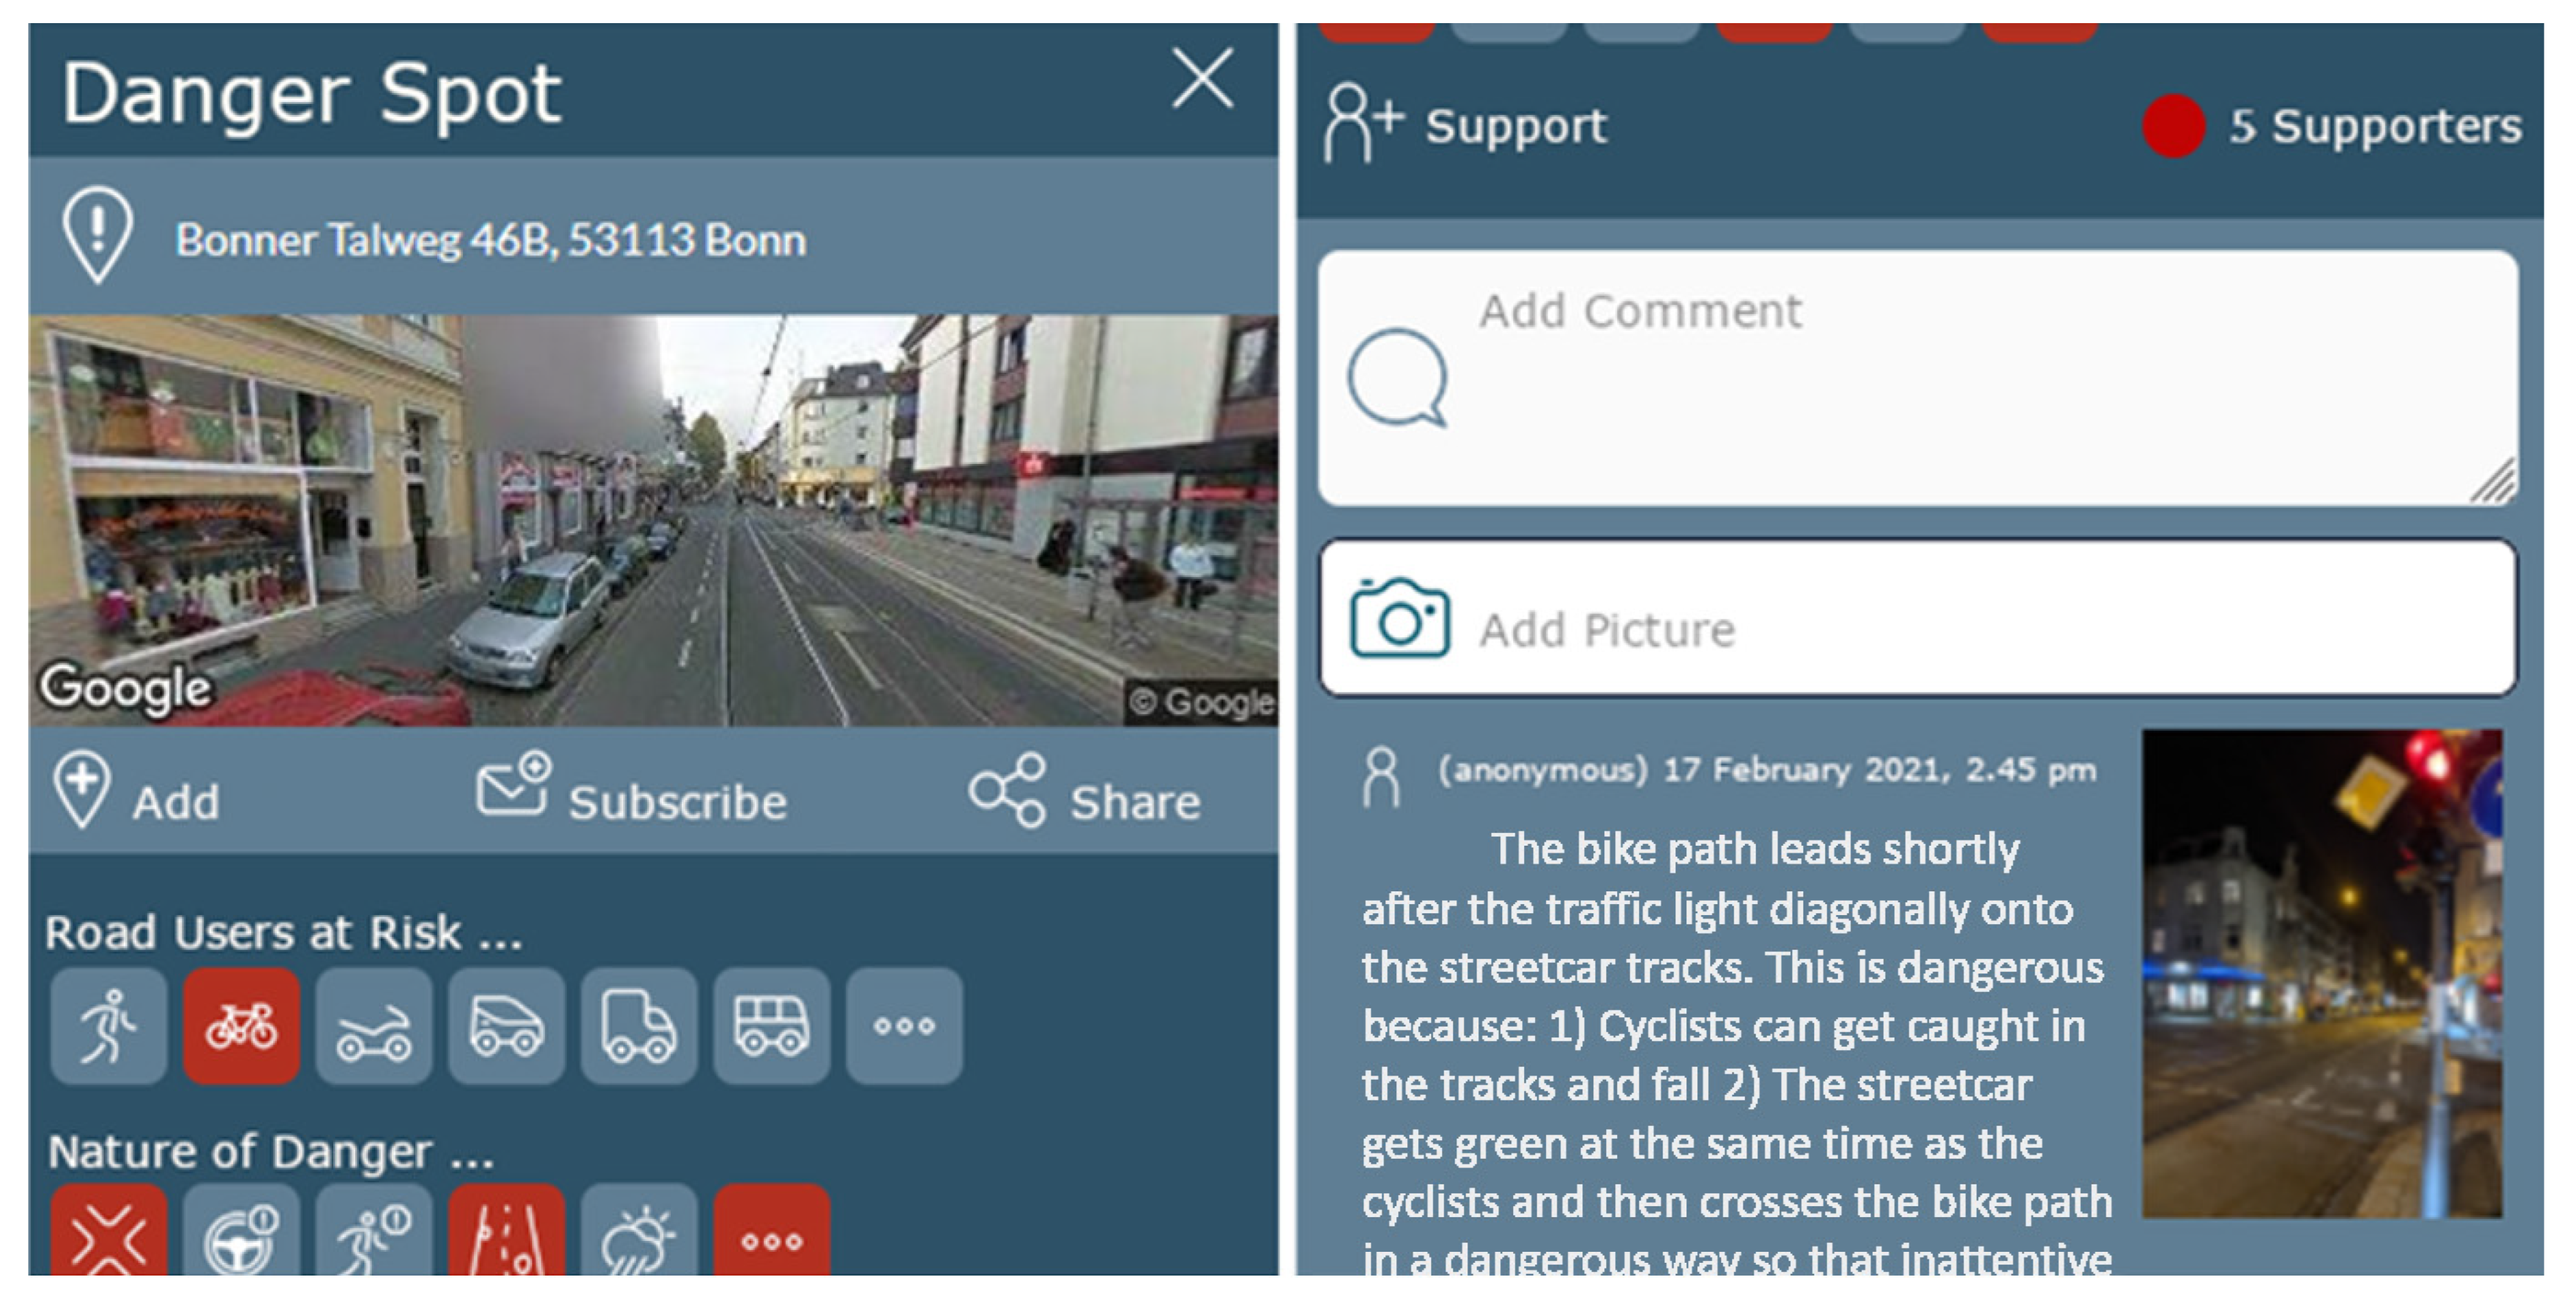
www.gefahrenstellen.de was developed as a crowdsourcing tool designed within the EDDA feasibility study in 2017 and 2018 and has been continually improved within the EDDA+ project (since 2019). Road users can mark danger spots on an interactive map and can give further information about the category of road users at risk (e.g., pedestrians, bicyclists, and/or motorists) as well as the nature of the danger (e.g., areas with poor visibility, misconduct of road users, poor road conditions). For both variables, multiple selections are possible.
Figure 2 shows an exemplary danger spot from the city of Bonn.
In addition to submitting new danger spots, users can interact with existing entries by clicking on, commenting on, adding supplemental information to, and subscribing to updates (e.g., new comments or picture uploads). Moreover, users can support existing danger spots and thereby indicate their consent. Danger spots with many supporters are also highlighted in color as the pin on the map turns from light blue to dark blue. Usability is the highest premise, which is why the platform incorporates various filter options (road users at risk, nature of danger, and number of supporters) for a more detailed overview. Depending on the zoom level of the interactive map, the danger spots are clustered into circles of different sizes. The map can also be displayed as a satellite image.
Users can choose to display traffic collisions on the map as an additional feature. The data are derived from the Federal Office of Statistics (Statistisches Bundesamt; to be more precise, from the
Collision Atlas (
https://unfallatlas.statistikportal.de (accessed on 20 June 2022))) and allow for filtering by year (2017 to 2020, though not every federal state provides data for every year) and road users involved.
While the platform is open to all user groups, there is a pro-access for authorities and municipalities. They can use it for data processing and internal and external communication.
1.3. Aim of the Pilot Study
Crowdsourcing is a popular and legitimate means of collecting large amounts of data and preparing it for analyses in road safety work [
26,
27,
30,
31,
32,
35]. Although road users’ perceptions are subjective and could be biased, perceived hazards are valid predictors of actual hazards [
34]. However, although these assessments and the data-driven approaches for collision prediction generate vast amounts of user data, their validity has never been verified. In order to improve the validity of proactive methods, the present pilot study intended to investigate both the validity of road user reports and their added value for the early detection and prediction of risk areas. That is, the aims of the present pilot study were to
3. Results
3.1. Analysis of the Road User Reports
In total,
N = 77 road user-reported danger spots were evaluated.
Table 2 shows a descriptive summary of the user-related activity for each city’s danger spots. It indicates that Bonn exceeds the other cities in any user-related activity. Bremen can only score with an above-average number of clicks, whereas Aachen records an above-average number of supporters and comments. Münster performs below average in all user-related activities. The evaluation of the user reports revealed that pedestrians and bicyclists were most often mentioned as exposed to danger (i.e., for 77 danger spots, pedestrians were listed 52 times and bicyclists 71 times). Results for the other road-user categories can be seen in
Table 3.
Fisher’s exact tests were used to determine if there was a significant association between the city and each category of road user at risk. The statistical analyses did not reveal any significant association between the number of road users per category and city: city and pedestrians (p = 0.20), city and bicyclists (p = 0.43), city and motorcyclists (p = 0.22), city and motorists (p = 0.94), city and lorry drivers (p = 0.90), city and bus drivers (p = 0.57), and city and other road users (p = 0.11).
Table 4 summarizes the perceived nature of the danger to road users per city.
Overall, there are indications that areas with poor visibility and misconduct by drivers (bicyclists and motorists) were the most common perceived sources of danger. Again, Fisher’s exact tests were used to determine if there was a significant association between the city and each nature of the danger. Indeed, there was a statistically significant association between city and road conditions (p < 0.01). Other significant associations were not observed: city and area with poor visibility (p = 0.90), city and misconduct by drivers (p = 0.17), city and misconduct by pedestrians (p = 0.79), city and weather conditions (p = 0.83), and city and other natures of danger (p = 0.66).
3.2. Results of the On-Site Audits
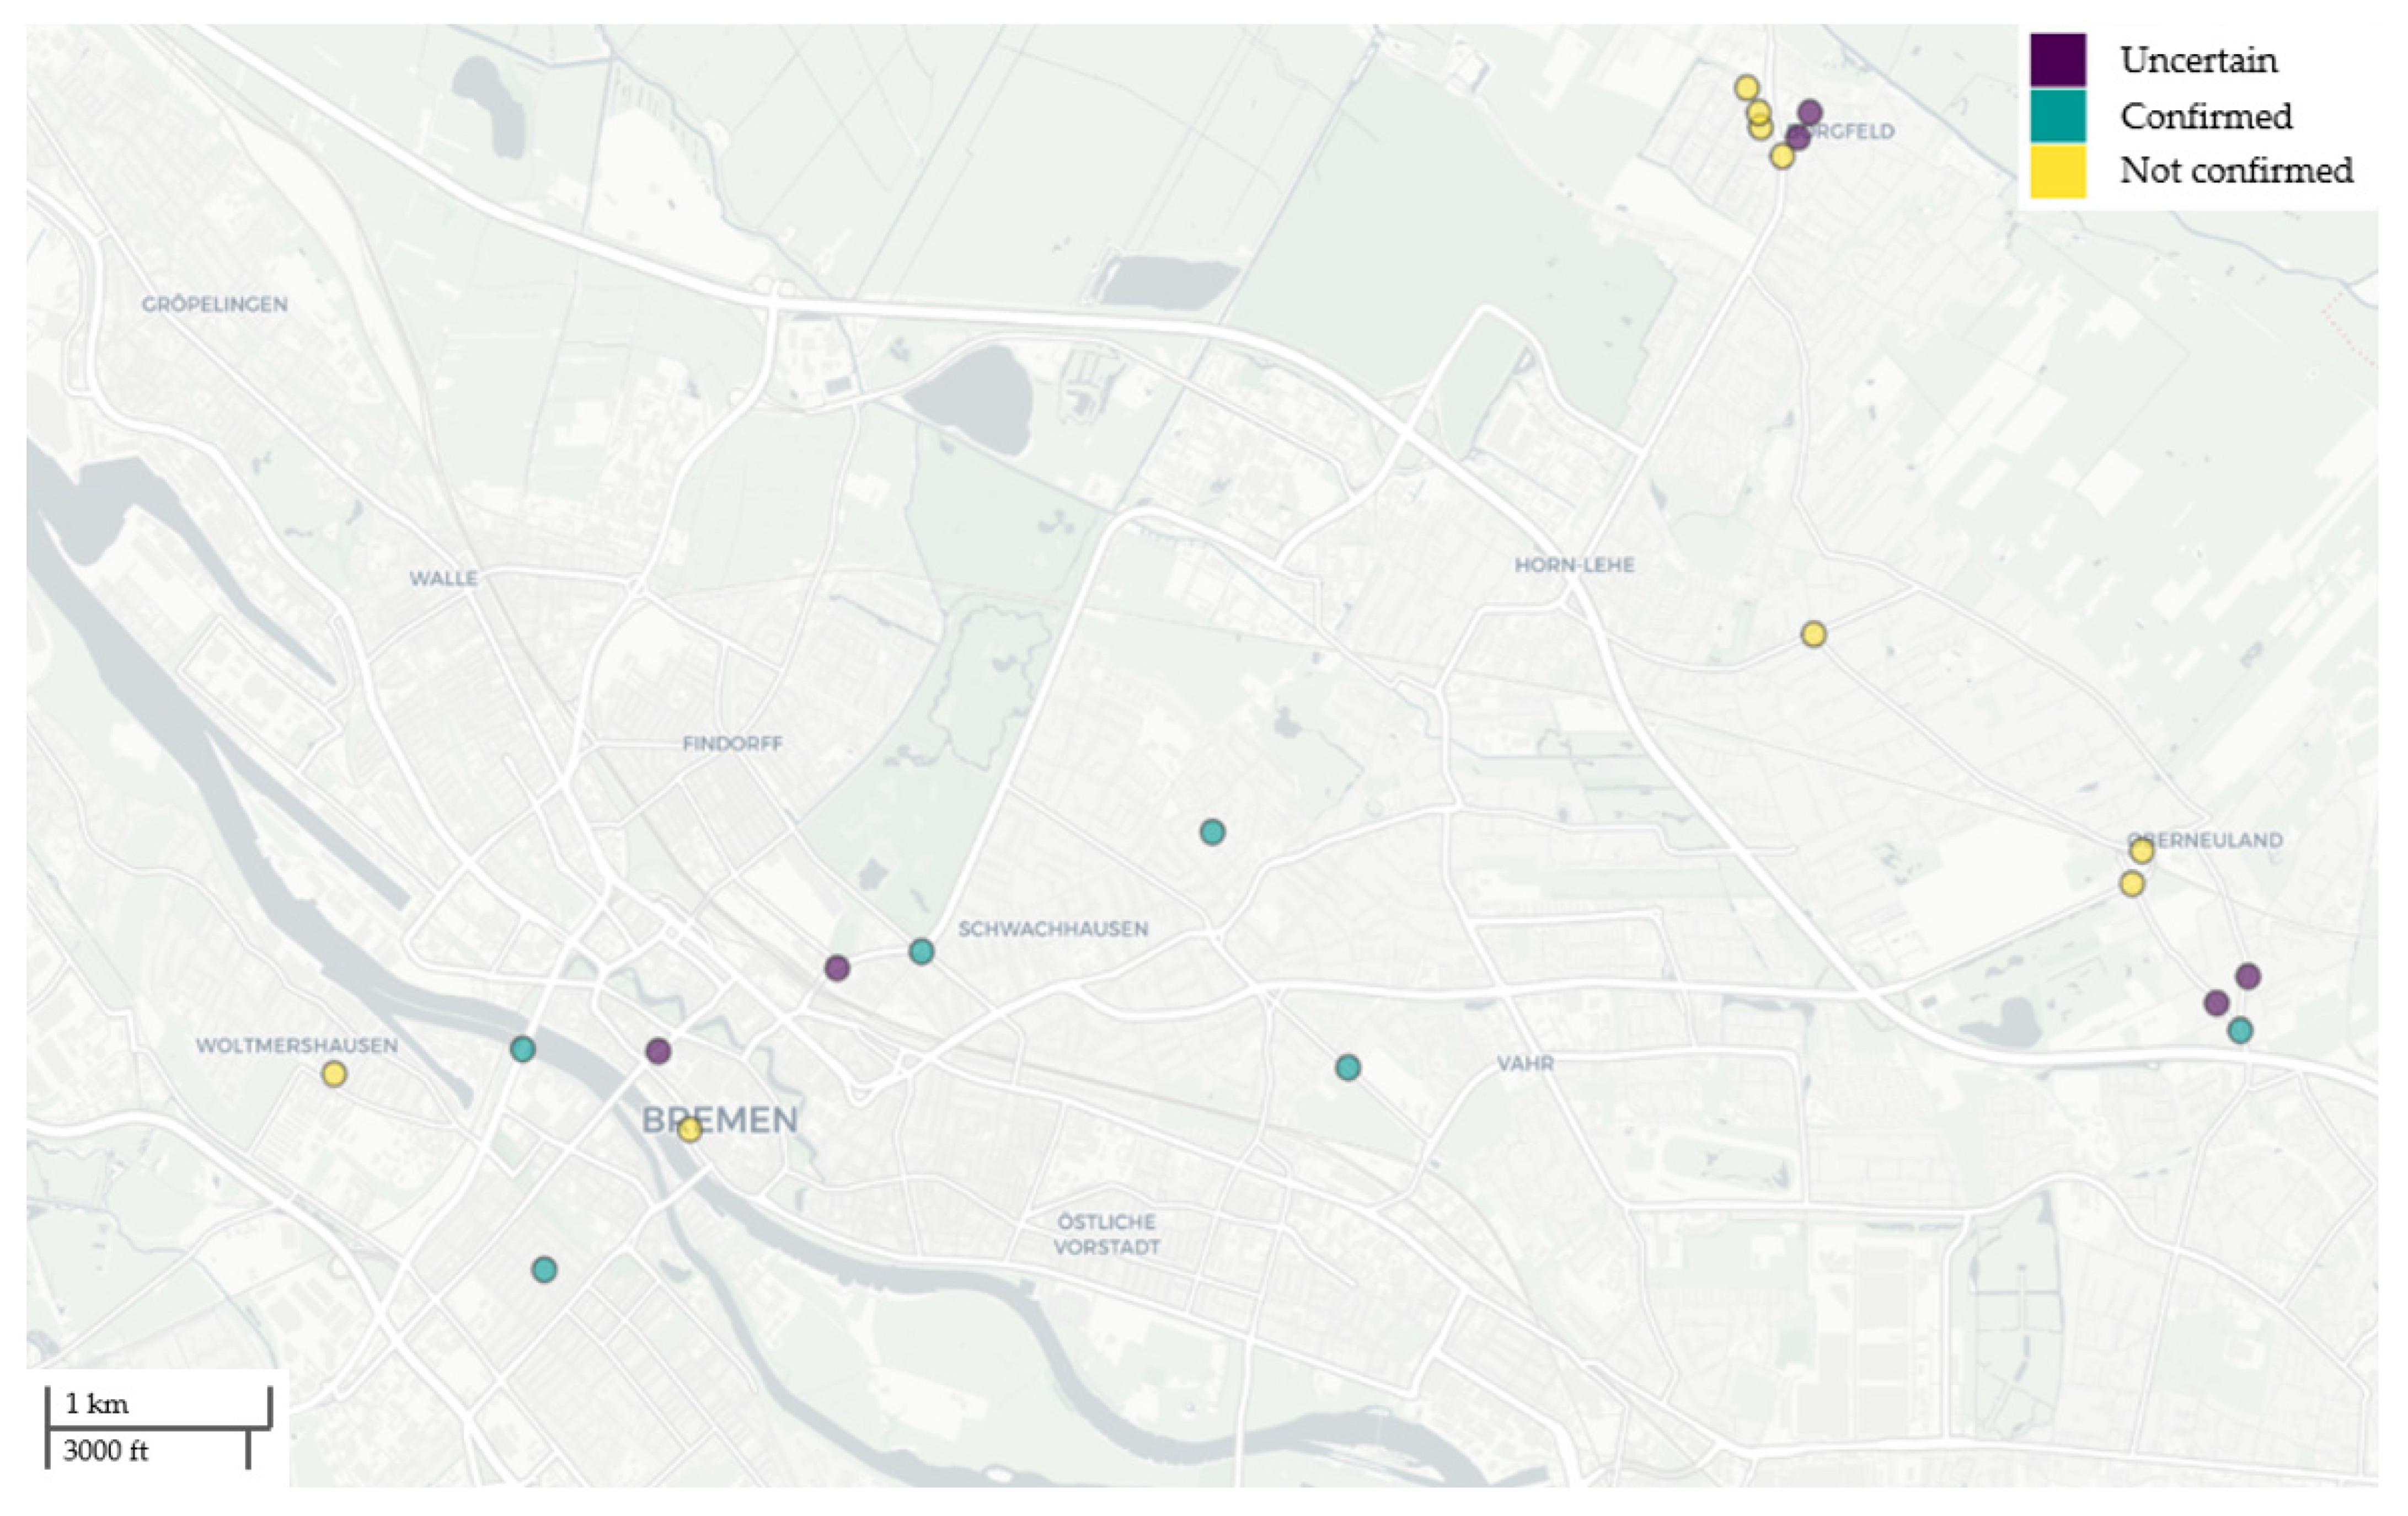
Table 5 summarizes the overall ratings of the danger spots per city. For an exemplary map display of all audited danger spots in Bremen and their respective rating, see
Figure A1 (
Appendix A). Across the four cities,
N = 549 structural deficits were counted at the
N = 77 audited danger spots (
M = 7.13), which are distributed as follows: a total of
n = 144 deficits in Aachen (
M = 5.54),
n = 133 deficits in Bonn (
M = 8.31),
n = 162 deficits in Bremen (
M = 7.71), and
n = 110 deficits in Münster (
M = 7.86). Overall, the most common deficits were “no inclusion of walking and visually impaired persons” (
n = 42), “faded markings” (
n = 26), “no red coloring of bike paths” (
n = 26), “no appropriate pedestrian crossing facilities” (
n = 22), and “no separate signaling for different road users” (
n = 20). When examining the most frequent deficits per rating of the danger spot, a different pattern emerged: For confirmed danger spots, the most common deficits were “no inclusion of walking and visually impaired persons” (
n = 19), “no appropriate pedestrian crossing facilities” (
n = 15), and “road not safe to cross” (
n = 14). For danger spots rated as uncertain, the most common deficits were “no inclusion of walking and visually impaired persons” (
n = 14), “no red coloring of bike paths” (
n = 8), and “faded markings” (
n = 7). For danger spots that we could not confirm, the most common deficits were “no appropriate pedestrian crossing facilities” (
n = 9), “faded markings” (
n = 8), and “no separate signaling for left-turning road users” (
n = 8).
The next step was to examine whether the user-reported danger spots could potentially be validated using criteria other than the objective deficit inventory. For this purpose, it was examined whether for danger spots that were confirmed as hazardous based on the deficit inventory (n = 39), more clicks, supporters, and comments were recorded than for those that were rated as uncertain (n = 17) or not confirmed (n = 21). Since the preconditions (normal distribution and variance homogeneity) for an ANOVA were not given, three Kruskal–Wallis tests (with the three factor levels confirmed, uncertain, and not confirmed) were calculated: A relationship between the number of clicks and the rating of the danger spots could be confirmed (χ2 = 14.18, p < 0.001). A post hoc pairwise Wilcoxon test revealed that the number of clicks for confirmed danger spots was significantly higher than for not confirmed danger spots (p < 0.001). The number of supporters was also significantly related to the rating of the danger spots (χ2 = 11.47, p < 0.01); confirmed danger spots were supported by significantly more road users than not confirmed danger spots (p < 0.01). The tests also showed a significant relationship between the number of comments and the rating of the danger spots (χ2 = 18.92, p < 0.001), with confirmed danger spots having significantly more comments than those rated as either uncertain (p < 0.05) or not confirmed (p < 0.001).
3.3. Evaluation and Blending of Police Collision Data
As can be seen in
Table 6,
N = 1137 collisions were reported for the
N = 77 audited danger spots. With an average of
M = 24.67 collisions per danger spot, the city of Bremen was ahead of the other cities: Bonn (
M = 18.38), Münster (
M = 14.14), Aachen (
M = 4.88); the mean across all four cities was
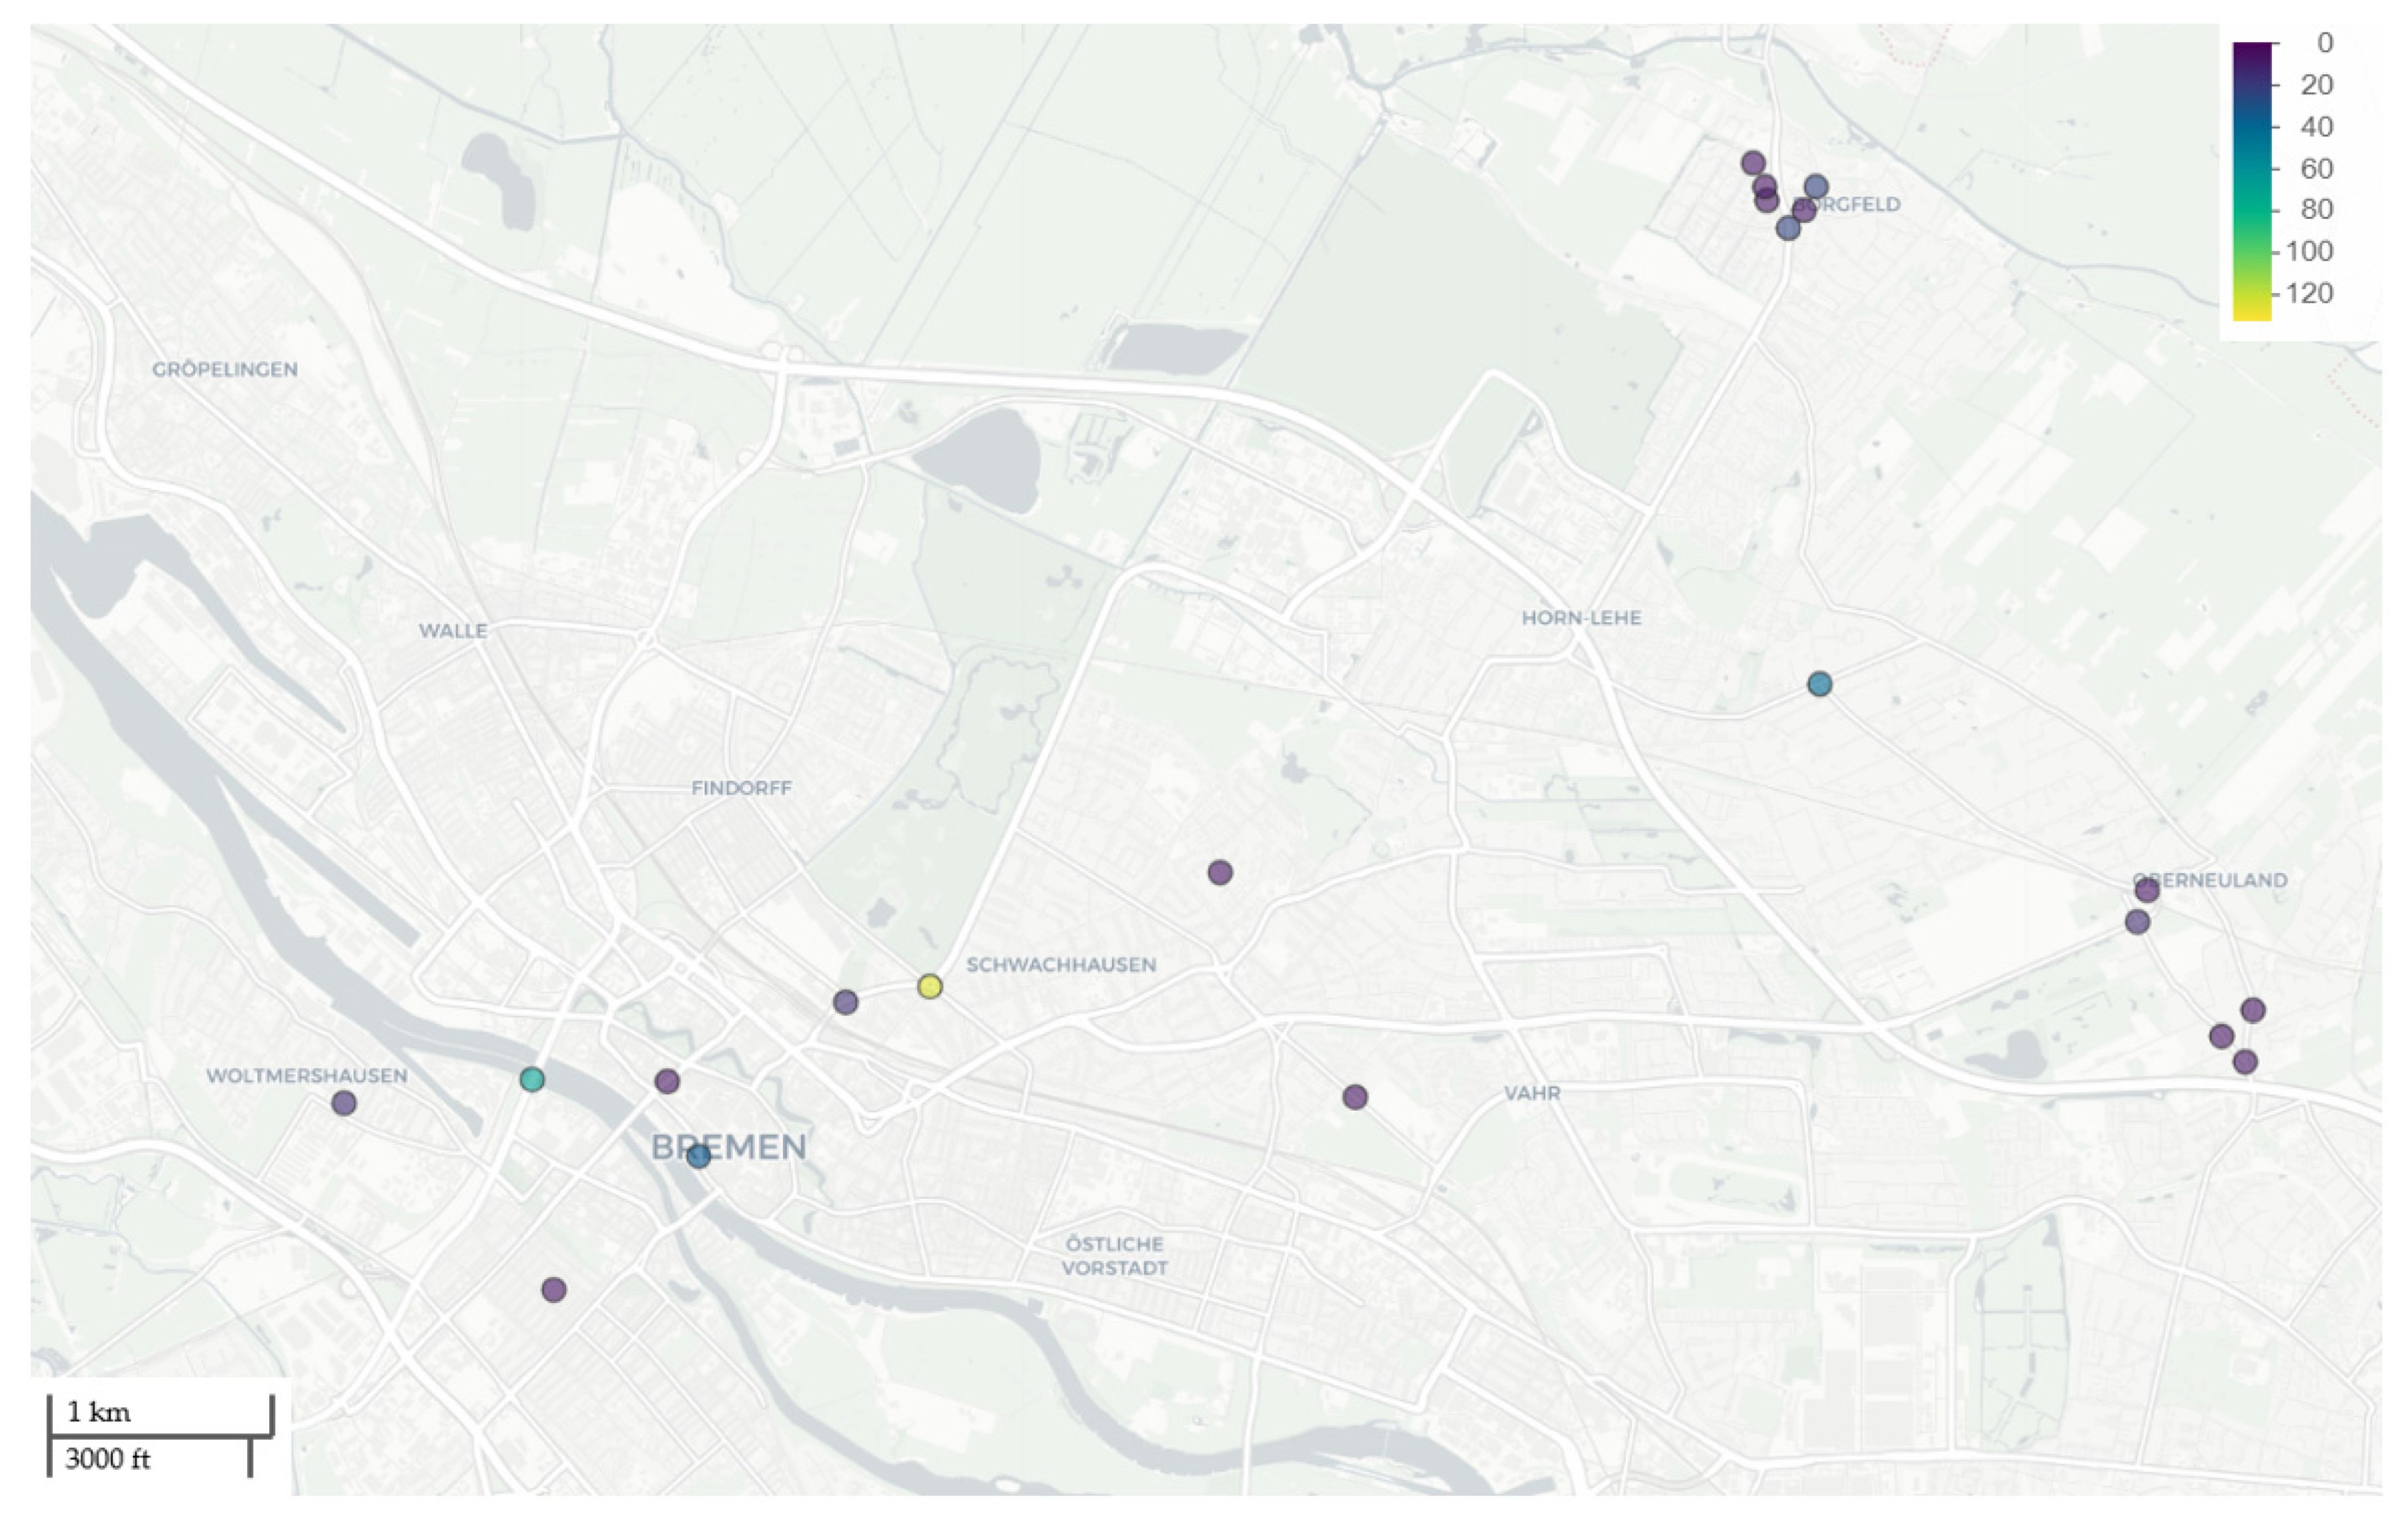
M = 14.77. Fortunately, most of these collisions resulted in only property damage or minor injuries. For an exemplary map display of all audited danger spots in Bremen and their respective number of collisions, see
Figure A2 (
Appendix A).
As the road-user-related activity was significantly related to the rating of the audited danger spot, we were interested in whether this relationship was also to be found between the number of collisions per danger spot and its rating. Descriptively, n = 725 collisions were counted at confirmed danger spots, n = 205 at uncertain danger spots, and n = 207 at not confirmed danger spots. Again, an ANOVA’s preconditions (normal distribution and variance homogeneity) were not met. As a first Kruskal–Wallis test (with the three factor levels confirmed, uncertain, and not confirmed) revealed no significant differences (χ2 = 0.83, p = 0.66), we hypothesized that the exclusion of collisions with property damage only might lead to a significant result. However, the non-significance remained (χ2 = 0.46, p = 0.79).
4. Discussion
The present pilot study aimed to evaluate a pseudo-random sample of user-reported danger spots, validate the fit of these subjective user reports with the more objective evaluation of a road safety audit on infrastructural deficits, and blend the results with police collision data. At on-site audits in four German cities, a total of N = 77 user-reported danger spots were audited using a standardized deficit inventory.
The evaluation of the user-reported danger spots revealed that the user-related activity varied substantially: While Münster was far below average in the categories of clicks, supporters, and comments, Bonn was above average in each one. This might be due to the varying popularity of the website
www.gefahrenstellen.de in the cities studied. As the website was widely advertised in local newspapers in Bonn and Aachen but not in Bremen and Münster, it might be better known in the former two cities, thus leading to more user-related activity.
The evaluation further showed that pedestrians and bicyclists were most often mentioned as exposed to danger, while lorry and bus drivers as well as other road users (e-scooters, streetcars, etc.) were mentioned the least. Studies show that bicyclists perceive car–bicycle interactions as more dangerous than motorists because they are not as well protected as motor vehicle drivers [
39]. According to this logic and our findings, there is reason to assume that pedestrians and bicyclists may have reported most of the danger spots.
The number of road users at risk per category was not associated with the city, implying that safety deficits in pedestrian and bicycle infrastructure occur equally in all studied regions. This could be because regulations for the design of road infrastructure in Germany are valid nationwide. As vulnerable road users have only been increasingly considered in traffic planning in recent years, safe infrastructure for these groups is missing across German cities equally.
Human error is the most common cause of collisions [
40] reflected in user reports. Additionally, poor visibility and misconduct by drivers (bicyclists and motorists) turned out to be the most common perceived reasons for the danger to road users. There was no association between the city and each nature of danger except for city and road conditions. A possible explanation is that each municipality in Germany has to pay for the maintenance of road infrastructure itself. It may be that the municipalities spend different amounts of money on maintenance and this is reflected in the road user reports.
The validation showed that about half of all user reports could be confirmed, almost a quarter remained uncertain (e.g., because the information was unavailable or ambiguous), and another quarter could not be confirmed. Bonn and Aachen had the highest number of confirmed danger spots, meaning the best fit between road users’ and auditors’ perceptions, while Münster and Bremen ranked lower. A relationship between the popularity of the website and the share of confirmed reports out of all reports for each city studied could be a feasible explanation. As the website’s popularity seems to be higher in Bonn and Aachen than in Münster and Bremen, more users might report danger spots and interact with danger spots in the former cities. Therefore, promoting the website is crucial in increasing the quality and validity of the reported danger spots. We felt that those danger spots we classified as uncertain or not confirmed often lacked user interaction. Indeed, our analyses showed that rating the danger spots as hazardous was related to increased clicks, supporters, and comments. This presumably illustrates the underlying principle of crowds’ wisdom, which can only be reached when a certain threshold of participants is reached.
Although the abbreviated deficit inventory we used included 70 items, and as a consequence, up to 70 possible deficits were identifiable per audited danger spot, on average, only 7 deficits per audited danger spot were counted. In relative terms, most deficits were identified for the danger spots in Bonn. The fewest were counted in Aachen. The latter finding is quite interesting as the number of confirmed danger spots in Aachen exceeded those in Bremen and Münster, consequently leading to the expectation that more deficits would be counted in Aachen. Even if the total number of identified deficits was relatively low, the most common type, “no inclusion of walking and visually impaired persons”, emphasizes the risk for these road users in traffic situations. Interestingly, the most common deficits per rating did not reveal any pattern, which supports the suggestion that a structural deficit is not the sole predictor of a spot’s hazardousness. It must be mentioned that the deficit inventory focuses on infrastructural hazards only. Consequently, the match between user reports and our road safety audits is valid for infrastructural hazards. Apart from infrastructural deficits, the task-capability interface model by Fuller [
41] predicts a high likelihood of road traffic collisions when the task demands outweigh the road user’s capabilities. Our road safety audits provided only limited and indirect access to human behavior, practice, experience, and other human factors (capabilities) as well as weather conditions, vehicle, and speed (task demands). This could also be why so many were classified as uncertain or not confirmed.
The evaluation of collision data resulted in almost M = 15 collisions per danger spot, with severe or fatal injuries fortunately being the exception. This pilot study considered neither the relative nor the absolute number of road users per city. Consequently, the differences in the average number of collisions per city could be due to the differences in traffic volume. As Bremen outnumbers Aachen, Bonn, and Münster in terms of population, it is not surprising that the most collisions were counted in Bremen. Future studies have to address this more thoroughly. No relationship could be found between the rating of an audited danger spot and the number of collisions registered there. This implies that the mere number of collisions per danger spot does not qualify as an objective assessment of its validity. It also shows the weakness of using collision data to manage road traffic safety measures. A road traffic crash is rare when considering the overall traffic volume. Near misses and minor crashes often point to conflicts between road users and ambiguous and highly demanding road traffic constellations. This subtle danger perception is experienced by road users and captured by the reported danger spots. Consequently, user-reported danger spots are a valuable source of information with much potential for the early detection of road traffic hazards. Future studies with more elaborate designs and data sets need to shed further light on the early detection and forecasting nature of reported danger spots.
4.1. Limitations
The primary aim of this pilot study was to objectively evaluate subjective road user reports using a standardized tool. Although attempts were made to eliminate bias by having at least two researchers complete the deficit inventory, it cannot be ruled out that the researchers’ impressions were subjectively colored or influenced by previous danger spots. Although the explanatory power following a descriptive approach is somewhat limited, the methodology of our present field study was very well designed (e.g., the rationale for the sample of cities and audited danger spots), valid (e.g., using standardized measurement equipment), and feasible. We believe that the errors and biases mentioned above were eliminated or restricted as best as possible.
The deficit inventory used only evaluated structural deficits. Accordingly, at least in this pilot study, human factors and other influencing factors (c.f. task-capability interface model by Fuller [
41]) remained a black box. Therefore, we could not acquire knowledge on subjective road users’ safety or their demographic characteristics that went beyond the data from
www.gefahrenstellen.de. Due to this fact and the finite amount of data we were able to collect, more in-depth analyses were not feasible in the frame of our pilot study. While this circumstance was not specifically relevant to our work, future studies should consider this issue where applicable.
In addition, assessing the hazardousness of a danger spot was always only a momentary image. If a user had complained about cars regularly blocking the sidewalk, but this was only to be observed during the rush hour, then this hazard could not be confirmed during off-peak hours when traffic was low. This problem was particularly common with evaluations of lighting and light signal systems. From a methodological point of view, it would have been more thorough to audit such danger spots several times and at different times. Again, our pilot study paves the way for more elaborate research designs in which those options can be considered in more detail.
Like in most countries, the quality of collision data in Germany depends on the saccade of the standardization and quality measures in collision admission, the data processing by first the police station and then the respective ministry of the interior of the federal state, and finally in the aggregation by the federal statistical office of Germany. We, therefore, cannot guarantee its impeccability. However, the police data we used are the only objective and networkwide, as well as most accurate, data source for evaluating road traffic safety in Germany. Furthermore, the German police are the only institution (in Germany) that uses an official and standardized guideline for collision reports.
4.2. Further Research
The validity of the audited user reports varied between the four cities in this pilot study. Bonn and Aachen had remarkably higher proportions of confirmed user reports than Bremen and Münster. Further research thus needs to analyze the factors that influence the validity of user reports in more detail. Corresponding indications such as clicks, supporters, and comments have already been mentioned. In this context, the platform’s popularity within the cities should be considered in more detail. This pilot study indicated that higher popularity could correlate with a higher share of valid user reports. This implies that as soon as more road users have reported danger spots in Bremen and Münster, a random sample could also be selected here for which the share of confirmed danger spots should be comparable with Aachen and Bonn. Factors favoring high popularity could also be investigated.
Moreover, increased popularity (in Bremen and Münster) would allow for a larger general sample, which might yield more evident results. With our pilot study, we have only laid a methodological foundation that should enable subsequent studies to scale up the further validation of danger spots. Since the number of reported danger spots is also increasing in other cities, it would be conceivable to extend the methodology to them.
The analysis of the user reports feeds the suspicion that the creators were primarily bicyclists or pedestrians. Evaluating the creators’ road user group affiliations would be a viable approach to add to the validity. This pilot study also highlighted that bicyclists and pedestrians were most often named as exposed to danger. It should be addressed whether all road user groups are represented equally on such platforms and if the user groups represent the overall population and geographic distribution of citizens. Conceivable methodological approaches also include actively interviewing users voluntarily or traffic monitoring at preselected spots.
Conducting on-site audits is a laborious process. Since the crowd of road users is actively involved on the platform
www.gefahrenstellen.de anyway, it seems reasonable that this same crowd could accomplish the validation of the individual danger spots in consideration. For this purpose, it would not even be necessary to ask other road users about the validity of individual danger spots; rather, it would suffice to refer to already existing parameters such as the number of clicks, supporters, comments, or collisions at the danger spot. However, the precondition would be a sufficiently active crowd on the platform. The increased activity would also yield more data, which could be used to implement high-level technologies such as data mining, knowledge mapping, and federate learning.
The primary purpose of the platform
www.gefahrenstellen.de is the prevention of road traffic collisions. This purpose coincides with the emerging method of SSM, which aims to identify future hazards in road traffic [
19,
42]. It would be conceivable to include road users’ perceptions of hazards as a further indicator in SSM predictor models or to build a custom model based on the road user data inspired by classic SSM models. Furthermore, SSM could be used as an alternative validation method to overcome the possible flaws of human-led on-site audits.
5. Conclusions
Innovative approaches need to be pursued to achieve road traffic without fatalities and severe injuries. The present pilot study showed that the web-based platform developed within the EDDA+ project has proven to be a suitable tool for collecting valuable road traffic data before the occurrence of collisions. The on-site audits gave the general impression that the road-user-reported danger spots serve as a valid data source for road safety work. While there is undoubtedly room for methodological improvement, our results show that our pilot approach provides a solid basis for evaluating user-reported danger spots.
In the future, these danger spots should be validated by the platform, that is by other road users themselves. Our work is also intended as a guideline for subsequent studies that further the study of the early detection of road traffic hazards for better understanding the strengths and weaknesses of user-reported danger spots in smart data approaches.
As the web-based platform improves, software developers, local authorities, the police, and research institutes are encouraged to use this economical and valid data source. Ultimately, it is intended to serve as another tool for moving closer to Vision Zero and making road traffic safer for all road users.


