
Towards a New Way of Understanding the Resilience of Socio-Technical Systems: The Safety Fractal Analysis Method Evaluated


Abstract
:1. Introduction
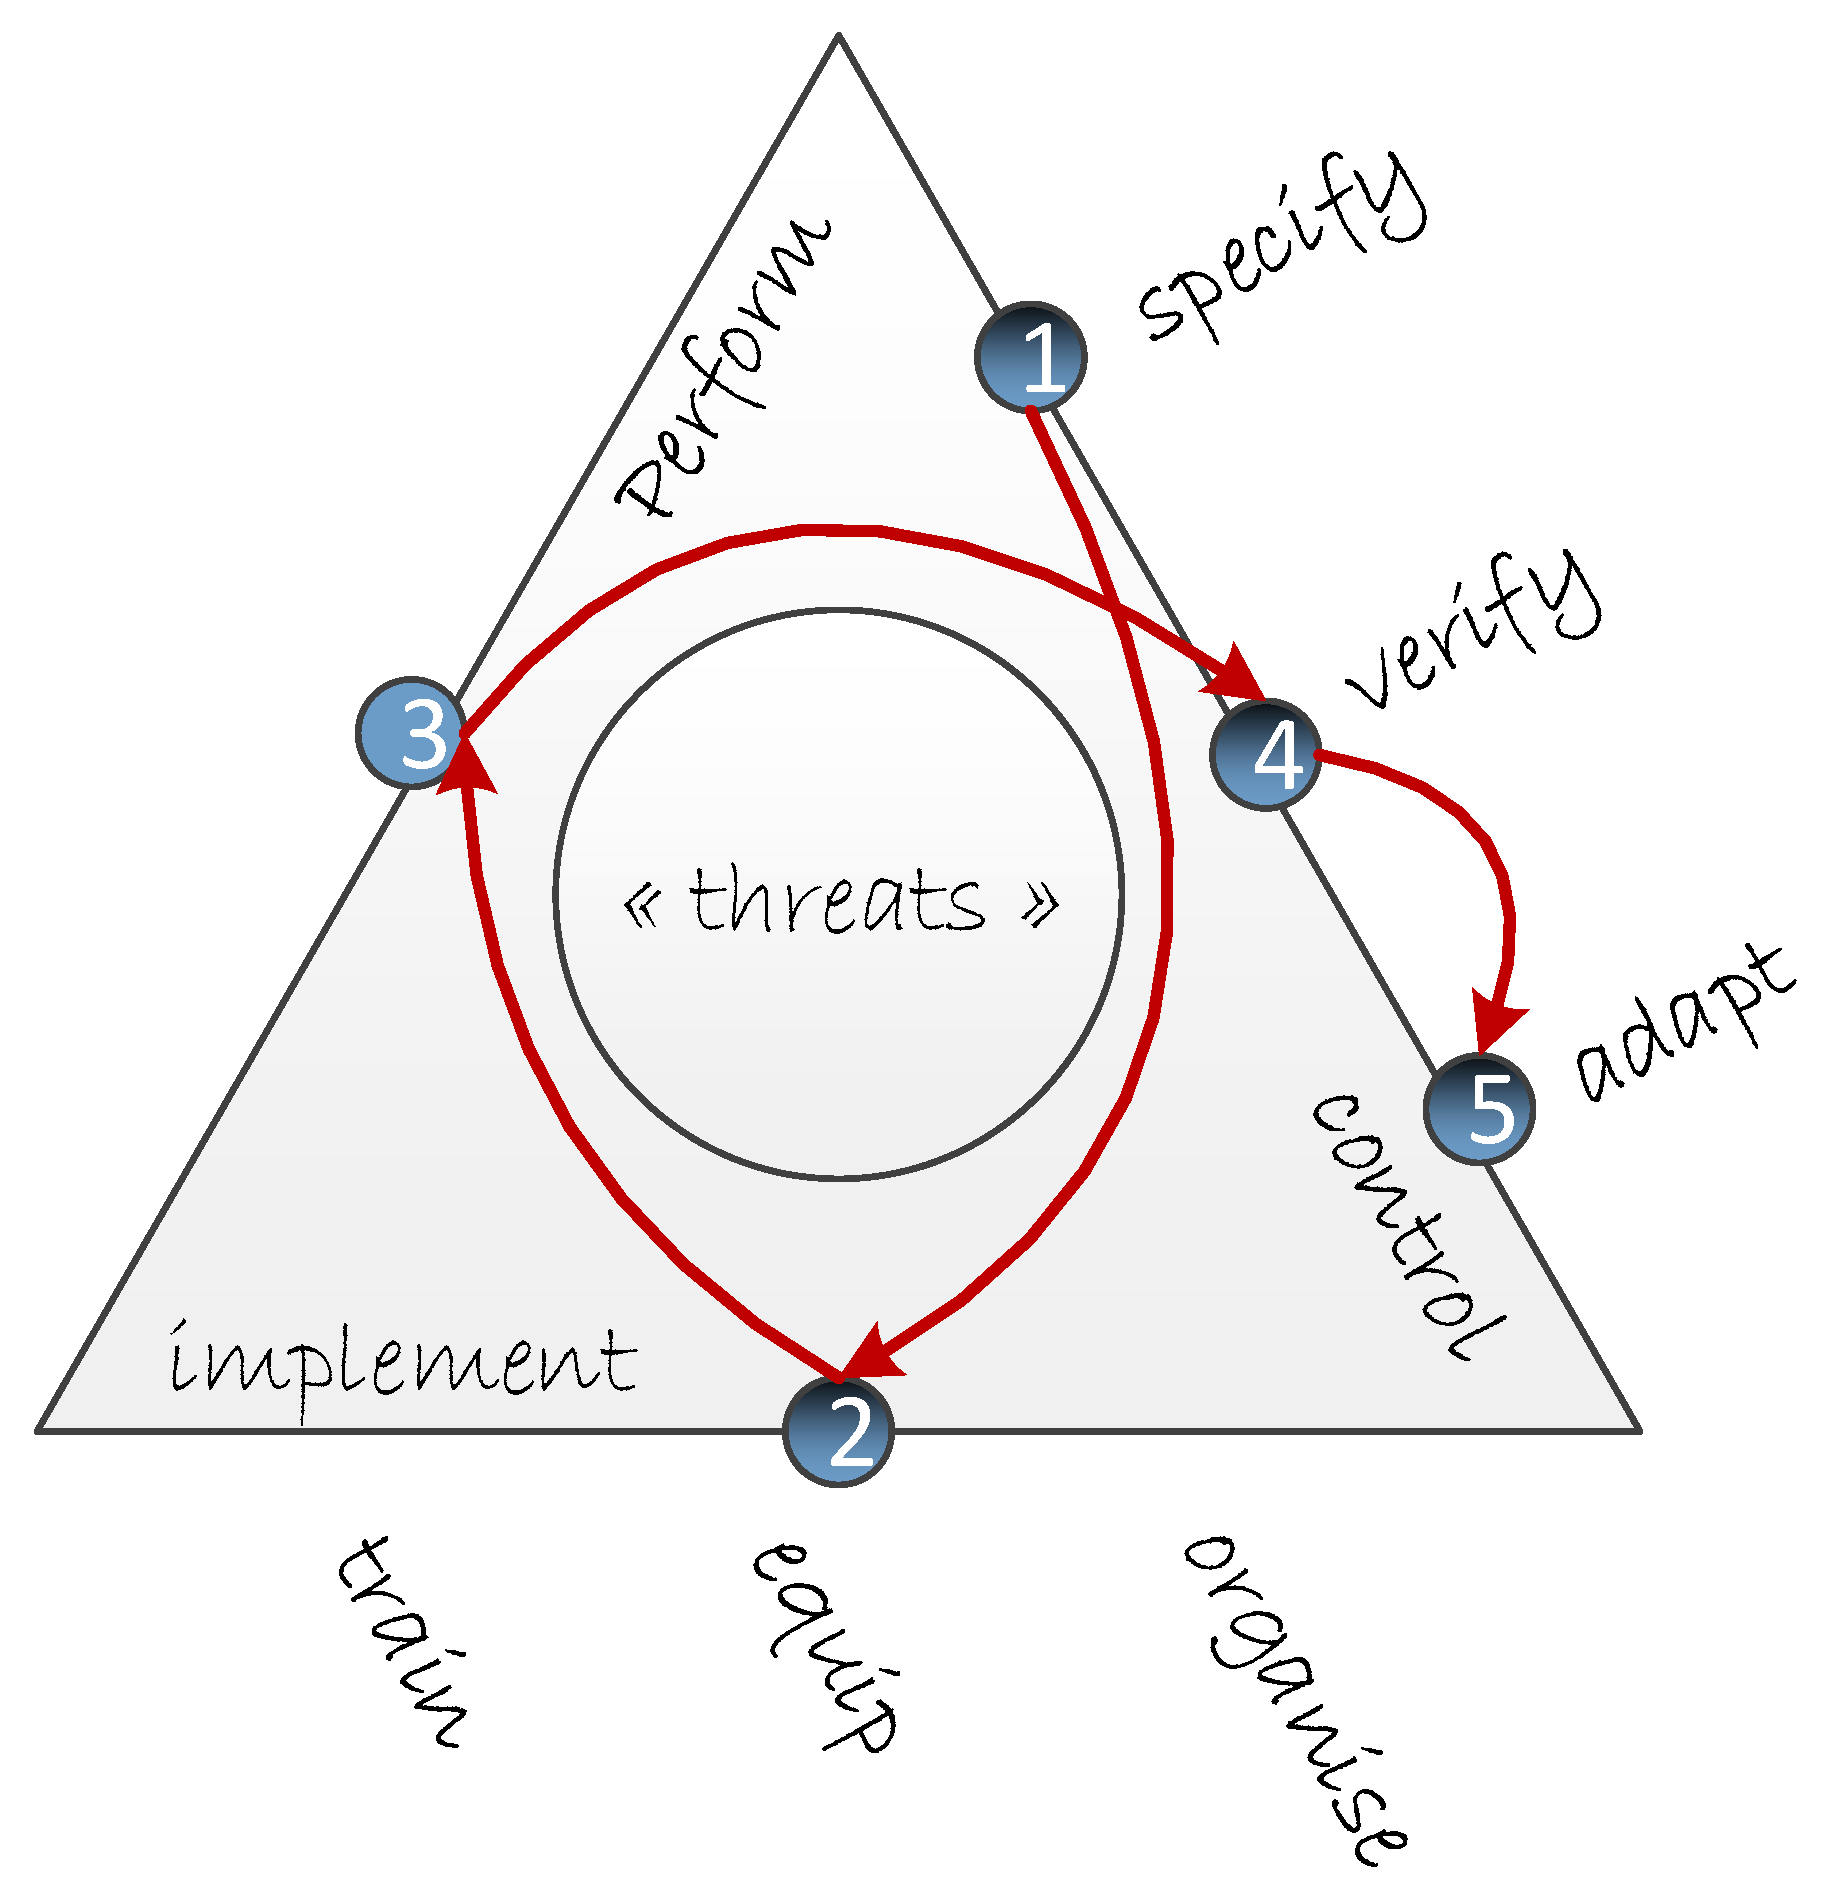
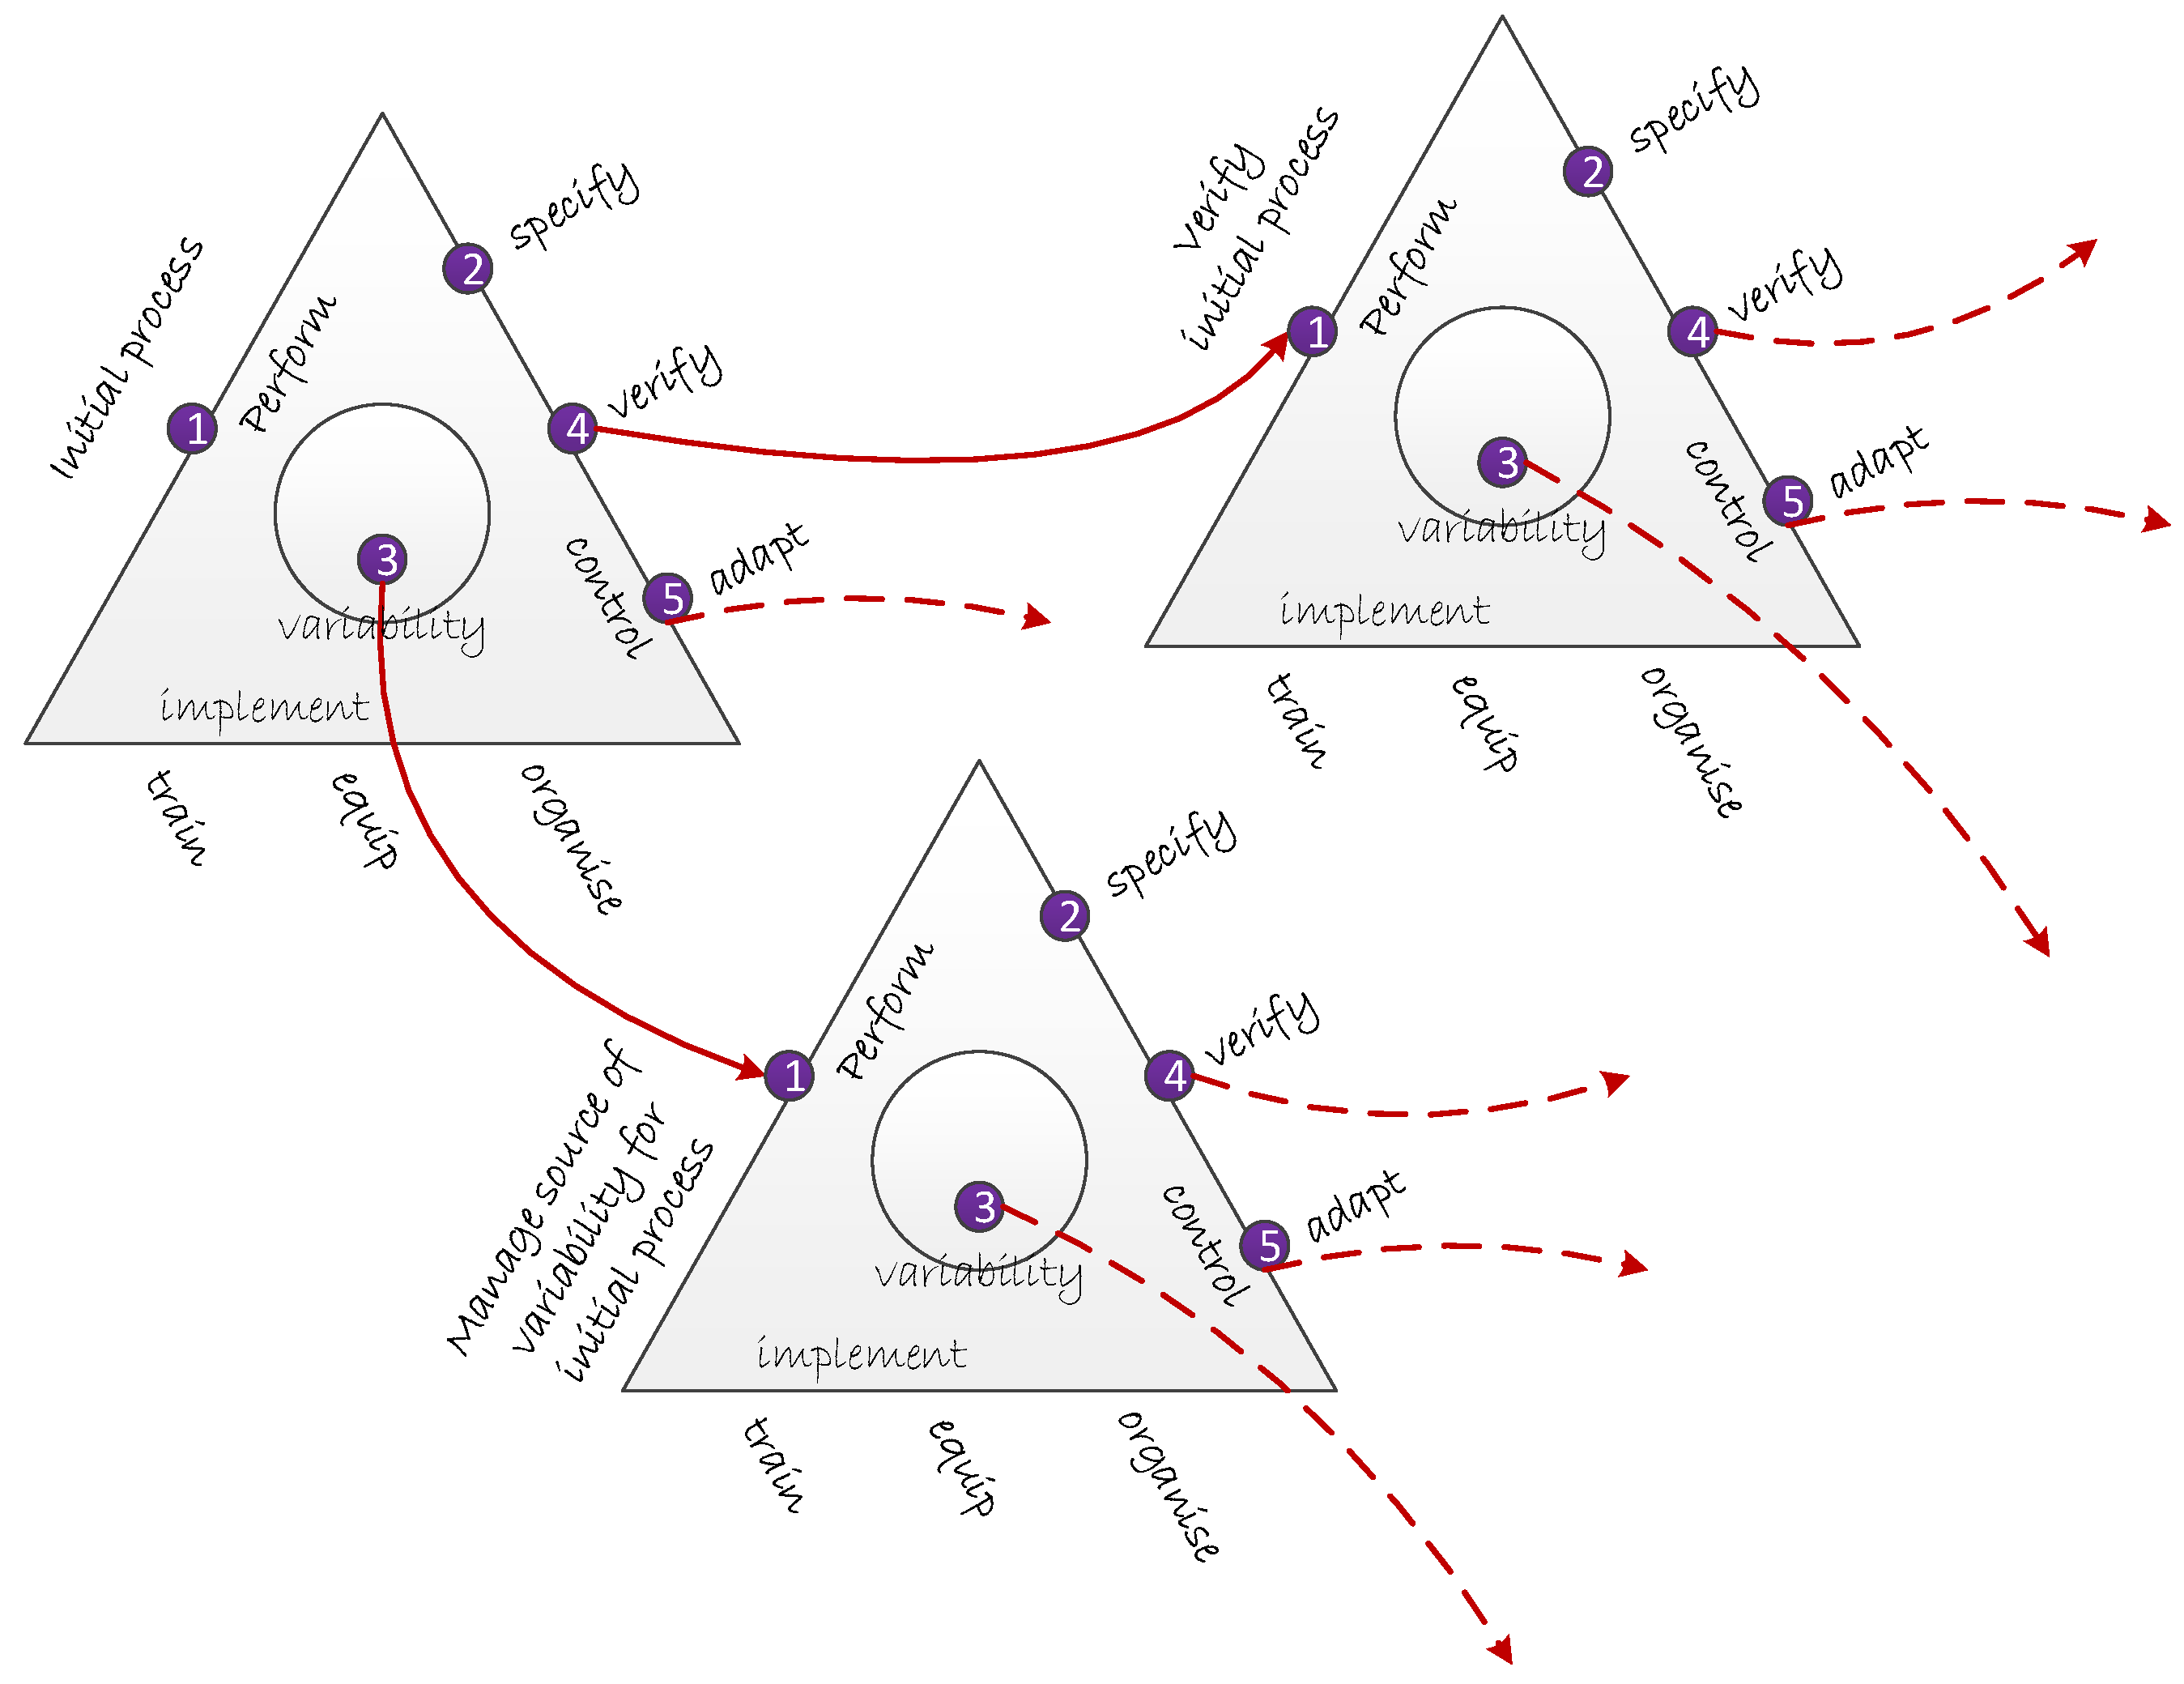
- (1)
- Specify: the scope and desired outcome of an activity are specified, roles and responsibilities identified, disrupting events are anticipated and risk control measures (rules, barriers) are designed (i.e., work as imagined).
- (2)
- Implement—train, equip, organise: all is conducted to have activities performed by enough competent people, adequate technical resources are put available and maintained, work products and resources to be used are identified, and work is planned in detail.
- (3)
- Perform: the activity is executed, responding to real life constraints and disturbances (i.e., work as conducted).
- (4)
- Verify: the system’s performance is monitored, i.e., verifying the match between work as designed and work as actually performed, as well as the elements that could affect this performance in the near term.
- (5)
- Adapt: it is known what has happened and lessons are learned from experience, and adequate changes to control, or implementation elements, are introduced.
- Find all events that have a causal relationship with the accident
- Describe the history of the accident by linking these events.
- Find all conditions that enabled these events, including events that lead to those conditions (only in Epidemiological and Systemic methods).
- Identify components, feedback mechanisms and control mechanisms that played a role during the development of the accident (only in Systemic methods).
- Identify at which point the accident could have been prevented and analyse if this can be generalised.
- Draw conclusions and propose improvement actions.
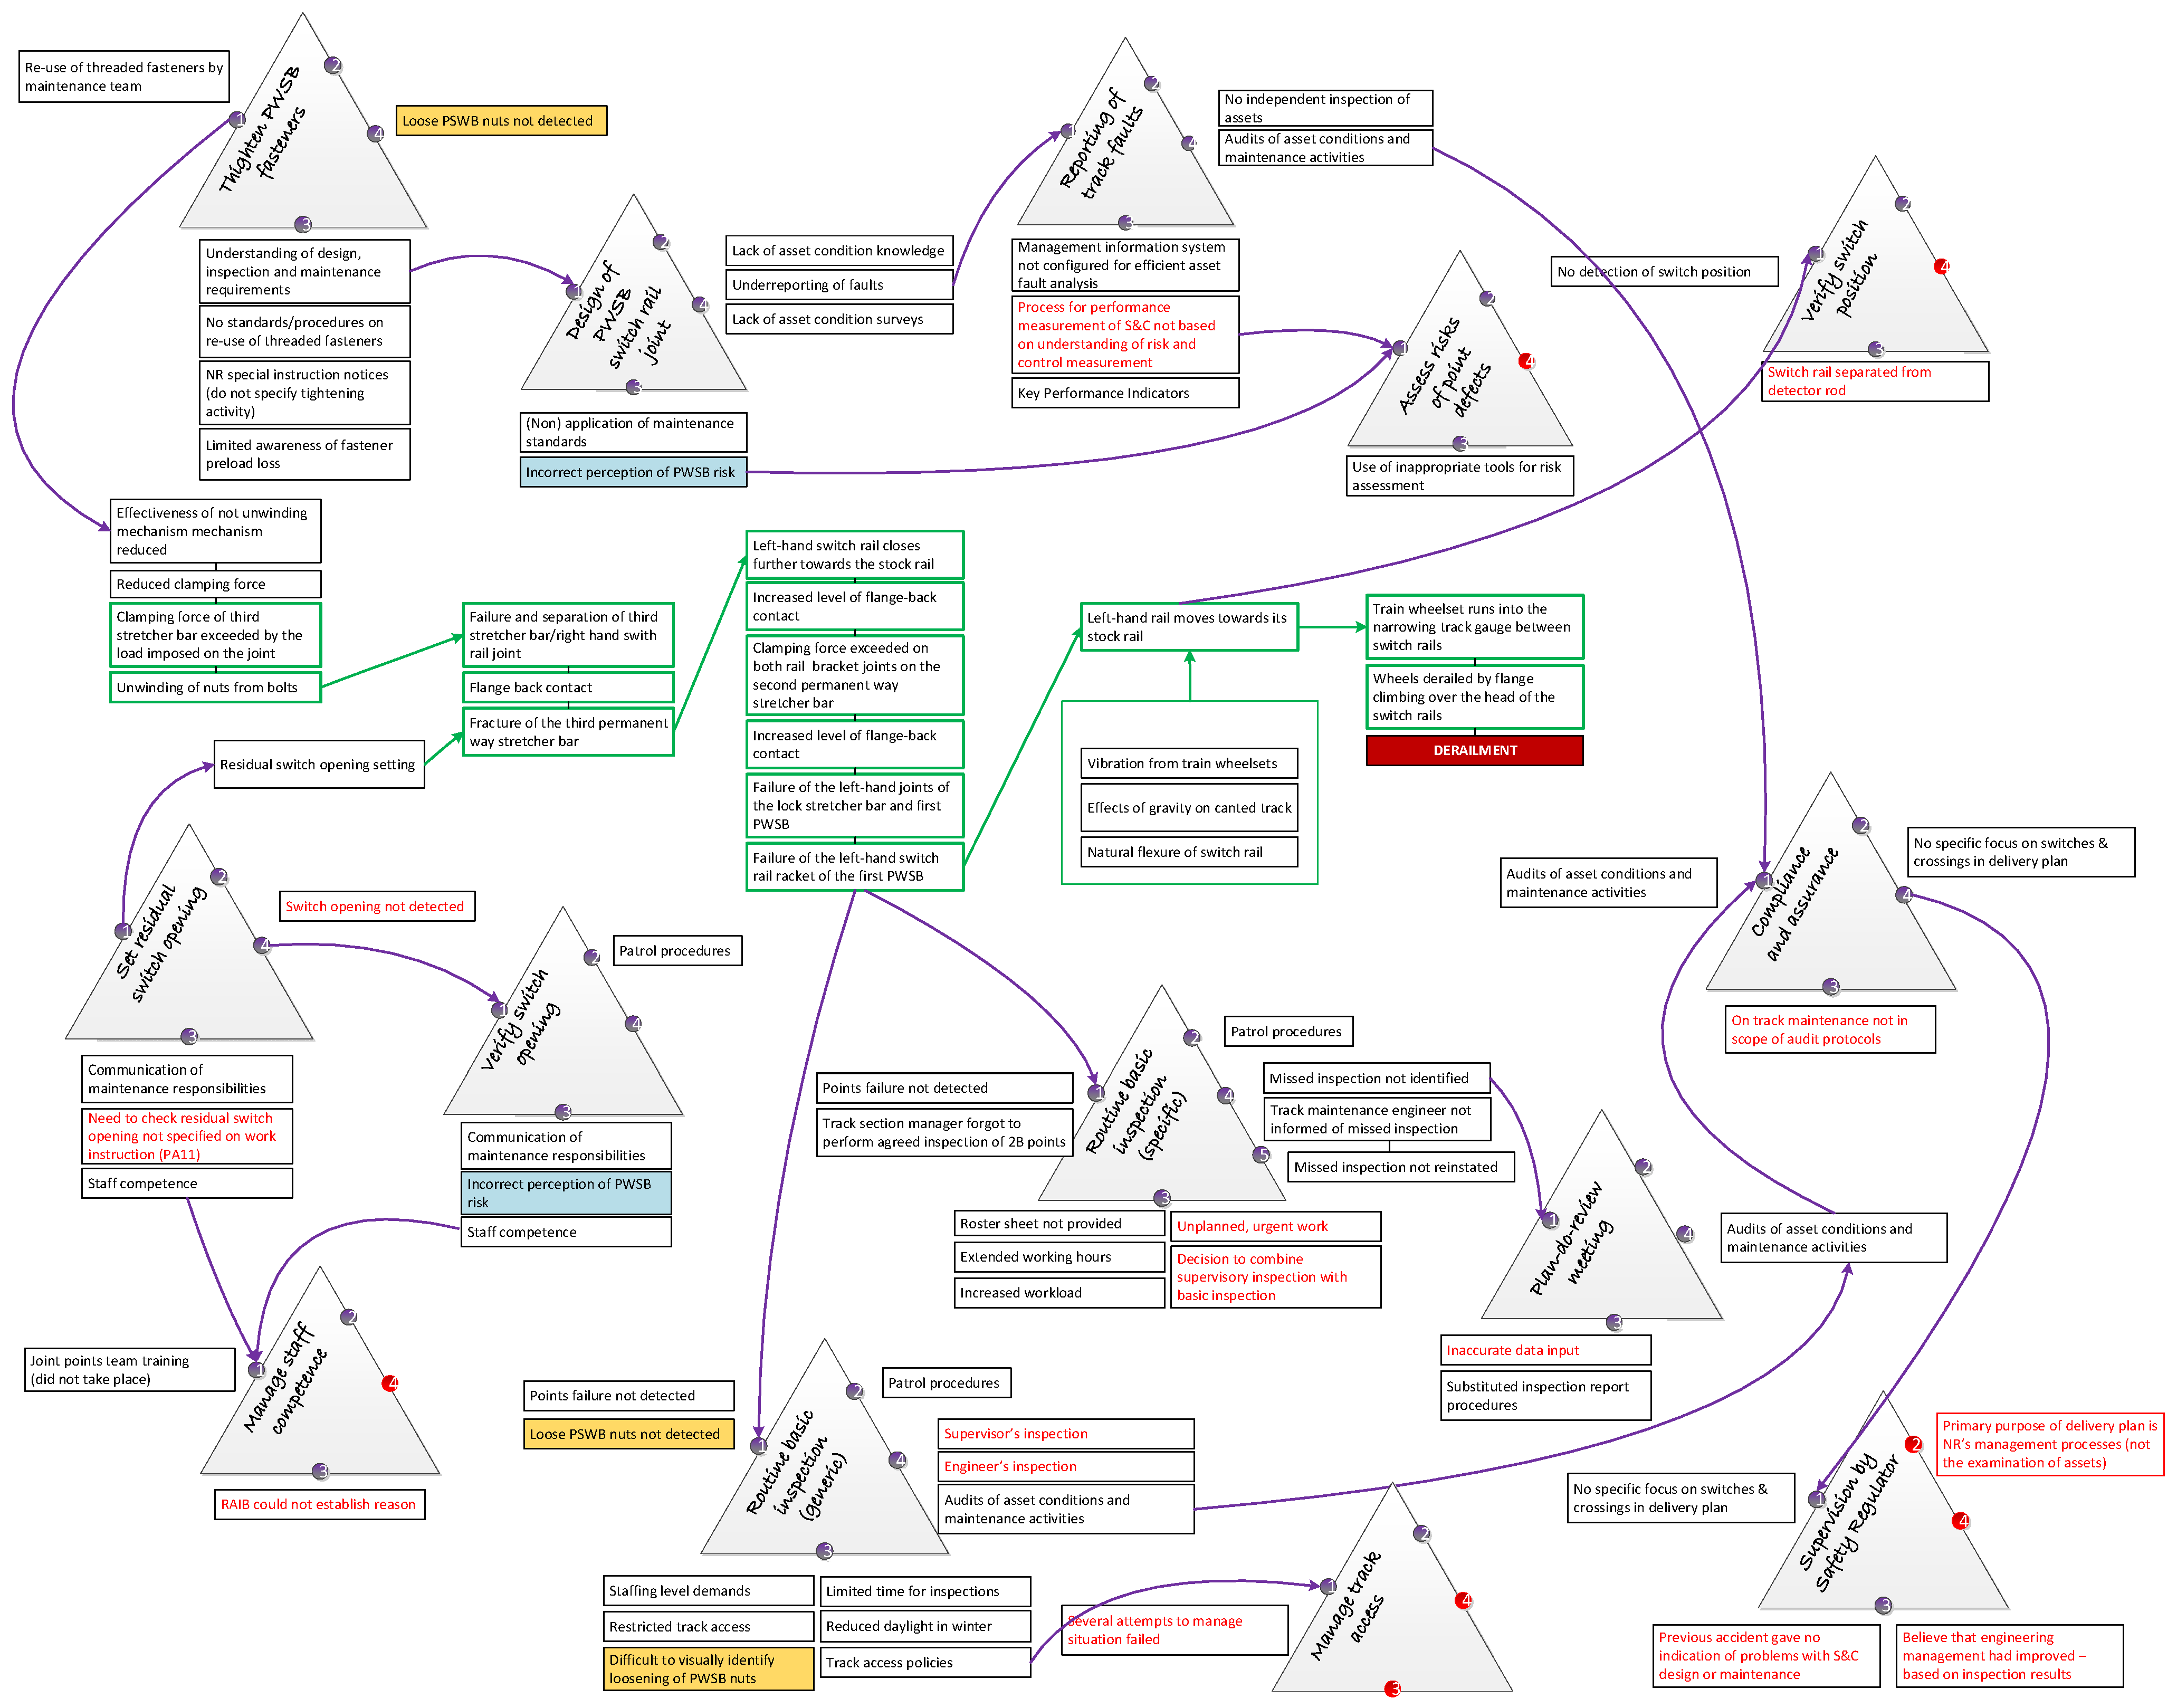
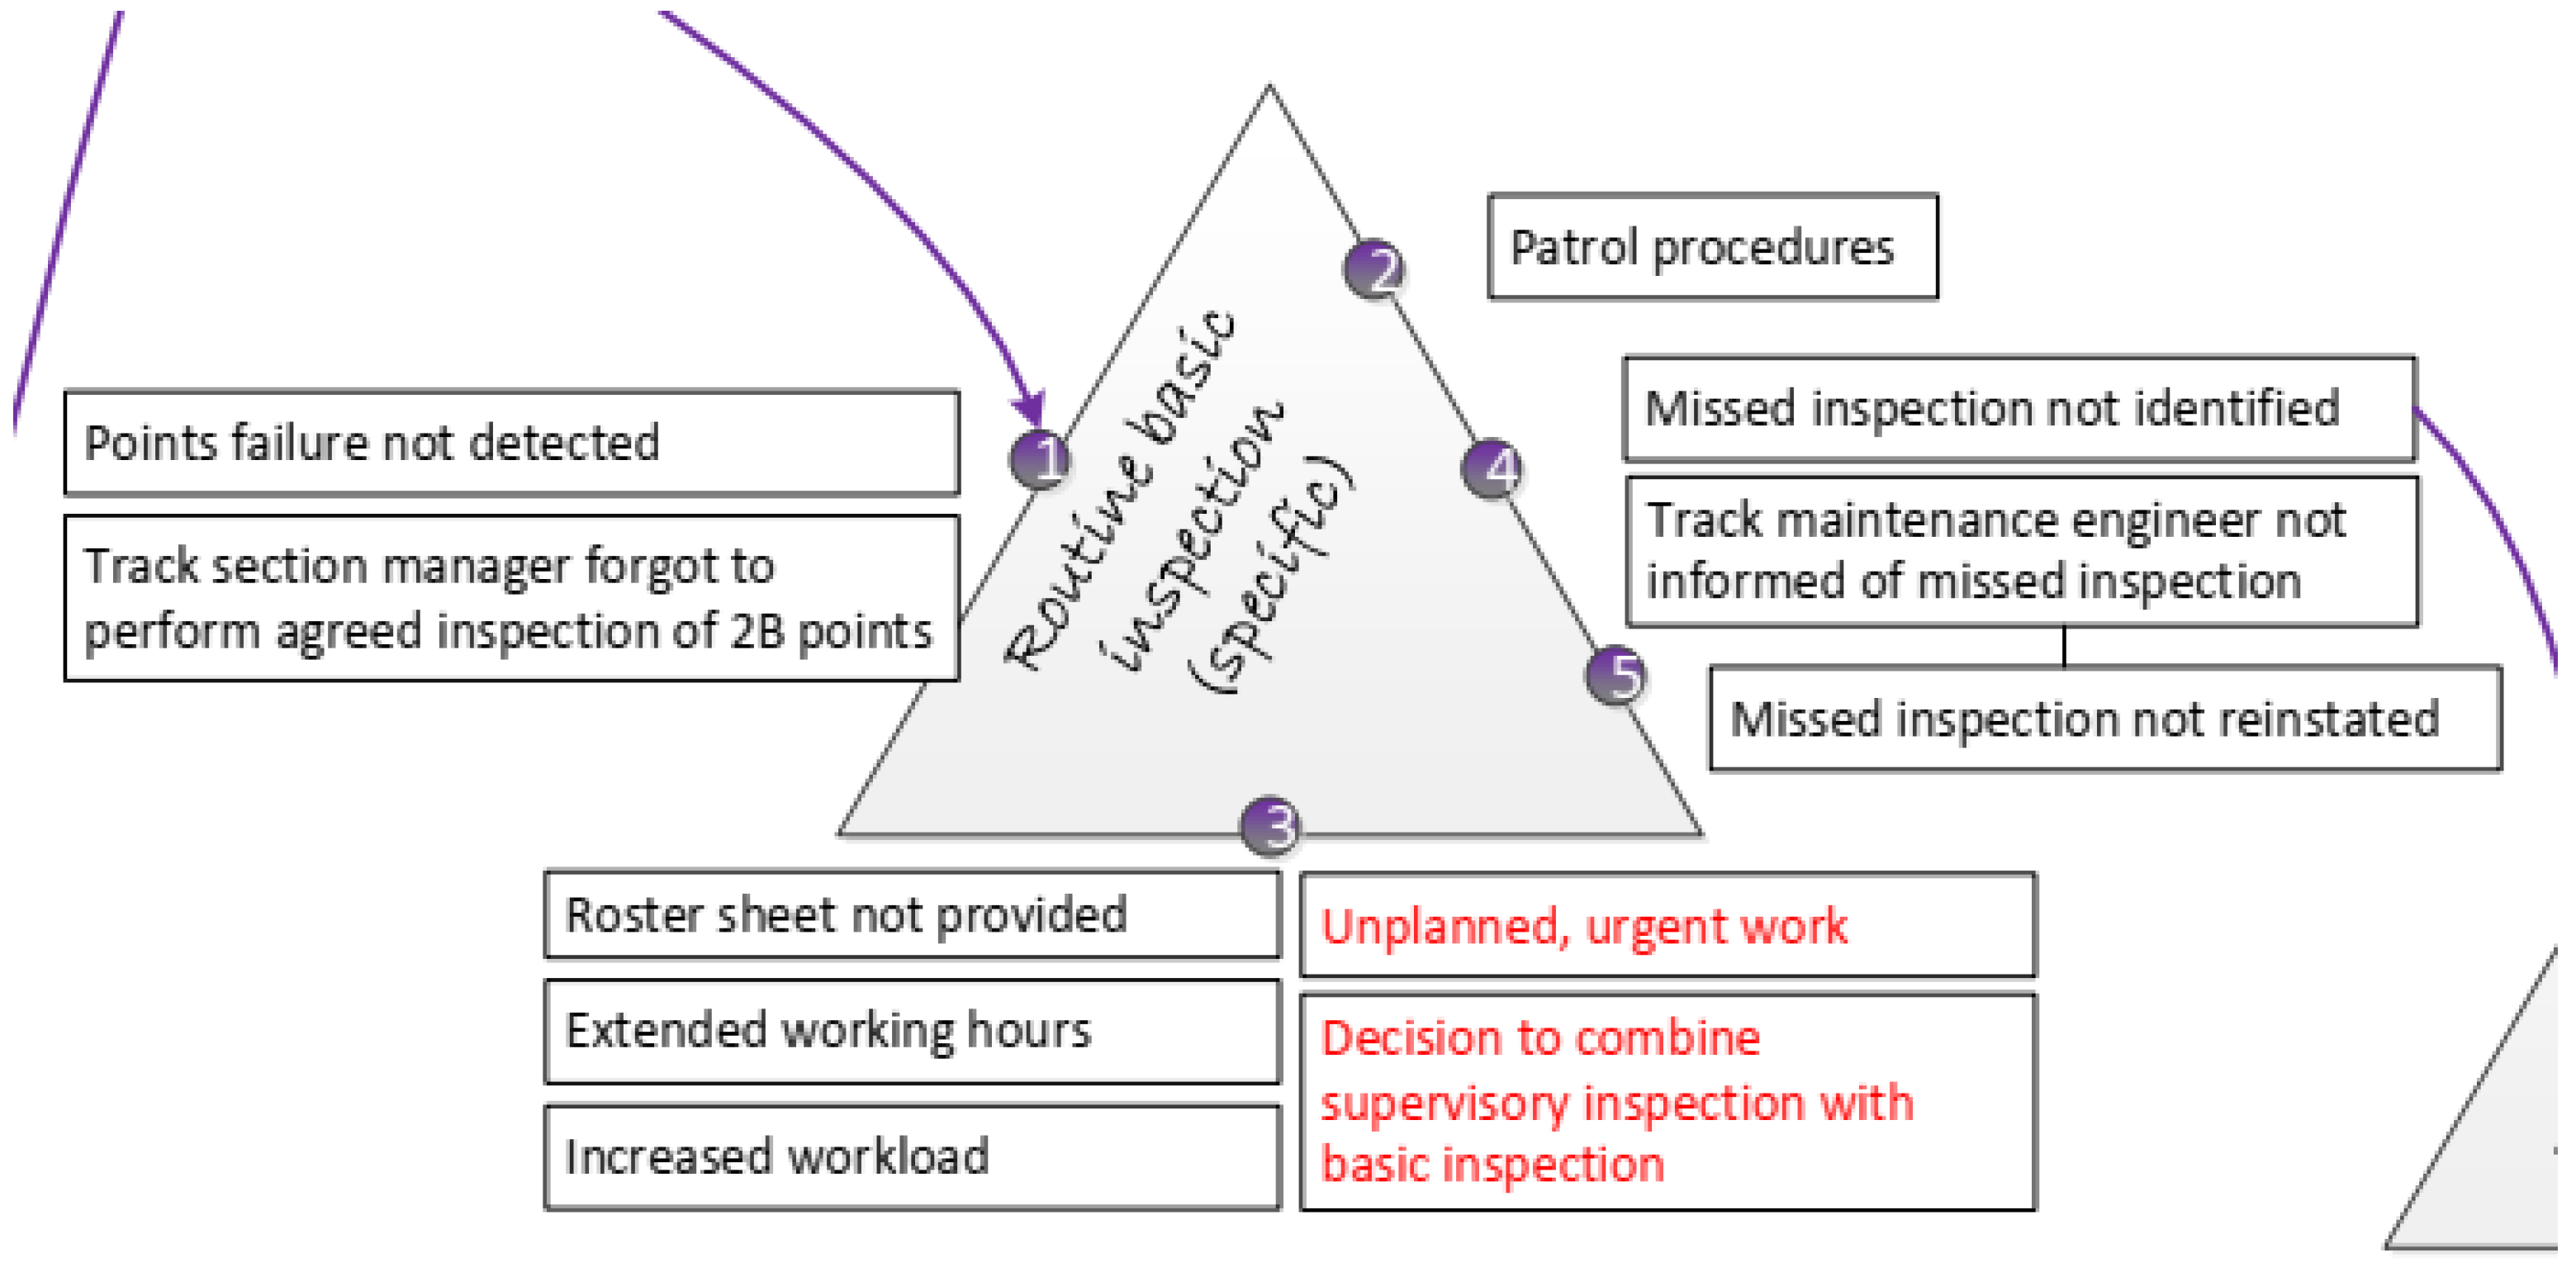
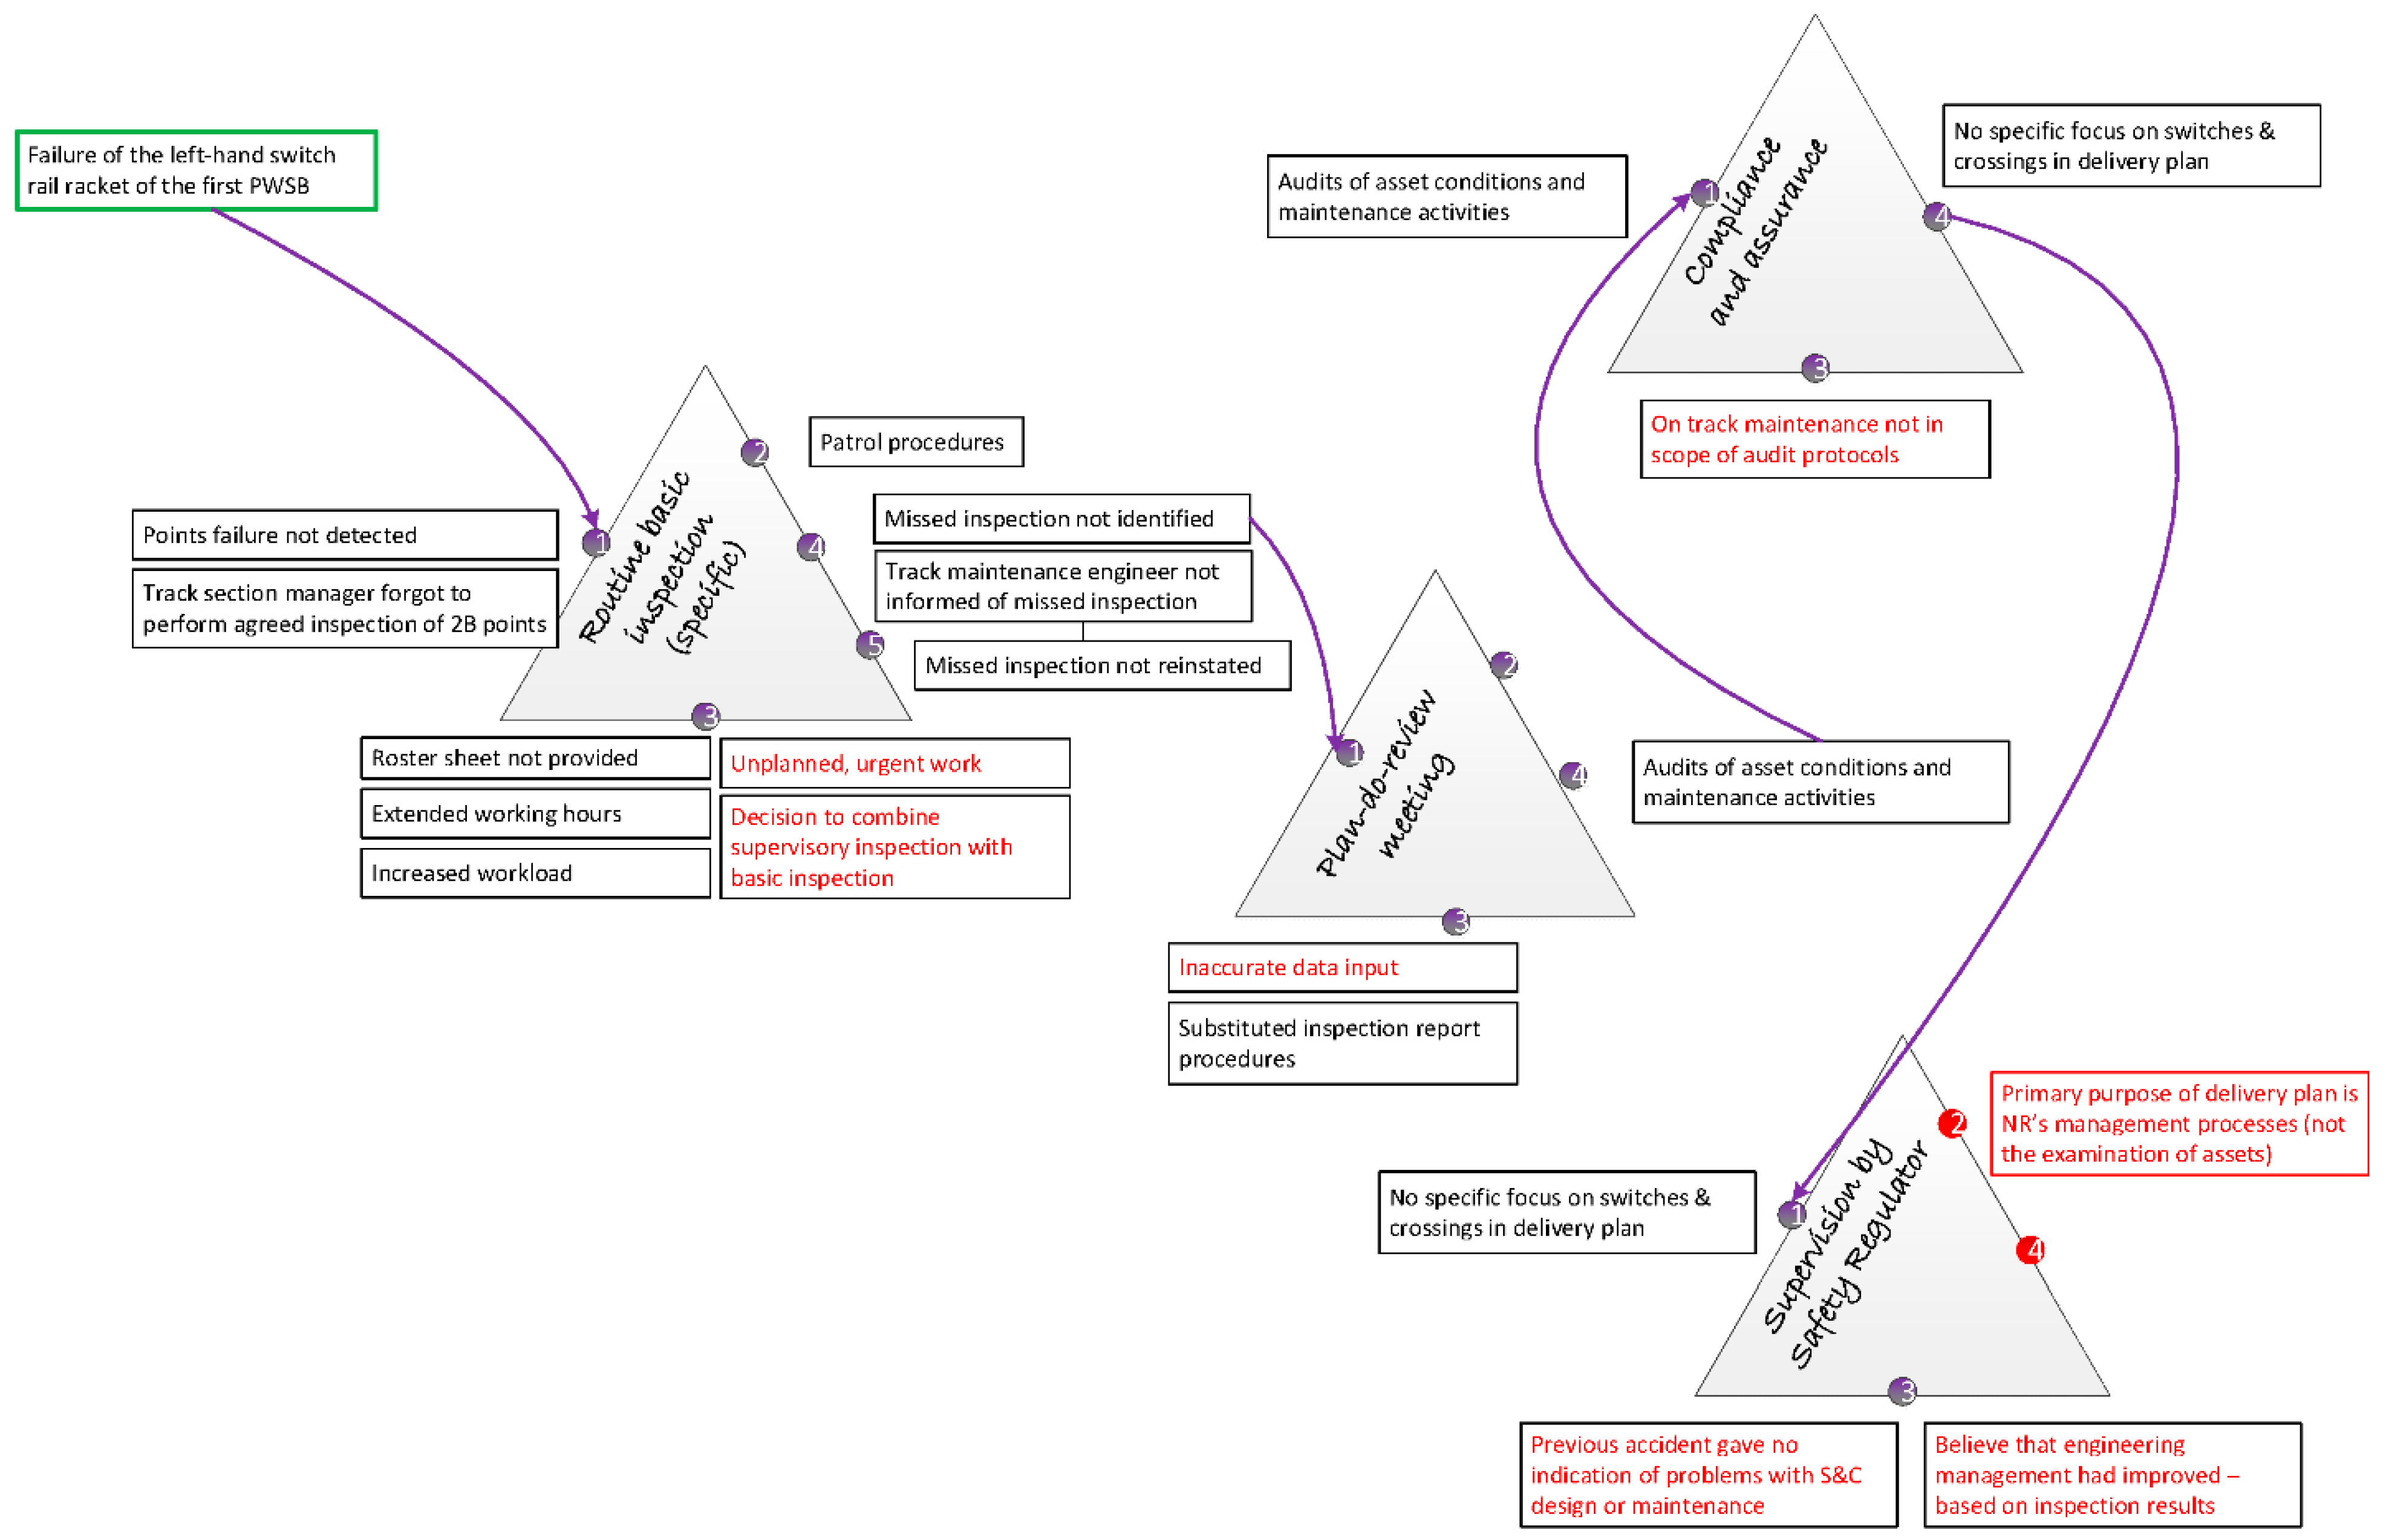
- STEP 1—critical performance: starting close to the event sequence, identify the function or activity that showed critical variability in its performance;
- STEP 2—expected performance: for the selected function, identify the expected performance as prescribed and/or specified;
- STEP 3—source(s) of performance variability (SPV): identify the factor(s) that can explain the critical variability in performance;
- STEP 4—monitoring of variability: identify whether the responsible organisation is identifying, monitoring and reporting the critical variability;
- STEP 5—learning capability (optional): if reported, identify whether the organisation is learning from the reported (critical) variability.
2. Methodology
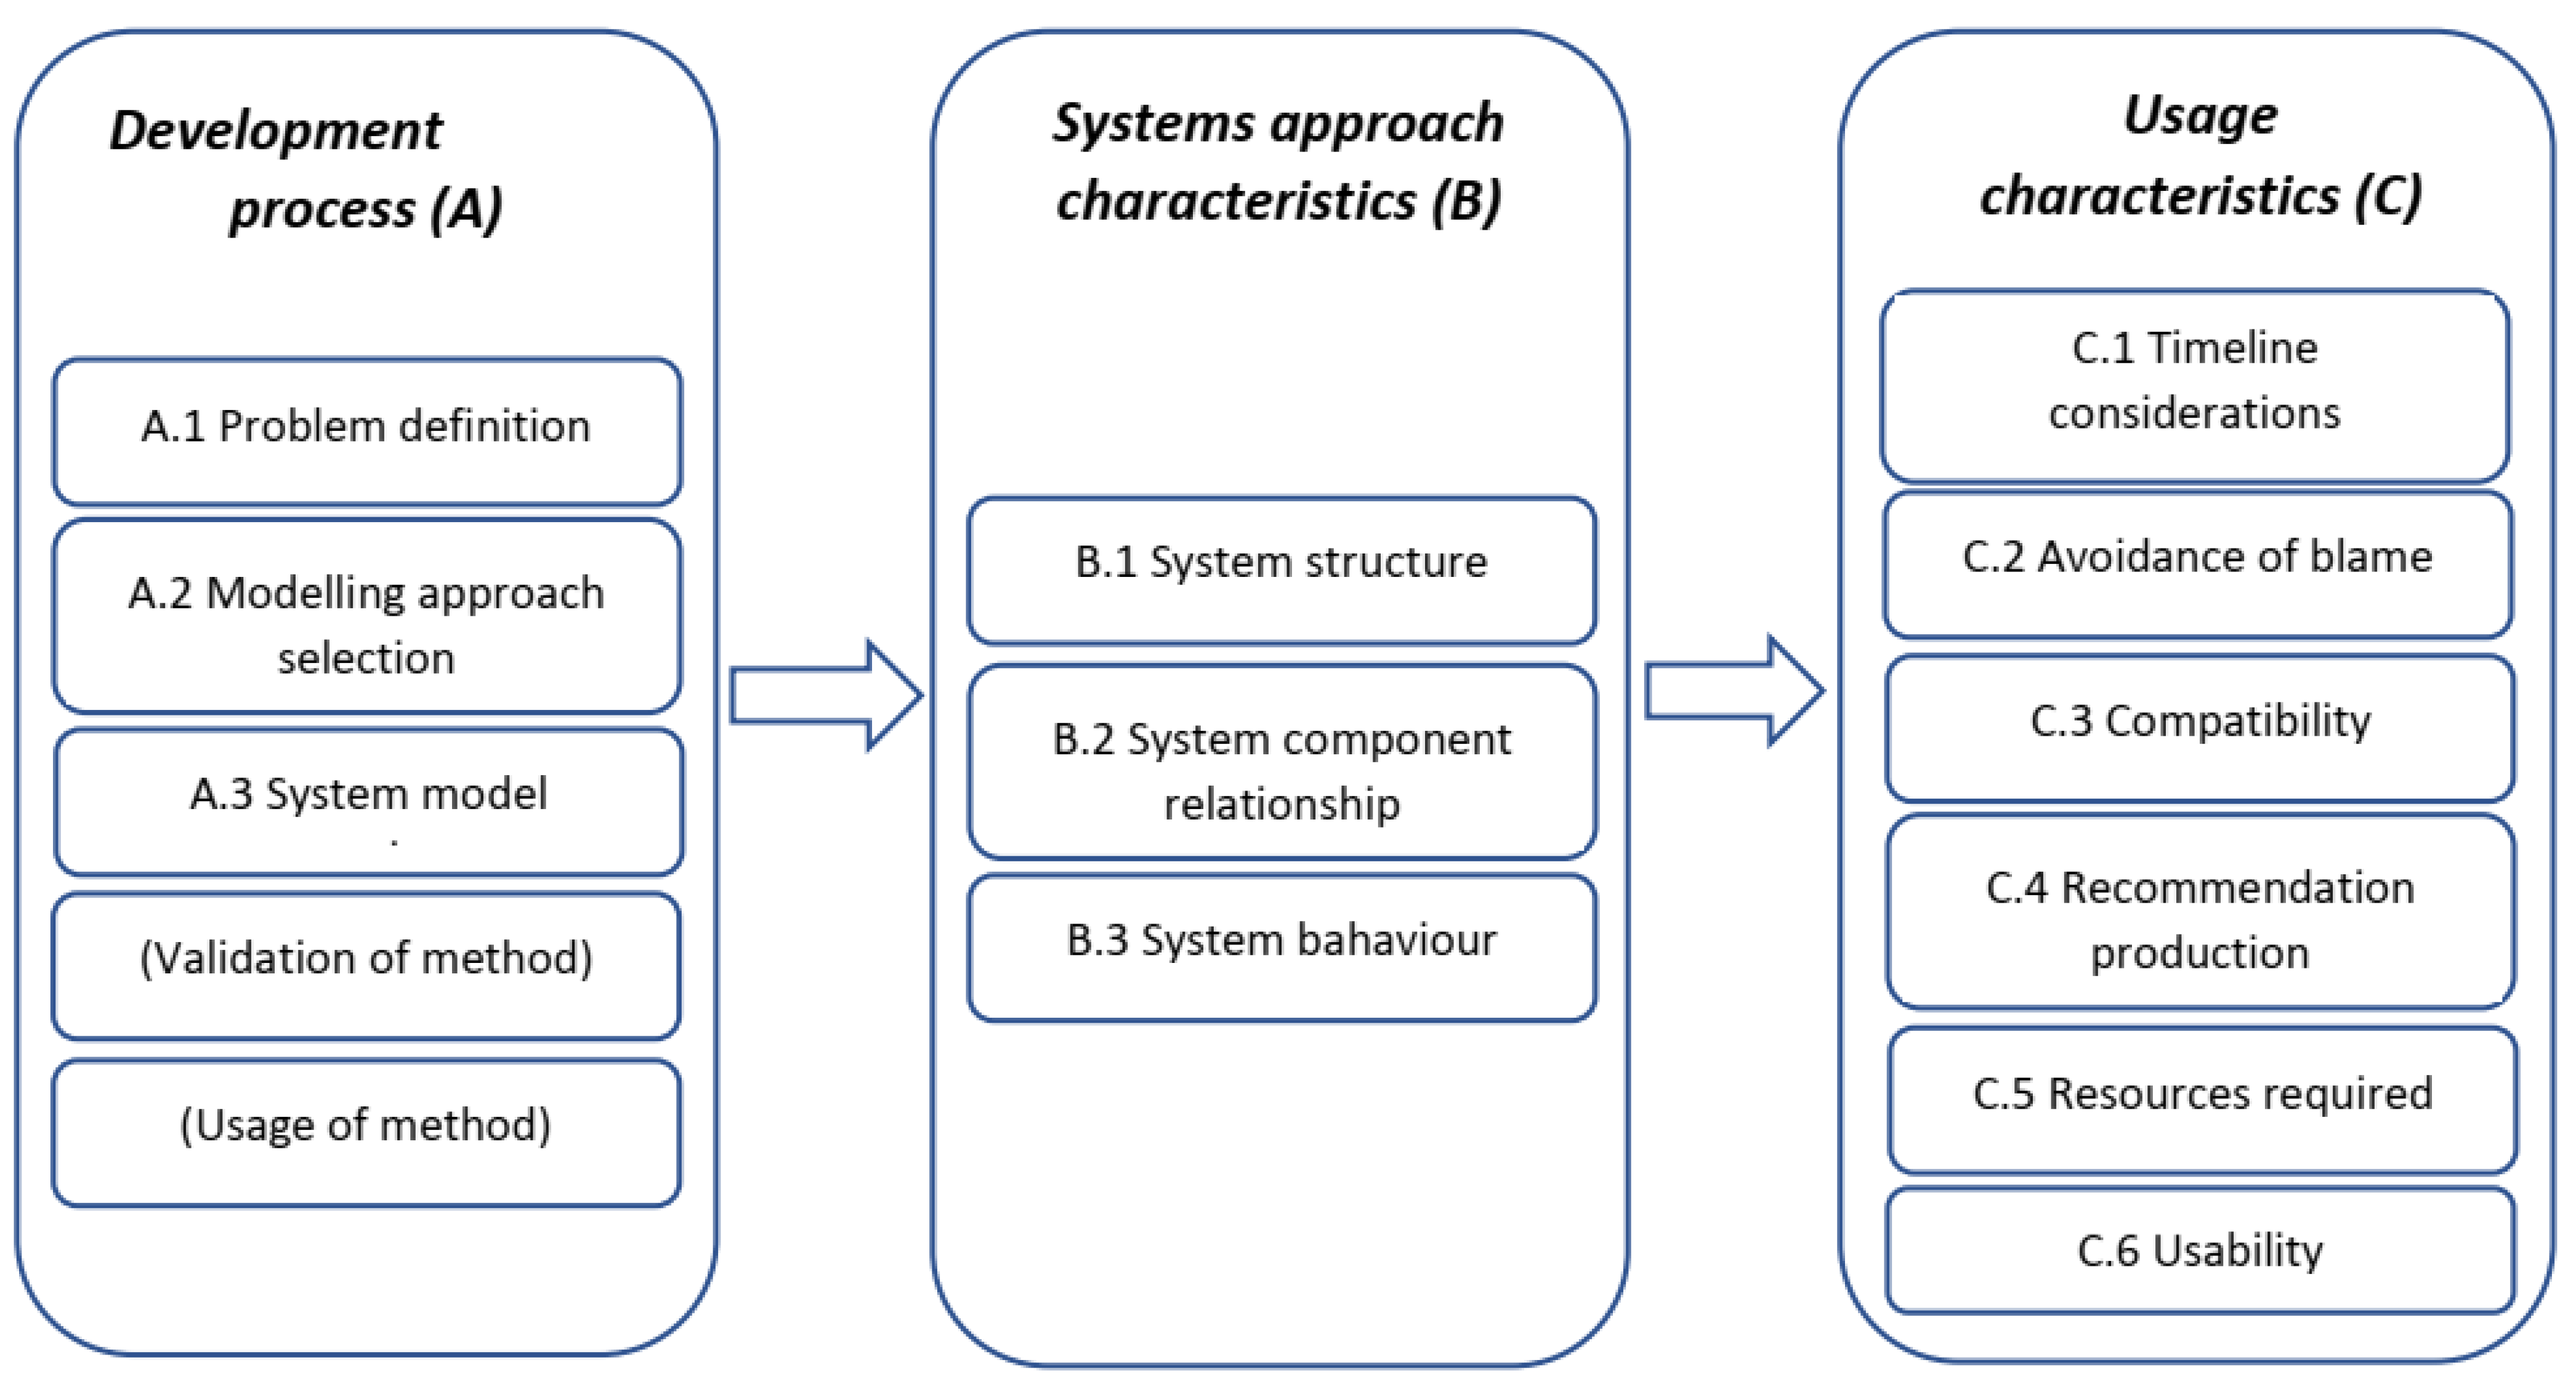
2.1. Evaluation Criteria
2.2. Applying SAFRAN to the Grayrigg Accident
3. Findings
3.1. Development Process (A)
3.1.1. A.1 Problem Definition
3.1.2. A.2 Modelling Approach Selection
3.1.3. A.3 System Model Creation
3.2. Systems Approach Characteristics (B)
3.2.1. B.1 System Structure
3.2.2. B.2 System Component Relationship
3.2.3. B.3 System Behaviour
3.3. Usage Characteristics (C)
3.3.1. C.1 Accident Description
3.3.2. C.2 Avoidance of Blame
3.3.3. C.3 Compatibility of the Method
3.3.4. C.4 Recommendation Production
3.3.5. C.5 Resources Required
3.3.6. C.6 Usability
4. Discussion
5. Conclusions
Author Contributions
Funding
Institutional Review Board Statement
Informed Consent Statement
Data Availability Statement
Conflicts of Interest
Appendix A
Appendix B

| Underwood (2013)—Evaluation Framework [7] | A—Model Development Process | B—Systems Approach Characteristics | ||||
|---|---|---|---|---|---|---|
| A.1—Problem Definition—Is the Reason for Creating the Model Well Defined? | A.2—Modelling Approach Selection—What Conceptual Approach Has been Adopted? | A.3—System Model Creation—How Is the System Graphically Represented by the Model? | B.1—System Structure—How Does the Model Represent a System’s Hierarchy and Component Differentiation? | B.2—System Component Relationships—How Are the Interactions between System Components Analysed? | B.3—System Behaviour—How Does the Model Address the Various Factors Which Affect Safety, e.g., Controlling the Transformation of System Inputs? | |
| Wienen et al. (2017) [6] | - | - | - | - | Does the method take into account the socio-technical context? | Does the method allow to describe control-feedback loops at different hierarchical levels? |
| Waterson et al. (2015) [9] | - | - | - | Defining what is meant by an STS approach to safety: identifying the core constructs and elements of STS | The coverage of STS and its application to safety: address external and environmental aspects of the work domain (e.g., regulatory, economic influences on safety) + define boundaries between system elements | - |
| Underwood and Waterson (2013) [15] | - | - | Does the graphical output of the method help facilitate the analysis (e.g., identify evidence gaps)? Does the method provide a useful means of communicating the findings of analysis with others? | How complex is the system to be analysed? How much of the system will be analysed? | - | - |
| Salmon et al. (2011) [12] | - | - | - | Coverage of the overall socio-technical system | Linkage of failures within and between levels | Ability to identify (all of the) contributing factors Identifying complex human decision making and organisational failures |
| Sklet (2004) [11] | - | To what degree does the method focus on safety barriers? What kind of accident model has influenced the method? | Does the method provide a graphical description of the event sequence? Is the modeling of the system inductive, deductive, morphological or non-system oriented? | The level of scope of the analysis (referring to Rasmussen’s 6 levels) | - | - |
| Benner (1985; cited in Speziali and Hollnagel, 2008) [10] | - | Consistent—Model must be theoretically consistent with an agency’s safety program concepts | - | - | - | - |
| Hollnagel (1998; cited in Speziali and Hollnagel, 2008) [10] | - | Technical basis—Technical content as the extent to which models generated from within each approach are grounded in a clear identifiable model of human action | - | How well can the method represent the complexity of the actual situation | - | Analytical capability—The ability to support a retrospective analysis of events involving human erroneous actions; the specific outcome of a retrospective analysis should be a description of the characteristics of human cognition that are included in the set of assumed causes |
References
- Hollnagel, E. Safety-I and Safety-II: The Past and Future of Safety Management; Ashgate Publishing: Farnham, UK, 2014. [Google Scholar]
- Leveson, N. Safety III: A Systems Approach to Safety and Resilience; Department of Aeronautics and Astronautics, MIT: Cambridge, MA, USA, 2020. [Google Scholar]
- Underwood, P.J.; Waterson, P.E. Accident Analysis Models and Methods: Guidance for Safety Professionals; Loughborough University: Loughborough, UK, 2013; p. 28. [Google Scholar]
- Accou, B.; Reniers, G. Developing a method to improve Safety Management Systems based on accident investigations: The Safety Fractal Analysis. Saf. Sci. 2019, 115, 285–293. [Google Scholar] [CrossRef]
- Young, M.; Steel, T. Non-technical skills in rail accidents: Panacea or pariah? In Proceedings of the Sixth International Human Factors Rail Conference, London, UK, 6–9 November 2017. [Google Scholar]
- Wienen, H.C.A.; Bukhsh, F.A.; Vriezekolk, E.; Wieringa, R.J. Accident Analysis Methods and Models—A Systematic Literature Review; Technical Report No.TR-CTIT-17-04; Centre for Telematics and Information Technology (CTIT): Twente, The Netherlands, 2017. [Google Scholar]
- Underwood, P.J. Examining the Systemic Accident Analysis Research-Practice Gap. Doctoral Thesis, Loughborough University, Loughborough, UK, 2013. [Google Scholar]
- Katsakiori, P.; Sakellaropoulos, G.; Manatakis, E. Towards an evaluation of accident investigation methods in terms of their alignment with accident causation models. Saf. Sci. 2009, 47, 1007–1015. [Google Scholar] [CrossRef]
- Waterson, P.; Robertson, M.M.; Cooke, N.J.; Militello, L.; Roth, E.; Stanton, N.A. Defining the methodological challenges and opportunities for an effective science of sociotechnical systems and safety. Ergonomics 2015, 58, 565–599. [Google Scholar] [CrossRef] [PubMed]
- Speziali, J.; Hollnagel, E. Study on Developments in Accident Investigation Methods: A Survey of the “State-of-the Art”; SKI Report 2008:50; Ecole des Mines de Paris: Paris, France, 2008. [Google Scholar]
- Sklet, S. Comparison of some selected methods for accident investigation. J. Hazard. Mater. 2004, 111, 29–37. [Google Scholar] [CrossRef] [PubMed]
- Salmon, P.M.; Cornelissen, M.; Trotter, M.J. Systems-based accident analysis methods: A comparison of Accimap, HFACS and STAMP. Saf. Sci. 2011, 50, 1158–1170. [Google Scholar] [CrossRef]
- Flovenz, G. Investigating SMS—A Problem of Methodology. Master’s Thesis, School of Aerospace, Transport and Manufacture, Safety and Accident Investigation (Air Transport), Cranfield University, Cranfield, UK, 2020. [Google Scholar]
- Malone, M. Do Different Analysis Techniques Influence the Evaluation of the Safety Management System in an Investigation: A Case Study Involving a Principal Contractor in the Rail Industry. Master’s Thesis, Cranfield Safety and Accident Investigation Centre Cranfield University, Cranfield, UK, 2020. [Google Scholar]
- Underwood, P.; Waterson, P. Systems Thinking, the Swiss Cheese Model and accident analysis: A comparative systemic analysis of the Grayrigg train derailment using the ATSB, AcciMap and STAMP models. Accid. Anal. Prev. 2013, 68, 75–94. [Google Scholar] [PubMed]
- RAIB. Rail Accident Report: Derailment at Grayrigg 23 February 2007; Report 20/2008 v5 July 2011; Rail Accident Investigation Branch, Department of Transport: Derby, UK, 2011.
- Accou, B.; Reniers, G. Analysing the depth of railway accident investigation reports on over-speeding incidents, using an innovative method called “SAFRAN”. In Proceedings of the 55th European Safety, Reliability & Data Association (ESReDA) Seminar, Bucharest, Romania, 9–10 October 2018. [Google Scholar]
- Accou, B.; Reniers, G. Using the SAfety FRactal ANalysis method to investigate human and organisational factors beyond the sharp end. A critical socio-technical analysis of the Santiago de Compostela train crash investigation. to be published.
- Antonsen, S. Safety Culture: Theory, Method and Improvement; Ashgate Publishing Limited: Farnham, UK, 2009. [Google Scholar]
- Kelly, T. The Role of the Regulator in SMS; ITF Discussion Paper 2017-17; OECD/ITF: Paris, France, 2017. [Google Scholar]
- Dien, Y.; Dechy, N.; Guillaume, E. Accident Investigation: From Searching Direct Causes to Finding In-Depth Causes. Problem of Analysis or/and of Analyst? In Proceedings of the 33rd ESReDA Seminar, Ispra, Italy, 13–14 November 2007; Dechy, N., Cojazzi, G.G.M., Eds.; European Commision: Luxembourg, 2007; p. 16. [Google Scholar]
- Johnson, C. Review of the BFU Überlingen Accident Report—Final Report; Eurocontrol Contract C/1.369/HQ/SS/04; Eurocontrol: Brussels, Belgium, 2004. [Google Scholar]
- Accou, B.; Reniers, G. Introducing the Extended Safety Fractal: Reusing the concept of Safety Management Systems to organize resilient organizations. Int. J. Environ. Res. Public Health 2020, 17, 5478. [Google Scholar] [CrossRef] [PubMed]
- Reason, J. Managing the Risk of Organisational Accidents; Ashgate Publishing: Farnham, UK, 1997. [Google Scholar]
- Lundberg, J.; Rollenhagen, C.; Hollnagel, E. What-You-Look-For-Is-What-You-Find—The consequences of underlying accident models in eight accident investigation manuals. Saf. Sci. 2009, 47, 1297–1311. [Google Scholar] [CrossRef]
- Dekker, S. Drift into Failure: From Hunting Broken Components to Understanding Complex Systems; Ashgate Publishing: Farnham, UK, 2011. [Google Scholar]
- Rasmussen, J. Risk management in a dynamic society: A modelling problem. Saf. Sci. 1997, 27, 182–213. [Google Scholar] [CrossRef]
- Pariès, J.; Macchi, L.; Valot, C.; Derhavengt, S. Comparing HROs and RE in the light of safety management systems. Saf. Sci. 2019, 117, 501–511. [Google Scholar] [CrossRef]
- Hollnagel, E. The Four Cornerstones of Resilience Engineering. In Resilience Engineering Perspectives, Volume 2: Preparation and Restoration; Nemeth, C.P., Hollnagel, E., Dekker, S., Eds.; Ashgate: Farnham, UK, 2009; pp. 117–134. [Google Scholar]
- Denyer, D. Organizational Resilience: A Summary of Academic Evidence, Business Insights and New Thinking; BSI and Cranfield School of Management: Bedford, UK, 2017. [Google Scholar]
- Accou, B.; Carpinelli, F. Systematically investigating human and organisational factors in complex socio-technical systems by using the “SAfety FRactal ANalysis” method. Appl. Ergon. 2022, 100, 103662. [Google Scholar] [CrossRef] [PubMed]
- Lin, P.-H. Safety Management and Risk Modelling in Aviation: The Challenge of Quantifying Management Influences. Ph.D. Thesis, Next Generation Infrastructures Foundation, Delft, The Netherlands, 2011. [Google Scholar]
- Wahlström, B.; Rollenhagen, C. Safety management—A multi-level control problem. Saf. Sci. 2014, 69, 3–17. [Google Scholar] [CrossRef]
- Holnagel, E. FRAM: The Functional Resonance Analysis Method: Modelling Complex Socio-Technical Systems; Ashgate: Aldershot, UK, 2012. [Google Scholar]
- Leveson, N.G. Engineering A Safer World; MIT Press: Cambridge, MA, USA, 2011. [Google Scholar]
- Del Frate, L.; Zwart, S.D.; Kroes, P.A. Root cause as a U-turn. Eng. Fail. Anal. 2011, 18, 747–758. [Google Scholar] [CrossRef]
- Reason, J. The Human Contribution: Unsafe Acts, Accidents and Heroic Recoveries; Ashgate: Farnham, UK, 2008. [Google Scholar]
- van Schaardenburgh-Verhoeve, K.N.R.; Corver, S.; Groenweg, J. Ongevalsonderzoek buiten de grenzen van de organisatie. In Proceedings of the Nederlandse Vereniging Voor Veiligheidskunde (NVVK) Jubileumcongres, Arnhem, The Netherlands, 25–26 April 2007. [Google Scholar]
- Argyrys, C.; Schön, D.A. Organizational Learning II-Theory, Method, and Practice; Addison-Wesley Publishing Company: Boston, MA, USA, 1996. [Google Scholar]
- Railway Accident Investigation Branch (RAIB), Derby, United Kingdom. Runaway at Bradford Interchange/SAFRAN, 8 June 2018, Meeting with Bart Accou (ERA). Private Communication. 2019. Available online: https://www.gov.uk/government/organisations/rail-accident-investigation-branch (accessed on 28 March 2022).
- Swiss Transportation Safety Investigation Board (STSB). Bern, Switzerland Test Méthode SAFRAN. Feedback Intermédiaire à Bart Le 22.05.2019. Private Communication. 2019. Available online: https://www.sust.admin.ch/en/stsb-homepage (accessed on 28 March 2022).
- Salmon, P.; Read, G.; Stanton, N.; Lenné, M. The crash at Kerang: Investigating systemic and psychological factors leading unintentional non-compliance at rail level crossing. Accid. Anal. Prev. 2013, 50, 1278–1288. [Google Scholar] [CrossRef] [PubMed]
- Young, M.; Shorrock, S.; Faulkner, J.; Braithwaite, G. Who Moved my (Swiss) Cheese? The (r)evolution of Human Factors in Transport Safety Investigation; ISASI Seminar: Gold Coast, Australia, 2004. [Google Scholar]
- Farooqi, A.T. Methods for the Investigation of Work and Human Errors in Rail Engineering Contexts. Ph.D. Thesis, University of Nottingham, Nottingham, UK, 2015. [Google Scholar]
- Groeneweg, J. Controlling the Controllable: The Management of Safety; DSWO Press, Leiden University: Leiden, The Netherlands, 1992. [Google Scholar]
- Le Coze, J.C. What have we learned about learning from accidents? Post-disaster reflections. Saf. Sci. 2013, 51, 441–453. [Google Scholar] [CrossRef]
- Ryan, B.; Golightly, D.; Pickup, L.; Reinartz, S.; Atkinson, S.; Dadashi, N. Human functions in safety—Developing a framework of goals, human functions and safety relevant activities for railway socio-technical systems. Saf. Sci. 2021, 140, 105279. [Google Scholar] [CrossRef]


Publisher’s Note: MDPI stays neutral with regard to jurisdictional claims in published maps and institutional affiliations. |
© 2022 by the authors. Licensee MDPI, Basel, Switzerland. This article is an open access article distributed under the terms and conditions of the Creative Commons Attribution (CC BY) license (https://creativecommons.org/licenses/by/4.0/).
Share and Cite
Accou, B.; Reniers, G. Towards a New Way of Understanding the Resilience of Socio-Technical Systems: The Safety Fractal Analysis Method Evaluated. Safety 2022, 8, 68. https://doi.org/10.3390/safety8040068
Accou B, Reniers G. Towards a New Way of Understanding the Resilience of Socio-Technical Systems: The Safety Fractal Analysis Method Evaluated. Safety. 2022; 8(4):68. https://doi.org/10.3390/safety8040068
Chicago/Turabian StyleAccou, Bart, and Genserik Reniers. 2022. "Towards a New Way of Understanding the Resilience of Socio-Technical Systems: The Safety Fractal Analysis Method Evaluated" Safety 8, no. 4: 68. https://doi.org/10.3390/safety8040068
APA StyleAccou, B., & Reniers, G. (2022). Towards a New Way of Understanding the Resilience of Socio-Technical Systems: The Safety Fractal Analysis Method Evaluated. Safety, 8(4), 68. https://doi.org/10.3390/safety8040068