Abstract
The COVID-19 travel restriction orders have significantly reduced travel and generally lowered the risk of road traffic collisions, but many accounts suggest an increase in risky driving behaviors and consequent fatal crashes during the shelter-in-place period. Risky driving behaviors including failure to wear a seatbelt, speeding, and drunk driving were observed to be the leading contributing factors of the fatalities. Whereas the fatal crashes that characterized the shelter-in-place period has become a topical issue, the high number of crashes that occurred as a result of the panic shopping and increased travel activities in the weeks before the shelter-in-place order have not received much attention. In this study, we investigated the differences and similarities in the effects of the factors that were associated with crash injury severity before, during, and after the shelter-in-place order. The study used crash data from the state of Alabama for the 2020 calendar year. Preliminary data analysis revealed interesting variations in crash trends across the three periods. It was found that the highest weekly crash frequency occurred in the immediate week before the shelter-in-place order, and a higher proportion of crashes that occurred between 6 p.m. and 6 a.m. and those that occurred in residential areas happened during the shelter-in-place period while shopping area crashes, manufacturing/industrial area crashes, rear-end collisions, and crashes involving female drivers occurred mostly before the shelter-in-place period. Three injury severity models were developed using random parameters logit with heterogeneity in means and variances approach. The results showed that major injury crashes occurred mainly in rural areas and occurred due to speeding, fatigue driving, and failure to use a seatbelt. The effects of these factors on crash outcome did not vary across the year, indicating that the shelter-in-place order did not impact the driving behaviors of the driver population that got into major injury crashes. The results further revealed that the effects of some crash factors, such as road type and manner of collision, varied across the periods. The findings of the study provide a deeper, data-driven understanding of how driving behaviors and associated crash outcomes may be affected by extreme events such as the COVID-19 shelter-in-place.
1. Introduction
COVID-19 was declared a public health emergency in January 2020 and upgraded to a pandemic in March 2020. As the coronavirus continued to be a significant threat to human health, many countries and regions advised against all but essential travel, and ultimately imposed societal restrictions in the form of stay-at-home orders, curfews, and quarantines. Indeed, by April 2020, nearly half of the global population was under some form of lockdown, with citizens asked or ordered to stay at home by their governments [1]. These travel restriction orders have significantly reduced travel activities and generally lowered the risk of road traffic collisions but increased risky driving behaviors and consequent fatal crashes throughout the shelter-in-place. It would seem logical that such restrictions would have reduced the occurrence of crashes simply due to less travel (i.e., reduced exposure), but many accounts suggest an increase in the risk of fatal crashes during these shelter-in-place periods.
Statistics of 2020 road fatalities reveal an increase in many regions and countries during the COVID-19 pandemic [2,3,4,5]. Available data for all of 2020 show that 38,680 people, representing an increase of 7.2% or nearly 2600 more than in 2019, died on U.S. roads even though Americans drove 13% fewer miles [5,6]. Thus, this highlights that the inclination for risky behaviors, situational and structural factors such as gas price changes that encouraged road trips among some section of the population, and reduced traffic law enforcement have affected road safety performance during the pandemic, while the National Highway Traffic Safety Administration further observed that risky driving behaviors including failure to wear a seatbelt, speeding, and drinking while driving were the leading contributing factors of the fatalities. In fact, in the US, many states have also reported an increase in speed-related fatalities during the shelter-in-place period compared to the same period in previous years. For instance, [7,8] observed that a higher number of speeding-related crashes and fatalities have been recorded during the pandemic shelter-in-place in North Carolina and Virginia, respectively, while [9] made a similar observation in Alabama. The pandemic has also been associated with increased alcohol sales and use [10,11] in response to increased stress, anxiety, and depression among some sections of the population (e.g., [12,13,14,15]).
Several studies have recently assessed the impact of the COVID-19 shelter-in-place order on road traffic crashes. For instance, by comparing the traffic crashes during the shelter-in-place with similar circumstances in the past where traffic volumes dropped suddenly, [16] found that vehicle fatality rates, injury accidents, and speeding increased and remained high even as traffic started returning to normal. A trend they found to contradict the post-World War II recessions where fatality rates declined with a decrease in the volume of traffic [17]. In Nepal, there were frequent media reports of road crashes resulting in injury and fatal severities despite the nationwide shelter-in-place. A daily average of 3 deaths and 22 injuries were recorded with pedestrians and motorcyclists making up the highest proportion of the crash casualties. Interestingly, it was reported that more deaths were recorded in Nepal due to road crashes during the shelter-in-place period compared to the COVID-19 pandemic [18]. Other studies reported some positive safety benefits of the shelter-in-place order. Ref. [19] found that reduced traffic volume during the COVID-19 shelter-in-place resulted in an increase in speeding, harsh braking, and use of mobile phones in Greece and the Kingdom of Saudi Arabia (KSA) although, in Greece, they reported a 41% reduction in crashes and an 81% decrease in driving in the early morning hours (00:00–05:00) (a period considered to be high risk for crashes) during the first month of the shelter-in-place order. During the period of the lockdown in Spain (16 March–26 April 2020), the number of crashes per day fell by 74.3% in comparison with those in February 14–20 (reference week) and 76% with respect to the equivalent period in 2018–2019 [20]. However, neither study emphasized the number or percentage of fatalities recorded during the period for the reduced number of crashes. Preliminary data from California on total and casualty collisions on state highways during the shelter-in-place period of non-essential businesses showed a significant reduction in total crashes and injury-related crashes from 1 March 2020 to 30 April 2020, compared to the period before the shelter-in-place and a similar time in the previous year [21]. Similarly, North Carolina data on total and casualty collisions between 15 March and 16 May 2020, showed a 50% and 10% decrease in total and fatal collisions, respectively, when compared to pre-shelter-in-place levels [7]. Interestingly, during the shelter-in-place period, casualty collisions increased by 6% due to a higher proportion of single-vehicle collisions [7]. Additionally, in the US, a 14% increase in fatal crashes in March 2020 was reported from the National Safety Council data [22].
Most of the literature reviewed by the authors focused mainly on the impact of the COVID-19 shelter-in-place on road traffic crashes without adequately accounting for severity variations during the period in comparison to pre-shelter-in-place and post-shelter-in-place thresholds. Additionally, factors such as driver demographics, roadway, and other crash contributing factors during the period have not been explored extensively. Therefore, this paper attempts to understand the temporal variations in the factors associated with crash outcomes during the shelter-in-place compared to pre-shelter-in-place and post-shelter-in-place periods for the state of Alabama.
The state of Alabama announced a stay-at-home order on 11 March 2020 (week 11). For this reason, the crash data have been grouped into crashes that occurred before March 11 as the pre-shelter-in-place period, those that occurred between week 11 and week 14 as the shelter-in-place period, and crashes that occurred after week 14 as the post-shelter-in-place period. Even though shelter-in-place order was still active by week 14, many Alabamians were able to move around (for instance, for grocery shopping). This period onward witnessed the rise in travel activities and a rise in crashes. To understand the effects of the COVID-19 pandemic on the trend of crashes in the state, the preliminary analysis included a weekly analysis of the data. Additionally, injury severity analyses were conducted to understand how various crash factors are associated with or influenced crash outcomes over the periods. A random parameters logit with heterogeneity in means and variances modeling approach was adopted to address unobserved heterogeneity in the crash data, as failure to do so could potentially bias the results and eventually countermeasure decisions. Categorization of the crash data for in-depth analyses has helped to provide an improved understanding of how the crash factors influenced crash outcomes under the different scenarios and this is expected to provide valuable insight and lessons to manage road safety challenges in future pandemics.
2. Materials and Methods
2.1. Data
Crashes that occurred in 2020 in Alabama were used for this study. The crash data were obtained from the Critical Analysis Reporting Environment (CARE) system developed by the Center for Advanced Public Safety (CAPS) at the University of Alabama. This database serves as the primary source of historical crash data for research and policy decision-making in the state of Alabama. After data cleaning efforts, a total of 113,102 crash observations were available for analysis. The severity of a crash in the CARE database, categorized into five levels (fatal, incapacitating, non-incapacitating, possible injuries, and property damage only/no injury), is based on the most severe injury to any person involved in the crash. A trained crash reporting officer makes a determination of the severity as follows:
- Fatal injury: A crash is fatal if a victim is pronounced dead at the scene or before the report is completed. If not, one of the other codes will apply. However, if a victim dies later as a result of the crash this code will need to be updated according to the following directions. The Department of Public Safety uses a thirty (30) day counting period for traffic fatalities. If a person dies as a result of injuries received in a traffic crash within thirty days of the date of the crash, that victim is considered to be a traffic fatality.
- Incapacitating injury: This means that the victim with the most severe injury must be carried or otherwise helped from the scene.
- Non-Incapacitating injury: This code is assigned if the victim has visible signs of injury, either in a physical or mental sense (e.g., had passed out), but is judged able to walk away from the scene without help. The difference between this code and code possible injury is strictly in the external evidence of injury.
- Possible injury: This code is assigned if the victim complains of pain, but there are no visible signs of it, and he or she is able to walk away from the scene of the crash.
- Property damage only: No one is injured.
In this study, the crash outcomes were divided into three: major injury (fatal or incapacitating injury), minor injury (non-incapacitating or possible injury), no injury. For ease of comparison, the crash data were divided into three: first 10 weeks of the year (before shelter-in-place order), week 11–14 (shelter-in-place period), and week 15–53 (after shelter-in-place period). It should be noted that due to the differences in the duration and traffic conditions of each period, the likelihood of crash occurrence is different across the periods. Table 1 shows the distribution of crashes by period and injury outcomes.

Table 1.
Distribution of crashes by injury outcomes.
Table 1 revealed that while 2.6% of the crashes that occurred before the shelter-in-place order resulted in major injury outcome, 3.7% and 3.8% of the crashes that occurred during the shelter-in-place period and after the shelter-in-place, respectively, recorded major injury. Similarly, a higher proportion of the shelter-in-place period crashes resulted in minor injury compared to the pre-shelter-in-place period.
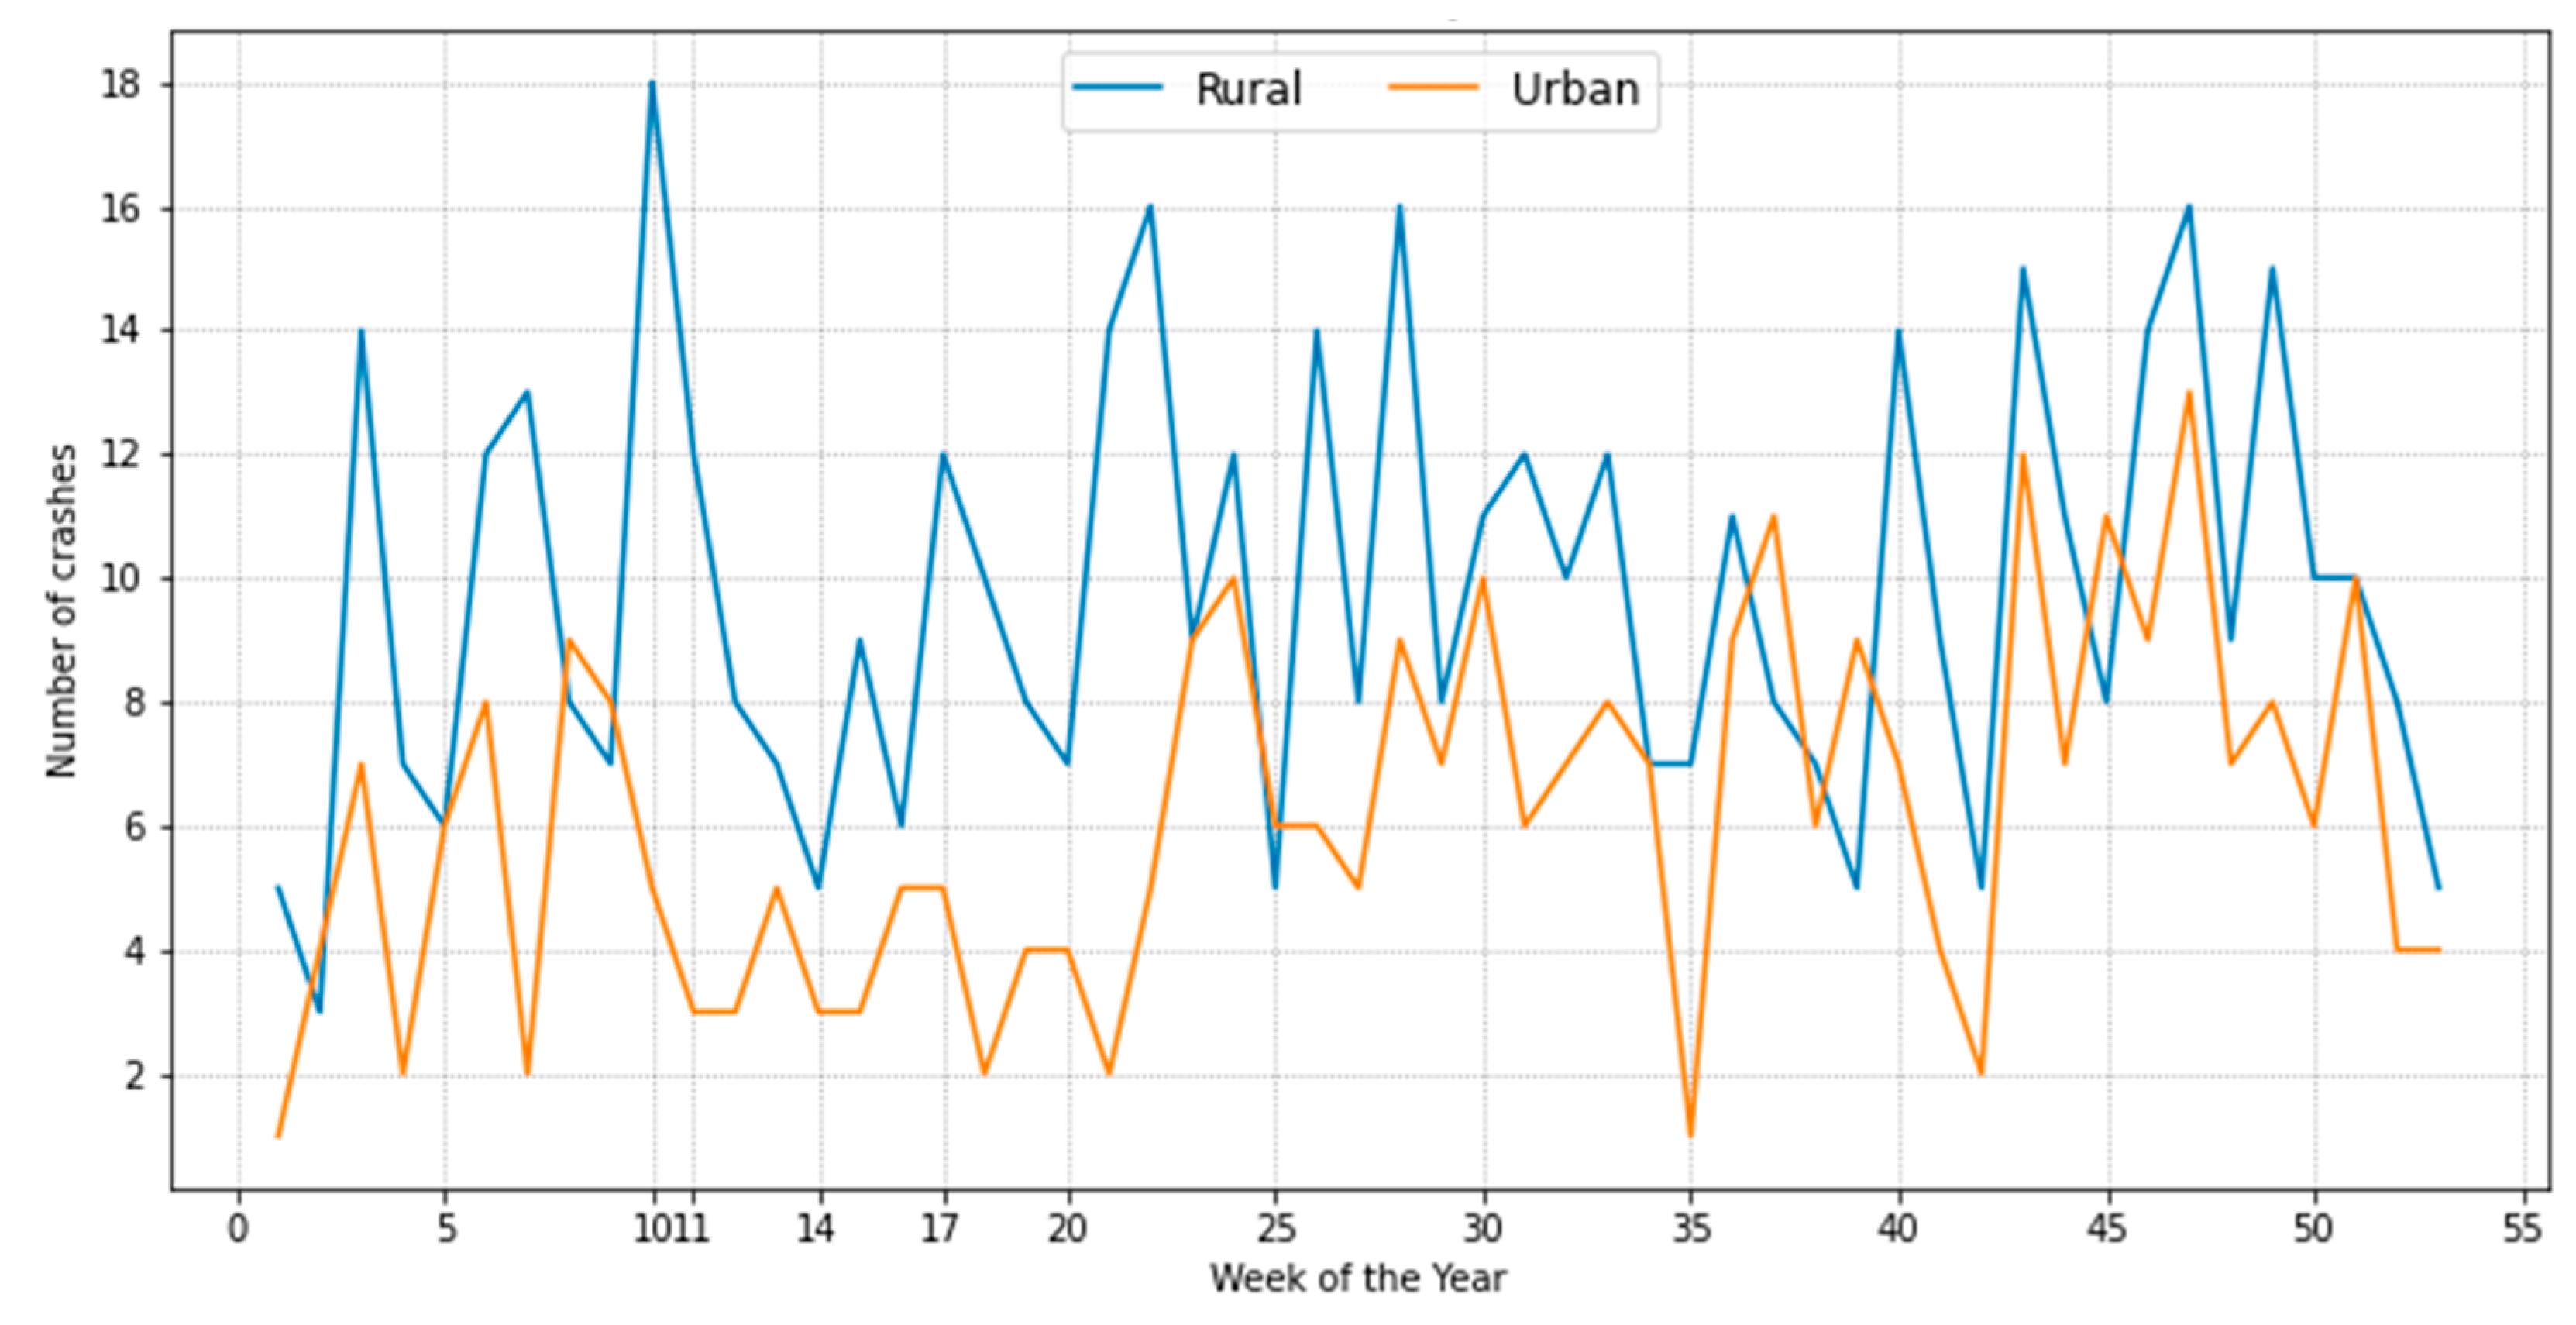
Figure 1 and Figure 2 present the distribution of total crashes and fatal crashes by location, respectively. Figure 1 shows that the shelter-in-place period recorded a significant decrease in the number of total crashes particularly in the urban areas and Figure 2 reveals that most of the fatal crashes occurred in rural areas. The trend seen in Figure 1 reveals that the total number of crashes reduced significantly after week 10 and then began to increase after week 14—recall that shelter-in-place began in week 11. Interestingly, week 10 (the week before the statewide shelter-in-place order was issued) recorded the highest number of crashes in the year and the highest number of fatal crashes in rural areas in the year. The pattern of fatal crashes shown in Figure 2 indicates that there was a significant decrease in fatal crashes between week 10 and week 14, but the trend has been similar for both rural and urban areas for the greater part of the year.
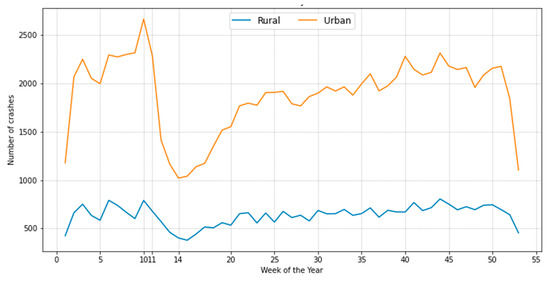
Figure 1.
Distribution of total crashes by week of the year.
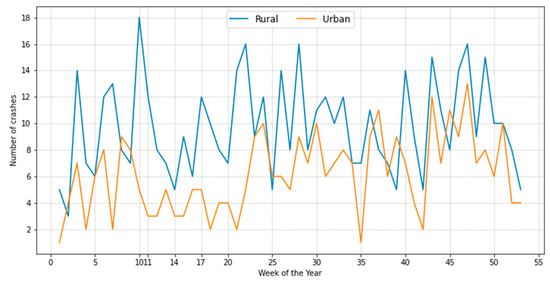
Figure 2.
Distribution of fatal crashes by week of the year.
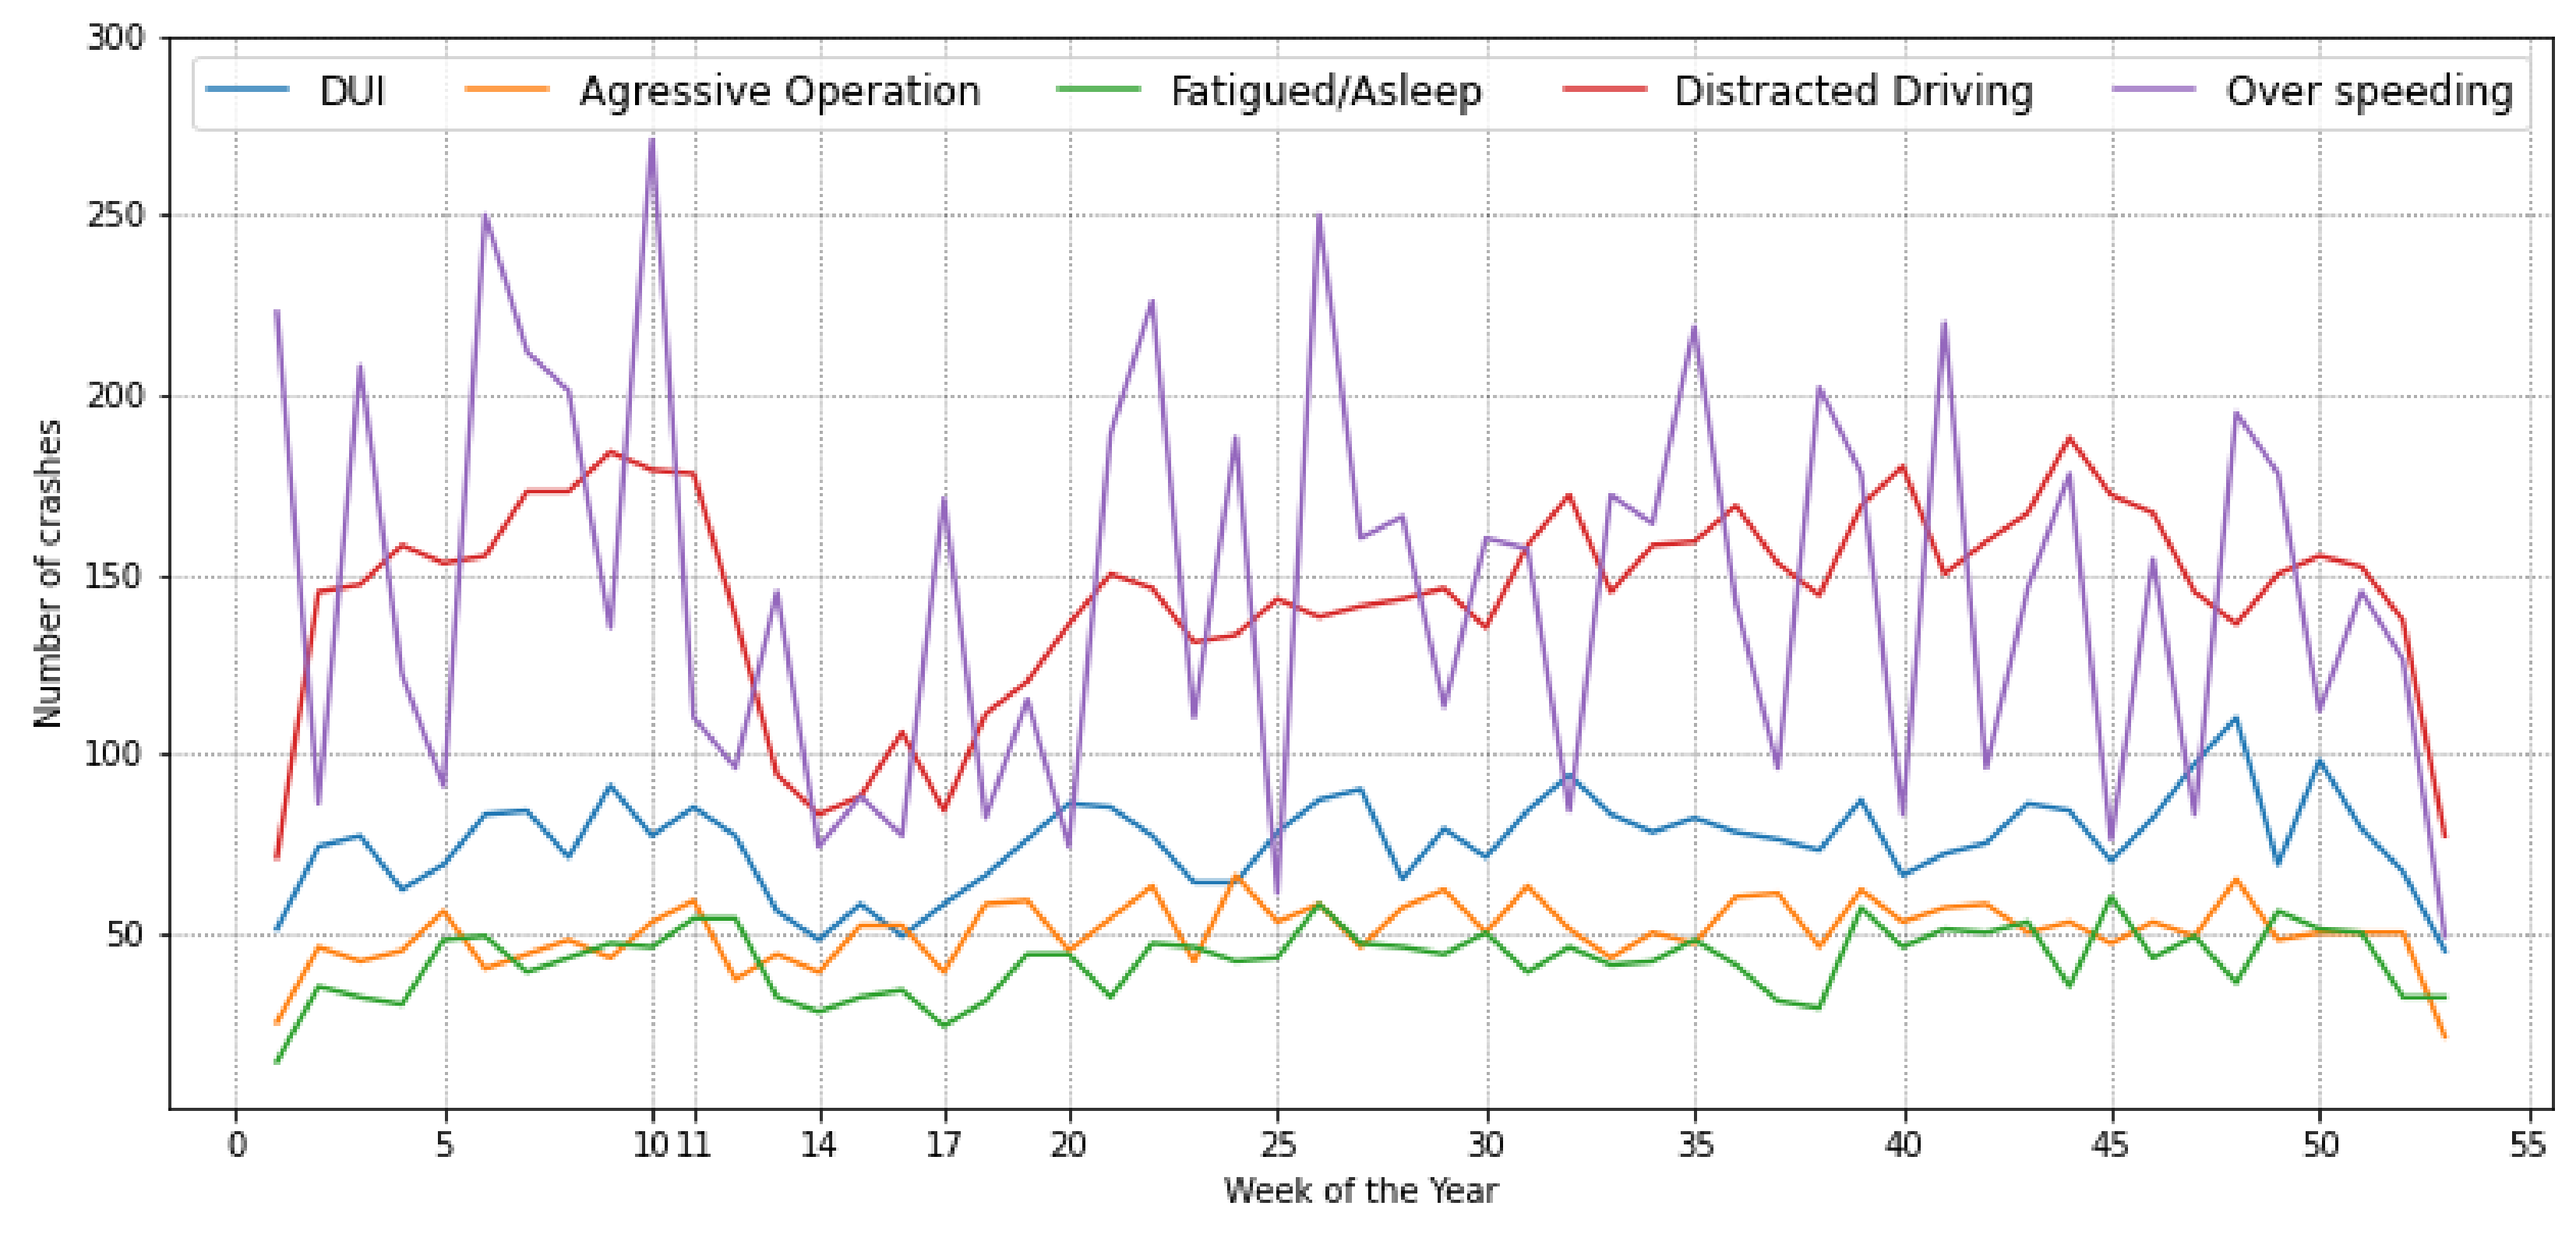
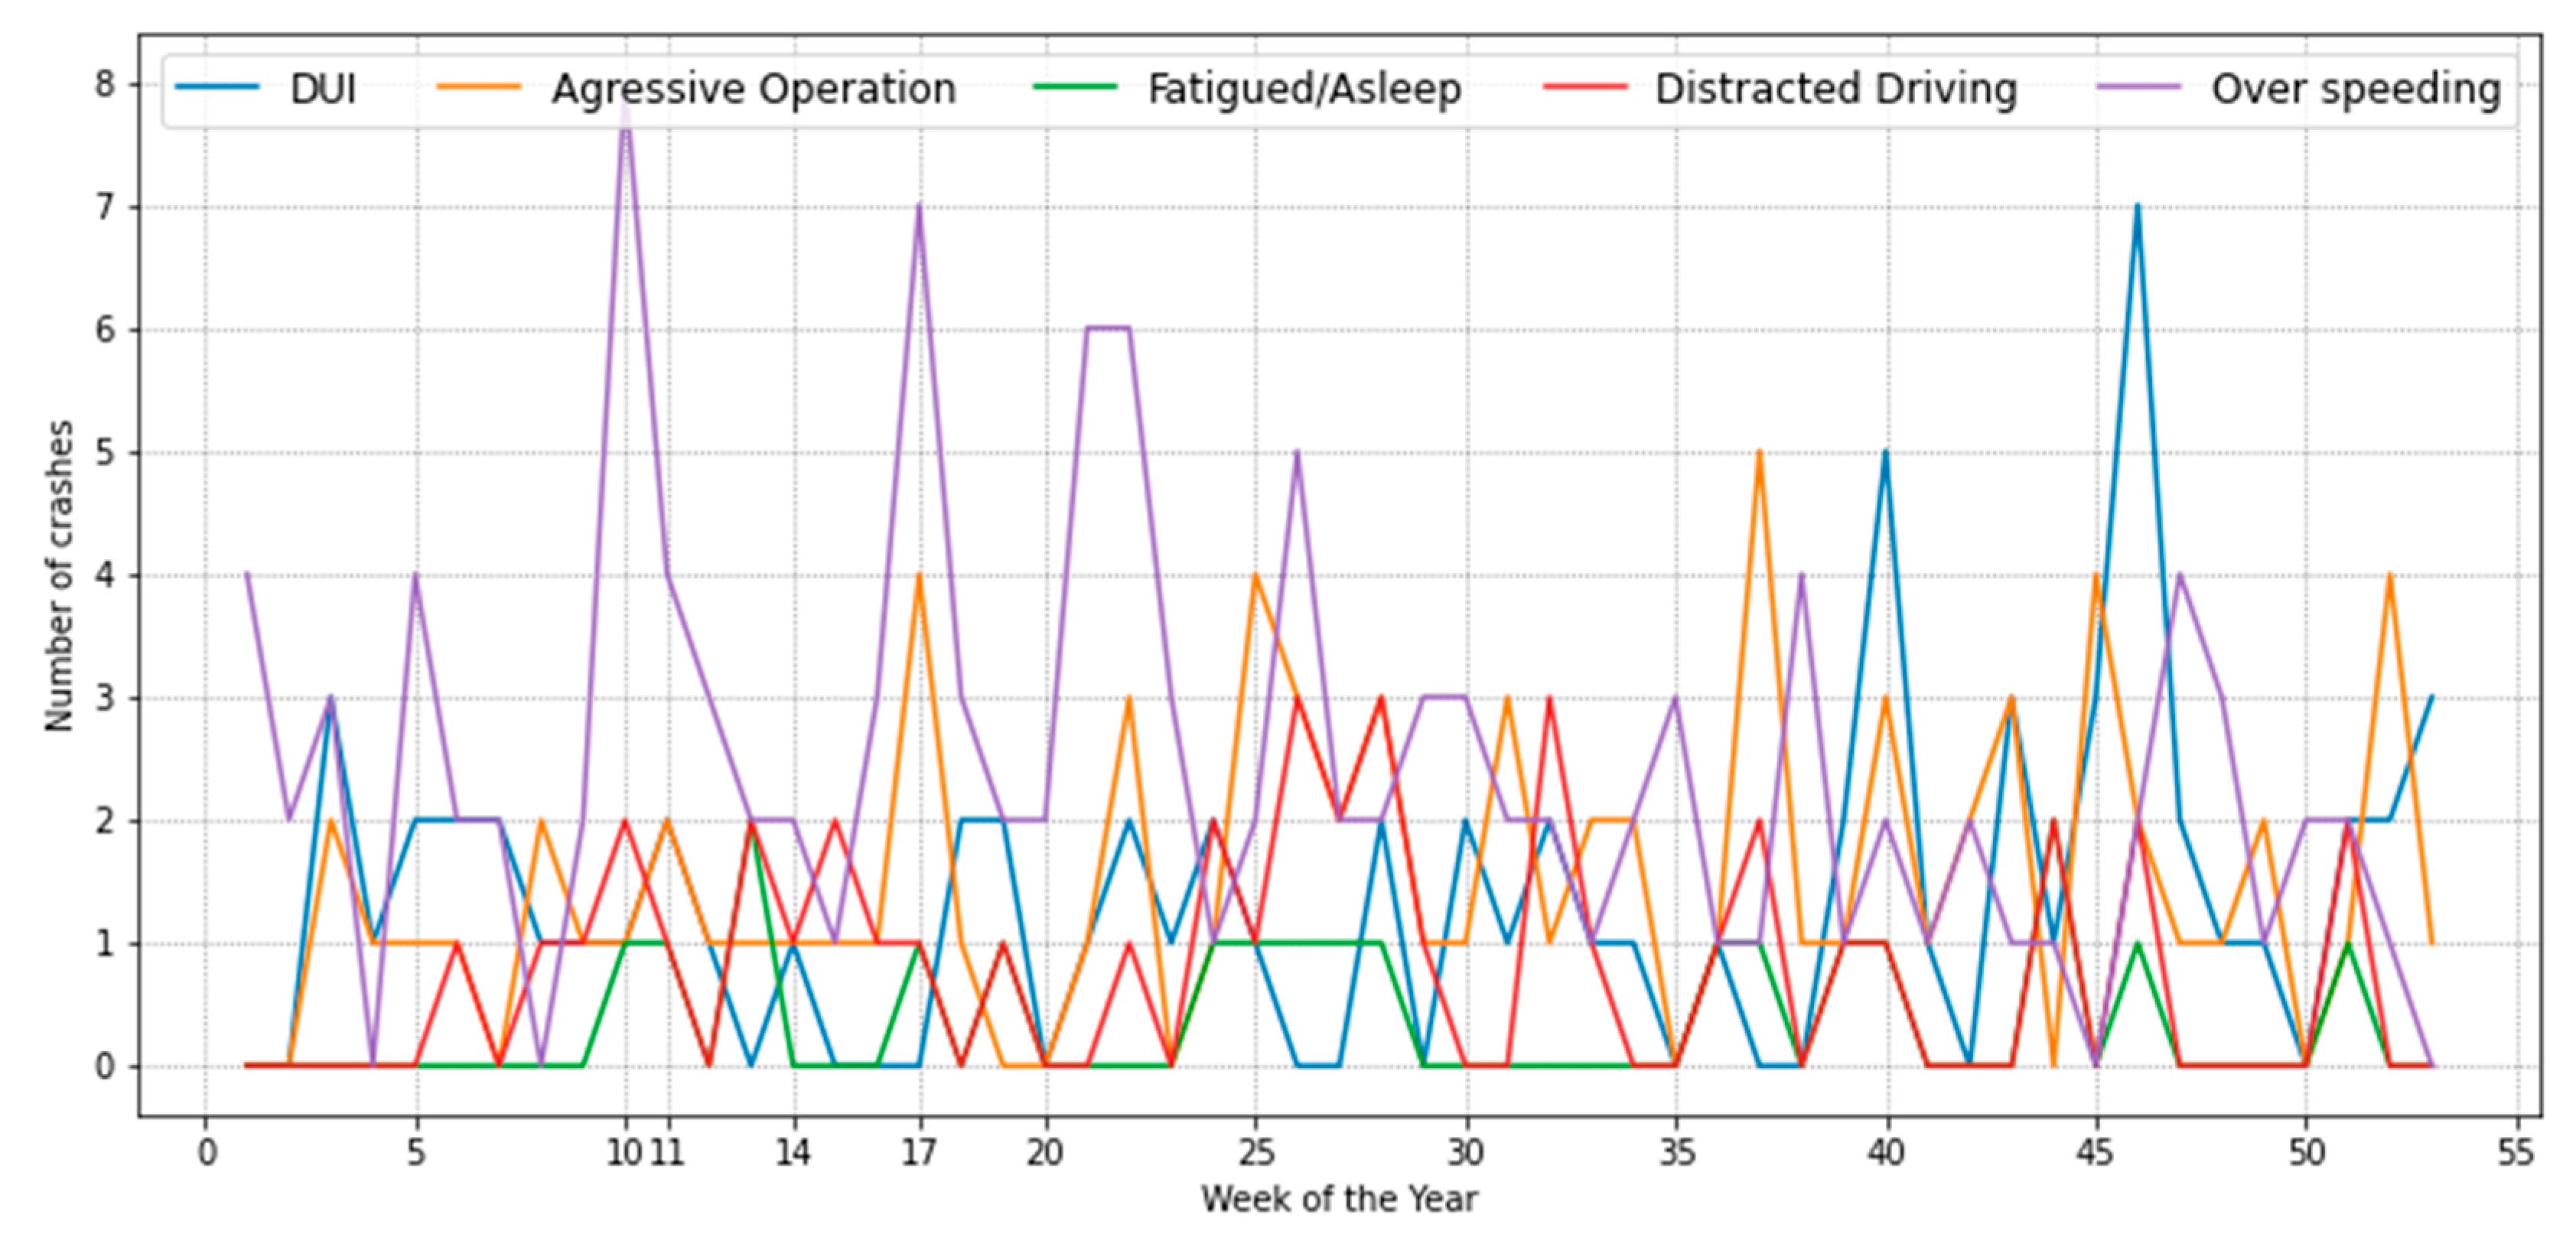
Figure 3 and Figure 4 show the distributions of total crashes and fatal crashes throughout the calendar year 2020 by some of the major primary contributing factors. Speeding was identified as the leading contributing factor responsible for all crashes and the highest number of fatal crashes. The peak of fatal crashes due to speeding was recorded in the week before the shelter-in-place order went into effect. Distracted driving recorded a high number of crashes, but the fatal crashes were minimal even in the week preceding the shelter-in-place order. The figures indicate that the shelter-in-place order had very minimal effect on crashes and fatalities resulting from speeding, driving under the influence of alcohol or drug (DUI), fatigue driving, and distracted driving. Aggressive driving-related fatal crashes were however observed to increase after the shelter-in-place.

Figure 3.
Distribution of total crashes by some primary contributing factors.
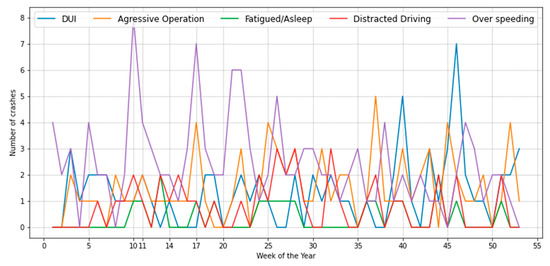
Figure 4.
Distribution of fatal crashes by primary contributing factors.
Table 2 presents the descriptive statistics of the variables found to be significant during the development of the models. The descriptive statistics reveal that by proportion, a higher proportion of crashes that occurred between 6 p.m. and 6 a.m. and those that occurred in residential areas happened during the shelter-in-place period while shopping area crashes, manufacturing/industrial area crashes, rear-end collisions, and crashes involving female drivers occurred mostly before the shelter-in-place period. A higher proportion of speed-related crashes occurred before the shelter-in-place order while the proportion of DUI, aggressive driving, distracted driving, failure to use a seatbelt, and fatigue driving-related crashes occurred more during the shelter-in-place period. The highest proportion of motorcycle crashes also occurred during the shelter-in-place period while more sideswipe crashes and those involving drivers with invalid licenses occurred after the shelter-in-place. The proportion of unemployed driver crashes was also found to be highest during the shelter-in-place.
Table 2.
Descriptive statistics of variables available for model estimation.
2.2. Method
Road crash occurrence is complex and so are the factors associated with resulting injury outcomes. In crash injury severity analysis, unobserved heterogeneity (see [23] for a detailed discussion) may arise due to limitations in the amount and quality of information gathered at the crash scene. It is also possible that the information gathered may only be moderating factors for other important crash contributing factors. Failing to account for this in crash severity analysis can lead to biased parameter estimates such that countermeasure development may be premised on the wrong inferences. This is a primary limitation that can affect the accuracy of results from traditional statistical analyses of crash data and may eventually affect the accuracy of decisions made from such crash models. Many different statistical methods have previously been used to address this inherent problem in crash data and analysis. For instance, some recent studies have used various forms of random parameters (mixed logit) models [24,25,26,27] and latent class (finite mixture) models [28,29,30] to capture unobserved heterogeneity in data analysis by allowing parameters to differ across crash observations and segments of the data [23,31]. The major difference between the two approaches is that, whereas the random parameters approach uses continuous mixing distributions (for example, normal, lognormal, uniform, triangular, etc.) to capture unobserved heterogeneity, latent class identifies unobserved classes using discrete distribution in which unobserved heterogeneity is captured by the membership of variables in distinct classes [32]. Other methods such as Markov switching models [33], Markov switching with random parameters [34], and bivariate/multivariate models with random parameters [35,36] have also been used to account for unobserved heterogeneity in crash injury severity analysis.
This study used random parameters logit with heterogeneity in mean and variance models [25,26,37,38] to account for unobserved heterogeneity across the crash observations. This method allows the analyst the freedom to test various probability distributions and decide on the best distribution for the random parameters that may be found. Three discrete crash severity categories are considered in this study: major injury, minor injury, and no injury. To obtain an estimable model, we define a crash severity function that determines the probability that crash will result in injury severity as [39]:
where is a vector of parameter estimates to be determined for crash outcome (major injury, minor injury, or no injury), is a vector of explanatory variables that affect the likelihood of injury outcome in crash and is the stochastic error term. If is assumed to follow an independent and identically distributed extreme value Type I distribution [39], and parameter variations across observations are allowed for by introducing a mixing distribution [40] the resulting mixed logit model is:
where is the density of and corresponding to a vector of parameters of the density function (mean and variance), and is the probability of crash severity in crash conditional on . With this formulation, can now account for observation-specific variations in the effect of on crash outcome probabilities, with used to determine . The mixed-logit probabilities then become the weighted average for different values of across observations where some elements of may be fixed across observations and some may vary across observations (known as random parameters). Due to the difficulty in estimating the parameters of the mixed logit model, the model is often estimated by simulated maximum likelihood estimation with the logit probabilities (shown in Equation (3)) approximated by drawing values of from for given values of , using Halton draws [41,42,43]. Halton draws has previously been shown to do a better job than random draws. Heterogeneity in means and variances of random parameters is accounted for by allowing to vary across crashes as [44]:
where is the mean parameter estimate across all crashes, is a vector of attributes that capture heterogeneity in the mean, is a corresponding vector of estimable parameters, is a vector of attributes that capture heterogeneity in standard deviation with corresponding parameter vector and a disturbance term , and and may contain crash attributes or other sources of heterogeneity that may not be captured by variables recorded in the crash database.
Marginal effects were further estimated to assess the effect of the crash-contributing factors on the likelihood of crash severity outcomes [45]. In this study, all the explanatory variables are coded as indicator variables. As such, the marginal effects are calculated as:
The marginal effect for the indicator variable, is the difference in probabilities when changes from 0 to 1 while all other variables remain constant. For variables with random parameter across all observations, only the estimated mean value of the coefficients is used in the utility function to calculate the marginal effects. The marginal effect for each parameter is calculated by averaging the marginal effects overall crash observations.
3. Results
Table 3, Table 4 and Table 5 present the injury severity model estimation results for all the three scenarios considered and Table 6 presents a comparative summary of how the variables influence the likelihood of the injury outcomes. The random parameters multinomial logit with heterogeneity in the mean and variance models were estimated by simulated maximum likelihood with 500 Halton draws [40]. The normal probability density function was used for random parameters [46,47]. Transferability tests were conducted to investigate whether separate models were needed to understand the effects of various crash factors on crash outcomes across the year. For assessing parameter transferability, the test statistic used is:
where is the log-likelihood at convergence of the model estimated with all the data, is the log-likelihood at convergence of the model using subset k data (before, during shelter-in-place, and after), and K is the total number of data subsets used. The statistic is chi-squared distributed with degrees of freedom equal to the sum of the number of estimated parameters in all subset models minus the number of estimated parameters in the full-sample model. The resulting statistic indicates whether the model for the subset data is significantly different than the model for the full-sample data. Log-likelihood test was further performed to determine whether the subset models have parameters that are statistically different. The test statistic used is given by:
where is the log-likelihood at convergence of the model estimated with all the data and is the log-likelihood at convergence of the model using subset k data. The results obtained justify the development of three separate models for the time periods at 95% confidence level.
Table 3.
Severity model results and averaged marginal effects before shelter-in-place period.
Table 4.
Severity model results and averaged marginal effects during shelter-in-place period.
Table 5.
Severity model results and averaged marginal effects after shelter-in-place period.
Table 6.
Comparison of marginal effects of significant variables across the three periods.
The intersection variable was found to be random in all three models with the employed driver and failed to yield right of way indicator variables producing significant heterogeneity in the mean of the random parameter and the Caucasian and Black and African American driver indicator variables producing heterogeneity in the variance of the random parameter in the before shelter-in-place order model. The random intersection variable for the before shelter-in-place model defined for the minor injury outcome function had a mean of −20.32 and standard deviation of 13.81, indicating that for 7.1% of intersection crashes that occurred before the shelter-in-place order, there was a higher probability of minor injury and for the majority of intersection crashes (92.9%), the probability of minor injury was low. For the intersection random variable, the employed drivers had a decrease in their mean making minor injury less likely (relative to drivers who were not identified as being employed) and failed to yield right of way crashes had an increase in their mean making minor injury more likely. Concerning heterogeneity in the variance of the random parameter, Caucasian drivers and Black/African American drivers were found to increase the variance of the intersection indicator variable. The marginal effects show that the intersection indicator increased the likelihood of minor injury by 0.0099 and decreased the likelihood of major and no injury outcomes by 0.0002 and 0.0097, respectively. The intersection indicator variable also produced random parameter that is normally distributed in the shelter-in-place period model with mean of −3.36 and variance of 3.60. This implies that for 17.5% of the observations, this variable increases the likelihood of minor injuries (decreasing the likelihood of no injuries and major injuries) and for 82.5% of the observation, this variable decreased the likelihood of minor injuries. For the intersection random variable in the shelter-in-place period model, failure to yield right of way crashes increased their mean making minor injury more likely and crashes that occurred between midday and 6 p.m. had a decrease in their mean making minor injury less likely (relative to other times of the day). The employed driver indicator variable was found to decrease the variance of the intersection indicator variable in the shelter-in-place period model. The intersection variable in the shelter-in-place period model increased the probability of minor injury by 0.015. Finally, the intersection indicator variable in the after shelter-in-place period model was also found to be random and normally distributed with mean of −3.58 and variance of 3.69. This indicates that for 16.6% of the observations, this variable increases the likelihood of minor injuries (decreasing the likelihood of no injuries and major injuries) and for 83.4% of the observation, this variable decreased the likelihood of minor injuries. The heterogeneity in the mean and variance variables in the after shelter-in-place models had similar effects on injury outcomes as they did in the shelter-in-place period model. The marginal effects for the after shelter-in-place period shows that the intersection variable decreased the probability of major injury by 0.0006 and increased the probability of minor injury by 0.019.
To better understand the variations in the association among various crash factors and injury outcomes across the three periods, Table 6 was developed to compare the marginal effects. From Table 6, it can be observed that the effects of some of the variables did not vary across the year. An upward arrow indicates that the variable increases the probability of that crash severity and a downward arrow indicates that the variable decreases the probability of the crash severity. For instance, it was found that crashes that occurred between 6 p.m. and midnight and those that occurred on weekends were more likely to record major injury throughout the year. This means that the COVID-19 pandemic did not have any impact on the outcome of these crashes. For residential area crashes, those that occurred before the announcement of the statewide shelter-in-place order were more likely to lead to major injury but the chance of recording major injury in residential areas decreased during the immediate weeks all through to the end of the year. Similarly, crashes that occurred in the open country had higher probability to result in major injury before the shelter-in-place order, but those crashes were less likely to result in injury after the shelter-in-place order. Rural areas were more associated with major injury throughout the year. This finding is consistent with annual safety performance in the state, indicating that although traffic volumes decreased significantly during the immediate weeks after the shelter-in-place order, rural areas continued to record major injury crashes. Interestingly, manufacturing/industrial area crashes and interstate highway crashes that occurred after the shelter-in-place order were more likely to record major injury. Whereas head-on collisions were generally more likely to lead to major injury throughout the year, single-vehicle crashes and side impact collisions had increased probability to result in major injury after the shelter-in-place order. Rear-end collisions were also found to have higher likelihood to lead to minor injury before the shelter-in-place order but lower probability to record any other form of injury after the shelter-in-place order. Female drivers and drivers less than 25 years were less likely to be involved in major injury crashes. Crashes involving drivers aged between 20 and 60 years, on the other hand, were more likely to result in major injury before the shelter-in-place order but not after shelter-in-place. While this finding in itself may not be very informative, an in-depth view of the other human-centered variables will help to throw more light on the risky driver population responsible for the major injury crashes. For instance, while unemployed drivers and drivers with no or invalid license were more likely to be involved in major injury crashes in general throughout the year, unemployed drivers were less likely to be involved in major injury crashes during the immediate weeks after the shelter-in-place order. Additionally, whereas Black and African American drivers were less likely to be involved in major injury crashes after the shelter-in-place order, Caucasian drivers were more likely to be involved in major injury crashes. Motorcycle-involved crashes had higher chance of resulting in major injury regardless of the period of the year. Similarly, crashes involving SUVs were also more likely to record major injury and those that involved CMVs had higher probability to result in major injury before and during the immediate weeks of the shelter-in-place order. Speeding crashes, fatigue-related crashes, and crashes involving the non-use of a seatbelt were significantly associated with major injury outcome throughout the year while aggressive driving crashes and DUI crashes were only more likely to result in major injury outcome before the shelter-in-place order.
4. Discussion
The rate of road crashes significantly correlates with traffic characteristics such as traffic volume and vehicle miles traveled (VMT). Indeed, there is enough evidence that an increase in VMT leads to an increase in road traffic crashes. However, the observed increase in fatalities recorded in many regions of the world during the COVID-19 pandemic has opened the door to re-examine the factors responsible for crashes and crash outcomes, beyond traffic characteristics, considering that the shelter-in-place order that had been issued across the world during the COVID-19 global pandemic had caused a decline in travel activities. It may therefore be argued that while the COVID-19 shelter-in-place order had led to a reduction in overall travel activities, with road, vehicle, and environmental factors remaining fairly constant, driver-centered characteristics have been the major drivers of crashes and crash outcomes during the pandemic. This observation may perhaps be due to the reduced traffic law enforcement. Indeed, [6] found personal factors such as propensity for risky behaviors as a potential factor that affected the road safety performance of regions during the pandemic. Additionally, [10] observed that the pandemic has been characterized by increased alcohol sales and use as a response to increase in stress, anxiety, and depression among certain population groups (e.g., [12,48]. The reduced law enforcement has further allowed other risky driving behaviors such as failure to use a seatbelt and aggressive driving during the shelter-in-place, as has been observed in this study (see Table 2). In fact, while the propensity of certain road user groups to engage in risky driving behaviors has been linked to many factors such as age [49,50], gender [51,52], socioeconomic status [53], personality [54,55], type of vehicle being driven [56], and even regional culture and systems [57,58,59], the shelter-in-place order had little to no effect on the driving behaviors of these risky drivers. The findings of this study further detail some other nuanced crash factors that may be associated with risky driving behaviors in a way that may help in identifying appropriate and effective countermeasures. For instance, it was found that a higher proportion of crashes associated with risky driving behaviors such as DUI, failure to use a seatbelt, distracted driving, and drowsy driving occurred during the shelter-in-place while speed-related crashes occurred more frequently before the shelter-in-place order. Additionally, a higher proportion of rural area crashes occurred during the shelter-in-place period, and a higher proportion of shopping area crashes occurred before the shelter-in-place. Additionally, open country and residential areas accounted for higher percentages of shelter-in-place period crashes. Motorcyclists, unemployed, and Black/African American drivers were involved in a higher proportion of crashes during the shelter-in-place period. The model estimation results also revealed that crashes that occurred in rural areas, between 6 p.m. and midnight and those that occurred on weekends were more likely to record major injury throughout the year (i.e., even during the shelter-in-place period). Female drivers and drivers younger than 25 years old were also found to have lower probability of being involved in major injury crashes. Furthermore, whereas Black/African American drivers were less likely to be involved in major injury crashes after the shelter-in-place order, Caucasian drivers were more likely to be involved in major injury crashes.
It has previously been observed that risky drivers often engage in multiple traffic violations [60,61,62,63]. For instance, ref. [64] found that a higher proportion of alcohol impaired drivers were less likely to use a seatbelt and more likely to speed. They also found that a large proportion of drivers who engage in drunk or drugged driving are repeat offenders. Findings from this study showed that speeding crashes, fatigue-related crashes, and crashes involving the non-use of a seatbelt were significantly associated with major injury outcome throughout the year, meaning that the shelter-in-place order did not impact the driving behaviors of risky drivers.
Although traffic volumes and VMT had significantly dropped during the shelter-in-place period, there has been an increase in major injury crashes compared to the period before the shelter-in-place order, with speeding, DUI, and weekends accounting for a significant proportion of these crashes. These findings provide very important data-driven evidence for road safety improvements during extreme events that may require statewide shelter-in-place, as has been the case for the COVID-19 pandemic. Traffic management around shopping areas and other areas that have been identified to experience increased traffic provide opportunities for road safety stakeholders to reduce the occurrence of crashes in the weeks leading to an announcement of any future statewide or local shelter-in-place. Week 10 (the immediate week preceding the shelter-in-place order) recorded the highest number of weekly crashes and major injury outcomes throughout the year. It would also be useful to identify and target road safety messages to road users that are known to exhibit risky behaviors. This could involve media campaigns and public education through which the majority of these road users could be reached efficiently and effectively. Additionally, traffic enforcement could be intensified during weekends and between 6 p.m. and 6 a.m. to reduce risky driving behaviors. Considering that law enforcement efforts are likely to be impacted during future shelter-in-place orders, the adoption of technology-driven traffic law enforcement strategies across the state such as red light running and automated speed enforcement cameras, particularly at high-risk locations, would ensure continuous enforcement in times when it would be difficult to deploy law enforcement personnel.
Although the findings of this study are interesting and may be applicable to many regions with characteristics similar to Alabama, it should be noted that these findings and recommendations are specific to the state of Alabama. As such, a similar study should be carried out in these regions to understand how the shelter-in-place order has affected traffic safety. It should also be noted that the results of the study may be bias towards the injury outcome categories as evidence points to a high likelihood of underreporting of non-injury crashes.
5. Conclusions
The shelter-in-place order that has been issued as part of measures to reduce the spread of the coronavirus has led to a reduction in travel activities. However, multiple states have reported that despite the low vehicle miles traveled over the shelter-in-place period, traffic fatalities had increased. This observation has been attributed to risky driving behaviors as traffic law enforcement efforts were negatively impacted by the COVID-19 pandemic. This study was carried out to understand the crash factors that influenced crash outcomes and how their effects varied before, during, and after the shelter-in-place order. The study used crash data obtained from the Critical Analysis Reporting Environment (CARE) for the state of Alabama for the year 2020. The data were divided into pre-shelter-in-place period, shelter-in-place, and post-shelter-in-place order. Preliminary analysis of the data revealed that the highest weekly crash frequency occurred in the immediate week before the shelter-in-place order, and a higher proportion of crashes that occurred between 6 p.m. and 6 a.m. and those that occurred in residential areas happened during the shelter-in-place period while shopping area crashes, manufacturing/industrial area crashes, rear-end collisions, and crashes involving female drivers occurred mostly before the shelter-in-place period.
Three injury severity models for the periods were developed using random parameters logit with heterogeneity in means and variances. Marginal effects were estimated and compared to understand the effects of the crash factors on crash outcomes. The results showed that major injury crashes occurred mainly in rural areas and occurred due to speeding, fatigue driving, and failure to use a seatbelt. The effects of these factors on crash outcome did not vary across the year, indicating that the shelter-in-place order did not impact the driving behaviors and styles of the driver population that got into major injury crashes. The results further revealed that the effects of some crash factors varied across the periods. For instance, it was revealed that crashes that occurred on interstates were less likely to record major injuries before the shelter-in-place, but the probability of major injury crash outcome was higher during and after the shelter-in-place order. Similarly, single-vehicle crashes and side-impact collisions became more dangerous after the shelter-in-place order was issued.
The findings of the study provide a deeper, data-driven understanding of how driving behaviors and associated crash outcomes may be affected by extreme events such as the COVID-19 shelter-in-place. Lessons learned from the COVID-19 pandemic should inform how and when future shelter-in-place should be announced, considering the potential road safety implications that characterize panic shopping and travel decisions. Furthermore, the pandemic has provided enough justification for investment in technologically driven traffic enforcement strategies as these are less likely to be adversely affected by future pandemics.
Author Contributions
E.K.A.: Conceptualization, Methodology, Writing—Original draft preparation. S.O.: Data curation, Writing—Original draft preparation, Reviewing and Editing. P.P.: Reviewing and Editing. S.J.: Writing—Reviewing and Editing. All authors have read and agreed to the published version of the manuscript.
Funding
This research received no external funding.
Institutional Review Board Statement
Not applicable.
Informed Consent Statement
Not applicable.
Data Availability Statement
The data used for this study is available upon reasonable request.
Acknowledgments
The authors would like to thank the Center for Advanced Public Safety at the University of Alabama for providing the crash data used in this study. The authors also thank the Alabama Transportation Institute for supporting this research.
Conflicts of Interest
The authors declare no conflict of interest.
References
- Sandford Alasdair. Coronavirus: Half of Humanity Now on Lockdown as 90 Countries Call for Confinement. 2020. Available online: https://www.euronews.com/2020/04/02/coronavirus-in-europe-spain-s-death-toll-hits-10-000-after-record-950-new-deaths-in-24-hou (accessed on 24 August 2021).
- City News. OPP Begin Road Safety Blitz as Fatal Collisions on the Rise; CityNews Everywhere: Toronto, ON, Canada, 2020. [Google Scholar]
- BBC. Coronavirus: Motorist Clocked Doing 150 mph on Deserted. 2020. Available online: https://www.bbc.com/news/uk-england-suffolk-52395309 (accessed on 1 November 2021).
- Australian Road Safety Foundation. COVID-19 Complacency Driving Risk in Dangerous Road Behaviour. 2020. Available online: https://arsf.com.au/covid-19-complacency-driving-rise-in-dangerous-road-behaviour/ (accessed on 1 November 2021).
- National Highway Traffic Safety Administration. 2020 Fatality Data Show Increased Traffic Fatalities during Pandemic. 2021. Available online: https://www.nhtsa.gov/press-releases/2020-fatality-data-show-increased-traffic-fatalities-during-pandemic (accessed on 1 November 2021).
- Vingilis, E.; Beirness, D.; Boase, P.; Byrne, P.; Johnson, J.; Jonah, B.; Mann, R.E.; Rapoport, M.J.; Seeley, J.; Wickens, C.M.; et al. Coronavirus disease 2019: What could be the effects on Road safety? Accid. Anal. Prev. 2020, 144, 105687. [Google Scholar] [CrossRef] [PubMed]
- Carter, D. Effects of COVID-19 Shutdown on Crashes and Travel in NC. In Proceedings of the Transportation Research Board (TRB) Webinar, Online. 13 May 2020. [Google Scholar]
- Lockwood, M.; Lahiri, S.; Babiceanu, S. Traffic Trends and Safety in a COVID-19 World. What Is Happening in Virginia. In Proceedings of the Transportation Research Board (TRB) Webinar, Online. 2 June 2020. [Google Scholar]
- Brown, D. Available online: http://www.safehomealabama.gov/caps-special-studies/ (accessed on 10 December 2020).
- Benzie, R. LCBO Reporting Its Sales Have Gone up during the COVID-19 Crisis. Toronto Star. 2020. Available online: https://www.thestar.com/politics/provincial/2020/04/23/lcbo-reporting-its-sales-have-gone-up-during-the-covid-19-crisis.html (accessed on 10 December 2020).
- Sharpe, K. Alcohol Sales on the Rise during COVID-19 Pandemic. KITCHENER News. 2020. Available online: https://kitchener.ctvnews.ca/alcohol-sales-on-the-rise-during-covid-19-pandemic-1.4920002 (accessed on 10 December 2020).
- Liu, N.; Zhang, F.; Wei, C.; Jia, Y.; Shang, Z.; Sun, L.; Wu, L.; Sun, Z.; Zhou, Y.; Wang, Y.; et al. Prevalence and predictors of PTSS during COVID-19 outbreak in China hardest-hit areas: Gender differences matter. Psychiatry Res. 2020, 287, 112921. [Google Scholar] [CrossRef] [PubMed]
- Park, C.L.; Russell, B.S.; Fendrich, M.; Finkelstein-Fox, L.; Hutchison, M.; Becker, J. Americans’ COVID-19 Stress, Coping, and Adherence to CDC Guidelines. J. Gen. Intern. Med. 2020, 35, 2296–2303. [Google Scholar] [CrossRef] [PubMed]
- Yıldırım, M.; Solmaz, F. COVID-19 burnout, COVID-19 stress and resilience: Initial psychometric properties of COVID-19 Burnout Scale. Death Stud. 2022, 46, 979–986. [Google Scholar] [CrossRef]
- Brown, S.M.; Doom, J.R.; Lechuga-Peña, S.; Watamura, S.E.; Koppels, T. Stress and parenting during the global COVID-19 pandemic. Child Abus. Negl. 2020, 110, 104699. [Google Scholar] [CrossRef]
- Meyer, M.W. COVID Lockdowns, Social Distancing, and Fatal Car Crashes: More Deaths on Hobbesian Highways? Camb. J. Evid.-Based Polic. 2020, 4, 238–259. [Google Scholar] [CrossRef]
- He, M.M. Driving through the Great Recession: Why does motor vehicle fatality decrease when the economy slows down? Soc. Sci. Med. 2016, 155, 1–11. [Google Scholar] [CrossRef] [Green Version]
- Sedain, B.; Pant, P.R. Road traffic injuries in Nepal during COVID-19 lockdown. F1000Research 2021, 9, 1209. [Google Scholar] [CrossRef]
- Katrakazas, C.; Michelaraki, E.; Sekadakis, M.; Yannis, G. A descriptive analysis of the effect of the COVID-19 pandemic on driving behavior and road safety. Transp. Res. Interdiscip. Perspect. 2020, 7, 100186. [Google Scholar] [CrossRef]
- Saladié, Ò.; Bustamante, E.; Gutiérrez, A. COVID-19 lockdown and reduction of traffic accidents in Tarragona province, Spain. Transp. Res. Interdiscip. Perspect. 2020, 8, 100218. [Google Scholar] [CrossRef]
- Shilling, F.; Waetjen, D. Special Report: Impact of COVID-19 on California Traffic Accidents. 2020. Available online: https://roadecology.ucdavis.edu/files/content/projects/COVID_CHIPs_Impacts_updated.pdf (accessed on 6 August 2021).
- Occupational Health and Safety. Available online: https://ohsonline.com/articles/2020/05/22/motor-vehicle-fatality-rates-up-14-percent-in-march-despite-covid19.aspx (accessed on 10 December 2020).
- Mannering, F.L.; Shankar, V.; Bhat, C.R. Unobserved Heterogeneity and the Statistical Analysis of Highway Accident Data. Anal. Methods Accid. Res. 2016, 11, 1–16. [Google Scholar] [CrossRef]
- Waseem, M.; Ahmed, A.; Saeed, T.U. Factors affecting motorcyclists’ injury severities: An empirical assessment using random parameters logit model with heterogeneity in means and variances. Accid. Anal. Prev. 2019, 123, 12–19. [Google Scholar] [CrossRef]
- Adanu, E.K.; Agyemang, W.; Islam, R.; Jones, S. A comprehensive analysis of factors that influence interstate highway crash severity in Alabama. J. Transp. Saf. Secur. 2021. [Google Scholar] [CrossRef]
- Damsere-Derry, J.; Adanu, E.K.; Ojo, T.K.; Sam, E.F. Injury-severity analysis of intercity bus crashes in Ghana: A random parameters multinomial logit with heterogeneity in means and variances approach. Accid. Anal. Prev. 2021, 160, 106323. [Google Scholar] [CrossRef]
- Islam, M.; Mannering, F. A temporal analysis of driver-injury severities in crashes involving aggressive and non-aggressive driving. Anal. Methods Accid. Res. 2020, 27, 100128. [Google Scholar] [CrossRef]
- Yasmin, S.; Eluru, N.; Bhat, C.; Tay, R. A latent segmentation based generalized ordered logit model to examine factors influencing driver injury severity. Anal. Methods Accid. Res. 2014, 1, 23–38. [Google Scholar] [CrossRef]
- Lidbe, A.; Adanu, E.K.; Tedla, E.; Jones, S. Role of Passengers in Single-Vehicle Drunk-Driving Crashes: An Injury-Severity Analysis. Safety 2020, 6, 30. [Google Scholar] [CrossRef]
- Shaheed, M.S.; Gkritza, K. A latent class analysis of single-vehicle motorcycle crash severity outcomes. Anal. Methods Accid. Res. 2014, 2, 30–38. [Google Scholar] [CrossRef]
- Morgan, A.; Mannering, F. The effects of road-surface conditions, age, and gender on driver-injury severities. Accid. Anal. Prev. 2011, 43, 1852–1863. [Google Scholar] [CrossRef]
- Mannering, F.; Bhat, C. Analytic methods in accident research: Methodological frontier and future directions. Anal. Methods Accid. Res. 2014, 1, 1–22. [Google Scholar] [CrossRef]
- Malyshkina, N.V.; Mannering, F. Markov switching multinomial logit model: An application to accident-injury severities. Accid. Anal. Prev. 2009, 41, 829–838. [Google Scholar] [CrossRef] [Green Version]
- Xiong, Y.; Tobias, J.L.; Mannering, F.L. The analysis of vehicle crash injury-severity data: A Markov switching approach with road-segment heterogeneity. Transp. Res. Part B Methodol. 2014, 67, 109–128. [Google Scholar] [CrossRef]
- Abay, K.; Paleti, R.; Bhat, C.R. The joint analysis of injury severity of drivers in two-vehicle crashes accommodating seat belt use endogeneity. Transp. Res. Part B Methodol. 2013, 50, 74–89. [Google Scholar] [CrossRef] [Green Version]
- Russo, B.J.; Savolainen, P.; Schneider, W.H.; Anastasopoulos, P.C. Comparison of factors affecting injury severity in angle collisions by fault status using a random parameters bivariate ordered probit model. Anal. Methods Accid. Res. 2014, 2, 21–29. [Google Scholar] [CrossRef]
- Venkataraman, N.; Shankar, V.; Ulfarsson, G.F.; Deptuch, D. A heterogeneity-in-means count model for evaluating the effects of interchange type on heterogeneous influences of interstate geometrics on crash frequencies. Anal. Methods Accid. Res. 2014, 2, 12–20. [Google Scholar] [CrossRef]
- Behnood, A.; Mannering, F. Determinants of bicyclist injury severities in bicycle-vehicle crashes: A random parameters approach with heterogeneity in means and variances. Anal. Methods Accid. Res. 2017, 16, 35–47. [Google Scholar] [CrossRef]
- Manski, C.F.; McFadden, D. Structural Analysis of Discrete Data with Econometric Applications; MIT Press: Cambridge, MA, USA, 1981. [Google Scholar]
- McFadden, D.; Train, K. Mixed MNL models for discrete response. J. Appl. Econom. 2000, 15, 447–470. [Google Scholar] [CrossRef]
- Bhat, C.R. Simulation estimation of mixed discrete choice models using randomized and scrambled Halton sequences. Transp. Res. Part B Methodol. 2003, 37, 837–855. [Google Scholar] [CrossRef] [Green Version]
- Halton, J.H. On the efficiency of certain quasi-random sequences of points in evaluating multi-dimensional integrals. Numer. Math. 1960, 2, 84–90. [Google Scholar] [CrossRef]
- Train, K. Halton Sequences for Mixed Logit; University of California: Berkley, CA, USA, 1999. [Google Scholar]
- Seraneeprakarn, P.; Huang, S.; Shankar, V.; Mannering, F.; Venkataraman, N.; Milton, J. Occupant injury severities in hybrid-vehicle involved crashes: A random parameters approach with heterogeneity in means and variances. Anal. Methods Accid. Res. 2017, 15, 41–55. [Google Scholar] [CrossRef]
- Washington, S.; Karlaftis, M.; Mannering, F.; Anastasopoulos, P. Statistical and Econometric Methods for Transportation Data Analysis; Chapman and Hall/CRC: New York, NY, USA, 2020. [Google Scholar]
- Milton, J.C.; Shankar, V.N.; Mannering, F. Highway accident severities and the mixed logit model: An exploratory empirical analysis. Accid. Anal. Prev. 2007, 40, 260–266. [Google Scholar] [CrossRef]
- Behnood, A.; Mannering, F. An empirical assessment of the effects of economic recessions on pedestrian-injury crashes using mixed and latent-class models. Anal. Methods Accid. Res. 2016, 12, 1–17. [Google Scholar] [CrossRef]
- Ahmed, M.Z.; Ahmed, O.; Aibao, Z.; Hanbin, S.; Siyu, L.; Ahmad, A. Epidemic of COVID-19 in China and associated Psychological Problems. Asian J. Psychiatry 2020, 51, 102092. [Google Scholar] [CrossRef]
- Adanu, E.K.; Smith, R.; Powell, L.; Jones, S. Multilevel analysis of the role of human factors in regional disparities in crash outcomes. Accid. Anal. Prev. 2017, 109, 10–17. [Google Scholar] [CrossRef]
- Chliaoutakis, J.E.; Gnardellis, C.; Drakou, I.; Darviri, C.; Sboukis, V. Modelling the factors related to the seatbelt use by the young drivers of Athens. Accid. Anal. Prev. 2000, 32, 815–825. [Google Scholar] [CrossRef]
- Turner, C.; McClure, R. Age and gender differences in risk-taking behaviour as an explanation for high incidence of motor vehicle crashes as a driver in young males. Inj. Control Saf. Promot. 2003, 10, 123–130. [Google Scholar] [CrossRef]
- Adanu, E.K.; Hainen, A.; Jones, S. Latent class analysis of factors that influence weekday and weekend single-vehicle crash severities. Accid. Anal. Prev. 2018, 113, 187–192. [Google Scholar] [CrossRef]
- Abdalla, I.M.; Raeside, R.; Barker, D.; McGuigan, D.R. An investigation into the relationships between area social characteristics and road accident casualties. Accid. Anal. Prev. 1997, 29, 583–593. [Google Scholar] [CrossRef]
- Nicholson, N.; Soane, E.; Fenton-O’Creevy, M.; Willman, P. Personality and domain-specific risk taking. J. Risk Res. 2005, 8, 157–176. [Google Scholar] [CrossRef]
- Yu, J.; Williford, W.R. Alcohol and Risk/Sensation Seeking. J. Addict. Dis. 1993, 12, 79–96. [Google Scholar] [CrossRef]
- Ulfarsson, G.F.; Mannering, F. Differences in male and female injury severities in sport-utility vehicle, minivan, pickup and passenger car accidents. Accid. Anal. Prev. 2004, 36, 135–147. [Google Scholar] [CrossRef]
- Adanu, E.K.; Penmetsa, P.; Wood, D.; Jones, S.L. Incorporating systems thinking approach in a multilevel framework for human-centered crash analysis. Transp. Res. Interdiscip. Perspect. 2019, 2, 100031. [Google Scholar] [CrossRef]
- Atchley, P.; Shi, J.; Yamamoto, T. Cultural foundations of safety culture: A comparison of traffic safety culture in China, Japan and the United States. Transp. Res. Part F Traffic Psychol. Behav. 2014, 26, 317–325. [Google Scholar] [CrossRef]
- Lund, I.O.; Rundmo, T. Cross-cultural comparisons of traffic safety, risk perception, attitudes and behaviour. Saf. Sci. 2009, 47, 547–553. [Google Scholar] [CrossRef]
- Pulido, J.; Lardelli, P.; Bravo, M.J.; Regidor, E.; Barrio, G.; De La Fuente, L. Association between cannabis and cocaine use, traffic injuries and use of protective devices. Eur. J. Public Health 2010, 21, 753–755. [Google Scholar] [CrossRef] [PubMed] [Green Version]
- Phillips, D.P.; Brewer, K.M. The relationship between serious injury and blood alcohol concentration (BAC) in fatal motor vehicle accidents: BAC = 0.01% is associated with significantly more dangerous accidents than BAC = 0.00%. Addiction 2011, 106, 1614–1622. [Google Scholar] [CrossRef] [PubMed]
- Briggs, N.C.; Lambert, E.W.; Goldzweig, I.A.; Levine, R.S.; Warren, R.C. Driver and Passenger Seatbelt Use Among U.S. High School Students. Am. J. Prev. Med. 2008, 35, 224–229. [Google Scholar] [CrossRef]
- Kweon, Y.-J.; Kockelman, K.M. Driver Attitudes and Choices: Speed Limits, Seat Belt Use, and Drinking-and-Driving. J. Transp. Res. Forum 2010, 45. [Google Scholar] [CrossRef]
- Bogstrand, S.T.; Larsson, M.; Holtan, A.; Staff, T.; Vindenes, V.; Gjerde, H. Associations between driving under the influence of alcohol or drugs, speeding and seatbelt use among fatally injured car drivers in Norway. Accid. Anal. Prev. 2015, 78, 14–19. [Google Scholar] [CrossRef]

Publisher’s Note: MDPI stays neutral with regard to jurisdictional claims in published maps and institutional affiliations. |
© 2022 by the authors. Licensee MDPI, Basel, Switzerland. This article is an open access article distributed under the terms and conditions of the Creative Commons Attribution (CC BY) license (https://creativecommons.org/licenses/by/4.0/).