Article

Ergonomic Design of Apron Bus with Consideration for Passengers with Mobility Constraints

1
School of Industrial Engineering and Engineering Management, Mapúa University, Intramuros, Manila 1002, Philippines
2
School of Graduate Studies, Mapúa University, Intramuros, Manila 1002, Philippines
3
Department of Information Systems, Institut Teknologi Sepuluh Nopember, Kampus ITS Sukolilo, Surabaya 60111, Indonesia
4
Entrepreneurship Department, BINUS Business School Undergraduate Program, Bina Nusantara University, Malang 65154, Indonesia
*
Author to whom correspondence should be addressed.
Safety 2022, 8(2), 33; https://doi.org/10.3390/safety8020033
Submission received: 8 March 2022 / Revised: 31 March 2022 / Accepted: 3 April 2022 / Published: 3 May 2022

Abstract

:
Passengers in an apron bus are usually subjected to a standing position because of its limited seats and capacity. Due to this, passengers, especially those with mobility constraints, may expose themselves to musculoskeletal disorder (MSD) risks such as body pain, discomfort, and non-collision injuries. The purpose of this study is to design an ergonomic apron bus to aid the musculoskeletal discomfort experienced by passengers with mobility constraints, specifically the elderly, pregnant women, mothers carrying infants, and persons needing wheelchair assistance. A total of 149 participants are involved in the study. Corlett’s and Bishop’s body discomfort questionnaires and Rapid Entire Body Assessment (REBA) are utilized to evaluate the respondent’s experience of discomfort in different regions of their body. The results show that passengers with mobility constraints experience body discomfort during the apron bus ride. The prevalence of body discomfort is evident in the lower back, knee, thigh, arm, shoulder, and middle back. Finally, principles of anthropometry are used in the study along with quality function deployment (QFD), failure mode and effects analysis (FMEA), and cost-benefit analysis to evaluate the feasibility of the recommended ergonomic design of the apron bus. To meet the requirements of people with disabilities, the ergonomic design of an apron bus is created to minimize the risk of exposure of passengers to certain musculoskeletal discomfort, maximize the space, minimize the delay time of the airlines, and be able to prioritize passengers who require mobility assistance.

1. Introduction

An apron bus is a ground support equipment vehicle with a special design that facilitates passengers’ transport and hand luggage from airport gate terminals to their specific aircraft. In the Philippines, apron buses are present in all major domestic and international terminals and are owned by Philippine aircraft carriers. The use of an apron bus minimizes operation costs in terms of passenger transport from the terminal to aircraft. According to the low-cost carriers forecast for the Philippines, apron buses will be used by 85% of domestic passengers and 30% of international passengers by 2030 [1]. The functional areas that describe the effectiveness of air transport activity are its physical layout and the means of transport that ensure accessibility. The apron bus’s physical layout will improve passengers’ comfort and the flow of movement, which can be favorable to air transport activity in terms of customer satisfaction. Hence, it is highly important to analyze passengers’ comfort concerning airport service transfer activity [2].
In the Philippines, airport buses usually have limited seats. Most passengers are standing during the whole trip, which lasts around 15–30 min since apron buses have fewer seats than ordinary buses. They are specifically built for usage at airports. Inside these buses, passengers often stand during their journey [3]. Situations where people are forced to travel in a standing position may cause passengers pain, discomfort, and non-collision injuries [4]. A study in Australia has shown that 32% of the fatal and serious injuries on buses are attributed to non-collision incidents [5]. Most of the injuries occurred when the bus was traveling and people were standing. The main mechanism was abrupt vehicle acceleration or deceleration, followed by boarding and disembarking from the bus. A significant number of cases involve elderly passengers, which clearly indicates that this group is the most vulnerable to such incidents. Thus, in the design of public transport vehicles such as apron buses, the safety demands of passengers, especially those with mobility constraints, must be considered.
Similarly, passengers in a standing position may also incline themselves to musculoskeletal disorder risks. Musculoskeletal disorder (MSD) are injuries and disorders that affect the movement of the human body or musculoskeletal system such as muscles, tendons, ligaments, nerves, discs, and blood vessels [6,7]. When individuals are subjected to MSD risk factors, they become fatigued. They acquire a musculoskeletal imbalance when their fatigue outruns their body’s recuperation system. A musculoskeletal disorder develops over time as fatigue outruns recovery and a musculoskeletal imbalance develops. In a study by Deshmukh et al. [8], it was identified that the regions of the body affected mainly by musculoskeletal pain for individuals in standing position during bus travel were the knee joint, followed by the lower back, and ankles/feet.
A study by Matsika [9] also suggested a compromise between the comfort of sitting while also increasing the seating capacity with the use of standing seats. According to Kiran et al. [10], the limited seating space restricts the passengers’ movement, exposing some parts of their bodies to discomfort. Moreover, limited seating capacity may also contribute to musculoskeletal discomfort among passengers with reduced mobility. The number of air passengers has steadily increased over the last decade, with passengers with mobility issues traveling by air growing at a faster rate. Passengers with mobility constraints (PWD, the elderly, passengers carrying children, and pregnant women) have high-risk factors when riding public transport, such as public buses [11]. Recent data from the Philippine Institute for Development Studies [12] found that out of 1031 adult women and 823 children with disabilities, were found to be mobility-impaired (39.7%). Also, in 2016 alone, 43,000 passengers availed themselves of wheelchair assistance from one local airline at the check-in counter [13]. According to Wretstrand et al. [14], comfort and safety are the two essential quality factors to be considered in public transit design that will cater to disabled passenger groups. Similarly, a study by Almada and Renner [15] also stated that the full accessibility to public transit is an essential tool for disabled passenger groups to enable integration into society and improve their quality of life.
It is stated that in order to meet the needs of individuals with disabilities, the transportation infrastructure and mobility factors for the disabled must be addressed and enhanced [16]. According to a study by Ipingbeni [17], the travel experiences of the elderly and individuals with disabilities must be considered in the development of a high-quality mode of transportation for all. Thus, the need to address the evaluation and design of public transportation is needed. Broome et al. [18] stated that the existing conventional public transportation system cannot provide an efficient service to people with mobility constraints, and limitations still persist. According to a study by Hwangbo et al. [19], limited mobility caused by the current transportation system and design is still a major issue for disabled and older individuals who utilize the bus system. Thus, the design of public buses, such as apron buses, should consider the vulnerability of people around them and those who also assist the passengers with mobility constraints [20].

2. Review of Related Literature

Previously, there were studies related to passenger comfort for persons with mobility constraints in the country. In a study by Gumasing et al. [21], an ergonomically designed light rail transit (LRT) was developed for persons with mobility impairments and special needs. The study focused primarily on the design of LRT carts, including entrances, seats, lanes, railings, and other characteristics that require mobility aids such as wheelchairs, crutches, and canes. Safety, accessibility, and comfortability were all considered in the study. Similarly, another study on the design of public buses for the elderly and persons with disabilities (PWD) was developed by Gumasing and dela Cruz [11]. The study’s outcomes revealed that significant users of public buses who took part in the study were less satisfied with the existing design of public buses in the Philippines and had trouble using them. Furthermore, the current design measures were found to be unsuitable for Filipino commuters because they were not ergonomically developed. As a result, actual Filipino anthropometric measurements were used to ergonomically adapt the bus design for commuters [11].
Although the availability of much literature for evaluating the comfort of passengers with mobility constraints may be found in current works, very little information for assessing the prevalence of musculoskeletal discomfort of passengers in apron buses exists. The development of air transport activity and services shows the need to improve the quality of airport buses for its passengers in the Philippines. Improving the quality of apron buses will not only benefit their passengers but will also be favorable for the airport and airline services [2,3].
The purpose of this study was to determine the musculoskeletal discomfort experienced by passengers with mobility constraints, specifically the elderly, pregnant women, mothers carrying infants, and persons needing wheelchair assistance. This study also aimed to determine the relationship between discomfort scores and postural risk scores of passengers using the Corlett and Bishop body map questionnaire and Rapid Entire Body Assessment (REBA). Finally, using the principles of anthropometry, the ergonomic design of an apron bus is intended to be created to minimize the risk of exposure of passengers to certain musculoskeletal discomfort, maximize space, minimize the delay time of the airlines, and be able to prioritize passengers who require mobility assistance.

3. Methodology

3.1. Sampling Design

The non-probability sampling method, specifically purposive sampling using pen and paper questionnaires, was utilized in this study. The questionnaire was distributed to passengers who had just gotten off the apron bus. The study was conducted among the passengers in Ninoy Aquino International Airport (NAIA) Terminal 3, the largest terminal in the NAIA complex and the highest volume of passengers capable of servicing 33,000 passengers daily at a peak of 6000 passengers per hour [22]. A total of 180 survey questionnaires were distributed to the target participants. However, only 149 participants responded to the study, resulting in a response rate of 83%. The total participants involved in the study included 48 elderly, 31 pregnant women, 39 mothers carrying infants, and 31 passengers needing wheelchair assistance. The sample size of 149 is compared against the required sample size for PWD passengers of public transport lines following the study of dell’Olio et al. [23], as shown in Equation (1):
n p 1 p e z 2 + p 1 p N
where n is the number of passengers to be surveyed and p is the proportion of PWD passengers who are traveling, which is taken to be 0.33 based on travel demand forecast for PWD using public transportation [24]. Moreover, e is the level of assumed error, z is the value of the random variable in a standard normal distribution, and N is the observed flow of passengers on the line. Thus, the sample can be representative.
The questionnaire was briefly discussed with each respondent, and written consent was obtained from the respondents. The respondents were asked to fill out a consent form that indicates that the responses and information gathered will solely be used for academic and research purposes, following the Data Privacy Act, or Republic Act No. 10173 in the Philippines. In addition, this study was approved by Mapua University Research Ethics Committee (application number FM-RC-21-89). The questionnaire consisted of three sections. The first part of the questionnaire determined the respondents’ demographic profile using an 8-item question, including age, gender, nationality, employment status, the purpose of travel, frequency of travel in the past two years, frequency of riding an apron bus in the last two years, and average duration (min) of the trip in apron bus.
Table 1 presents the descriptive statistics of respondents’ profiles. Based on this table, the majority of the respondents were female (56%) within 20–39 years old (47%). Most of the respondents were Filipinos (95%) and were currently employed (42%). Their usual purpose of travel was for leisure (79%) and had traveled in the last two years for 1–3 times. The researchers also asked about the frequency of riding the apron bus in the last two years. Based on gathered data, 72% of the respondents answered that they had ridden an apron bus 1 to 3 times in the last two years, 15% of the respondents answered that they rode the apron bus 4 to 6 times, 8% responded that they had ridden the apron bus 7 to 9 times, and 1% of the respondents answered ten times or more in the past two years. The majority of respondents’ average travel duration in apron buses was 15–30 min/ride (57%), followed by 30 min or more/ride (40%).

3.2. Corlett and Bishop Body Map Questionnaire

The second part of the questionnaire consists of Corlett and Bishop’s body map discomfort scale. This questionnaire was utilized to evaluate the respondent’s experience of discomfort in different parts of their body. The discomfort questionnaire was distributed to passengers in NAIA Terminal 3 who had just gotten off the apron bus. All selected participants are departing passengers to ensure no general body discomfort is experienced due to prolonged sitting in an aircraft. Furthermore, it was assured that participants had no prior musculoskeletal injuries or progressive disorders at the time of data collection.
This tool is a subjective type of survey since different passengers may experience different symptoms. In this study, the researchers assessed the level of discomfort of respondents in their head and neck, shoulder, arm, middle back, lower back, buttock, thigh, knee, and leg and foot. The respondents evaluated their level of discomfort using a 5-point Likert scale (1-not comfortable, 2-barely uncomfortable, 3-quite comfortable, 4-very uncomfortable, 5-extremely uncomfortable) following the study of Li et al. [25].

3.3. Quality Function Deployment (QFD)

The third part of the questionnaire consists of a quality function deployment (QFD) survey. It is a structured approach to defining customers’ needs and requirements and translating them into specific plans to produce products that meet customers’ demands [26]. In an ergonomic design of an apron bus, the perception of passengers with regard to safety and accessibility when riding an apron bus was investigated. For the safety criterion, respondents rated the importance of safety features of the apron bus on a 5-oint Likert scale, wherein 1 being the lowest and 5 being the highest. The safety features involved the following: door material, seat material, handrail material, and floor material. For accessibility criterion, the following components are considered: aisle space, wheelchair lockdown area, door width, door height, seat depth, seat width, and handrail length. The scores were weighted to obtain the measured value. The collected questionnaire data were tested for validity, reliability, and adequacy.

3.4. Rapid Entire Body Assessment (REBA)

This tool was used to evaluate the exposure of individual passengers with mobility constraints to certain ergonomic risk factors using a single-page worksheet to assess the passenger’s body posture, force, and repetition while riding an apron bus. The chosen postures for REBA evaluation are based on the worst postures of the passengers on both left and right sides of the body and held for lengthy periods. The observation of posture was performed at different time intervals during the entire trip duration, from embarking on an apron bus until disembarking. The passengers’ postures were captured using a hand-held video recorder for the participants’ 5–10 min travel duration. Selected still images using cameras were also used to capture the posture of the study participants. The recording devices were placed orthogonally to record the sagittal and frontal planes of the participants. A single researcher whose university-based research focuses on ergonomics analyzed the work posture of the participants using Rapid Entire Body Assessment (REBA). The scores for each passenger were integrated for various postures taken during the assessment. Relative to the assessment, the side of the body (left or right) that was evaluated is based on the most awkward posture (e.g., holding on to the straphangers, standees, handrails, grab bars, etc.) as shown in Figure 1.
Using the worksheet, the researchers assigned a score for each of the following body regions: wrists, forearms, elbows, shoulders, neck, trunk, back, legs, and knees. After the data for each region were collected and scored, tables on the REBA form were utilized to compile the risk factor variables, generating a single score representing the MSD risk level. In this study, the risk level was based on REBA score analysis, as shown in Table 2.

3.5. Statistical Analysis

Correlation analysis using the Pearson correlation method was also employed to determine the relationship between the REBA postural risk scores and the musculoskeletal discomfort of different passengers with mobility constraints by utilizing SPSS 25. The test statistic Pearson’s correlation coefficient evaluates the statistical relationship, or association, between two continuous variables. Because it is based on the method of covariance, it is known as the best method for quantifying the relationship between variables of interest. It provides information on the magnitude and direction of the relationship’s association, or correlation. The input variables were correlated with associated REBA score (1–11) and discomfort score (1–5) for all 149 samples. The study was conducted using a 95% confidence level, and the results of p < 0.05 were considered significant.

4. Results

4.1. Result of Corlett and Bishop Body Map Questionnaire

Table 3 shows the average discomfort scores of passengers with mobility constraints, obtained from the Corlett and Bishop body map questionnaire. The result indicated that for the elderly, the body regions with the highest musculoskeletal discomfort were the knee (2.81) and lower back (2.73). For pregnant women, musculoskeletal discomforts were evident in the lower back (3.16) and thigh (2.87). In addition, for mothers carrying infants, the body regions with high discomfort were the following: arm (3.95), shoulder (3.87), lower back (3.05), buttock (3.00), middle back (2.95), leg and foot (2.97), and knee (2.64). Lastly, for passengers needing wheelchair assistance, body regions with high musculoskeletal discomfort were thigh (3.06), lower back (3.03), middle back (2.94), buttock (2.90), and leg and foot (2.61).

4.2. Result of Rapid Entire Body Assessment (REBA)

Table 4 shows the frequency of postural risk scores of passengers with mobility constraints while riding the apron bus using the Rapid Entire Body Assessment (REBA). The result indicated that for the elderly, 69% have a medium risk while 29% have a high risk. Pregnant women showed that most had a medium risk (90%). Moreover, 64% had a medium risk for mothers carrying infants, while 36% had a high risk. Lastly, for passengers needing wheelchair assistance, the majority had a medium risk (87%). In summary, the passenger with the highest risk (high to very high-risk category) for MSD is a passenger-carrying infant (36%), followed by the elderly (29%).

4.3. Result of Correlation Analysis

Table 5 shows the correlation analysis between the postural risk score and musculoskeletal discomfort in each body region experienced by passengers. The results indicate that the postural risk scores significantly correlate with musculoskeletal discomfort. This implied that as the posture of passengers when riding an apron bus becomes poor and awkward, as reflected by their REBA scores, the higher the discomfort experienced by passengers in different regions of their bodies. In addition, it was found that the body regions with the highest relationship to the postural risk scores were the leg/foot (r = 0.521, p < 0.001) and the arm (r = 0.514, p < 0.001).

4.4. Anthropometric Characterization of Passengers with Mobility Constraints

Anthropometry is a design tool used to measure a human individual’s physical references. In this study, the researchers computed the associated parts of the apron bus and their corresponding measurements using the anthropometric data of Filipinos by Del Prado-Lu [28]. This is the first-ever comprehensive anthropometric measurement of the Filipino adult population in the country. The study’s findings could be used to improve the ergonomic design of workstations, equipment, interactive systems, furniture, and seats for the Filipino adult population, resulting in safer, more productive, and user-friendly workplaces [28].
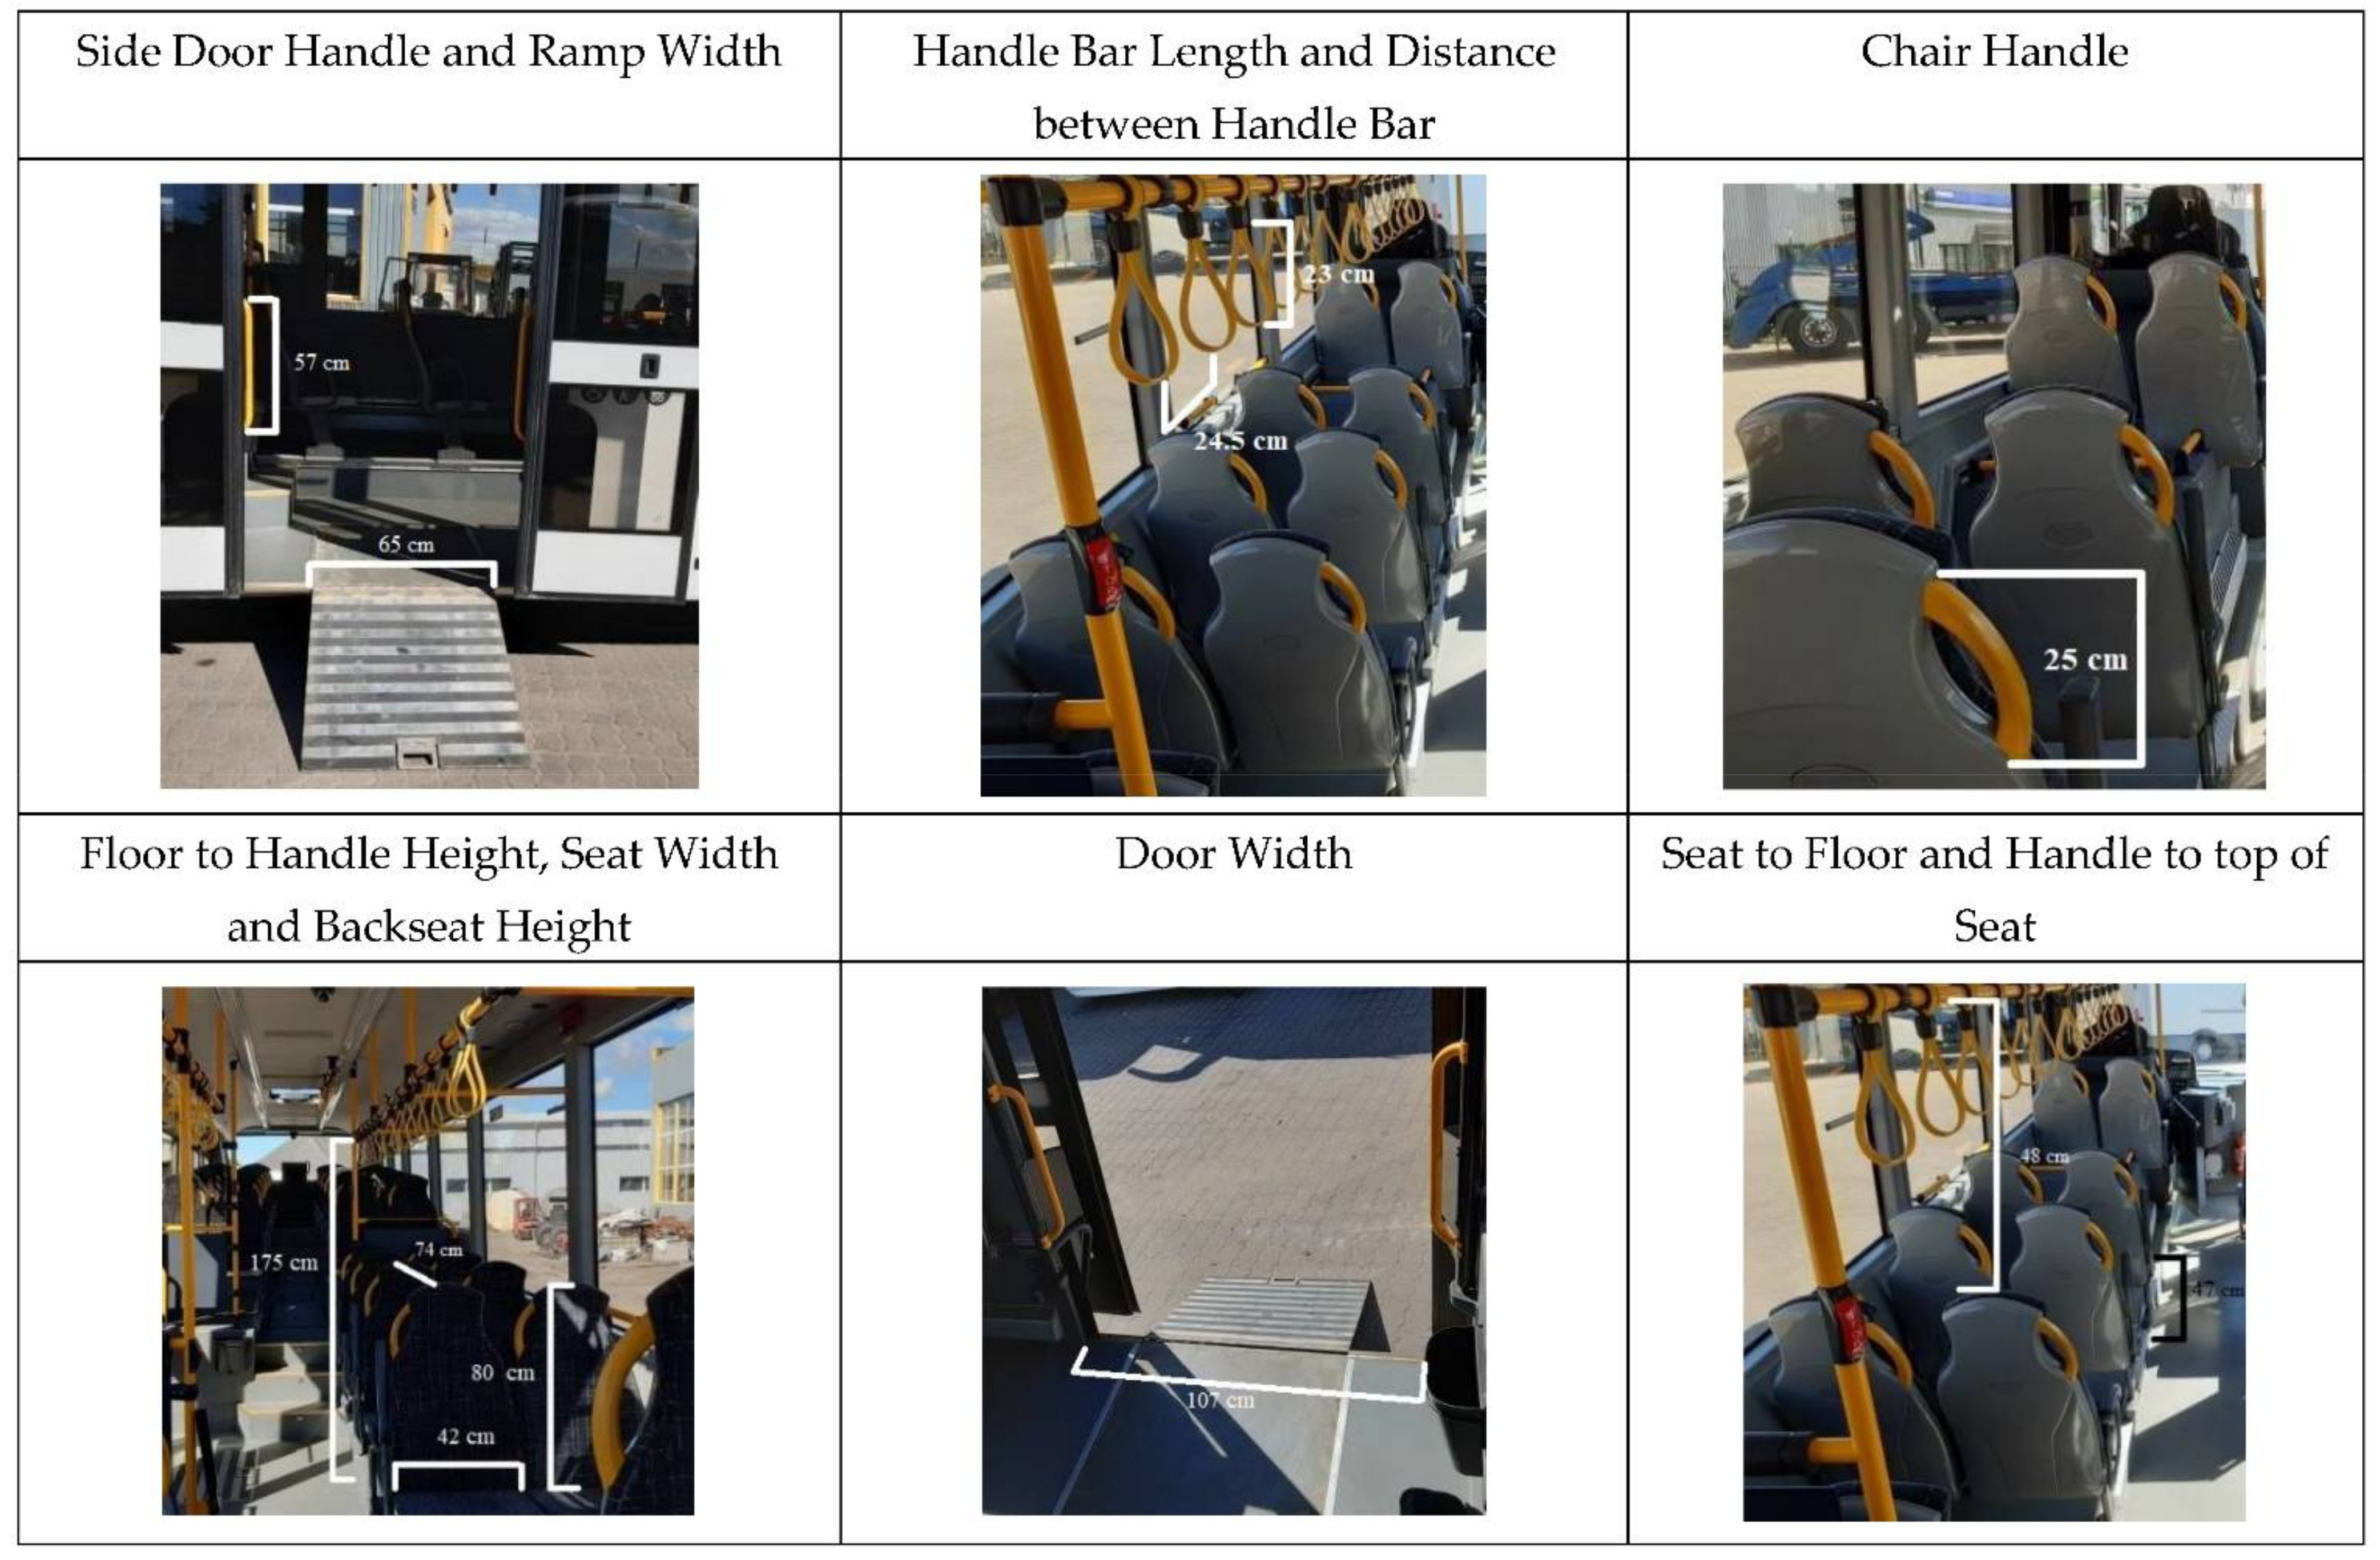
The researchers were able to obtain the measurements of the current apron bus used in most Philippine airports. Pictures of the apron bus with its corresponding dimensions are presented in Figure 2.
Anthropometric measurements are needed in this study to further assess the comfortability, satisfaction, accessibility, and safety of passengers onboard the apron bus. These measurements will also help the researchers design a proposed apron bus that will satisfy the needs of the passengers, especially the passengers who need mobility assistance. The anthropometric measurement used in the present study is based on the data obtained from Del Prado-Lu [28]. The study conducted anthropometric measurements among 1805 Filipino workers in 31 manufacturing industries.
Anthropometric measurements allow comparison to population norms or to values collected over time in the same individual. Anthropometric values are closely related to nutrition, genetic makeup, environmental characteristics, social and cultural conditions, lifestyle, functional status, and health. A recent 2021 Global Nutrition Report data revealed that the prevalence of overweight and obese adults for Filipinos aged 18 and over had shown an increase of 10% over the past ten years [29]. However, according to Eaton-Evans [30], anthropometric measurements cannot identify protein and micronutrient deficiencies, detect minor nutritional status disturbances, or identify small changes in the proportions of body fat to body mass index. Likewise, previous studies have found that self-reported anthropometric variables are reasonably accurate when compared with measurements made simultaneously and are generally adequate for use in large-scale epidemiological studies [31]. Thus, to confirm the accuracy of anthropometric data by Del Prado-Yu, a comparison between the data from 100 Filipino PWD and elderly individuals obtained by Gumasing and dela Cruz in 2017 [11] and that of Del Prado-Yu was made. The result proved that differences in measurements were minimal. The reporting errors in anthropometric variables may result in small biases. Hence, the anthropometric data used in the present study can be representative.
Anthropometric data were measured for standing, sitting, hand and foot dimensions, breadth and circumference of the various body parts, and grip strength. The summary of anthropometric measurements is shown in Table 6.
Table 7 shows the apron bus dimensions, actual measurement, dimension reference, percentile, and measurement of the proposed apron bus. The ergonomic design of an apron bus considers ergonomic constraints such as posture, clearance, and reach [32]. The side door handle is based on standing elbow height ranging between the minimum population, 5th percentile female, and maximum population, 95th percentile male (89 cm to 112.8 cm) above the floor. This will provide more comfort for the passengers when embarking and disembarking the bus, using handrails since the range of handrail height will allow passengers to flex their lower arms at a 90-degree angle compared to the existing design, which is too low for the passengers (60cm). Similarly, chair handles should also be designed based on the minimum percentile of users (89 cm). In addition, the maximum circumference of handlebars should be based on the minimum percentile of a handbreadth, which is 9.5 cm on a diameter sphere. It must be rounded or returned smoothly to the bus door. For the ramp width, based on American Disability Acts [33], accessible ramps for wheelchair use must maintain a minimum clear width of 36” or 91.4 cm at all times. The cross slope along the width of any ramp must be less than 1:50 or <2%. The 36” (91.4 cm) clear width must be maintained between all, including handrails. Hence, the door width should also be the same as the width of the ramp to accommodate the entrance of a person needing wheelchair assistance.
For the step height, it was identified in the study by Brooks et al. [34] that this is one of the problems with bus usage. The height of the first step was determined as the major inhibiting aspect for elderly and disabled subjects for step climbing and handrail use when using buses. Thus, it is recommended that there should be a retractable step be provided for persons needing a wheelchair with a maximum allowable slope of 1:12 having a maximum rise of 30” (76.2 cm) [34]. Therefore, the recommended height of step for an apron bus without retractable steps should be the step height of the minimum population, 5th percentile female (14.58 cm) at the maximum to improve the ease of use, especially by elderly passengers [34].
For the handlebars, the measurement of the distance from the edge of the handlebars to the floor was compared to the upper reach of the minimum population (138 cm). Given that the actual measurement of handlebar height is higher (175 cm), a higher measurement would mean that a number of passengers would not be able to reach the handles and struggle in doing so, as supported by the findings of Martinez et al. [35] Thus, a lower measurement would be ideal.
Finally, in the design of seats, the gap from seat to seat should be matched to the maximum population to accommodate enough space for the seat depth and legroom for comfort. The sufficient gap from seat to seat would provide comfort for pregnant women and mothers carrying infants. The seat depth should be designed for the minimum population (40 cm) so that users can comfortably lay their backs against the seat’s back support. On the other hand, legroom should be designed for the maximum population (59 cm) to provide taller passengers with sufficient legroom and adequate space for luggage and bags. The seat depth should be designed for the minimum population (36 cm) and should be low enough for most passengers to lay their feet flat on the floor while seated to avoid compression on the undersides of the thighs and buttock region. For the seat width, the design should accommodate the maximum population (48 cm) so that the hips and buttocks of the passenger can fit into the seat pan, especially for pregnant women. The seatback should have a moderate inclination, and the seat pan should slope back slightly using a moderately contoured pan for weight distribution to provide comfort to passengers, especially pregnant women and mothers carrying an infant.

4.5. Quality Function Deployment (QFD)

The purpose of using the QFD is to identify the apron bus’s design characteristics and its relationship to its passengers’ requirements. The main goal of using this tool is to satisfy the passengers while minimizing the cost and maximizing the benefit of the apron bus. In this research, two different houses of quality were built to analyze the differences—the house of quality for the old apron bus and the other for the proposed apron bus.
Factors for passenger requirements were identified, including their relative weight, to establish and define the basic wants of passengers and incorporate them into the design of the apron bus. In the present study, the following two major factors were categorized: Safety and Accessibility. Table 8 summarizes the average scores of the passengers’ perceptions of their safety and accessibility inside the apron bus with their current weights. The higher the mean average, the more satisfied the passenger.
The primary and most crucial factor in every product is the customer’s safety. Safety is to protect passengers from accidents, risks, and hazards that may result in injuries and fatalities. Since an apron bus transports pack passengers from the gate terminal of the airport to the airplane to reduce apron bus trips, the driver must ensure the safety of its passengers throughout the ride. The importance and the relative weight will show that safety will always be the top requirement of the passengers. The following are under the safety category in the house of quality: door material, seat material, handrail material, and floor material.
On the other hand, efficiency, ease, and comfort are some of the characteristics of the ideal convenience for passengers. Passengers would define accessibility in line with the comfort they are experiencing when riding the apron bus. Enough space and room to move and sit without hassle are critical requirements for passengers riding the apron bus. The factors that fall under the category of accessibility are aisle space, wheelchair lockdown area, door width, door height, seat depth, seat width, and handrail length.

4.6. Ergonomic Design of Apron Bus

The 2D design shows the number of seats and several measurements that were generated from the anthropometric data. The dimensions of the seat length, leg clearance, bus width, aisle width, and door width are shown in Figure 3. It can be observed that the apron bus has two doors in the middle for easier boarding and descending of the passengers. This will also minimize the ground time of the apron bus, as the two doors will disembark the passengers faster.
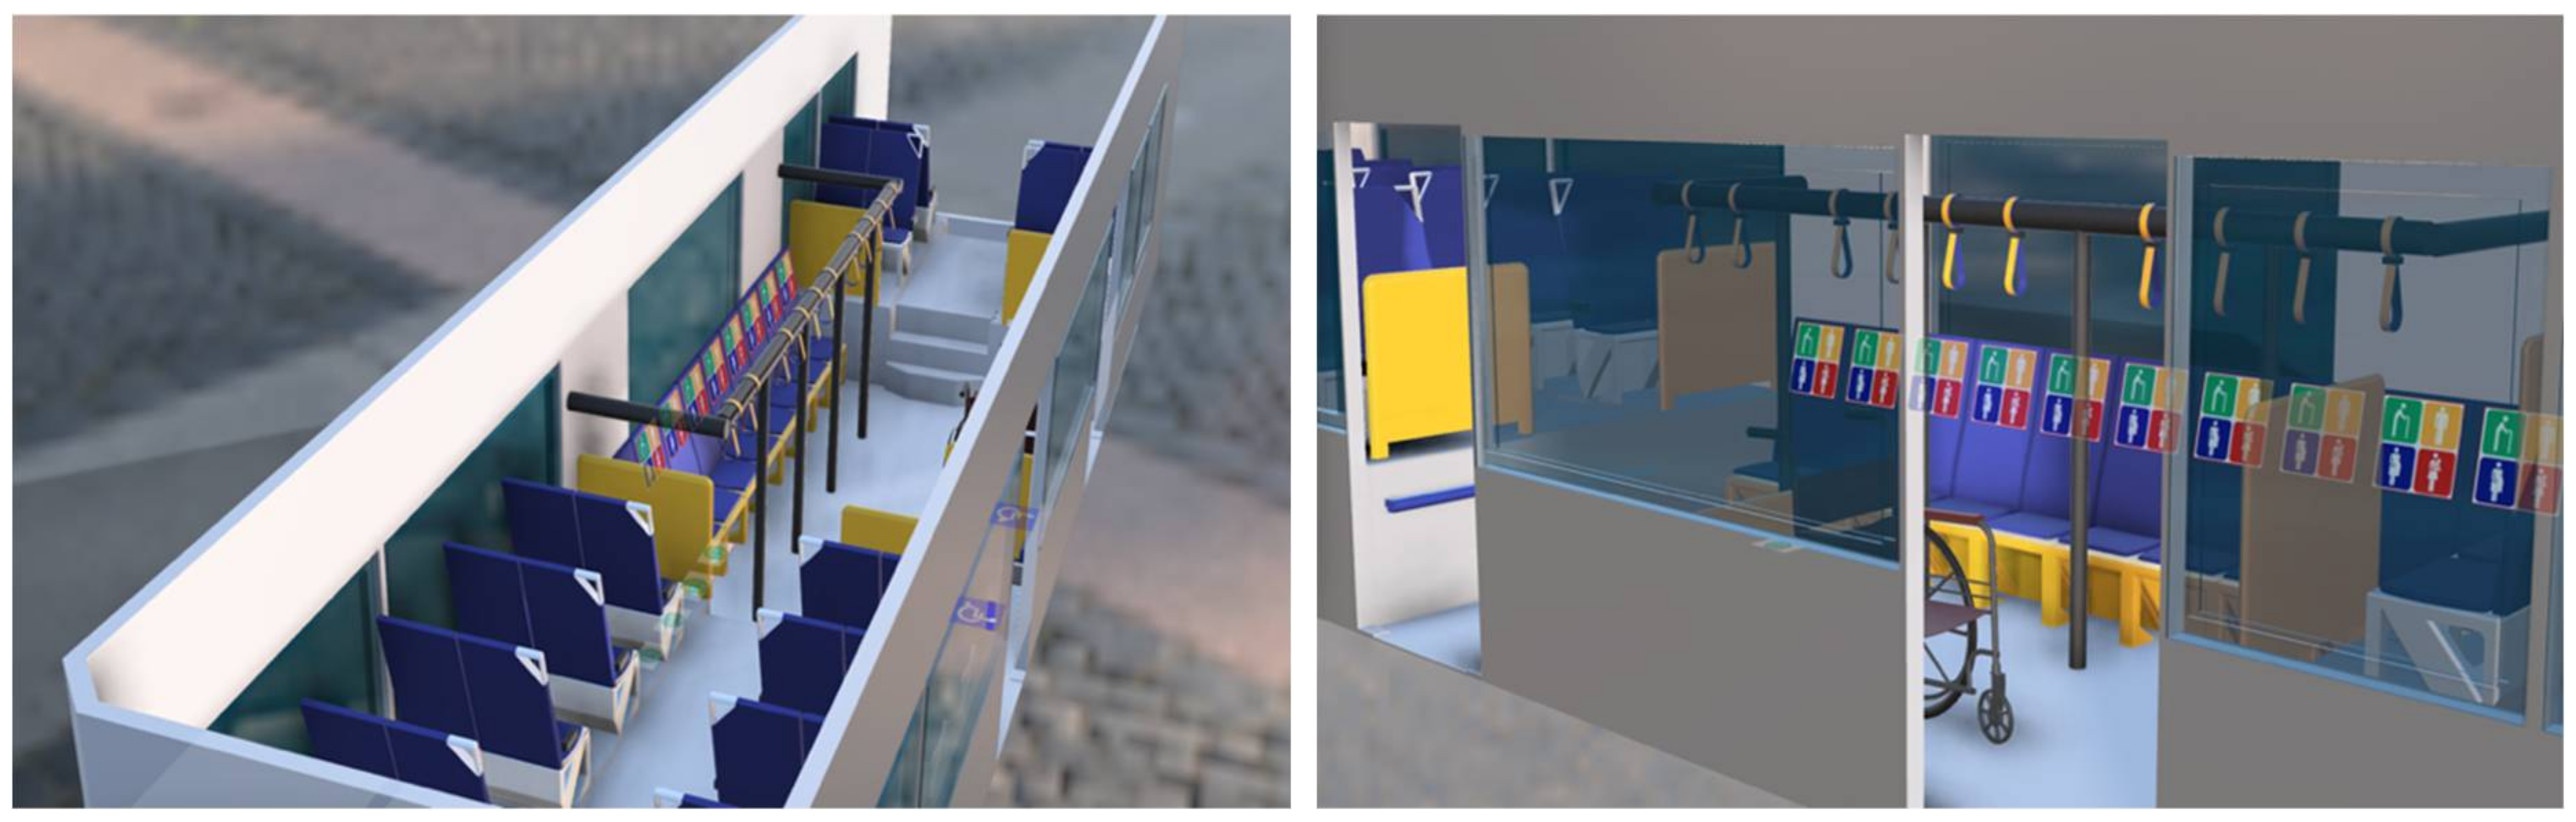
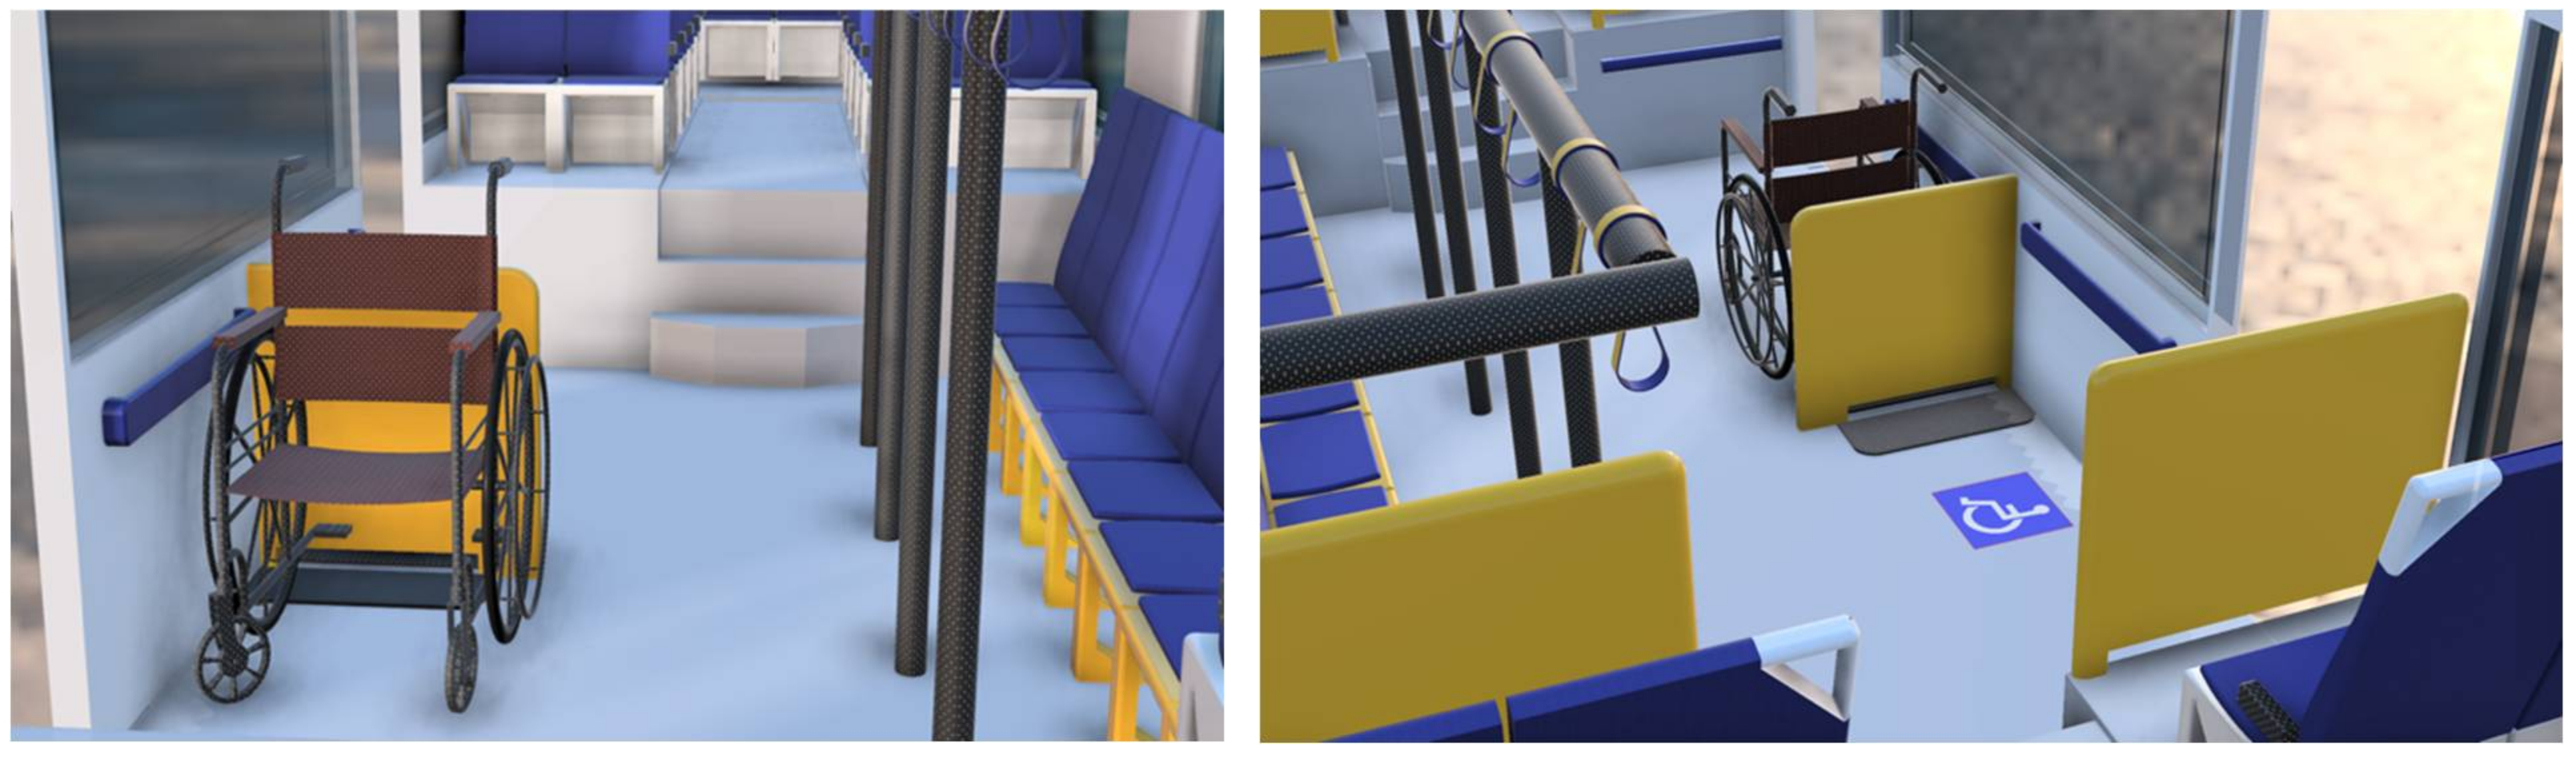
It can be seen in Figure 4 that the middle area of the apron bus is designed for passengers who have mobility constraints. They are specifically designated in the middle area to access the doors easily and more efficiently. Signs are used to represent a priority for those passengers. Seatbelts are also attached so that the passengers are secured. Poles made of steel and plastic powder coating are also provided. These can be used as handles for passengers with mobility issues and as an extra grip for passengers standing on the apron of the bus.
Furthermore, there is also an assigned area for passengers who require wheelchair assistance. Two wheelchairs can be accommodated inside the bus and are arranged back-to-back. A stopper for the wheelchair is placed so that the wheels of the wheelchair will not move, and a long handle is provided for the passengers’ grip. The number of wheelchair users is only limited to the apron bus to maximize space for all airport passengers.
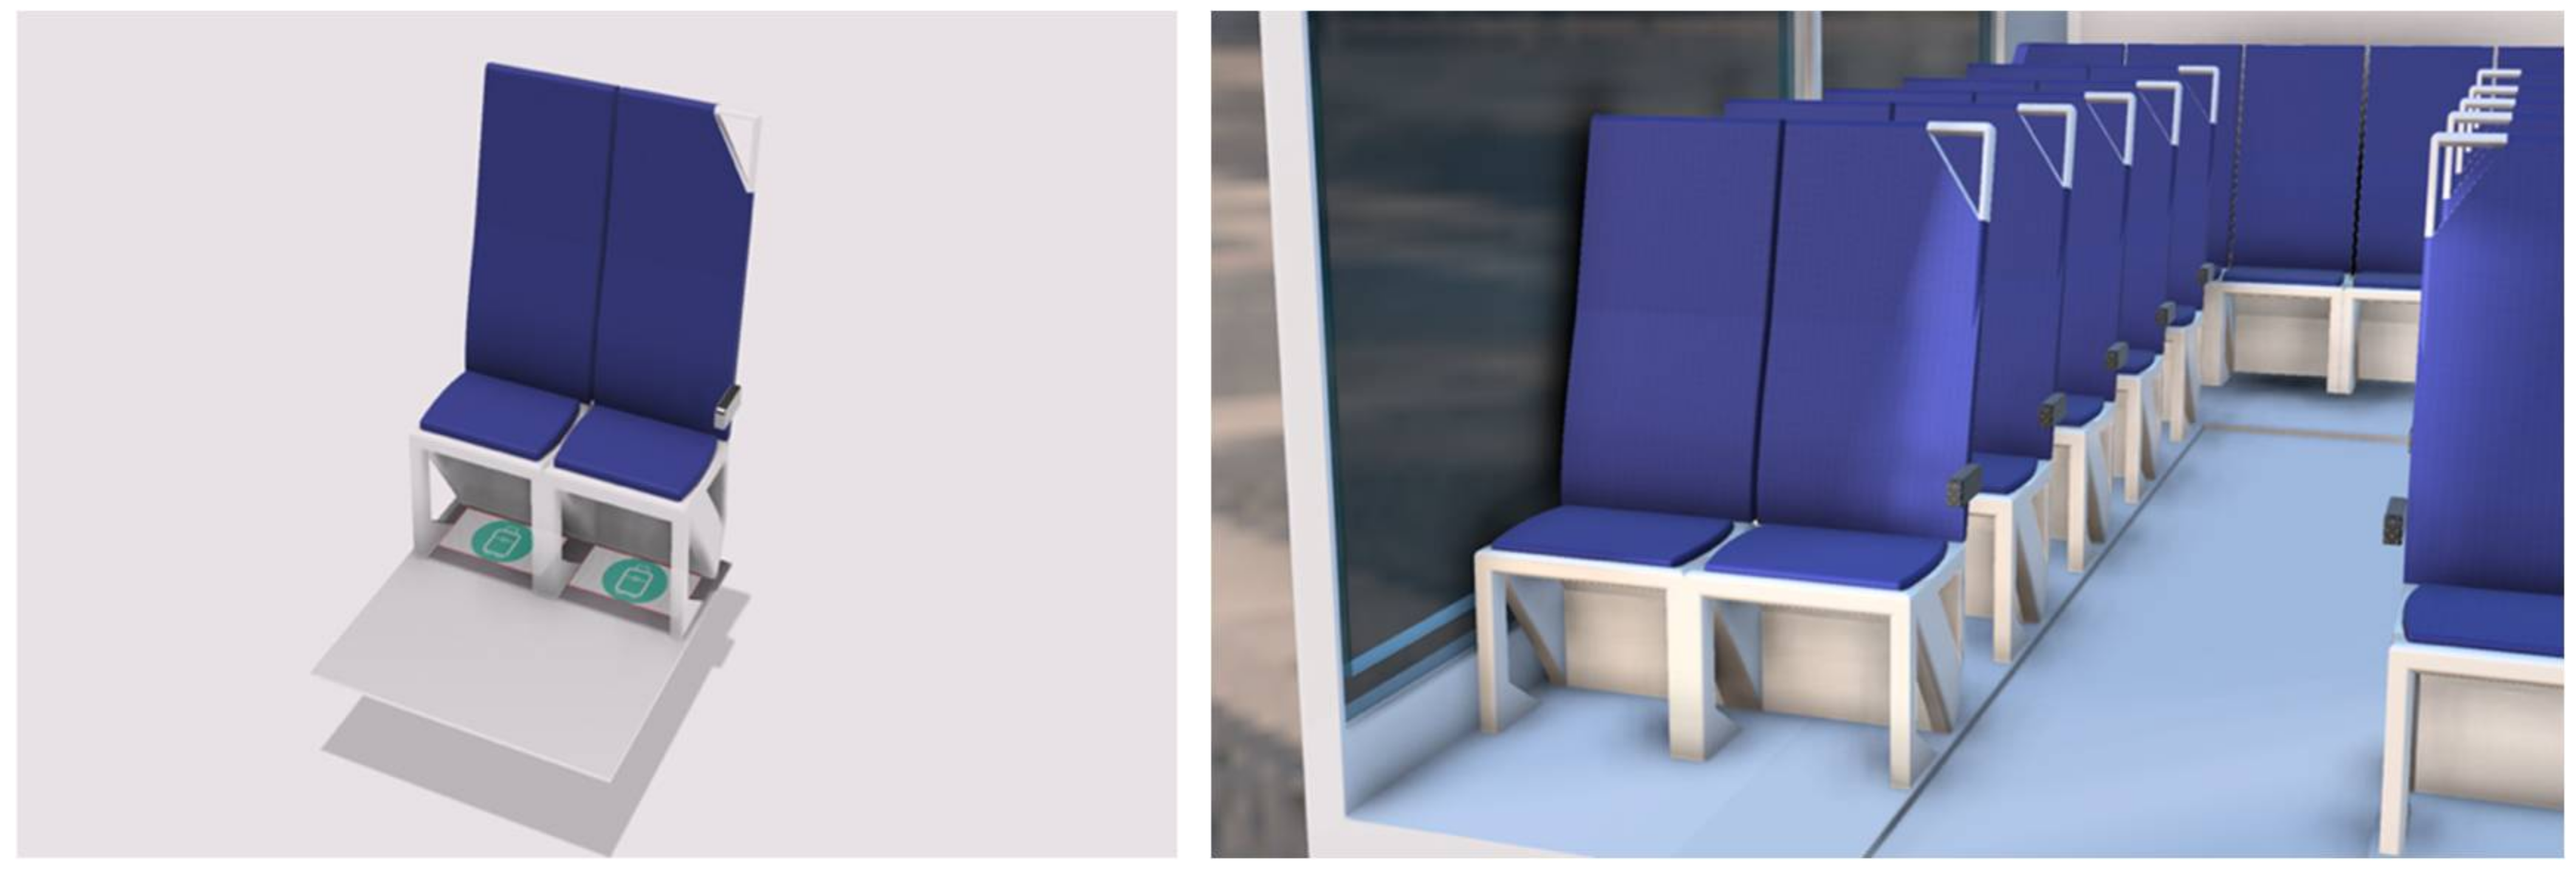
As shown in Figure 5, the dimensions follow the recommended anthropometric data that was analyzed in the present study for the passenger seats. Cushions, made of foam, are also provided so that passengers can ride the apron bus in comfort. These seats can also be reclined to reduce the passengers’ stiffness during the ride. The luggage of the passengers is assigned below their seats. The space below their seats can give enough room to fit the maximum width measurement for hand-carry luggage (38 cm). This design will provide convenience for the passengers and reduce their exposure to musculoskeletal discomfort since several lifting positions are eliminated. In addition, handles made of plastic beside the seats are provided so that passengers who are standing do not have to lift their hands for grip. This reduces the angles at which the passengers can incur several musculoskeletal discomforts.
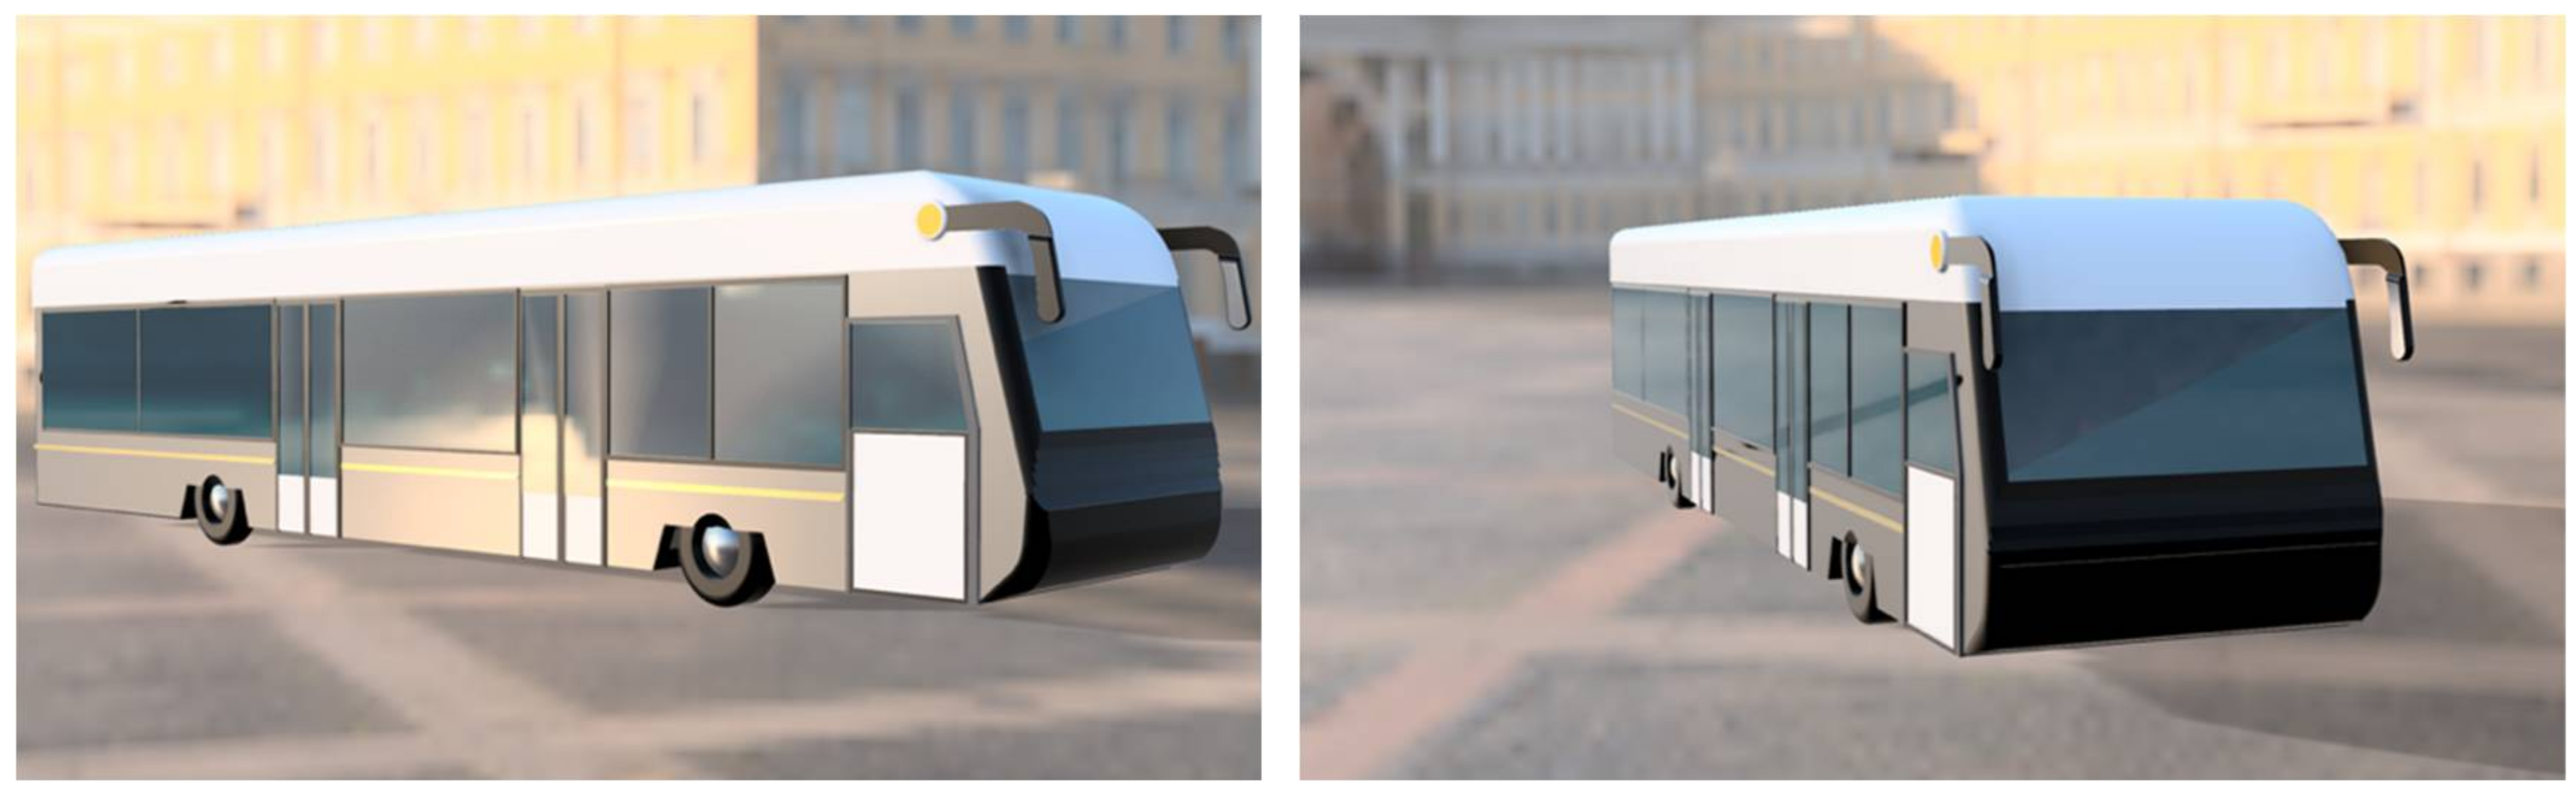
Figure 6 shows the design of the exterior of the apron bus. It can be observed that the proposed bus width is wider than the current apron bus. This will provide extra comfort for the passengers, giving them a wider aisle width than at present, so that getting to their seat and disembarking the bus is much more convenient for the passengers.

4.7. Failure Mode and Effect Analysis (FMEA)

The design FMEA of the proposed apron bus is divided into the following two parts: interior and exterior. Potential failure modes of each part and/or function are also determined. Potential causes and effects of failure and its severity and likelihood are also identified, as well as the current design controls with the corresponding detection. With this analysis, the risk priority number (RPN) is established by multiplying the severity, likelihood, and detection of the part or function. Recommended actions and actions taken are also included in this analysis with their corresponding severity, likelihood, and detection. These action results will also derive a corresponding risk priority number.
Table 9 summarizes the design FMEA analysis that was concluded. It can be observed that the part of the apron bus with the highest percentage improvement is the wheelchair lockdown area, with an 87.50% improvement. Moreover, a high percentage of improvement was observed in the step height and bus door area, with a percent improvement equal to 83.33%. The lowest RPN for the proposed apron bus design is at the bus door. Using the design FMEA, it can be recognized that the overall percent improvement when using the proposed apron bus is equal to 72.05%.

4.8. Cost-Benefit Analysis

Assumptions of the cost-benefit analysis are the average cost of delay per minute being PHP 3674.55 [36], the average number of delays of flights per day at Ninoy Aquino International Airport (NAIA) being 250/day [37], the average cost of serious injury crashes being PHP 1,728,127 [38], and the average cost of permanent disabilities of passengers in an accident being PHP 1,728,127 [39].
The researchers designed an apron bus that can seat 45 passengers, maximizing the number of standing passengers at 26. In the previous study [3], the delay time was reduced to one and a half when the apron bus was designed ergonomically using a two-door approach. The number of passengers at risk of injury, since they are not secured with a safety belt, is equal to eight. The delay time for arrivals and departing aircraft is subtracted by one and a half minutes for the proposed apron bus. The total cost for the proposed apron bus is equal to PHP 8,500,000 since accidents are eliminated with the proposed design of the apron bus, while the total cost for the delay is PHP 11,140,592.06. The total cost-benefit ratio for the proposed apron bus is equal to 1.3107.
The cost of the proposed apron bus was compared to the cost of the proposed public bus for the elderly and PWD, as suggested by Gumasing and dela Cruz in 2017 [11]. The findings indicate that the proposed apron bus’s fabrication cost is higher than the proposed public bus (PHP 8,500,000 vs. PHP 6,134,008). The difference in fabrication costs can be attributed to several factors. Firstly, the cost of materials and labor in the past years has increased annually due to inflation. According to PSA, the retail price growth in construction materials in Metro Manila rose 2.1% yearly over the past three years [40]. Secondly, in the present study, several safety features were added compared to the proposed public bus in a previous study. The added features were wider doors for easier boarding, seatbelts to secure passengers in wheelchairs, powder-coated poles to support standing passengers, more spacious seats to accommodate the luggage and bags of passengers, and safety signs to assist passengers with mobility constraints during the ride.
The effect of redesigning the apron bus is evident in the cost-benefit analysis shown in Table 10. The risk of passenger injury is minimal, the cost of delay for arriving and departing aircraft is reduced, and the apron bus is much safer to ride on. This analysis concludes that redesigning the apron bus has a higher overall value. Although its price is higher, the potential for the cost for aircraft and airlines is minimized. This means that the cost-benefit analysis, which is the proposed apron bus (45 seaters), should be the chosen mode of transportation by the airlines.

5. Discussion

The study showed that the prevalence of musculoskeletal discomfort among apron bus passengers with mobility constraints was medium risk to very high-risk. The results indicated that for elderly passengers, knee and lower back are most prevalent, and most of the passengers are exposed to a medium to high risk of developing musculoskeletal discomfort (MSD). Existing studies have found that age is a significant predictor of musculoskeletal disorders [33,34]. Similarly, in the study by Lal [41], it was found that older persons in the age range between 54–66 experienced the most knee pain and lower back pain. It was also reported that almost one in every three persons over the age of 45 reports some type of knee pain or lower back pain, which increases with age in western countries [42]. Thus, policy measures should be developed to strengthen and improve the mobility of elderly passengers riding public transport, such as apron buses.
The results showed that musculoskeletal discomforts are evident on the lower back and thigh for pregnant women. The study also found that most pregnant passengers are exposed to a medium risk of MSD when riding on an apron bus. According to the Centers for Disease Control (CDC), women experience physiological changes in pregnancy that require special consideration when traveling [43]. This finding is also supported by the U.S. Department of Health and Human Services study, which found pregnant women usually complain of pain that runs from the lower back down to one leg or thigh. This could be attributed to the symptoms of deep vein thrombosis, which results in unusual swelling of the leg and thigh during the 2nd to 3rd trimester of pregnancy [44]. Therefore, a designated seat should be allotted for pregnant women in public transport vehicles such as apron buses.
For mothers carrying infants, it was reported that the body regions with significant discomfort are the arm, shoulder, lower back, buttock, middle back, leg and foot, and knee. It was also recognized that passengers carrying infants are exposed to a medium to high risk of MSD during the apron bus ride. Studies have shown that mothers carrying infants may be more prone to muscle pain that could strain their bodies [45]. Because of the repetitive stress they place on various portions of their bodies, parents who lift, carry, and reach for a child may harm muscles, tendons, and nerves [46]. For this reason, passengers carrying infants must be given seat priority during the apron bus ride to avoid MSD and other accidental injuries.
Lastly, for passengers needing wheelchair assistance, it was found that the body regions with significant musculoskeletal discomfort are the thigh, lower back, middle back, buttock, and leg and foot, and most are exposed to a medium risk for developing MSD. This finding is similar to Gumasing et al.’s [21] study that found PWD passengers experience musculoskeletal discomfort during public transport rides.
Passenger comfort has already been identified as a critical factor in research investigations [47,48,49]. Thus, an ergonomic design of an apron bus should be developed to meet the needs of people with disabilities that will allow PWD to have safe and comfortable mobility during public transport rides. The seat plays a critical role in meeting these comfort requirements [50]. When developing ergonomic seats, the proportions of the seat must be tailored to the anthropometry of the passengers. Passenger seat design based on passenger anthropometry can help reduce fatigue and discomfort when sitting, especially for lengthy periods of time. The present study met its objectives and improved the design of the current public bus in the Philippines in terms of Filipino anthropometric measurement, making it more accommodating to not only ordinary passengers but also passengers with mobility issues. Furthermore, a mobility management program and policy measures should be created to allow passengers to have improved and comfortable mobility during public transport rides.

5.1. Practical Implications

The significant findings of this study shed some light on the relevance of focusing on enhancing the safety and comfort of passengers in an apron bus to enhance customer satisfaction, especially for those passengers with mobility constraints. Moreover, the results of this study will provide transport management companies, such as airline operators and airport authorities, with an effective tool for use in their customer service quality. This could encourage operating companies of public transport to include some of the design components found significant in the study in their customer surveys. As a result, the gap between practitioner demands and scientific research will be met.
This study can be used by bus manufacturers to improve the design of buses and provide bus operators with significant guidance in ensuring the apron bus system’s safety, comfort, and convenience that Filipino commuters deserve.

5.2. Research Limitations

Despite the study’s positive results, a few limitations have to be considered. First, the study only investigated a musculoskeletal disorder risk factor associated with the postural risk of passengers in an apron bus. As a result, other risk factors, such as injuries and accidents during apron bus rides, should also be investigated. An assessment and explanation of the prevalence of MSD risk factors among apron bus passengers would be more thorough if additional risk variables were included. Second, in terms of coverage, the study is limited. Although several apron buses were in the Philippines, this was only carried out in Metro Manila. Thus, future research is suggested to replicate the study using data from various regions to check if the conclusions are consistent. This would also aid in validating the findings and interpretation of the current study. Finally, it is also recommended that other researchers extend the present research work to evaluate all the segments of public transport for the ergonomic design of passenger seats.

6. Conclusions

Due to an apron bus’s limited seating and capacity, passengers are frequently forced to stand. As a result, passengers, particularly those with mobility constraints such as the elderly, pregnant women, mothers carrying infants, and persons needing wheelchair assistance, may be exposed to musculoskeletal discomfort and bodily pain. Key findings from the study revealed that passengers with mobility constraints are exposed to a medium-to-high risk of developing discomfort during the apron bus ride. The result of correlation analysis proved that postural risk scores have a significant relationship to musculoskeletal discomfort, with leg/foot and arm having the strongest association. Thus, to meet the requirements of people with disabilities, the ergonomic design of an apron bus was created to minimize the risk of exposure of passengers to certain musculoskeletal disorders, maximize space, minimize the delay time of the airlines, and be able to prioritize passengers who require mobility assistance. Furthermore, a mobility management program and policy measures should be created to allow passengers to have improved and comfortable mobility during the apron bus ride. The risk of passenger injury is minimal, the cost of delay for arriving and departing aircraft is reduced, and the apron bus is much safer to ride on. The results implied that there would be a greater benefit for PWD passengers and airlines to promote air travel. Finally, the results and design created in this study could be applied and extended among other apron buses worldwide.

Author Contributions

Conceptualization, M.J.J.G.; methodology, M.J.J.G., M.R.I.M.C. and J.B.J.A.; software, M.J.J.G.; validation, R.N., S.F.P., A.K.S.O. and Y.T.P.; formal analysis, M.J.J.G., M.R.I.M.C. and J.B.J.A.; investigation, M.J.J.G., M.R.I.M.C. and J.B.J.A.; resources, M.R.I.M.C. and J.B.J.A.; writing—original draft preparation, M.J.J.G., M.R.I.M.C. and J.B.J.A.; writing—review and editing, R.N., S.F.P., A.K.S.O. and Y.T.P.; supervision, Y.T.P.; funding acquisition, Y.T.P. All authors have read and agreed to the published version of the manuscript.

Funding

This research was funded by Mapúa University Directed Research for Innovation and Value Enhancement (DRIVE) (Funding No. FM-RS-03-02).

Institutional Review Board Statement

This study was approved by Mapua University Research Ethics Committees (application number FM-RC-21-89).

Informed Consent Statement

Informed consent was obtained from all subjects involved in the study.

Data Availability Statement

The data presented in this study are available on request from the corresponding author.

Acknowledgments

The researchers would like to extend their deepest gratitude to the respondents of this study despite the current COVID-19 inflation rate.

Conflicts of Interest

The authors declare no conflict of interest.

References

  1. JICA. JICA’s Information Collection Survey for New Manila International Airport in the Republic of the Philippines. Available online: https://openjicareport.jica.go.jp/pdf/12260477_03.pdf (accessed on 22 October 2021).
  2. Fodness, D.; Murray, B. Passengers’ expectations of airport service quality. J. Serv. Mark. 2007, 21, 492–506. [Google Scholar] [CrossRef]
  3. Delcea, C.; Cotfas, L.-A.; Chiriță, N.; Nica, I. A two-door airplane boarding approach when using apron buses. Sustainability 2018, 10, 3619. [Google Scholar] [CrossRef] [Green Version]
  4. Arabian, A.; Makkiabadi, B.; Masjoodi, S.; Azam, K.; Ghafari, E.; Torabi Nassaj, E.; Zakerian, S.A. Ergonomic assessment of the sit-stand seat on urban bus transport. Iran. J. Ergon. 2019, 7, 11–18. [Google Scholar]
  5. Elvik, R. Risk of non-collision injuries to public transport passengers: Synthesis of evidence from eleven studies. J. Transp. Health 2019, 13, 128–136. [Google Scholar] [CrossRef]
  6. Smith, T.D.; Balogun, A.O.; Yu, Z.; Mullins-Jaime, C. Health, physical activity and musculoskeletal symptoms among stone, sand, and Gravel Mine Workers: Implications for enhancing and Sustaining Worker Health and Safety. Safety 2020, 6, 52. [Google Scholar] [CrossRef]
  7. Boriboonsuksri, P.; Taptagaporn, S.; Kaewdok, T. Ergonomic Task Analysis for prioritization of work-related musculoskeletal disorders among mango-harvesting farmers. Safety 2022, 8, 6. [Google Scholar] [CrossRef]
  8. Deshmukh, P.K.; Shende, A.R.; Akhtar, P.M. Prevalence of musculoskeletal disorders among bus conductors in Nagpur city: An observational study. IP J. Nutr. Metab. Health Sci. 2021, 4, 55–60. [Google Scholar] [CrossRef]
  9. Matsika, E. Interior Train Design of Commuter Trains: Standing Seats, and Consideration for Persons with Reduced Mobility. In Sustainable Rail Transport; Springer: Cham, Switzerland, 2018; pp. 59–75. [Google Scholar]
  10. Dama, K.K.; Babu, V.S.; Rao, R.N.; Madhava Rao, Y. A review on Automotive Seat Comfort Design. Int. J. Eng. Res. 2015, V4, 4. [Google Scholar] [CrossRef]
  11. Gumasing, M.J.J.; Cruz, C.H.C.D. Ergonomic Design of Public Bus in the Philippines with Provision for Senior Citizens and Persons with Disability. In Proceedings of the MATEC Web of Conferences, Johor, Malaysia, 27–28 August 2018; p. 05006. [Google Scholar]
  12. Reyes, C.M.; Reyes, C.C.M.; Arboneda, A.A. Health Practices of Children and Women with Disabilities; PIDS Discussion Paper Series; Philippine Institute for Development Studies (PIDS): Quezon City, Philippines, 2017. [Google Scholar]
  13. Air, C.P. Why Everyone Flies. Available online: http://cebupacific.com.au/cebu-pacific-air-everyone-flies/ (accessed on 22 October 2021).
  14. Wretstrand, A.; Ståhl, A.; Petzäll, J. Wheelchair users and public transit: Eliciting ascriptions of comfort and safety. Technol. Disabil. 2008, 20, 37–48. [Google Scholar] [CrossRef]
  15. Almada, J.F.; Renner, J.S. Public transport accessibility for wheelchair users: A perspective from macro-ergonomic design. Work 2015, 50, 531–541. [Google Scholar] [CrossRef]
  16. Low, W.-Y.; Cao, M.; De Vos, J.; Hickman, R. The journey experience of visually impaired people on public transport in London. Transp. Policy 2020, 97, 137–148. [Google Scholar] [CrossRef]
  17. Ipingbemi, O. Travel characteristics and mobility constraints of the elderly in Ibadan, Nigeria. J. Transp. Geogr. 2010, 18, 285–291. [Google Scholar] [CrossRef]
  18. Broome, K.; McKenna, K.; Fleming, J.; Worrall, L. Bus use and older people: A literature review applying the person–environment–occupation model in Macro Practice. Scand. J. Occup. Ther. 2009, 16, 3–12. [Google Scholar] [CrossRef]
  19. Hwangbo, H.; Kim, J.; Kim, S.; Ji, Y.G. Toward universal design in public transportation systems: An analysis of low-floor bus passenger behavior with video observations. Hum. Factors Ergon. Manuf. Serv. Ind. 2012, 25, 183–197. [Google Scholar] [CrossRef]
  20. verafiles.org. Accessibility, Sensitivity toward PWD Commuters. Available online: https://verafiles.org/articles/accessibility-sensitivity-toward-pwd-commuters (accessed on 22 October 2021).
  21. Gumasing, M.J.J.; Zerrudo, M.O.V.; German, J.D. An Ergonomic Design of Light Rail Transit (LRT) in the Philippines for Persons with Special Needs. In Proceedings of the International Conference on Industrial Engineering and Operations Management (IEOM), Bangkok, Thailand, 5–7 March 2019; pp. 810–818. [Google Scholar]
  22. Andrade, J.I. P1.3b Face-Lift of Oldest PH Airport Terminal 99.5% Complete. Available online: https://newsinfo.inquirer.net/719767/p1-3b-face-lift-of-oldest-ph-airport-terminal-99-5-complete (accessed on 22 October 2021).
  23. Bixley, B.; Yamane, T. Statistics: An Introductory Analysis. Can. J. Econ. Political Sci. 1967, 31, 163. [Google Scholar] [CrossRef]
  24. National Disability Prevalence Survey. Available online: https://www.psa.gov.ph/sites/default/files/2016%20NDPS.pdf (accessed on 16 February 2021).
  25. Li, W.; Yu, S.; Yang, H.; Pei, H.; Zhao, C. Effects of long-duration sitting with limited space on discomfort, body flexibility, and surface pressure. Int. J. Ind. Ergon. 2017, 58, 12–24. [Google Scholar] [CrossRef]
  26. Kiran, D.R. Quality Function Deployment. Total Qual. Manag. 2017, 425–437. [Google Scholar] [CrossRef]
  27. Middlesworth, M. A Step-by-Step Guide to the Reba Assessment Tool. ErgoPlus. 30 January 2020. Available online: https://ergo-plus.com/reba-assessment-tool-guide/#:~:text=The%20REBA%20score%20represents%20the,is%20a%20score%20of%204 (accessed on 29 March 2022).
  28. Del Prado-Lu, J.L. Anthropometric measurement of Filipino manufacturing workers. Int. J. Ind. Ergon. 2007, 37, 497–503. [Google Scholar] [CrossRef]
  29. Country Nutrition Profiles. Global Nutrition Report. Country Nutrition Profiles-Global Nutrition Report. Available online: https://globalnutritionreport.org/resources/nutrition-profiles/asia/south-eastern-asia/philippines/ (accessed on 29 March 2022).
  30. Eaton–Evans, J. Nutritional Assessment/Anthropometry. In Encyclopedia of Human Nutrition; Elsevier: Coleraine, UK, 2005; pp. 311–318. [Google Scholar] [CrossRef]
  31. Wright, F.L.; Green, J.; Reeves, G.; Beral, V.; Cairns, B.J. Validity over time of self-reported anthropometric variables during follow-up of a large cohort of UK women. BMC Med. Res. Methodol. 2015, 15, 1–9. [Google Scholar] [CrossRef] [Green Version]
  32. Pheasant, S. Bodyspace: Anthropometry, Ergonomics and the Design of Work: Anthropometry, Ergonomics and the Design of Work; CRC Press: Boca Raton, FL, USA, 2002. [Google Scholar]
  33. Szeto, G.P.; Lam, P. Work-related musculoskeletal disorders in urban bus drivers of Hong Kong. J. Occup. Rehabil. 2007, 17, 181–198. [Google Scholar] [CrossRef]
  34. Brooks, B. An investigation into aspects of bus design and passenger requirements. Ergonomics 1979, 22, 175–188. [Google Scholar] [CrossRef]
  35. Martinez, A.P.F.; Caingat, A.J.B.; Robielos, R.A.S.; Custodio, B.P. An Ergonomic Assessment of Mass Rapid Transport Trains in Metro Manila, Philippines. In Proceedings of the International Conference on Applied Human Factors and Ergonomics, Washington, DC, USA, 24–28 July 2019; pp. 412–424. [Google Scholar]
  36. ADA.gov. ADA Standards for Accessible Design. 2010. Available online: https://www.ada.gov/regs2010/201n.d.AStandards/2010ADAstandards.htm (accessed on 16 February 2021).
  37. America, A.F. Data & Statistic: Passenger Carrier Delay Costs. Available online: https://www.airlines.org/dataset/u-s-passenger-carrier-delay-costs/ (accessed on 17 February 2021).
  38. Mercene, R.; Delayed Flight at NAIA? just grin. It’s Normal. Available online: https://businessmirror.com.ph/2016/04/20/delayed-flight-at-naia-just-grin-its-normal/ (accessed on 17 February 2021).
  39. De Leon, M.; Cal, P.C.; Sigua, R.G. Estimation of socio-economic cost of road accidents in Metro Manila. J. East. Asia Soc. Transp. Stud. 2005, 6, 3183–3198. [Google Scholar]
  40. Pilar, L. NCR Construction Materials Retail Price Growth Hits 34-Month High. BusinessWorld Online. 27 December 2021. Available online: https://www.bworldonline.com/ncr-construction-materials-retail-price-growth-hits-34-month-high/ (accessed on 30 March 2022).
  41. Lal, A. Musculoskeletal Pain and Level of Educational: Cross-Sectional Study from Ullensaker, Norway. Available online: http://norden.diva-portal.org/smash/record.jsf?pid=diva2%3A724647&dswid=-4392 (accessed on 22 October 2021).
  42. Neogi, T. The epidemiology and impact of pain in osteoarthritis. Osteoarthr. Cartil. 2013, 21, 1145–1153. [Google Scholar] [CrossRef] [PubMed] [Green Version]
  43. Centers for Disease Control and Prevention. Pregnant Travelers; CDC Yellow Book, Oxford University Press, USA, 2020; Chapter 7. Available online: https://wwwnc.cdc.gov/travel/yellowbook/2020/family-travel/pregnant-travelers (accessed on 22 October 2021).
  44. Bunce, E.E.; Heine, R.P. Swelling during Late Pregnancy-Women’s Health Issues. Available online: https://www.msdmanuals.com/home/women-s-health-issues/symptoms-during-pregnancy/swelling-during-latepregnancy (accessed on 21 October 2021).
  45. Lindbeck, L.; Kjellberg, K. Gender differences in lifting technique. Ergonomics 2001, 44, 202–214. [Google Scholar] [CrossRef]
  46. Long Island Spine Rehabilitation Medicine. Are You Suffering Muscle Pain Since Becoming a New Parent? Available online: https://www.lispinemed.com/2020/09/23/are-you-suffering-back-or-muscle-pain-since-you-became-a-new-parent/ (accessed on 22 October 2021).
  47. Stanesby, O.; Morse, M.; Magill, L.; Ball, K.; Blizzard, L.; Harpur, S.; Jose, K.; Lester, D.; Marshall, E.; Palmer, A.J. Characteristics associated with willingness to walk further than necessary to the bus stop: Insights for public transport-related physical activity. J. Transp. Health 2021, 22, 101139. [Google Scholar] [CrossRef]
  48. Kernytskyy, I.; Yakovenko, Y.; Horbay, O.; Ryviuk, M.; Humenyuk, R.; Sholudko, Y.; Voichyshyn, Y.; Mazur, Ł.; Osiński, P.; Rusakov, K.; et al. Development of comfort and safety performance of passenger seats in large city buses. Energies 2021, 14, 7471. [Google Scholar] [CrossRef]
  49. McCormack, G.R.; Ghoneim, D.; Frehlich, L.; Blackstaffe, A.; Turley, L.; Bracic, B. A 12-month natural experiment investigating the impacts of replacing a traditional bus service with bus rapid transit on physical activity. J. Transp. Health 2021, 22, 101239. [Google Scholar] [CrossRef]
  50. Hiemstra-van Mastrigt, S.; Groenesteijn, L.; Vink, P.; Kuijt-Evers, L.F. Predicting passenger seat comfort and discomfort on the basis of human, context and SEAT characteristics: A literature review. Ergonomics 2016, 60, 889–911. [Google Scholar] [CrossRef] [PubMed]
Figure 1. Example of postures evaluated using REBA.
Safety 08 00033 g001
Figure 2. Current Apron Bus Dimensions.
Safety 08 00033 g002
Figure 3. Interior Design of Ergonomic Apron Bus.
Safety 08 00033 g003
Figure 4. Passengers who need Mobility Assistance Area.
Safety 08 00033 g004
Figure 5. Seat Design.
Safety 08 00033 g005
Figure 6. Exterior Design.
Safety 08 00033 g006
Table 1. Descriptive statistics of the demographic profile of respondents.
VariableCharacteristicsFrequencyProportion
GenderMale6644%
Female8356%
Age20 and below11%
20–39 years old7047%
40–59 years old3020%
60 and above4832%
NationalityFilipino14295%
Foreigner75%
Employment StatusStudent53%
Employed6242%
Self-employed5436%
Retired2819%
Purpose of TravelLeisure11879%
Business1913%
Personal128%
Frequency of Travel in the last two years1–3 times8557%
4–6 times4228%
7–9 times128%
10 or more times107%
Frequency of riding an apron bus in the last two years1–3 times10772%
4–6 times2215%
7–9 times1812%
10 or more times21%
Duration of travel in apron bus per ride15 min or less53%
15–30 min8557%
30 min or more5940%
Table 2. REBA Score Analysis.
Final ScoreRisk LevelAction
1Negligible riskNo action required
2–3Low riskChange may be needed
4–7Medium riskFurther investigation, change soon
8–10High riskHigh risk, investigate and implement change
11+Very high riskImplement change
Source: www.ergo-plus.com (accessed on 29 March 2022) [27].
Table 3. Average Discomfort Scores of Passengers with Mobility Constraints.
Body PartMobility Constraints
ElderlyPregnantCarrying InfantsWheelchair Assistance
MeanStd. Dev.MeanStd. Dev.MeanStd. Dev.MeanStd. Dev.
Head and Neck1.670.881.941.122.15 0.902.06 0.93
Shoulder1.880.892.031.173.87 0.922.45 0.96
Arm1.961.052.061.003.95 0.832.10 1.08
Middle Back2.381.042.391.052.951.192.940.85
Lower Back2.730.823.160.783.051.153.031.17
Buttock2.251.022.291.043.001.402.901.08
Thigh2.291.072.870.962.461.073.061.21
Knee2.810.842.261.212.641.202.391.38
Leg and Foot2.421.162.391.232.971.442.611.26
Table 4. Summary of REBA Scores of Passengers with Mobility Constraints.
REBA Score (Risk Category)Frequency (%)
ElderlyPregnantCarrying InfantsWheelchair Assistance
1 (negligible)0 (0%)0 (0%)0 (0%)0 (0%)
2–3 (low risk)1 (2%)1 (3%)0 (0%)3 (10%)
4–7 (medium risk)33 (69%)28 (90%)25 (64%)27 (87%)
8–10 (high risk)14 (29%)2 (6%)14 (36%)1 (3%)
11+ (very high risk)0 (0%)0 (0%)0 (0%)0 (0%)
Total48 (100%)31 (100%)39 (100%)31 (100%)
Table 5. Summary of REBA Scores of Passengers with Mobility Constraints.
RelationshipPearson Correlation (r)95% CI for pp-ValueStrength of Relationship
REBA score → head and neck discomfort0.351(0.201, 0.484)<0.001Moderate
REBA score → shoulder discomfort0.451(0.312, 0.570)<0.001Moderate
REBA score → arm discomfort0.514(0.385, 0.623)<0.001High
REBA score → middle back discomfort0.430(0.289, 0.552)<0.001Moderate
REBA score → low back discomfort0.310(0.157, 0.448)<0.001Moderate
REBA score → buttock discomfort0.491(0.358, 0.604) <0.001Moderate
REBA score → thigh discomfort0.317(0.165, 0.455)<0.001Moderate
REBA score → knee discomfort0.494(0.362, 0.607)<0.001Moderate
REBA score → leg and foot discomfort0.521(0.393, 0.629)<0.001High
Table 6. Anthropometric measurement for Filipino population.
Anthropometric Measurement (cm) Male (n = 843)Female (n = 962)
Mean5th PercentileMedian95th PercentileStd. Dev.Mean5th PercentileMedian95th PercentileStd. Dev.
Standing shoulder height137.45128.00137.00148.006.07127.21118.00127.00136.005.80
Standing elbow height104.1496.50104.00112.806.7296.2889.0097.00104.007.39
Elbow-elbow breadth30.5732.0031.0048.002.0728.8530.0029.0046.001.68
Buttock-popliteal length46.4041.0046.0052.003.7245.1440.0045.0051.003.69
Popliteal height43.3339.0043.0047.002.5740.3436.0040.5044.002.90
Step height27.6716.0028.0040.007.7925.6314.5825.0037.009.11
Lower arm length25.8321.1025.0030.004.4124.1620.0024.0030.704.18
Hand breadth9.808.004.0711.004.079.237.508.5010.006.97
Grip strength40.6425.2041.0054.809.3522.3613.0022.0031.008.89
Table 7. Recommended Anthropometric Measurement of Apron Bus.
Apron Bus DimensionActual MeasurementDimension ReferencePercentileRecommended Measurement
Side Door Handle60 cmStanding elbow height5th % F to 95th % M89 cm to 112.8 cm
Chair Handles25 cmStanding elbow height5th % F89 cm
Handle Bar Circumference23 cmHand breadth5th % F9.23 cm
Ramp Width65 cmWheelchair widthMaximum width + allowance91.4 cm
Door Width65 cmWheelchair widthMaximum width + allowance91.4 cm
Step Height23 cmStep height5th % F14.58 cm
Floor to Handle Height175 cmStanding shoulder height + lower arm length5th % F118 cm + 20 cm = 138 cm
Gap between Seat to Seat74 cmSeat depth + leg room95th % M40 cm + 59 cm = 99 cm
Seat Depth38 cmButtock popliteal length5th % F40 cm
Leg Room22 cm(Buttock popliteal length + popliteal height) − seat depth95th % M(52 cm + 47 cm) − 40 cm = 59 cm
Back Seat Height80 cmStanding shoulder height − buttock popliteal length − popliteal height5th % F118 cm − 40 cm − 36 cm = 42 cm
Seat Width42 cmElbow to elbow breadth95th % M48 cm
Seat Height47 cmPopliteal height5th % F36 cm
Table 8. Summary of Passenger Safety and Accessibility Survey.
Passenger Safety
MeanTotal Weight
Door Material2.8213.64%
Seat Material2.366.06%
Handrail Material2.5516.67%
Floor Material2.571.52%
Passenger Accessibility
Aisle Space2.463.03%
Wheelchair Lockdown Area2.697.58%
Door Width2.4910.61%
Door Height2.414.55%
Seat Depth2.9015.15%
Seat Width312.12%
Handrail Length2.699.10%
Table 9. Summary of Failure Modes and Effect Analysis.
PartsTotal RPN of Current DesignTotal RPN of Proposed Design% Improvement
Passenger Seat521080.77%
Handrail and Hand strap622067.74%
Wheelchair Lockdown24387.50%
Baggage Area432053.49%
PWD Area18666.67%
Step Height18383.33%
Bus Door12283.33%
Overall Total2296472.05%
Table 10. Cost-Benefit Analysis of Proposed Apron Bus.
Alternative 1: Proposed Apron Bus (Seats 45 Passengers)
CostAmount (Php)BenefitAmount (Php)
Designing the Proposed Apron Bus that sits a maximum of 45 passengersPHP 8,500,000Cost of Delay (Arriving)/Day3675.55 × 7.314 min × 250 = PHP 6,720,743.18
Cost of Delay (Departing)/Day3675.55 × 4.81 × 250 = 4,419,848.88
Total Cost₱ 8,500,000Total Benefit₱ 11,140,592.06
Cost-Benefit Ratio1.3107
Publisher’s Note: MDPI stays neutral with regard to jurisdictional claims in published maps and institutional affiliations.

