Article

Bus Crash Severity in Hanoi, Vietnam

1
Faculty of Transport—Economics, University of Transport and Communications, Hanoi 100000, Vietnam
2
AME-DEST, Université Gustave Eiffel, IFSTTAR, F-77447 Marne-la-Vallée, France
*
Author to whom correspondence should be addressed.
Safety 2021, 7(3), 65; https://doi.org/10.3390/safety7030065
Submission received: 9 August 2021 / Revised: 14 September 2021 / Accepted: 16 September 2021 / Published: 21 September 2021

Abstract

:
Recently, there has been an increasing interest in targeting the safety of bus operations worldwide; however, little is known about the determinants of the bus crash severity in developing countries. By estimating an ordered logit model using the bus-involved collision data in Hanoi (Vietnam), spanning the period from 2015 to 2019, this study investigates various factors associated with the crash severity. The results reveal that the severity risk increases for (1) large buses, (2) raining conditions, (3) evening or night, (4) sparse traffic, (5) non-urban areas, (6) roads with at least three lanes, (7) curved roads, (8) two-way roads without a physical barrier, (9) head-on collision, and (10) pedestrian-related crashes. Aside from confirming the crucial roles of a wide range of factors, this research has examined the effects of two determinants (traffic density and crash area) that have not been considered for the cases of developing countries previously. Based on the findings on the impacts of factors, a series of policy recommendations regarding improving road conditions in non-urban areas, promoting walking infrastructure, reminders of high-risk situations for drivers, safety notes when improving bus service quality, and recording bus-related crashes are proposed.

1. Introduction

Buses are considered as the backbone of all urban public transport systems in that they are most affordable, established shortly, and operated straightforwardly in comparison with modern and high(er)-capacity modes, such as urban rail lines [1]. As synthesized by Pojani and Stead [2], an effective bus system is central to the economic growth and sustainable development of urban transport of megacities thanks to its contributions to mitigating traffic congestion [3], deploying the limited urban land resources [4], promoting walking [5,6], providing more travel options for the poor, and lessening social exclusion [7], not to mention creating more jobs [8]. Compared to developed economies, the bus’s role in emerging countries is more prominent since the construction of rail-based transit is blocked or delayed due to financial, technological, and legislative limitations [9,10,11]. Unfortunately, the use of bus services in these countries would be relatively dangerous [2,12,13]. High bus-involved collision rates are reported in India, Nepal, Tanzania, Zimbabwe [14], Bangladesh [15], Lebanon [16], and Ghana [17]. To formulate appropriate policies towards lessening the considerable repercussions of crashes in emerging countries, earlier authors have researched factors associated with the severity of bus-related crashes (i.e., Bangladesh [15] and Ghana [17]). Notwithstanding, as argued by Sam et al. [17], the extant literature about the factors in developing countries is much less than that in developed countries [18,19,20,21,22]. This would cause difficulties in identifying crucial factors determining the bus crash severity in developing nations-in other words, knowledge on the determinants of bus crash severity has remained inadequately handled in such countries.
Vietnam, one of the most populous members of the Association of Southeast Asian Nations (ASEAN), has been achieving robust economic growth recently [23]. Aside from positive impacts, this development has led to the heavy use of private motorized transportation, thereby contributing to severe challenges (e.g., congestion, air pollution, fossil fuel consumption, and road crashes), particularly in Hanoi, the capital of Vietnam [24,25,26,27,28,29,30,31,32,33]. To form sustainable urban transportation, the Hanoi government has attempted to strengthen public transport by establishing mass rapid transit with urban rail lines and BRT corridors. Unfortunately, after over 10 years of planning and construction, two rail routes have not run yet, while the current performance of the BRT system is still limited [9,34,35]. Consequently, the subsidized bus has been the only means of public transport in Hanoi. The Hanoi bus is a model for other Vietnamese provinces because routes are equipped with high-quality vehicles and offer cheap ticket prices with discounts for students and the elderly owing to being subsidized. The 2002–2012 period is the golden age of the bus industry, meeting over 10% of daily trips [36]. However, the bus ridership stabilized during the three following years before significantly declining from 2015 to 2018. Recently, the patronage has recovered but mainly due to the extension of the network rather than the improved loading factors of existing routes. One of the chief reasons for the deteriorated attraction of the Hanoi bus is the increased opposition to the bus’s benefits, particularly the safety [37,38,39]. Hence, researching and promoting the safety of bus operations are highlighted as a top goal in the further development of public transport [40]. Some authors recruited small samples containing drivers, passengers, and riders to investigate factors influencing the occurrence of bus-related crashes in qualitative analyses [41,42]. Nevertheless, little is known about factors associated with the severity of bus-specific collisions in the capital.
This current study aims at partly filling the abovementioned gaps by carrying out a quantitative study using the 5-year metadata of collisions occurring on subsidized bus routes in Hanoi to investigate factors determining the levels of severity. The findings of this research deepen the literature on public transport-related crashes in a number of ways. First, this study is based in Hanoi, a typical megacity of a developing country in the Global South [11]; therefore, the findings would be representative and useful for other cities in the same area. Second, the findings make an important contribution to research factors in the bus crash severity in developing countries by demonstrating the impacts of two new factors (traffic density and crash area). Third, this research has proposed a series of policy recommendations to reduce the risk of bus crash severity.
The remaining part of the paper proceeds as follows. Section 2 reviews relevant studies on bus-involved crash severity. Subsequently, Section 3 is concerned with the collection of bus crash data in Hanoi coupled with the methodology used for this study. The following part moves on to describe the results in detail and discuss them rigorously. The last section recapitulates key findings and suggests recommendations together with future research directions.

2. Literature Review

In accordance with the objective of this research mentioned above, the authors have searched for the extant literature on bus safety. Prior studies have concentrated on three main topics, including bus injury characteristics, bus crash frequency/occurrence, and bus crash severity [22]. Among them, the last has attracted the least attention with nine studies [15,17,18,19,21,43,44,45,46]. Based on the synthesis presented in Table 1, some main points can be achieved, as follows.
Over the past few decades, the literature on the analysis of bus crash severity has emerged considerably in developed countries with much-updated knowledge from South Korea [21,46], the US [18,43,44], Canada [45], and Denmark [19]. Notwithstanding, the same is not true for developing countries with only two reports. While Sam et al. [17] present findings of exploratory variables of the bus crash severity occurring between 2011 and 2015, Barua and Tay [15] use the 1998–2005 data to identify factors influencing bus injury severity in Bangladesh.
Up to now, factors associated with the severity of bus crashes can be divided into seven groups, including (1) temporal characteristics, (2) location and infrastructure characteristics, (3) service and vehicle characteristics, (4) traffic characteristics, (5) crash characteristics, (6) weather characteristics, and (7) driver characteristics and behaviors (see Table 1). As regards temporal characteristics, an upward trend in the severity of bus crashes over time is found in Bangladesh [15], while crashes occurring on weekends, with reference to weekdays, are associated with an increase in the severity in Ghana [17]. Season and time of day are considered in some studies carried out in developed countries [21,44,45]. Location and infrastructure characteristics are known to play a pivotal role in determining the severity, albeit with some mixed findings. For example, a curved road has a positive association with the bus crash severity in Ghana [17]; however, an opposite association is reported in the US [44]. Area of crash is found to be a predictor of bus collision severity in developed countries [19,44]; yet, it has never been included in studies based in developing countries. When it comes to variables related to bus and service type, small buses (mini-buses) are more inclined to be involved in less severe collisions in both developing [17] and developed countries [21]. With regard to traffic characteristics, the presence of traffic control contributes to a decrease in the level of severity in both emerging [15,17] and developed countries [45,46]. Notably, no study of a developing country has given consideration to traffic volume, although this variable is found to be an influencing factor in the case of South Korea [21]. Variables in terms of crash characteristics are substantially tested in previous research with the widespread agreement with high severity involved in head-on collisions and hit-pedestrian crashes [15,17,18,19,44]. Yet, Tamakloe et al. conclude that relative to vehicle-vehicle crashes, vehicle-pedestrian ones are more likely to be less severe [21]. Weather conditions are an underlying factor for the bus injury severity in South Korea, Canada, the US, and Denmark [18,19,21,45,46] and only in one developing country (Ghana) [17]. Because of the existence of collinearity between weather conditions and surface/pavement conditions (e.g., dry, wet) [18], only one of them is considered in each study. Drivers’ characteristics and behaviors (e.g., driver’s age, gender, drunk driving, possession of driving license, crash history) are widely demonstrated to be significant exploratory variables [17,18,19,21,46]. However, such variables may not be available for the case of developing countries (e.g., Bangladesh [15]) where limitations of collecting and storing crash profiles are an unresolved long-lasting problem [13]. The use of variables representing the characteristics and behaviors of drivers of other vehicles involved in crashes are feasible solely for a few studies in developed countries with excellent safety programs [18,19] and thus are not considered here. The review of factors emphasizes that understandings about factors governing the severity of bus collisions in developing countries are fairly poor with the obvious lack of confirmation of findings, thereby leading to difficulties in identifying crucial predictors of the severity. The transferability of the knowledge and conclusions on factors drawn from developed countries to developing ones would be limited to some extent owing to differences in urban transport conditions.
A range of models has been made for modeling bus crash severity. The choice of model type depends largely upon how to define the dependent variable. Since the share of fatal collisions is extremely small, Rahman et al. estimate a logit model to examine factors contributing to a binary outcome, including property-damage-only level and injury level [45]. In other studies, for analyzing dependent variables with more than two categories, the use of binary logit is inappropriate. Chimba et al. [43] estimate two multinomial logit models to quantify the predictors’ injury severity impacts on level 1 (non-incapacitating injury) and level 2 (incapacitating injury) compared to level 0 (non/possible injury), respectively. One major drawback of multinomial logit is to ignore the ordinal attribute of the severity. To give an illustration, the impacts of the predictors on level 1 compared to level 2 are disregarded in [43]. Another weakness is difficulties in interpreting the effects of independent variables when the number of models increases in accordance with the number of severity levels considered. Due to such disadvantages, multinomial logit has not been used further yet. The ordered logit/probit-based method is the most popular. The ordered logit/probit model, proposed by Walker and Duncan [47], is demonstrated to be well suited for analyzing ordered variables whose values are large, such as the severity [15,44,46]. However, the use of ordered logit requires the assumption of the equality of the log odds ratio over all the cut-off points (i.e., the proportional odds assumption). Unfortunately, this assumption is frequently violated in previous studies considering four or five values of the severity; thus, generalized ordered logit, which was developed by Williams [48], is used as an alternative [17,18,19]. Recently, Tamakloe et al. [21] introduced a bivariate copula-based methodology to model both crash size and crash severity jointly and characterize the dependence between them.

3. Data and Method

3.1. Data Collection

The research area of this study is Hanoi, the capital of Vietnam, with a population of approximately 8 million inhabitants. The only public transport mode in Hanoi is the bus system (BRT included), with over 110 subsidized routes. The Hanoi bus, although considered as the model for the development of the bus industry in Vietnam, is confronting a number of big challenges, one of which is the lack of safety caused by the run of buses. Risky travels of buses are blamed for fear of both riders and passengers, contributing to the continuous decrease in ridership from 2015 to 2018 [37,39].
To collect data for this study, the authors first thought about requesting support from the police department. However, this way was unfeasible in that the department only had records of serious crashes occurring in Hanoi but not minor collisions. In addition, the inconsistencies in analyzing and storing information were a barrier. Accordingly, the authors decided to directly approach bus companies to gather collision-specific profiles through the assistance of TRAMOC (TRAMOC is the Hanoi Urban Transport Management and Operation Centre under the Department of Transport and entrusted with managing, planning, enhancing public transport network, and allocating subsidies). As bus companies manage and operate their vehicles, almost all bus-related collisions and collisions were recorded in a relatively detailed way. The authors worked with bus providers from September to December 2020 to collect the collision data of subsidized bus routes in Hanoi from 2015 to 2019. The data of 2020 were excluded since the bus operation within this period were largely affected by the social distancing directive mandated to stop the transmission of COVID-19 [49,50,51,52].
Initially, all details of crashes were collected from companies. Afterward, all variables whose information was not available in at least the database of one company were disregarded. Consequently, 14 exploratory variables were extracted, including (1) bus capacity, (2) weather, (3) light, (4) traffic density, (5) area, (6) lane per direction, (7) road alignment, (8) road type, (9) collision manner, (10) collision type, (11) time of day, (12) day of the week, (13) driver’s age, and (14) proximity to intersection. One three-level dependent variable extracted was the crash’s magnitude, defined as whether there were deaths, hospitalized or injured persons, or only damage of vehicles. Through eliminating observations with missing information, finally, of 535 crashes caught from bus enterprises, 529 were eligible for further analyses.

3.2. Method

As mentioned in Section 2, the two choices used most frequently in prior studies are the ordered logit/probit model and the generalized ordered logit model. The ordered logit/probit model, one of the most popular methods for analyzing ordinal outcome variables [53], is usually tested first. In case the proportional odds assumption is violated, the generalized ordered logit model, where the assumption is relaxed [48], is advisable as an alternative. A test devised by Brant (the Brant test) is commonly carried out to check the appropriateness of the ordered logit/probit model. A significant value for this test reflects a violation of the assumption.
In this study, collision severity is categorized into three levels, with the higher level pertaining to a more severe collision (i.e., Minor or damage-only collision, Injured or hospitalized collision, or Fatal collision). To select relevant predictors of the severity, using Stata 15.0, a full model encompassing the 14 independent variables mentioned in Section 3.2 was fitted. Subsequently, insignificant variables in the full model were disregarded. The final list containing 10 potential predictors was considered in an ordered logit model, with the outcome being the three-level bus crash severity. As expected, all 10 independent variables were significant while the Brant test’s result was insignificant; therefore, the ordered logit model fitted was adequate for this study. For an analysis of factors using logit modeling, multicollinearity, defined as the high correlation between exploratory variables, may result in unstable and biased standard errors and thus unstable values of p, which is the base for evaluating the statistical significances of independent variables [54]. To diagnose the presence of multicollinearity, variance inflation factors (VIFs) were calculated. The recommended values of VIFs for the absence of multicollinearity are under 4 [55].
This paper presents the result of a research project that was evaluated and given ethics approval by the Department of Science and Technology under the University of Transport and Communications.

4. Results and Discussion

4.1. Descriptive Results

Table 2 describes the data used for this research. Medium buses with a capacity of 40–60 were involved in the majority of road collisions (76.9%), while large ones accounted for the fewest collisions (9.3%). About 40% of the crashes occurred in rainy conditions. Nearly half (46.7%) and 34.4% were recorded during adequate light conditions (i.e., day and night with light, respectively). Approximately 20% took place in locations with poor or no light. Most collisions happened in the normal (50.5%) and dense (38%) traffic density. The main areas of crashes pertained to central districts (52.4%) and suburbs (36.3%). As regards road characteristics, many more collisions occurred in one–two-lane roads (76.6%), in straight roads (66%), and two-way roads without physical barriers (52.4%). Head-on collisions made up the largest percentage (40.5%), followed by read-end (34.4%) and side ones (25.1%). Unsurprisingly, numerous collisions (55%) were involved in motorcycles that are the dominant mode in Hanoi [36]. On the contrary, a tiny minority of the crashes (6.2%) are related to pedestrians.
There was an opposite relationship between the number of collisions and the extent of these. In particular, minor or damage-only collisions constituted 60%, this was double the figure for injured and hospitalized ones (31.2%). Fatal crashes made up 8.3% of the collision outcomes.

4.2. Factors Associated with the Bus Crash Severity

The ordered logit model for the bus severity is summarized in Table 3. The model’s goodness of fit with Pseudo R2 being 0.2066 is within the recommended range (i.e., from 0.2 to 0.4) by Hensher et al. [56]. The Brants test is not significant at the 0.05 level of significance, demonstrating the inexistence of violating the proportional odds assumption. Hence, the use of the ordered logit model for analyzing factors associated with the bus crash severity in the case of Hanoi is appropriate. The VIFs of all predictors (Appendix A) are around one; therefore, the concern about multicollinearity is relieved.
Bus capacity is a statistically significant but weak predictor. Crashes that involved large buses (coef = 0.542, p = 0.098) are associated with higher severity risk compared to those associated with small (mini-bus) buses. This result is similar to the findings from Ghana [17] and South Korea [21]. By contrast, it is incompatible with the positive relationship between vehicle size and safety degree. Elvik et al., based on the knowledge attained from 128 road safety measures, state that large vehicles have better protection against injury [57]. The higher risk relative to large buses would result from the speed. Big buses are usually allocated on long routes connecting from urban to non-urban areas with high travel demand, while small ones mainly operate in central districts on short routes. As a result, big buses tend to run at a higher speed. The positive correlation between traveling speed and collision severity has been well demonstrated [46,58,59].
The model result indicates that rain (coef = 0.507) has a positive effect on collision severity. This finding supports the existing reports on the effects of surface status on the severity [17,18,19,45,46]. By way of illustration, relative to dry surfaces, slippery circumstances raise the likelihood of light injuries by 8.7%, severe injuries by 13.4%, and deaths by 16% [19]. However, the weather is not a significant variable of the severity in South Korea [21].
In line with [17,18,45], with respect to daylight, night with (coef = 1.362) or without (coef = 1.602) adequate illumination increases the probability of higher severity risk. Likewise, Feng et al. conclude that driving in the evening and at night increases the crash severity [44]. The reason would be that drivers may confront difficulties in visibility, hazard perception, drowsiness, and even drunk driving during the night [60,61]. According to [62], the highest collision risk and the high odds ratio for fatal crashes are witnessed at 4 am. It is important to note that almost all bus routes in Hanoi close at around 10 pm to meet the (relatively) late travel demand.
Traffic density is a contributing factor in the severity. Crashes occurring in the sparse traffic would be more severe than those in the normal (coef = −0.486, p = 0.088) and dense (coef = −0.710) traffic volumes, albeit with a weak relationship for the former. This result is in agreement with [43]. Similarly, Tamakloe et al. show that increases in traffic volume and the proportion of trucks lead to an increase in crash severity [21]. A plausible explanation for this result is that when traffic volume is denser, traveling speed declines, thereby causing a higher likelihood of collisions but with less severe injuries [63].
Compared to crashes occurring in the urban areas, those happening in suburban (coef = 0.958) and rural (coef = 1.437) areas tend to be more severe. This result is in line with those found in [19,44]. The interpretation would be that non-urban roads in Hanoi are larger, with less traffic and a higher speed limit. These conditions enable buses to run faster [64] with less pressure on drivers that may cause the feeling of over relaxed and indulge in risky driving, thereby leading to more severe crashes [65]. Moreover, these roads are more poorly illuminated. In this sense, the area-related result is more or less compatible with the abovementioned findings regarding light conditions and traffic density. Another plausible explanation is the much longer length of routes mainly running in non-urban areas compared to that of routes primarily operating in urban districts [39]. The longer driving distance may make a driver fatigued, thereby encouraging an error of his/her judgment of the speed and the distance of an oncoming vehicle [66].
The number of lanes per direction has been demonstrated as a crucial factor affecting the bus-involved collision severity [18,44,45]. Supporting the positive association of the number of lanes with the severity risk, this study found a road with at least three lanes (coef = 0.858) increases the probability of higher crash severity compared to that with fewer lanes. A possible explanation would be the nature of bus operation. Specifically, more lanes would require buses to change directions more to access stops, which may lead to a higher likelihood of collision with other vehicles and riders.
Road alignment has a weak and significant effect on the severity of bus crashes, with higher severity involved with a curved road (coef = 0.325, p = 0.095). A couple of studies on bus-involved collision severity report the same results [17,18,46]. This finding is supported by more severe crashes occurring on curved roads than straight roads due to difficulties in controlling vehicles [67]. However, an opposite conclusion has been published in [44] wherein bus crashes occurring on curved roadways have less probability of being more serious than those occurring in straight roadways. Road alignment is not a predictor of bus crash severity in [21].
Two-way roads without a physical barrier has a positive and significant coefficient (coef = 0.511) with the crash severity compared to one-way roads/two-way roads with a physical barrier. Two-way traffic increases the chances of head-on collisions, which is usually severe. A lot of research confirms the positive relationship between two-way traffic and higher collision severity [15,18]. Furthermore, the finding of this study also supports the importance of the median barrier in terms of limiting the severity of bus-related crashes. The presence of a median, thanks to eliminating the risk of head-on collisions, is positively associated with a reduction in fatalities [18] and in the crash severity [15,17]. Yet, the availability of fixed concrete median barrier is an insignificant variable in modeling crash severity in [21].
In regards to collision manner, based on previous evidence [17,44,45], unsurprisingly, head-on crashes are more severe than side (coef = −1.462) and rear-end (coef = −0.791) ones. The high severity of head-on crashes would be owing to the high level of speed differential. As a typical example, head-on crashes made up under 5% of the crashes but account for nearly half of all fatalities in Maine [68]. However, Barua and Tay could not find a statistically significant difference in the severity between head-on and rear-end crashes [15].
Pedestrians are the most vulnerable road users who are more likely to suffer from more severe injuries in bus-involved crashes, especially compared to motorcycle riders [15,17,18,19]. This study confirms the aforementioned conclusion through the negative coefficients for motorcycles (coef = −0.589, p = 0.096) and others (coef = −0.663, p = 0.065); however, these effects are weak at the 0.1 level of significance. This result would stem from the unsafe behaviors of some pedestrians and the poor provision of walking infrastructure (Figure 1). Notably, this finding is in disagreement with [21], identifying that vehicle-pedestrian crashes are more likely to be less severe than vehicle-vehicle ones. The reason would be that the 2020 research studies buses running on expressways limiting the access of pedestrians. Additionally, the classification of the severity, in this case considers, both the cost of damage and the loss of lives. Therefore, most collisions involved in pedestrians and no death are less severe than vehicle-vehicle crashes. Similarly, the involvement of a motor vehicle relative to a pedestrian increases the risk of higher severity [44].

5. Conclusions

By estimating an ordered logit model using the bus-involved crash data in Hanoi spanning the period from 2015 to 2019, this study investigates various factors associated with the crash severity. The results reveal that the severity risk increases for (1) large buses, (2) raining conditions, (3) evening or night, (4) sparse traffic, (5) non-urban areas, (6) roads with at least three lanes, (7) curved roads, (8) two-way roads without physical barriers, (9) head-on collisions, and (10) pedestrian-related crashes. Most findings from this research are consistent with previous empirical evidence found from developing countries. In this way, this research confirms crucial factors determining the severity of bus-related crashes, thereby encouraging an exchange of practical experience and knowledge on effective measures for promoting bus safety among developing countries. Another contribution of this study is to examine and identify the effects of two factors (i.e., traffic density and crash area) previously considered in studies based in developed countries but not in developing countries. Moreover, the inconsistency of impacts of some factors (e.g., road alignment, vehicles/users involved in crashes, and weather) between Hanoi and research conducted in some developed countries emphasize that the copy of measures issued and implemented successfully in developed countries for developing countries may end in a waste of limited resources. Based on the abovementioned findings on factors, some policy recommendations are proposed as follows:
-
The results regarding head-on crashes, the absence of the median, and the area of crashes highlight the importance of promoting road conditions in the suburban and rural areas by taking practical measures, such as constructing the median and providing good illumination. This is vital in case the local government desires to extend the coverage of the bus network to attract more travelers in non-urban areas.
-
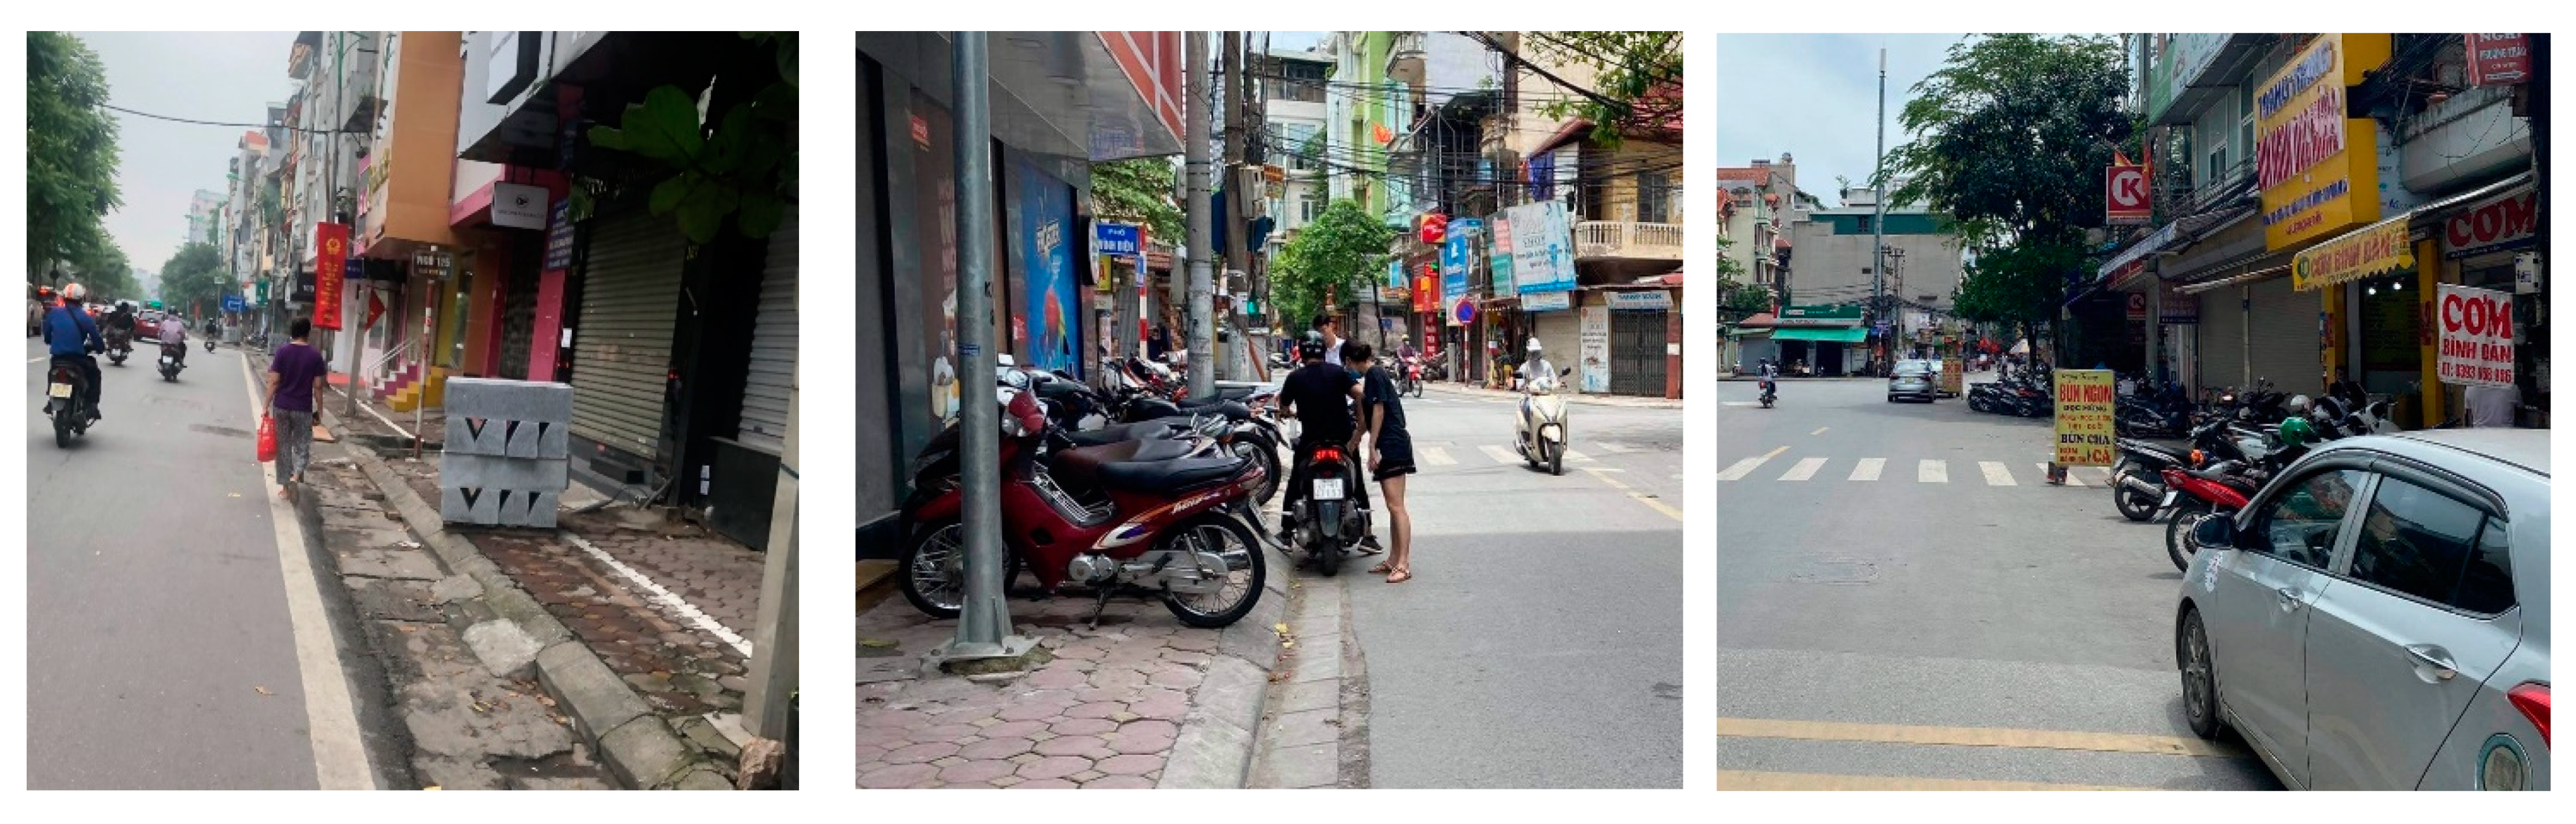
Many pavements are used (illegally) by street vendors and for the parking of motorcycles, leading pedestrians to walk on the roads [36]. This imposes a major threat of collisions between pedestrians and buses. Furthermore, facilities, such as crosswalks close to intersections under the constructing overhead metro lines, are so poor that the lives of pedestrians are in danger when crossing the roads. Accordingly, to limit pedestrian-bus crashes, the authorities should enhance the enforcement of pavements and the quality of facilities for pedestrians. Additionally, they may need to establish traffic lights dedicated to pedestrians and/or overground bridges adjacent to bus stops with high volume and/or in the proximity of metro/BRT stations.
-
In connection with the desire to improve service quality, the local transport authorities have an intention of extending working hours through closing bus routes later (around 11 pm instead of 10 pm now). In order to achieve success, this plan should consider solutions to ensure the safety of bus operations at night.
-
There is a need to promote the collection of characteristics of bus-involved crashes. In particular, a consistent form of the crash profile should be created and applied widely, thereby allowing a more rigorous and effective evaluation of factors associated with the bus crash severity.
-
Reminders of the increased risks of collisions in the case of rain and curved roads should be provided for bus drivers frequently and periodically.
-
As current programs and policies focus primarily on general road safety rather than on public transport, it would be essential to formulate bus-specific campaigns to improve bus safety.
Two main limitations should be taken into consideration when interpreting and comparing the findings of this study as follows. First, the data of this study were collected separately from different bus companies in Hanoi instead of based on a systematic collection of a dedicated agency, such as traffic police. Therefore, the quality of data would be problematic to some extent. However, after the rigorous procedures of data collection recovery, the data used in this research would be adequate. Second, some predictors (e.g., drivers’ behaviors, traffic control) demonstrated to be crucial in modeling bus collision severity previously could not be included in this study due to the limitation of the database used. Further research should assess the impacts of various potential factors both regarded and disregarded in this study to deepen the understanding of bus-related crashes in developing countries.

Author Contributions

Conceptualization, T.C.N., M.H.N. and J.A.; methodology, T.C.N., M.H.N. and J.A.; formal analysis, T.C.N., M.H.N. and T.T.H.; investigation, M.H.N. and T.T.H.; writing—original draft preparation, T.C.N. and M.H.N.; writing—review and editing, all authors; funding acquisition, T.C.N. All authors have read and agreed to the published version of the manuscript.

Funding

This research is funded by University of Transport and Communications (UTC) under grant number T2021-KT-001TD.

Institutional Review Board Statement

This paper presents the result of a research project that was evaluated and given ethics approval by the Department of Science and Technology under the University of Transport and Communications.

Acknowledgments

The authors highly appreciate constructive comments of three anonymous reviewers and the editors. This research is funded by University of Transport and Communications (UTC) under grant number T2021-KT-001TD.

Conflicts of Interest

The authors declare no conflict of interest.

Appendix A

Table A1. Collinearity diagnostics.
VariableVIFSQRT VIFToleranceT-Squared
Light1.101.050.91070.0893
Bus capacity1.031.020.97500.0250
Collision type1.081.040.92510.0749
Weather1.081.040.92370.0763
Area1.111.050.89910.1009
Lane per direction1.121.060.89070.1093
Road alignment1.101.050.91280.0872
Collision manner1.111.050.90470.0953
Traffic density1.031.010.97350.0265
Road type1.011.000.99220.0078
Mean VIF1.08

References

  1. Babalik-Sutcliffe, E.; Cengiz, E.C. Bus Rapid Transit System in Istanbul: A Success Story or Flawed Planning Decision? Transp. Rev. 2015, 35, 792–813. [Google Scholar] [CrossRef]
  2. Pojani, D.; Stead, D. Sustainable Urban Transport in the Developing World: Beyond Megacities. Sustainability 2015, 7, 7784–7805. [Google Scholar] [CrossRef] [Green Version]
  3. Nguyen-Phuoc, D.Q.; Currie, G.; De Gruyter, C.; Kim, I.; Young, W. Modelling the Net Traffic Congestion Impact of Bus Operations in Melbourne. Transp. Res. Part A Policy Pract. 2018, 117, 1–12. [Google Scholar] [CrossRef]
  4. Cervero, R.; Kang, C.D. Bus Rapid Transit Impacts on Land Uses and Land Values in Seoul, Korea. Transp. Policy 2011, 18, 102–116. [Google Scholar] [CrossRef] [Green Version]
  5. Morency, C.; Trépanier, M.; Demers, M. Walking to Transit: An Unexpected Source of Physical Activity. Transp. Policy 2011, 18, 800–806. [Google Scholar] [CrossRef]
  6. Wasfi, R.A.; Ross, N.A.; El-Geneidy, A.M. Achieving Recommended Daily Physical Activity Levels through Commuting by Public Transportation: Unpacking Individual and Contextual Influences. Health Place 2013, 23, 18–25. [Google Scholar] [CrossRef]
  7. Glaeser, E.L.; Kahn, M.E.; Rappaport, J. Why Do the Poor Live in Cities? The Role of Public Transportation. J. Urban Econ. 2008, 63, 1–24. [Google Scholar] [CrossRef]
  8. Taylor, B.D.; Samples, K. Jobs, Jobs, Jobs: Political Perceptions, Economic Reality, and Capital Bias in U.S. Transit Subsidy Policy. Public Work. Manag. Policy 2002, 6, 250–263. [Google Scholar] [CrossRef]
  9. Nguyen, M.H.; Pojani, D. Chapter Two—Why Do Some BRT Systems in the Global South Fail to Perform or Expand? In Preparing for the New Era of Transport Policies: Learning from Experience; Advances in Transport Policy and Planning; Shiftan, Y., Kamargianni, M., Eds.; Academic Press: Cambridge, MA, USA, 2018; Volume 1, pp. 35–61. [Google Scholar]
  10. Pucher, J.; Korattyswaropam, N.; Mittal, N.; Ittyerah, N. Urban Transport Crisis in India. Transp. Policy 2005, 12, 185–198. [Google Scholar] [CrossRef]
  11. Stead, D.; Pojani, D. The Urban Transport Crisis in Emerging Economies: A Comparative Overview. In The Urban Transport Crisis in Emerging Economies; Pojani, D., Stead, D., Eds.; Springer International Publishing: Cham, Switzerland, 2017; pp. 283–295. ISBN 978-3-319-43849-8. [Google Scholar]
  12. Gorham, R. Nigeria. In The Urban Transport Crisis in Emerging Economies; Pojani, D., Stead, D., Eds.; Springer International Publishing: Cham, Switzerland, 2017; pp. 173–195. ISBN 978-3-319-43849-8. [Google Scholar]
  13. World Bank. Guide for Road Safety Opportunities and Challenges: Low and Middle Income Country Profiles; World Bank: Washington, DC, USA, 2020. [Google Scholar]
  14. Pearce, T.; Maunder, D.A.C.; Mbara, T.C.; Babu, D.M.; Rwebangira, T. Bus Accidents in India, Nepal, Tanzania, and Zimbabwe. Transp. Res. Rec. 2000, 1726, 16–23. [Google Scholar] [CrossRef]
  15. Barua, U.; Tay, R. Severity of Urban Transit Bus Crashes in Bangladesh. J. Adv. Transp. 2010, 44, 34–41. [Google Scholar] [CrossRef]
  16. Kobeissy, F.; Carnis, L. The Excuse Is Worse than the Fault: It’s Time Now to Improve Road Safety in Lebanon. Case Stud. Transp. Policy 2021, 9, 500–510. [Google Scholar] [CrossRef]
  17. Sam, E.F.; Daniels, S.; Brijs, K.; Brijs, T.; Wets, G. Modelling Public Bus/Minibus Transport Accident Severity in Ghana. Accid. Anal. Prev. 2018, 119, 114–121. [Google Scholar] [CrossRef]
  18. Kaplan, S.; Prato, C.G. Risk Factors Associated with Bus Accident Severity in the United States: A Generalized Ordered Logit Model. J. Saf. Res. 2012, 43, 171–180. [Google Scholar] [CrossRef]
  19. Prato, C.G.; Kaplan, S. Bus Accident Severity and Passenger Injury: Evidence from Denmark. Eur. Transp. Res. Rev. 2014, 6, 17–30. [Google Scholar] [CrossRef] [Green Version]
  20. Samerei, S.A.; Aghabayk, K.; Mohammadi, A.; Shiwakoti, N. Data Mining Approach to Model Bus Crash Severity in Australia. J. Saf. Res. 2021, 76, 73–82. [Google Scholar] [CrossRef]
  21. Tamakloe, R.; Hong, J.; Park, D. A Copula-Based Approach for Jointly Modeling Crash Severity and Number of Vehicles Involved in Express Bus Crashes on Expressways Considering Temporal Stability of Data. Accid. Anal. Prev. 2020, 146, 105736. [Google Scholar] [CrossRef]
  22. Zhou, H.; Yuan, C.; Dong, N.; Wong, S.C.; Xu, P. Severity of Passenger Injuries on Public Buses: A Comparative Analysis of Collision Injuries and Non-Collision Injuries. J. Saf. Res. 2020, 74, 55–69. [Google Scholar] [CrossRef] [PubMed]
  23. Bakker, S.; Dematera Contreras, K.; Kappiantari, M.; Tuan, N.A.; Guillen, M.D.; Gunthawong, G.; Zuidgeest, M.; Liefferink, D.; Van Maarseveen, M. Low-Carbon Transport Policy in Four ASEAN Countries: Developments in Indonesia, the Philippines, Thailand and Vietnam. Sustainability 2017, 9, 1217. [Google Scholar] [CrossRef] [Green Version]
  24. Hansen, A. Hanoi on Wheels: Emerging Automobility in the Land of the Motorbike. Mobilities 2017, 12, 628–645. [Google Scholar] [CrossRef] [Green Version]
  25. Leducq, D.; Scarwell, H.-J. The New Hanoi: Opportunities and Challenges for Future Urban Development. Cities 2018, 72, 70–81. [Google Scholar] [CrossRef]
  26. Nguyen, M.H.; Armoogum, J. Hierarchical Process of Travel Mode Imputation from GPS Data in a Motorcycle-Dependent Area. Travel Behav. Soc. 2020, 21, 109–120. [Google Scholar] [CrossRef]
  27. Nguyen-Phuoc, D.Q.; De Gruyter, C.; Oviedo-Trespalacios, O.; Diep Ngoc, S.; Tran, A.T.P. Turn Signal Use among Motorcyclists and Car Drivers: The Role of Environmental Characteristics, Perceived Risk, Beliefs and Lifestyle Behaviours. Accid. Anal. Prev. 2020, 144, 105611. [Google Scholar] [CrossRef]
  28. Nguyen-Phuoc, D.Q.; Oviedo-Trespalacios, O.; Nguyen, T.; Su, D.N. The Effects of Unhealthy Lifestyle Behaviours on Risky Riding Behaviours—A Study on App-Based Motorcycle Taxi Riders in Vietnam. J. Transp. Health 2020, 16, 100666. [Google Scholar] [CrossRef]
  29. Nguyen-Phuoc, D.Q.; Nguyen, H.A.; De Gruyter, C.; Su, D.N.; Nguyen, V.H. Exploring the Prevalence and Factors Associated with Self-Reported Traffic Crashes among App-Based Motorcycle Taxis in Vietnam. Transp. Policy 2019, 81, 68–74. [Google Scholar] [CrossRef]
  30. Tang, V.T.; Oanh, N.T.K.; Rene, E.R.; Binh, T.N. Analysis of Roadside Air Pollutant Concentrations and Potential Health Risk of Exposure in Hanoi, Vietnam. J. Environ. Sci. Health Part A 2020, 55, 975–988. [Google Scholar] [CrossRef]
  31. Viet Hung, K.; Huyen, L.T. Education Influence in Traffic Safety: A Case Study in Vietnam. IATSS Res. 2011, 34, 87–93. [Google Scholar] [CrossRef] [Green Version]
  32. Nguyen, D.V.M.; Vu, A.T.; Polders, E.; Ross, V.; Brijs, T.; Wets, G.; Brijs, K. Modeling the Injury Severity of Small-Displacement Motorcycle Crashes in Hanoi City, Vietnam. Saf. Sci. 2021, 142, 105371. [Google Scholar] [CrossRef]
  33. Nguyen, M.H.; Armoogum, J.; Adell, E. Feature Selection for Enhancing Purpose Imputation Using Global Positioning System Data without Geographic Information System Data. Transp. Res. Rec. 2020, 2675, 75–87. [Google Scholar] [CrossRef]
  34. Nguyen, M.H. Evaluating the Service Quality of the First Bus Rapid Transit Corridor in Hanoi City and Policy Implications. In Proceedings of the International Conference on Innovations for Sustainable and Responsible Mining; Tien Bui, D., Tran, H.T., Bui, X.-N., Eds.; Springer International Publishing: Cham, Switzerland, 2021; pp. 98–123. [Google Scholar]
  35. Nguyen, H.N.; Tu, S.S.; Nguyen, M.H. Evaluating the Maiden BRT Corridors in Vietnam. Transp. Commun. Sci. J. 2020, 71, 4. [Google Scholar] [CrossRef]
  36. Nguyen, M.H.; Ha, T.T.; Tu, S.S.; Nguyen, T.C. Impediments to the Bus Rapid Transit Implementation in Developing Countries—A Typical Evidence from Hanoi. Int. J. Urban Sci. 2019, 4, 464–483. [Google Scholar] [CrossRef]
  37. National Transportation Safety Committee of Vietnam. Report on Road Traffic Injury in Vietnam during the Period from 2016 to 2020; National Transportation Safety Committee of Vietnam: Hanoi, Vietnam, 2021. [Google Scholar]
  38. Nguyen, M.H.; Ha, T.T.; Le, T.L.; Nguyen, T.C. Challenges to Development of Bus System Evidence from a Comparative Analysis of Surveys in Hanoi. In Transportation for a Better Life: Mobility and Road Safety Managements; ATRANS: Bangkok, Thailand, 2017; pp. 1–10. [Google Scholar]
  39. Vu, H.T.; Ha, T.T. Developing Public Transport Systems—Experience from Practical Activities of Hanoi Bus System. J. Transp. Minist. Transp. 2016, 11/2016, 80–83. [Google Scholar]
  40. People’s Committee of Hanoi. The Transportation Plan in Hanoi up to 2030 with a Vision towards 2050; People’s Committee of Hanoi: Hanoi, Vietnam, 2016.
  41. La, Q.N.; Duong, D.V.; Lee, A.H.; Meuleners, L.B. Factors Underlying Bus-Related Crashes in Hanoi, Vietnam. Transp. Res. Part F Traffic Psychol. Behav. 2017, 46, 426–437. [Google Scholar] [CrossRef]
  42. La, Q.N.; Lee, A.H.; Meuleners, L.B.; Duong, D.V. Prevalence and Factors Associated with Road Traffic Crash among Bus Drivers in Hanoi, Vietnam. Int. J. Inj. Control Saf. Promot. 2013, 20, 368–373. [Google Scholar] [CrossRef] [PubMed]
  43. Chimba, D.; Sando, T.; Kwigizile, V. Effect of Bus Size and Operation to Crash Occurrences. Accid. Anal. Prev. 2010, 42, 2063–2067. [Google Scholar] [CrossRef]
  44. Feng, S.; Li, Z.; Ci, Y.; Zhang, G. Risk Factors Affecting Fatal Bus Accident Severity: Their Impact on Different Types of Bus Drivers. Accid. Anal. Prev. 2016, 86, 29–39. [Google Scholar] [CrossRef]
  45. Rahman, M.; Kattan, L.; Tay, R. Injury Risk in Collisions Involving Buses in Alberta, Canada. Transp. Res. Rec. 2011, 2265, 13–26. [Google Scholar] [CrossRef]
  46. Yoon, S.; Kho, S.-Y.; Kim, D.-K. Effect of Regional Characteristics on Injury Severity in Local Bus Crashes: Use of Hierarchical Ordered Model. Transp. Res. Rec. 2017, 2647, 1–8. [Google Scholar] [CrossRef]
  47. Walker, S.H.; Duncan, D.B. Estimation of the Probability of an Event as a Function of Several Independent Variables. Biometrika 1967, 54, 167–179. [Google Scholar] [CrossRef]
  48. Williams, R. Understanding and Interpreting Generalized Ordered Logit Models. J. Math. Sociol. 2016, 40, 7–20. [Google Scholar] [CrossRef]
  49. Nguyen, M.H.; Armoogum, J. Perception and Preference for Home-Based Telework in the COVID-19 Era: A Gender-Based Analysis in Hanoi, Vietnam. Sustainability 2021, 13, 3179. [Google Scholar] [CrossRef]
  50. Nguyen, M.H.; Armoogum, J.; Nguyen Thi, B. Factors Affecting the Growth of E-Shopping over the COVID-19 Era in Hanoi, Vietnam. Sustainability 2021, 13, 9205. [Google Scholar] [CrossRef]
  51. Nguyen, M.H.; Pojani, D.; Nguyen, T.C.; Ha, T.T. The Impact of Covid-19 on Children’s Active Travel to School in Vietnam. J. Transp. Geogr. 2021, 96, 103191. [Google Scholar] [CrossRef]
  52. Manh, T.H.; Duong, D.A.; Anh, N.N.; Duc, N.T.; Minh, N.B.; Huong, M.T.; Hieu, N.M. Adherence to mask wearing on public transport during the COVID-19 pandemic and influential factors: The case of Hanoi. Transp. Commun. Sci. 2021, 72, 486–497. [Google Scholar] [CrossRef]
  53. Long, J.S.; Freese, J. Regression Models for Categorical Dependent Variables Using Stata, 3rd ed.; Stata Press: College Station, TX, USA, 2014; ISBN 978-1-59718-111-2. [Google Scholar]
  54. Nguyen, M.H. Factors Influencing Home-Based Telework in Hanoi (Vietnam) during and after the COVID-19 Era. Transportation 2021, 48, 1–32. [Google Scholar] [CrossRef]
  55. O’Brien, R.M. A Caution Regarding Rules of Thumb for Variance Inflation Factors. Qual. Quant. 2007, 41, 673–690. [Google Scholar] [CrossRef]
  56. Hensher, D.A.; Rose, J.M.; Greene, W.H. Applied Choice Analysis, 2nd ed.; Cambridge University Press: Cambridge, UK, 2015; ISBN 978-1-107-09264-8. [Google Scholar]
  57. Elvik, R.; Vaa, T.; Hoye, A.; Sorensen, M. The Handbook of Road Safety Measures: Second Edition; Emerald Group Publishing: Bingley, UK, 2009; ISBN 978-1-84855-250-0. [Google Scholar]
  58. Aarts, L.; van Schagen, I. Driving Speed and the Risk of Road Crashes: A Review. Accid. Anal. Prev. 2006, 38, 215–224. [Google Scholar] [CrossRef]
  59. Michalaki, P.; Quddus, M.A.; Pitfield, D.; Huetson, A. Exploring the Factors Affecting Motorway Accident Severity in England Using the Generalised Ordered Logistic Regression Model. J. Saf. Res. 2015, 55, 89–97. [Google Scholar] [CrossRef] [PubMed] [Green Version]
  60. Boyce, P.R. Human Factors in Lighting. Available online: https://www.routledge.com/Human-Factors-in-Lighting/Boyce/p/book/9781439874882 (accessed on 30 April 2021).
  61. Jägerbrand, A.K.; Sjöbergh, J. Effects of Weather Conditions, Light Conditions, and Road Lighting on Vehicle Speed. SpringerPlus 2016, 5, 505. [Google Scholar] [CrossRef] [PubMed]
  62. Åkerstedt, T.; Kecklund, G.; Hörte, L.-G. Night Driving, Season, and the Risk of Highway Accidents. Sleep 2001, 24, 401–406. [Google Scholar] [CrossRef]
  63. Yu, R.; Abdel-Aty, M. Multi-Level Bayesian Analyses for Single- and Multi-Vehicle Freeway Crashes. Accid. Anal. Prev. 2013, 58, 97–105. [Google Scholar] [CrossRef] [PubMed]
  64. Brewster, S.E.; Elliott, M.A.; Kelly, S.W. Evidence That Implementation Intentions Reduce Drivers’ Speeding Behavior: Testing a New Intervention to Change Driver Behavior. Accid. Anal. Prev. 2015, 74, 229–242. [Google Scholar] [CrossRef] [Green Version]
  65. Yu, S.; Jia, Y.; Sun, D. Identifying Factors That Influence the Patterns of Road Crashes Using Association Rules: A Case Study from Wisconsin, United States. Sustainability 2019, 11, 1925. [Google Scholar] [CrossRef] [Green Version]
  66. Jovanis, P.P.; Chang, H.-L. Modelling the Relationship of Accidents to Miles Travelled. Transp. Res. Rec. 1986, 1068, 42–51. [Google Scholar]
  67. Rakotonirainy, A.; Chen, S.; Scott-Parker, B.; Loke, S.W.; Krishnaswamy, S. A Novel Approach to Assessing Road-Curve Crash Severity. J. Transp. Saf. Secur. 2015, 7, 358–375. [Google Scholar] [CrossRef]
  68. Gårder, P. Segment Characteristics and Severity of Head-on Crashes on Two-Lane Rural Highways in Maine. Accid. Anal. Prev. 2006, 38, 652–661. [Google Scholar] [CrossRef]
Figure 1. Narrow pavements occupied (illegally) by materials and for parking, lead pedestrians to walking on the road (Taken by Minh Hieu Nguyen).
Safety 07 00065 g001
Table 1. Synthesis of existing research on bus crash severity.
StudyBarua and Tay [15]Sam et al. [17]Chimba et al. [43]Rahman et al. [45] Kaplan and Prato [18]Prato and Kaplan [19]Feng et al. [44]Yoon et al. [46]Tamakloe et al. [21]
Research areaDeveloping countriesDeveloped countries
BangladeshGhanaFlorida, USAlberta, CanadaThe USDenmarkThe USSouth KoreaSouth Korea
Time period of data1998–20052011–20152003–20072000–20072005–20092002–20112006–20102010–20142010–2016
Sample2662 bus crashes33,694 bus and mini-bus crashes4528 bus crashes9485 bus collisions2576 bus crashes3434 bus crashes1380 bus crashes27,731 local bus crashes 2997 express bus crashes
MethodOrdered probit modelGeneralized ordered logit modelMultinomial logit modelLogistic modelGeneralized ordered logit modelGeneralized ordered logit modelOrdered logit modelHierarchical ordered probit modelBivariate copula-based methodology
Exploratory variable groups
(1) Temporal characteristics
(2) Location and infrastructure characteristics
(3) Service and vehicle characteristics
(4) Traffic characteristics
(5) Crash characteristics
(6) Weather characteristics
(7) Driver characteristics and behaviors
Outcome variable: Crash severity4 levels4 levels3 levels2 levels5 levels4 levels3 levels4 levels4 levels
Note: Temporal characteristics: time of day, day of the week, etc.; Location and infrastructure characteristics: road, median barrier, shoulder, lane, light condition, area, etc.; Service and vehicle characteristics: age, capacity, service type, etc.; Crash characteristics: vehicle/user involved, manner of collision, etc.; Driver characteristics and behaviors: age, gender, driving license, history crashes, etc.; Weather conditions: raining, normal, and also including the status of surface (e.g., dry, wet, snow, or freezing).
Table 2. Breakdown of the samples (n = 529).
VariableFrequency%
Bus capacity (both standing and seating positions)Small (under 40 positions)7313.8
Medium (40–60 positions)40776.9
Large (80–90 positions)499.3
WeatherNormal31459.4
Raining21540.6
LightDay24746.7
Night with light18234.4
Night with no or poor light10018.9
Traffic densitySparse6111.5
Normal26750.5
Dense20138.0
AreaCentral districts27752.4
Suburban19236.3
Rural6011.3
Lane per direction1–2 lanes40576.6
≥3 lanes12423.4
Road alignmentStraight34966.0
Curved18034.0
Road typeOne way or two ways with physical barrier25247.6
Two ways without physical barrier27752.4
Collision mannerHead-on21440.5
Side13325.1
Rear-end18234.4
Collision typeWith pedestrians336.2
With motorcycles29155.0
With other motorized or obstructions20538.8
SeverityMinor or damage-only crashes32060.5
Injured or hospitalized crashes16531.2
Fatal crashes448.3
Table 3. Model estimation results.
NoVariableCoef.Std.p > |z|
1Bus capacity (ref = small (Under 40 positions))
Medium (40–60 positions)0.1430.3030.637
Large (80–90 positions)0.5420.4240.098
2Weather (ref = Normal)
Raining0.5070.2040.013
3Light (ref = Day)
Night with adequate light1.3620.2370.000
Night with no or poor light1.6020.2770.000
4Traffic density (ref = Sparse)
Normal−0.4860.3020.088
Dense−0.7100.3210.027
5Area (ref = Central districts)
Suburban0.9580.2210.000
Rural1.4370.3150.000
6Lane per direction (ref = 1–2 lanes)
≥3 lanes0.8580.2540.001
7Road alignment (ref = Straight)
Curve0.3250.2110.095
8Road type (ref = One way or two ways with physical barrier)
Two ways without physical barrier0.5110.2020.011
9Collision manner (ref = Head-on)
Side−1.4620.2910.000
Rear-end−0.7910.2220.001
10Collision type (ref = With pedestrians)
With motorcycles−0.5890.4050.096
With other motorized or obstructions−0.6630.4260.065
/cut11.1210.564
/cut23.6760.588
Number of observations529
LR chi2(16)191.11
Prob > chi20.00000
Pseudo R20.2066
Log likelihood−366.95216
Note: Brant’s test result: chi2: 25.17; p > chi2: 0.067; df: 16.
Publisher’s Note: MDPI stays neutral with regard to jurisdictional claims in published maps and institutional affiliations.

