Article

Application of Structural Equation Modeling (SEM) and an Adaptive Neuro-Fuzzy Inference System (ANFIS) for Assessment of Safety Culture: An Integrated Modeling Approach

1
Department of Industrial Engineering, Gazi University, 06570 Ankara, Turkey
2
Department of Industrial Engineering and Management Systems, University of Central Florida, Orlando, FL 32816-2993, USA
3
Department of Intelligent Mechanical Systems, Graduate School of Natural Science and Technology, Okayama University, Okayama 700-8530, Japan
4
The Bronisław Markiewicz State Higher School of Technology and Economics in Jarosław, 37-500 Jarosław, Poland
*
Author to whom correspondence should be addressed.
Safety 2020, 6(1), 14; https://doi.org/10.3390/safety6010014
Submission received: 11 December 2019 / Revised: 7 February 2020 / Accepted: 21 February 2020 / Published: 25 February 2020

Abstract

:
The primary purpose of this study was to apply structural equation modeling (SEM) integrated with an adaptive neuro-fuzzy inference system (ANFIS) approach to model the safety culture of the petrochemical industry of Japan. Workers from five companies located in the Chugoku region of Japan completed a paper-based survey distributed by email. SEM and ANFIS methods were integrated in order to identify and model the important factors of the safety culture. The results of SEM indicate that employee attitudes toward safety, coworker’s support, work pressure, and plant safety management systems were significant factors influencing violation behavior, personnel safety motivation, and personnel error behavior. Furthermore, the application of the ANFIS modeling approach showed that employees’ attitude was the most critical predictor of violation behavior and personnel error behavior, while coworkers support was the most critical predictor in modeling personnel safety motivation.

1. Introduction

Safety culture has been defined as “that assembly of characteristics and attitudes in organizations and individuals, which establishes that, as an overriding priority, nuclear plant safety issues receive the attention warranted by their significance” [1,2]. Safety culture, however, is not only about safety attitudes; it is more a positive indicator of the success of safety management. Besides, work safety has the highest priority in safety culture that is considered to be excellent [3]. The foregoing concepts concentrated mostly on individual values, opinions, and practices in an organization [4]. The Health and Safety Commission (1993) developed and published the most commonly cited definition of an organizational safety culture in a consultative committee on nuclear safety [5]. The word safety culture is used to describe how internal social organizational dynamics directly affect the business risk behaviors that could contribute to personal injuries or accidents in the safety of processes [6].
Safety culture was described in this report as “the product of individual and group values, attitudes, perceptions, competencies, and patterns of behavior that determine the commitment to, and the style and proficiency of, an organization’s health and safety management.” Prior research also indicates that safety culture facilitates risk management and mitigation strategies based on growing organizational engagement and safety awareness. There is a consensus between the academics and public research findings of the main characteristics of a safety culture an organization should be focusing on in order to enhance the organizationally oriented safety culture [7]. The reported consequence was an increased readiness for potentially dangerous situations [8,9,10].
An inverse relationship between safety culture and accidents and injuries in highly risky fields, such as the petrochemical industry, was also established [1]. As a result, a positive safety culture can be developed and maintained as a useful tool for improving overall safety within an organization [11]. Currently, there is an urgent need to manage safety issues in order to foster a positive safety culture. This approach ensures accountability and enables workers to be fully informed about safety procedures and how important it is to comply with them. Zohar (2010) has urged researchers to take safety climate expectations as a program emphasis that includes goals for competing demands (for example, safety and efficiency), inequalities between the activities of espoused and implemented protection and consistencies between policies and procedures. Therefore, a multidimensional approach to safety needs to be taken, which requires an analysis of possible interactions among its components in terms of their effect on safety results [12].
It has been suggested by Guldenmund (2010) that safety climate indices are commonly used to assess safety culture [13]. In the present study, five main factors were used to model the safety culture in the selected petrochemical plants, including (1) management commitment toward safety, (2) employees’ attitude toward safety, (3) coworkers’ support of safety, (4) workplace pressure, and (5) safety management system. The safety culture factors were assessed using three different types of surveys. Three of the five safety culture components listed were evaluated using the survey published in reference [14], which includes management’s commitment toward safety, coworkers’ support, and workplace pressure. Employees’ attitude toward safety was evaluated using a survey from reference [15]. Li and Guldenmund (2018) consider the safety management system (SMS) either as a safety management and control system or as a safety management system [16]. The link between the safety management system and safety culture was assessed using the survey published in reference [17]. The fourth survey was adapted from reference [18] and was designed to assess workers’ motivation to follow safety rules. In previous research, the questionnaire was used to assess employee’s level of motivation for the safety procedures and policy, and the significance that workers attach to it. The attitude of workers towards violations was measured using questions from the survey [19]. There are nine questions in the adopted questionnaire concerning employees’ attitudes toward their safety violation behavior. Due to the similarity of the questions and to avoid repeated or unclear questions, only five questions were selected. Finally, in this study, the fifth survey measured error behaviors among workers [14]. Four questions were chosen to evaluate error behaviors in terms of skills, decision-making, and expectations of error.
The main objective of this study was to integrate the structural equation modeling (SEM) with an adaptive neuro-fuzzy inference system (ANFIS) approach for modeling safety culture in the petrochemical industry in terms of violation behavior, personnel safety motivation, and personnel error behavior. The remainder of the paper is structured as follows. Section 2 provides a literature review of the safety culture and applications in the petrochemical industry. Section 3 addresses the theories and the evolution of the model. Section 4 details the methodological steps, including SEM and ANFIS. Ultimately, in Section 5 and Section 6, respectively, the findings and conclusions are discussed.

2. Background

Recently, safety culture has been the subject of extensive research in the health industry as well as in the power industry in Japan. For instance, Itoh and Andersen (2008) documented the findings of a safety culture questionnaire survey comprising over 20,000 responses from a number of Japanese hospitals [20]. Within Japanese healthcare, the study identified basic safety culture characteristics, including variations within professional regional and organizational cultures. Based on a cross-national hospital study on patient safety culture in Japan, the United States, and Chinese Taiwan, Wu et al. (2013) studied safety culture in the nursing profession [21]. Another study assessed the relationship between ethical leadership, an ethical workplace climate, safety culture, safety behaviors, and measured safety outcomes of workers in the high-reliability organizations of aviation and healthcare [22].
In the nuclear industry, security culture has also been recognized internationally. [23]. Takano et al. (2001), for instance, analyzed the safety culture of nuclear power operations with a focus on interconnections between organizational variables and important safety indicators. [24]. In recent times, after the 2011 Fukushima Daiichi Nuclear Power Plant Disaster in Japan, safety culture has received new attention [25,26,27,28,29,30,31,32].
The latest English literature on safety culture in Japan’s petrochemical sector is limited in terms of the petrochemical industry. Cross-Cultural research on organizational factors linked to health at Japanese and Taiwanese oil refinery plants was performed by Hsu et al. (2008) [33]. In order to analyze the relations between organizational variables and employees’ safety performance, structural equation modeling (SEM) was used. The results revealed a disparity between Japan and Taiwan in organizational safety.
There are three main sectors of the petrochemical industry: Upstream, midstream, and downstream. These three sectors subject workers to high-risks of employment. The upstream sector includes basic raw materials. The intermediate industry is responsible for the production of intermediates, and the downstream industry is responsible for the manufacturing and processing of different by-products [34]. An employee may be subject to a wide range of occupational hazards, including the processing, transport, and storage of the petrochemical products, such as fires, accidents, contaminants, diseases, and other occupational hazards for such employees. It is, therefore, vital to understand how safety culture affects petrochemical safety and performance of staff in attempts to reduce risks and ensure safe operations. The assessment of safety culture in the petrochemical industry is a necessary step to improve the overall safety quality and to enhance the potential organization’s effectiveness in a highly risky area. The ultimate objective is to achieve efficient safety management in order to support employees in this complex and hazardous field. Safety climate analysis through surveys can identify links between the essential aspects of safety within an organization and how it can contribute to the overall safety culture [3]. Hosny et al. (2017) completed comparative analyzes between Egypt’s three petrochemical firms on employees’ understanding of safety climatic parameters. [35]. The main factor for maintaining an appropriate safety environment was the participation of the staff. In a particular petrochemical organization, Kao et al. (2008) identified eight factors of safety culture: “safety commitment and support, safety attitude and behavior, safety communication and involvement, safety training and competence, safety supervision and auditing, safety management system and organization, accident investigation and emergency planning and, finally, reward and benefits” [36]. The study concluded that personal experiences (e.g., job position, work experience, and age) influence expectations dramatically in many areas of safety culture.

3. Methods and Procedures

3.1. Study Variables

The primary focus of this study was to integrate structural equation modeling (SEM) with an adaptive neuro-fuzzy inference system (ANFIS) approach in order to models the perceived safety culture among five petrochemical manufacturing companies in Japan. The set of key variables considered for model development included the following aspects of safety culture.
(1)
Management commitment (MC)
(2)
Employees personnel attitude (EPA)
(3)
Coworkers safety support (CSS)
(4)
Workplace pressure (WP)
(5)
Safety management system (SMS)
(6)
Violation behavior (VB)
(7)
Personnel safety motivation (PSM)
(8)
Personnel error behavior (PEB)
For each of the study variables, the survey items are shown in Table 1 below.

3.2. Survey Questionnaire

A survey of perceived safety culture was carried out by 5 mainly petrochemical manufacturers based in the Chugoku area of Japan. A study questionnaire was distributed to plant workers by the safety manager of each company. An invitation to participate in a questionnaire and the informed consent form needed to issue the survey included a cover letter. The Institutional Review Board (#FWA00000351, IRB00001138) approved the survey questionnaire and the experimental protocol for this study at the University of Central Florida, Orlando, Florida, USA. The survey was validated by Alrehaili [37]. The survey was split into 2 sections. The first part called for demographic information from respondents, such as age, sex, employment, place, and work experience. The second part included questions with answers calculated on a 5-point Likert scale ranging from “1 = strongly disagree” to “5 = strongly agree.”

3.3. Participants

The profile of the participating workers is shown in Table 2 of the 883 valid respondents, 874 (99%) were male. 167 (18.9%) of the respondents had worked less than 5 years, 216 (24.5%) between 6 and 10, 60 (6.8%) between 11 and 15, 77 (8.7%) between 16 and 20, and 363 (41.1%) more than 21 years (Table 2). 649 (73.5%) of the participants were project managers, 80 (9.1%) were supervisors, 64 (7.2%) were engineers, 17 (1.9%) were safety engineers, and 73 (8.3%) reported associations with other professions. Demographic information was collected using IBM SPSS Version 25 for Windows (SPSS Inc., Chicago, IL, USA), and other statistical analyses were conducted using SmartPLS (v.3.2.8) [38,39].

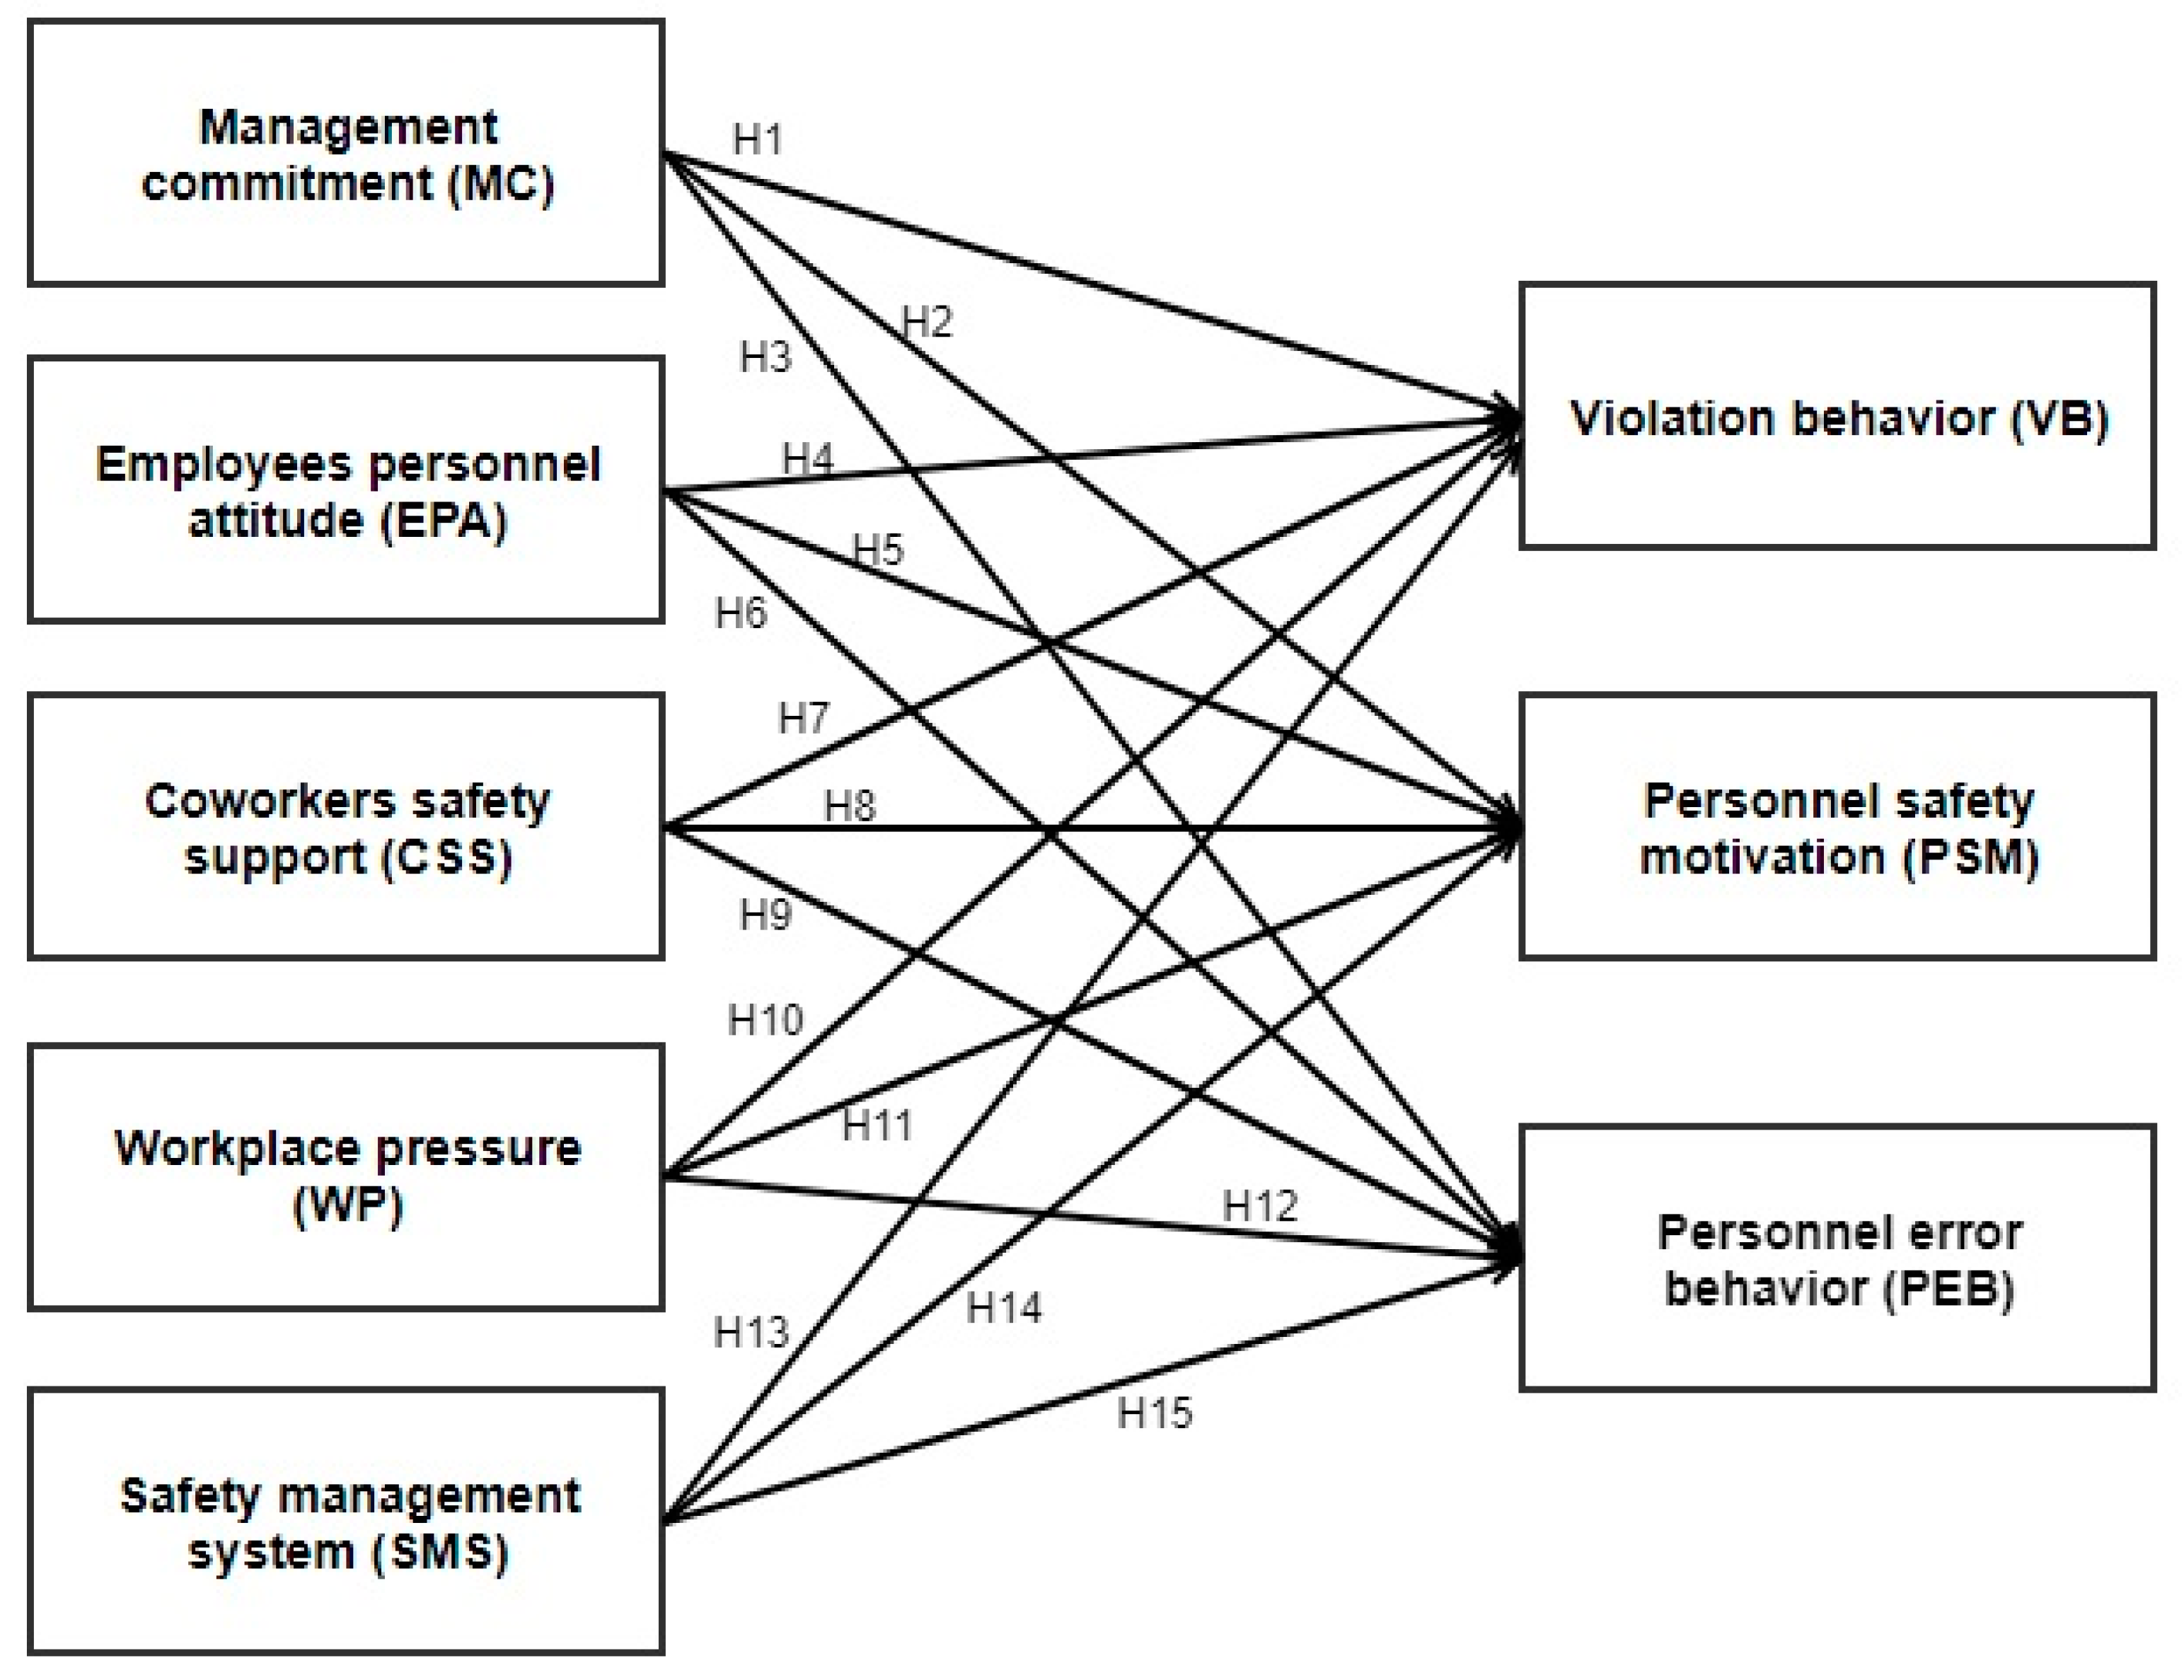
3.4. Study Hypotheses

In this study, the hypotheses of interest were based on several safety culture-relevant variables, including: (1) Management’s commitment to safety, (2) employee attitudes toward safety, (3) coworker’s support of safety, (4) work pressure, and (5) plant safety management systems. Table 3 indicates the postulated hypotheses for the analysis. A total of 15 hypotheses were developed to evaluate the impact of the safety-relevant variables on attitudes toward violations, personnel safety motivation, and personnel error behavior in the petrochemical industry in Japan. The proposed model shown in Figure 1 describes the postulated hypotheses and their interrelationships.

4. Model Development and Analysis

4.1. Overview of Analyses

Demographic information was analyzed using IBM SPSS Version 25 for Windows (SPSS Inc., Chicago, IL, USA), and further statistical analysis was conducted in SmartPLS (v.3.2.8) software [38,39]. The analyzes were multicollinearity analysis; testing the reliability, validity, and path coefficients; and SEM to evaluate the connections between model variables. The MATLAB version R2018b (The MathWorks, Natick, MA, USA) was used to develop all neuro-fuzzy models for this analysis.

4.2. Multicollinearity Analysis

For all study variables, we calculated the means and standard deviations. Correlation analysis was also performed to test the relationship between any two variables used in the model development (Table 4). At p ≤ 0.01, all variables in the model had significant relationships. There is potential multicollinearity at the structural level in either a reflective or a formative model. An indicator of the variance inflation factors has been verified for the multicollinearity. For all the exogenous variables in the data set, we used SmartPLS (v.3.2.8) to measure the variance inflation factor (VIF). According to Hair et al. (2016) [39], the VIFs were all below 5.0 and, therefore, were considered acceptable. It means that there may be a multicollinearity problem when the VIF coefficient is higher than 5.0 as a common rule in the thumb. None of the VIF coefficient values in this analysis reached the threshold value of 5.0, thus verifying that the model data did not contain multicollinearity.

4.3. Reliability and Convergent Validity

In our proposed model, SmartPLS (version 3.2.8) was used for the evaluation of reliability validity and path coefficients. As stated in the Fornell and Larcker [40] and Cronbach [41] requirements, Cronbach alpha, and composite reliability were used for reliability. In order to assess validity, we used convergent validity and discriminatory validity as part of the construct validity. Convergent validity describes the degree to which the latent construct is truly represented by the scale items [42]. Furthermore, Fornell and Larcker [40] used the criterion of the average variance obtained in order to establish convergent validity.
The initial model included several individual items with loads below 0.50, which were removed and then re-ran the model. Overall, we deleted one item from MC (MC3); three items from EPA (EPA1, EPA6, and EPA7); one item from CSS (CSS1); one item from WP (WP7); one item from SMS (SMS9); two items from PSM (PSM3 and PSM4) and three items from PEB (PEB2, PEB3, and PEB4). Table 5 illustrates the reliability and convergent validity of the revised model.

4.4. Structural Equation Modeling and Bootstrapping Test

In order to determine how well the hypothesized model is maintained and validated with empirical data, the SEM method was performed. The SEM is a statistical method that specifies the direct or indirect relationships and the directional effect of the latent variables of the system with each of the variables found in the conceptualized version of the analysis [43]. In most behavioral and social research studies, SEM has been commonly and effectively used because it is capable of improving and validating latent structures or unknown variables for measurement modeling [44]. The SEM approach consists primarily of two parts: The measurement model and the structural model [44]. The structural model associates latent variables to measure the relationships between them, such as direct and indirect effects, as well as the explained and unexplained variances accounted for in each latent variable [45]. SEM was used for assessing safety at work in this study. A bootstrapping test is a resampling approach where numbers of subsamples are generated (typically 5000 subsamples are suggested). The procedures include random sampling and replacement for sets of samples from the actual data to obtain subsamples; then each subsample is used to predict the model and use a partial least squares approach for structural equation modeling (PLS-SEM); finally, these predictions are considered to acquire the distributions and to facilitate the significance tests [46]. As the PLS-SEM does not presume a normal distribution, a bootstrapping procedure should be implemented to evaluate the level of significance of each indicator weight [47]. That is the main reason that we performed bootstrapping. 4.5. Model fit test
No global fitness index is available for PLS-SEM; up to now, the critical threshold values were not fully realized. Therefore, approaches to bootstrapping and blindfolding can be carried out to address these issues [39]. Furthermore, reliability and validity tests for the measuring models are conducted in the early phase of these analyses [39]. The goodness of fit index is not usually reported; however, some researchers have suggested the standardized root mean square residual (SRMR) and normed fit index (NFI) as performance metrics to assess model fit, which ensures the absence of model misspecification. SRMRs under 0.10 or 0.08 and an NFIs range from 0 to 1 (close to 1) are considered to be good fits [48]. In this study, the SRMR was 0.064; less than 0.08 is considered acceptable. Moreover, the NFI was approximately 0.90, which is considered a good fit for our model.

4.5. Performance Criteria

For the estimation of a model error, a variety of performance metrics including the coefficient of determination (R2), mean square error, root mean square error (RMSE), mean absolute error, and mean absolute percentage error have been used.
A prominent advantage of RMSEs over the mean absolute errors is that RMSEs avoid using the function of absolute value, which in most mathematical calculations is not desirable [49].
In this analysis, we measured the RMSE accuracy between the actual and predicted values in order to determine the performance of the ANFIS models.
The following formula was used to calculate the RMSE values:
R M S E = t = 1 n ( actual ( t ) predicted ( t ) ) 2 n
where the actual (t) and predicted (t) values are respectively observed and estimated, and where n is the total number of test records.
t = 1 ,   2 ,   3 ,   . , n

5. Results and Discussion

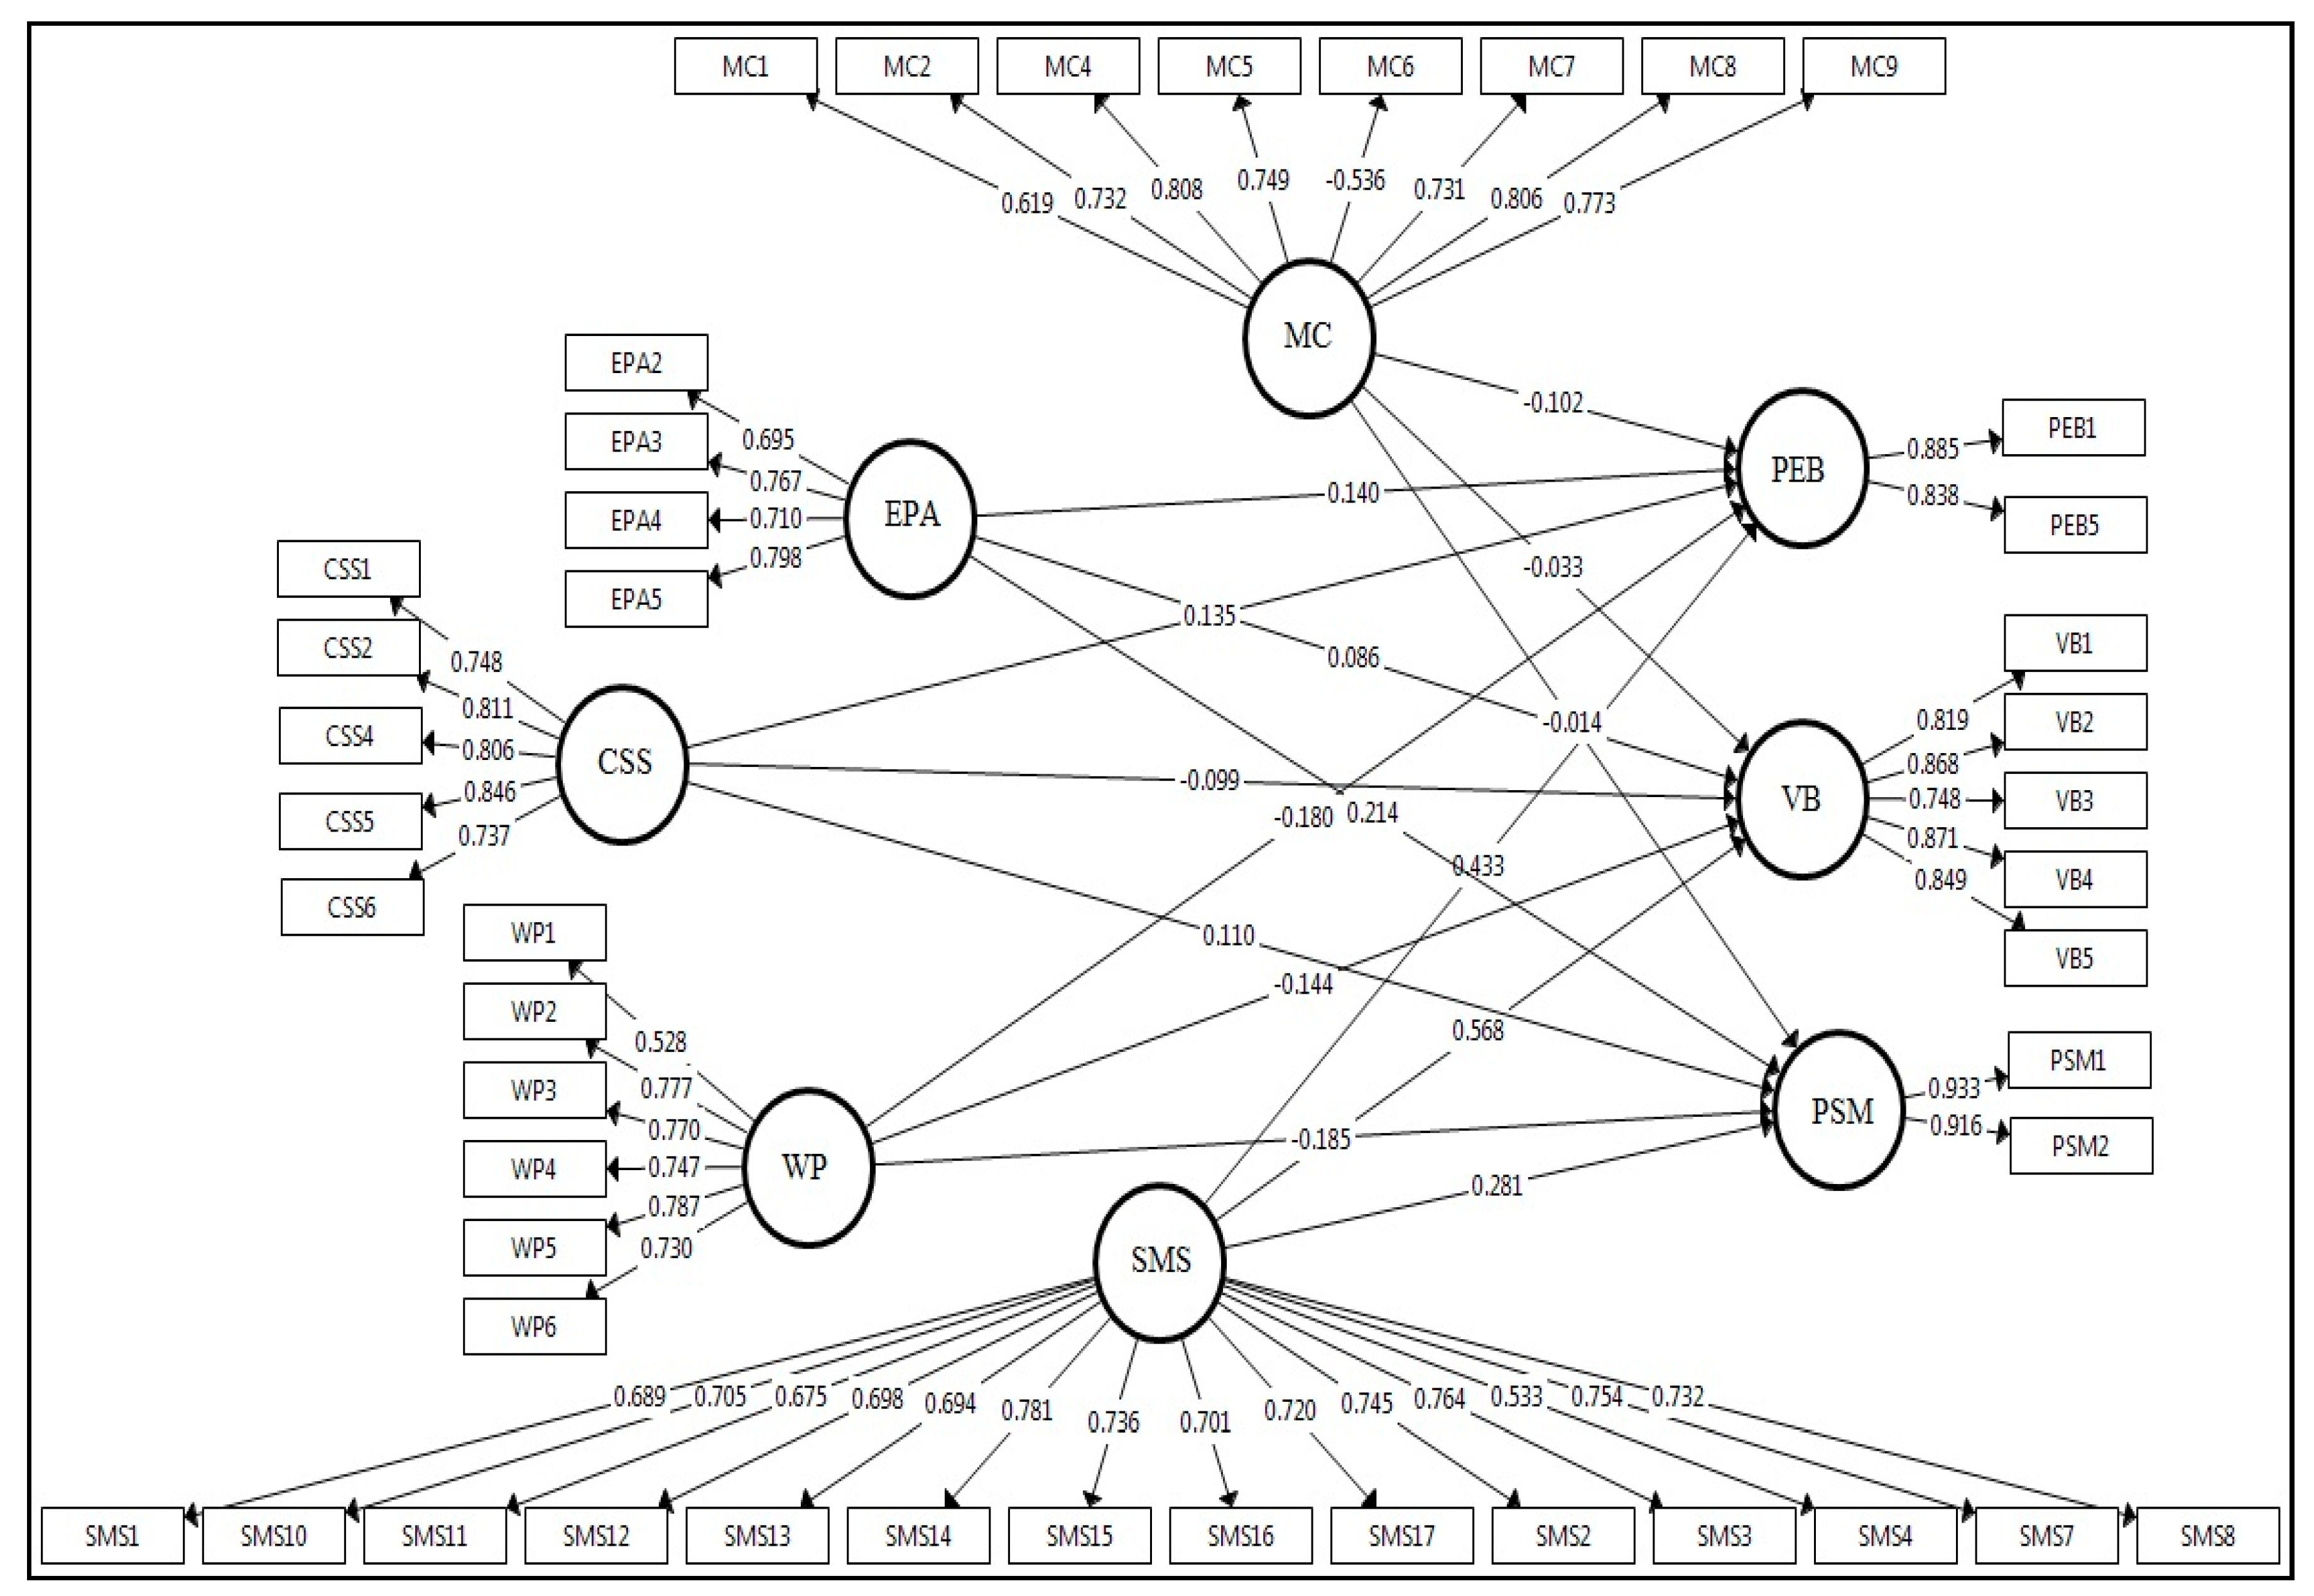
5.1. Hypothesis Testing Results

Path analysis was used to evaluate the relations between each latent variable and the postulated hypotheses of the study using every latent indicator. In order to assess the importance of the path coefficients using PLS-SEM, a bootstrapping test was conducted based on t-statistics and the application of t-tests.
Table 6 shows the estimated path coefficients and t-values between latent variables. Thirteen hypotheses were supported by the survey results, except H1 and H6. The findings of the above analyses were as follows. Figure 2:
  • Management commitment was not statistically significantly associated with violation behavior (β = −0.033; p-value > 0.05); thus, H1 was rejected.
  • A positive effect of the employees’ personnel attitude on violation behavior was identified in the petrochemical industry (β = 0.086; p-value < 0.05), which supports H2.
  • Coworkers’ safety support negatively influenced personnel attitudes toward violations in the petrochemical industry (β = −0.099; p-value < 0.05), which supports H3.
  • A negative effect of the workplace pressure on violation behavior was identified in the petrochemical industry (β = −0.144; p-value < 0.05), which supported H4.
  • Safety management system positively influenced personnel attitudes toward violations in the petrochemical industry (β = 0.568; p-value < 0.05), which supports H5.
  • Management commitment was not statistically significantly associated with personnel safety motivation. (β = −0.014; p-value > 0.05); thus, H6 was rejected,
  • A positive effect of the employees’ personnel attitude on personnel safety motivation was identified in the petrochemical industry (β = 0.214; p-value < 0.05), which supports H7.
  • Coworkers’ safety support positively influenced personnel safety motivation in the petrochemical industry (β = 0.110; p-value < 0.05), which supports H8.
  • A negative effect of the workplace pressure on personnel safety motivation was identified in the petrochemical industry (β = −0.185; p-value < 0.05), which supported H9.
  • Safety management system positively influenced personnel safety motivation in the petrochemical industry (β = 0.281; p-value < 0.05), which supports H10.
  • Management commitment negatively influenced personnel error behavior in the petrochemical industry (β = −0.102; p-value < 0.05), which supports H11.
  • A positive effect of the employees’ personnel attitude on personnel error behavior was identified in the petrochemical industry (β = 0.140; p-value < 0.05), which supports H12.
  • Coworker’s safety support positively influenced personnel error behavior in the petrochemical industry (β = 0.135; p-value < 0.05), which supports H13.
  • A negative effect of the workplace pressure on personnel error behavior was identified in the petrochemical industry (β = −0.180; p-value < 0.05), which supported H14.
  • Safety management system positively influenced personnel error behavior in the petrochemical industry (β = 0.433; p-value < 0.05), which supports H15.
  • Overall, thirteen of the postulated fifteen hypotheses were supported.
From the results of the hypothesis testing and bootstrapping, we can conclude that perceived safety culture plays a crucial role in personnel attitudes toward violations. The change in perceived safety culture items was found to affect the VB, with R2 = 0.393. Similarly, the perceived safety culture items play a critical role in PSM, with R2 = 0.433. That is, PSM was affected based on the perceived safety culture items with a contribution of 43.3%. The perceived safety culture items had an important role in PEB, with R2 = 0.474 (Table 6 and Figure 2).
According to the review of safety violations in the industry [50], some conflicting results show that there is evidence about an inconsistent relationship between the management commitment and violations [51,52]. Thus, it is likely that the main reason for the difference between the outcomes in our work versus those studies is the difference in the measurements.
Based on the 11th hypothesis’ results, our negative findings were in contrast to the findings of Rundmo and Hale [53]. Rundmo and Hale [53] focused on the questions ‘safety communication’, ‘motivating people to take part’, ‘follow-up measures’, ‘control and inspection routines’, ‘motivating staff to work more safely’, and so on. Thus, it was likely that the main reason for the difference between the outcomes in our work versus those of Rundmo and Hale [53] was the difference in the measurements. Because the study used self-reported data collection through survey distribution, it was important to mention that the research participants might be influenced to report the generally accepted safety procedure or conducts rather than stating their actual beliefs regarding each question in the survey.

5.2. Application of ANFIS Approach

A complex decision-making process may be oversimplified by PLS-SEM. In order to address this limitation, many researchers have strongly recommended the use of soft computing techniques [54,55,56,57]. In addition, ANFIS modeling can detect the nonlinear and linear relationships between variables in order to predict higher accuracy. Therefore, the two-stage SEM-ANFIS methodology was applied in the present study to take advantage of both advanced statistical and soft computing techniques.
The structural models were developed with 13 indicators in the previous section. In this section, an ANFIS approach was used to estimate violation behavior, personnel safety motivation, and personnel error behavior with the confirmed indicators. The main aim of this approach was to analyze the relationships among the input values (management commitment, employees personnel attitude, coworkers safety support, workplace pressure, and safety management system) and output values (violation behavior, personnel safety motivation, and personnel error behavior), in order to determine the relative importance of independent variables within the ANFIS model. We divided the safety data randomly into three groups for training, checking, and testing data sets. The first group represented 60% of cases (883 × 0.6 = 530) and acted as a learning parameter; the latter had 15% (883 × 0.15 = 132) of cases used as a verifying parameter; the others, 25% (883 × 0.25 = 221), previously not seen, used as the testing parameter by the network, respectively.
The initial membership functions (MFs) were essential in the ANFIS models. In this study, eight different forms of MFs were compared: Triangular MFs (trimf), trapezoidal MFs (trapmf), generalized bell MFs (gbellmf), Gaussian curve MFs (gaussmf), Gaussian combination MFs (gauss2mf), P-shaped MFs (pimf), difference between two sigmoid functions MFs (dsigmf), and the product of two sigmoidal MFs (psigmf). The structure of the proposed ANFIS model for predicting the dependent variables is represented in Figure 3. The different MFs of the input values and the respective RMSE values for each scenario are represented in Table 7. According to the RMSE values, the best configuration was selected. In this study, trimf yielded the lowest RMSE result for the ‘violation behavior’, ‘personnel safety motivation’, and ‘personnel error behavior’ sets of the output data.

5.3. Sensitivity Analysis of Independent Variables

The effects of independent variables on dependent variables were analyzed with a simple approach describing the effect of each variable on model performance to estimate the output value. First, all parameters were considered as input values for ANFIS. Second, one of the input parameters was removed from the input parameters, and the model was again prepared with the same structure. The performance of models in the absence of each input parameter was evaluated with the RMSE performance metric. Removing one of the input parameters caused a change in model performance. The effect of each parameter was evaluated according to the change in the severity of performance. ANFIS sensitivity analysis results are shown in Table 8. EPA caused a dramatic decrease in the accuracy of models; therefore, we concluded that this parameter was the most important one for modeling violation behavior and personnel error behavior. On the other side, CSS caused a decrease in the accuracy of models; therefore, we concluded that this parameter was the most important one for modeling personnel safety motivation.
Since the study has used self-reported data collection in survey delivery, it is essential to note that research respondents may be influenced by the generally accepted safety protocol or by their actions rather than by their actual views on each question in the survey. Moreover, this study did not evaluate relationships with objective indicators, such as incident rates and the number of reports by some fault, and the causal relationship between variables is uncertain as the design of the study is cross-sectional.

6. Conclusions

This study applied structural equation modeling (SEM) integrated with an adaptive neuro-fuzzy inference system (ANFIS) approach for analyzing the relationships among the input and output parameters, namely the attitudes of employees toward violations, error behavior and safety motivation, and safety culture in selected petrochemical plants in Japan. Current research suggests an important role in worker motivation and safety performance for petrochemical personnel safety. The results of this study emphasize the importance of the perceived safety culture as an important part and control of employee behaviors and attitudes within the organizational culture. These results can be used for future knowledge management of safety that maximizes employee safety knowledge to improve the overall performance of safety.
Safety climate is about perceptions, and safety culture is about workers’ attitudes [58]. In this study, the assessment of the safety culture of an industry is a key step in identifying safety performance opportunities and ultimately improving the industry’s organizational results. The findings of this study highlight the importance of safety culture as a significant component of the organizational culture that influences employee behaviors and attitudes. The results of this study can contribute significantly to helping petrochemical industry managers and government safety officials improve motivation for worker safety. Although our findings showed that EPA was the most important factor for violation behavior and personnel error behavior and CSS for personnel safety motivation, other factors should also be carefully considered for the strategy planning and decision-making processes that can help managers. The results of this study can also be used as a guide for implementing adequate procedures for reducing workers’ errors and growing attitudes toward violations in the petrochemical environment. Further work is necessary not only to improve and strengthen the findings and assumptions drawn in this report but also to extend the scope of the factors addressed. There is also a need to examine the effect of subculture differences developed by general safety cultures in high-risk industries like construction, aviation, manufacturing, and mining. Further research is also needed to understand the complexities of safety management of knowledge for employees with various educational backgrounds and to investigate the effects of age, sex, and relevant work experience. Furthermore, future research should focus on assessing safety culture by the use of other PLS-based SEM software such as WarpPLS and soft-computing techniques such as artificial neural networks (ANNs) and fuzzy inference systems (FIS) to produce interesting results or even to make comparisons between the outcomes of different techniques.

Author Contributions

Conceptualization, E.Ç. and W.K.; methodology, E.Ç.; validation, E.Ç., A.J.O., and W.K.; formal analysis, E.Ç.; investigation, A.J.O.; resources, A.J.O. and A.M.; data curation, E.Ç.; writing—original draft preparation, E.Ç. and W.K.; writing—review and editing, W.K.; visualization, E.Ç.; supervision, A.M.; project administration, W.K. and A.M. All authors have read and agreed to the published version of the manuscript.

Funding

This research received no external funding.

Acknowledgments

The researchers would like to express their gratitude for the support and involvement of the following companies in the completion of the survey conducted in this research: Saahikasei Chemical, Mitsubishi Gas Chemical, Kuraray, and Chugoku Power Electric Company in Japan. Ethical approval for this project was granted by the Institutional Review Board (# FWA00000351, IRB00001138) at the University of Central Florida, Orlando, Florida, USA.

Conflicts of Interest

The authors declare no conflict of interest.

References

  1. Boughaba, A.; Hassane, C.; Roukia, O. Safety Culture Assessment in Petrochemical Industry: A Comparative Study of Two Algerian Plants. Saf. Health Work 2014, 5, 60–65. [Google Scholar] [CrossRef] [Green Version]
  2. Mearns, K.; Flin, R. Assessing the state of organizational safety—culture or climate? Curr. Psychol. 1999, 18, 5–17. [Google Scholar] [CrossRef]
  3. Cooper, A.D. Towards a model of safety culture. Saf. Sci. 2000, 36, 111–136. [Google Scholar] [CrossRef]
  4. Goncalves Filho, A.; Waterson, P. Maturity models and safety culture: A critical review. Saf. Sci. 2018, 105, 192–211. [Google Scholar] [CrossRef] [Green Version]
  5. Health and Safety Commission (HSC). Organizing for Safety: Third Report of the ACSNI (Advisory Committee on the Safety of Nuclear Installations) Study Group on Human Factors; HSE Books: Sudbury, UK, 1993. [Google Scholar]
  6. Antonsen, S. Safety Culture: Theory, Method and Improvement; CRC Press: Boca Raton, FL, USA, 2017. [Google Scholar]
  7. Cooper, M.D. Navigating the Safety Culture Construct: A Review of the Evidence; B-Safe Management Solutions Inc.: Franklin, IN, USA, 2016. [Google Scholar]
  8. Pidgeon, N. Safety culture: Key theoretical issues. Work Stress 1998, 12, 202–216. [Google Scholar] [CrossRef]
  9. Milijić, N.; Mihajlović, I.; Nikolić, D.; Živković, Ž. Multicriteria analysis of safety climate measurements at workplaces in production industries in Serbia. Int. J. Ind. Ergon. 2014, 44, 510–519. [Google Scholar] [CrossRef]
  10. Chen, Y.; Liu, K.; Chang, C. Practical application of safety climate: A case study in the Taiwanese steel industry. Int. J. Ind. Ergon. 2018, 67, 67–72. [Google Scholar] [CrossRef]
  11. Vecchio-Sadus, A.; Griffiths, S. Marketing strategies for enhancing safety culture. Saf. Sci. 2004, 42, 601–619. [Google Scholar] [CrossRef]
  12. Zohar, D. Thirty years of safety climate research: Reflections and future directions. Accid. Anal. Prev. 2010, 42, 1517–1522. [Google Scholar] [CrossRef]
  13. Guldenmund, F.W. Understanding and Exploring Safety Culture. Ph.D. Thesis, TU Delft. Delft University of Technology, Delft, The Netherland, 2010. [Google Scholar]
  14. Seo, D.; Torabi, M.R.; Blair, E.H.; Ellis, N.T. A cross-validation of safety climate scale using confirmatory factor analytic approach. J. Saf. Res. 2004, 35, 427–445. [Google Scholar] [CrossRef]
  15. Hall, M.E. Measuring the Safety Climate of Steel Mini-Mill Workers Using an Instrument Validated by Structural Equation Modeling. Ph.D. Thesis, The University of Tennessee, Knoxville, TN, USA, 2006. [Google Scholar]
  16. Li, Y.; Guldenmund, F.W. Safety management systems: A broad overview of the literature. Saf. Sci. 2018, 103, 94–123. [Google Scholar] [CrossRef]
  17. Molenaar, K.R.; Park, J.; Washington, S. Framework for measuring corporate safety culture and its impact on construction safety performance. J. Constr. Eng. Manag. 2009, 135, 488–496. [Google Scholar] [CrossRef] [Green Version]
  18. Vinodkumar, M.; Bhasi, M. Safety management practices and safety behaviour: Assessing the mediating role of safety knowledge and motivation. Accid. Anal. Prev. 2010, 42, 2082–2093. [Google Scholar] [CrossRef] [PubMed]
  19. Fogarty, G.J.; Shaw, A. Safety climate and the Theory of Planned Behavior: Towards the prediction of unsafe behavior. Accid. Anal. Prev. 2010, 42, 1455–1459. [Google Scholar] [CrossRef] [PubMed] [Green Version]
  20. Itoh, K.; Andersen, H.B. A national survey on healthcare safety culture in Japan: Analysis of 20,000 staff responses from 84 hospitals. Management 2008, 4, 22–29. [Google Scholar]
  21. Wu, Y.; Fujita, S.; Seto, K.; Ito, S.; Matsumoto, K.; Huang, C.-C.; Hasegawa, T. The impact of nurse working hours on patient safety culture: A cross-national survey including Japan, the United States and Chinese Taiwan using the Hospital Survey on Patient Safety Culture. BMC Health Serv. Res. 2013, 13, 394–401. [Google Scholar] [CrossRef] [PubMed] [Green Version]
  22. Freiwald, D.R. The Effects of Ethical Leadership and Organizational Safety Culture on Safety Outcomes. Ph.D. Thesis, Embry-Riddle Aeronautical University, Daytona Beach, FL, USA, 2013. [Google Scholar]
  23. Wilpert, B.; Itoigawa, N. Safety Culture in Nuclear Power Operations; CRC Press: Boca Raton, FL, USA, 2001. [Google Scholar]
  24. Takano, K.I.; Kojima, M.; Hasegawa, N.; Hirose, A. Interrelationships Between Organizational Factors and Major Safety Indicators. Saf. Cult. Nucl. Power Oper. 2001, 189–206. [Google Scholar]
  25. McKinley, I.G.; Grogan, H.A.; McKinley, L.E. Fukushima: Overview of relevant international experience. Genshiryoku Backend Kenkyu 2011, 18, 89–99. [Google Scholar]
  26. Funabashi, Y.; Kitazawa, K. Fukushima in review: A complex disaster, a disastrous response. Bull. At. Sci. 2012, 68, 9–21. [Google Scholar] [CrossRef]
  27. Holt, M.; Campbell, R.J.; Nikitin, M.B. Fukushima nuclear disaster. Congr. Res. Serv. 2012, 7–5700. [Google Scholar]
  28. Thomas, S. What will the Fukushima disaster change? Energy Policy 2012, 45, 12–17. [Google Scholar] [CrossRef]
  29. Lipscy, P.Y.; Kushida, K.E.; Incerti, T. The Fukushima Disaster and Japan’s Nuclear Plant Vulnerability in Comparative Perspective. Environ. Sci. Technol. 2013, 47, 6082–6088. [Google Scholar] [CrossRef] [PubMed]
  30. Hollnagel, E.; Fujita, Y. The Fukushima Disaster—Systemic Failures as The Lack of Resilience. Nucl. Eng. Technol. 2013, 45, 13–20. [Google Scholar] [CrossRef] [Green Version]
  31. Kastenberg, W.E. Ethics, risk, and safety culture: Reflections on Fukushima and beyond. J. Risk Res. 2014, 18, 304–316. [Google Scholar] [CrossRef]
  32. Mabon, L.; Kawabe, M. Engagement on risk and uncertainty—Lessons from coastal regions of Fukushima Prefecture, Japan after the 2011 nuclear disaster? J. Risk Res. 2016, 21, 1297–1312. [Google Scholar] [CrossRef] [Green Version]
  33. Hsu, S.H.; Lee, C.-C.; Wu, M.-C.; Takano, K. A cross-cultural study of organizational factors on safety: Japanese vs. Taiwanese oil refinery plants. Accid. Anal. Prev. 2008, 40, 24–34. [Google Scholar] [CrossRef]
  34. Huang, J.W. Taiwan’s Petrochemical Industry in Transition; Showwe: Taipei, 2007. (In Chinese) [Google Scholar]
  35. Hosny, G.; Ea, E.; Ea, S. A Comparative Assessment of Safety Climate Among Petroleum Companies. Egypt. J. Occup. Med. 2017, 41, 307–324. [Google Scholar]
  36. Kao, C.-S.; Lai, W.H.; Chuang, T.F.; Lee, J.-C. Safety culture factors, group differences, and risk perception in five petrochemical plants. Process Saf. Prog. 2008, 27, 145–152. [Google Scholar] [CrossRef]
  37. Alrehaili, O. Assessing Safety Culture among Personnel in Governmental Construction Sites at Saudi Arabia: A Quantitative Study Approach. Electronic Theses and Dissertations. 5261. University of Central Florida, USA. 2016. Available online: https://stars.library.ucf.edu/etd/5261 (accessed on 24 February 2020).
  38. Garson, G.D. Partial Least Squares: Regression and Structural Equation Models; Statistical Associates Publishers: Asheboro, NC, USA, 2016. [Google Scholar]
  39. Hair, J.F., Jr.; Hult, G.T.M.; Ringle, C.; Sarstedt, M. A Primer on Partial Least Squares Structural Equation Modeling (PLS-SEM); Sage Publications: Thousand Oaks, CA, USA, 2013. [Google Scholar]
  40. Fornell, C.; Larcker, D.F. Evaluating structural equation models with unobservable variables and measurement error. J. Mark. Res. 1981, 18, 39–50. [Google Scholar] [CrossRef]
  41. Cronbach, L.J. Coefficient alpha and the internal structure of tests. Psychometrika 1951, 16, 297–334. [Google Scholar] [CrossRef] [Green Version]
  42. Carmines, E.G.; Zeller, R.A. Reliability and Validity Assessment; Sage Publications: Thousand Oaks, CA, USA, 1979; Volume 17. [Google Scholar]
  43. Byrne, B.M. Structural Equation Modeling with Mplus: Basic Concepts, Applications, and Programming; Routledge: London, UK, 2013. [Google Scholar]
  44. Schumacker, R.E.; Lomax, R.G. A Beginner’s Guide to Structural Equation Modeling; Psychology Press: East Sussex, UK, 2004. [Google Scholar]
  45. Molenaar, K.; Washington, S.; Diekmann, J. Structural Equation Model of Construction Contract Dispute Potential. J. Constr. Eng. Manag. 2000, 126, 268–277. [Google Scholar] [CrossRef]
  46. Henseler, J.; Ringle, C.M.; Sarstedt, M. A new criterion for assessing discriminant validity in variance-based structural equation modeling. J. Acad. Mark. Sci. 2015, 43, 115–135. [Google Scholar] [CrossRef] [Green Version]
  47. Hair, J.F., Jr.; Sarstedt, M.; Hopkins, L.; Kuppelwieser, V.G. Partial least squares structural equation modeling (PLS-SEM). Eur. Bus. Rev. 2014, 26, 106–121. [Google Scholar] [CrossRef]
  48. Wiegmann, D.A.; Zhang, H.; Von Thaden, T.L.; Sharma, G.; Gibbons, A.M. Safety culture: An integrative review. Int. J. Aviat. Psychol. 2004, 14, 117–134. [Google Scholar] [CrossRef]
  49. Chai, T.; Draxler, R.R. Root mean square error (RMSE) or mean absolute error (MAE)?—Arguments against avoiding RMSE in the literature. Geosci. Model Dev. 2014, 7, 1247–1250. [Google Scholar] [CrossRef] [Green Version]
  50. Alper, S.J.; Karsh, B.T. A systematic review of safety violations in industry. Accid. Anal. Prev. 2009, 41, 739–754. [Google Scholar] [CrossRef] [PubMed]
  51. Laurence, D. Safety rules and regulations on mine sites–the problem and a solution. J. Saf. Res. 2005, 36, 39–50. [Google Scholar] [CrossRef]
  52. Wills, A.R.; Watson, B.; Biggs, H.C. Comparing safety climate factors as predictors of work-related driving behavior. J. Saf. Res. 2006, 37, 375–383. [Google Scholar] [CrossRef] [Green Version]
  53. Rundmo, T.; Hale, A.R. Managers’ attitudes towards safety and accident prevention. Saf. Sci. 2003, 41, 557–574. [Google Scholar] [CrossRef]
  54. Yadegaridehkordi, E.; Nilashi, M.; Nasir, M.H.N.B.M.; Ibrahim, O. Predicting determinants of hotel success and development using Structural Equation Modelling (SEM)-ANFIS method. Tour. Manag. 2018, 66, 364–386. [Google Scholar] [CrossRef]
  55. Ahani, A.; Rahim, N.Z.A.; Nilashi, M. Forecasting social CRM adoption in SMEs: A combined SEM-neural network method. Comput. Human Behav. 2017, 75, 560–578. [Google Scholar] [CrossRef]
  56. Liébana-Cabanillas, F.; Marinković, V.; Kalinić, Z. A SEM-neural network approach for predicting antecedents of m-commerce acceptance. Int. J. Inf. Manag. 2017, 37, 14–24. [Google Scholar] [CrossRef]
  57. Sharma, S.K.; Joshi, A.; Sharma, H. A multi-analytical approach to predict the Facebook usage in higher education. Comput. Human Behav. 2016, 55, 340–353. [Google Scholar] [CrossRef]
  58. Guldenmund, F.W. The nature of safety culture: A review of theory and research. Saf. Sci. 2000, 34, 215–257. [Google Scholar] [CrossRef]
Figure 1. The hypothesized conceptual model.
Safety 06 00014 g001
Figure 2. A final structural model with standardized path coefficients.
Safety 06 00014 g002
Figure 3. Proposed ANFIS model structure.
Safety 06 00014 g003
Table 1. Model constructs and their corresponding item measures.
Construct and Item Measure Description
Construct 1: Management commitment (MC)
MC1The company’s management provides efficient work safety training for workers
MC2If I report a mistake to my supervisor, management supports me
MC3Management encourages workers to report every incident about safety to a supervisor
MC4Management strongly supports safety for workers
MC5Managers support work safety even if it causes a delay in work
MC6My managers sometimes ignore work safety violations
MC7My managers frequently speak unofficially with workers about safety
MC8My management allows workers to work by being sensitive to safety rules
MC9My supervisor gives importance to my opinion for improving work safety
Construct 2: Employees personnel attitude (EPA)
EPA1Work safety rules provide a safer work environment
EPA2I make sure to use necessary safety equipment
EPA3I alert my colleagues who act contrary to work safety rules
EPA4If my colleagues do not take any notice, I notify my manager about unsafe work
EPA5I try to follow work safety rules, even if they decrease my performance
EPA6It is more likely to have an accident in a workplace where there are no work safety rules
EPA7Work safety rules are important and necessary to prevent accidents at my work
Construct 3: Coworkers safety support (CSS)
CSS1Most workers notify personnel who are taking risks
CSS2Most workers support workplace safety policies
CSS3My colleagues usually suggest that I ignore work safety rules
CSS4My colleagues point out each other’s deficiencies in work safety
CSS5My colleagues want to help each other with work safety
CSS6My colleagues attach importance to the assessment for incidents that can cause accidents
Construct 4: Workplace pressure (WP)
WP1Completing work is more important than doing work in safe ways
WP2I sometimes compromise on safety to finish the work on time
WP3Sometimes, it is expected from me to do more work than to do it safely
WP4It is difficult to work when applying all work safety rules
WP5In my workplace, cutting corners and risky attitudes are common because of the heavy workload
WP6I am sometimes not sure if work can be done by following work safety rules
WP7I can easily get necessary safety equipment from my workplace
Construct 5: Safety management system (SMS)
SMS1Safety feedback and comments are always presented from and to management
SMS2There is an understanding that workers will be thanked for their safety
SMS3My company often offers safety incentives to site managers, site personnel and project engineers
SMS4Safety rewards presented by my company are valuable
SMS5Safety responsibility and accountability are clearly described
SMS6Site managers and field personnel place importance on safety
SMS7There are dedicated safety agents, and they usually observe and correct field personnel’s unsafe acts
SMS8Field personnel are aware that unsafe performance will be punished and not tolerated
SMS9Unsafe performance is consistently punished with reasonable levels that fit the violation
SMS10Safety is always reinforced, even if a violation occurred without accident
SMS11Management places importance on safety, and it is a strategic concern for top management
SMS12Everyone is responsible for safety, not just safety staff
SMS13My company policies and actions demonstrate a sincere commitment to safety
SMS14Hazard analysis, prevention and control are very important and often performed at the petrochemical site
SMS15Unsafe behavior identification with necessary corrections is often performed
Construct 6: Violation behavior (VB)
VB1I feel it is essentially important to maintain safety at all times
VB2I believe safety in the workplace is a key issue
VB3I feel that it is compulsory to expend effort to decrease accidents and incidents at my workplace
VB4I feel it is important to encourage others to use safety practices
VB5I feel it is important to promote safety programs
Construct 7: Personnel safety motivation (PSM)
PSM1I am capable of following all safety regulations and procedures
PSM2It is clear to me how to follow work safety rules and procedures
PSM3I have made safety errors due to not knowing how to work safely
PSM4I have rarely made errors that caused risks in working
Construct 8: Personnel error behavior (PEB)
PEB1I carefully follow work safety rules and procedures when assigned a petrochemical task
PEB2I can perform a task with which I am familiar without looking at written procedures and manuscripts
PEB3I intentionally bend formal procedures to finish work on time
PEB4I have ignored some parts of procedures and do not record these to make work easier in abnormal circumstances
PEB5I am conscious of my responsibility about work safety
Table 2. Profile of respondents.
Demographic VariableAll (N = 883)
Frequency(%)
Gender
1. Male87499
2. Female91
Age
1. Less than 2613415.2
2. 26-3014816.8
3. 31-35809.1
4. 36-40667.5
5. 41-4511212.7
6. Older than 4534338.8
Work experience
1. Less than 5 years16718.9
2. 6–10 years21624.5
3. 11–15 years606.8
4. 16–20 years778.7
5. More than 21 years36341.1
Table 3. Study hypotheses.
H1Management commitment has a statistically significant effect on violation behavior.
H2Employees personnel attitude has a statistically significant effect on violation behavior.
H3Coworkers safety support has a statistically significant effect on violation behavior.
H4Workplace pressure has a statistically significant effect on violation behavior.
H5Safety management system has a statistically significant effect on violation behavior.
H6Management commitment has a statistically significant effect on personnel safety motivation.
H7Employees personnel attitude has a statistically significant effect on personnel safety motivation.
H8Coworkers safety support has a statistically significant effect on personnel safety motivation.
H9Workplace pressure has a statistically significant effect on personnel safety motivation.
H10Safety management system has a statistically significant effect on personnel safety motivation.
H11Management commitment has a statistically significant effect on personnel error behavior.
H12Employees personnel attitude has a statistically significant effect on personnel error behavior.
H13Coworkers safety support has a statistically significant effect on personnel error behavior.
H14Workplace pressure has a statistically significant effect on personnel error behavior.
H15Safety management system has a statistically significant effect on personnel error behavior.
Table 4. Means, standard deviation, and correlations.
MeanS.D.MCEPACSSWPSMSVBPSMPEB
MC3.850.53
EPA3.880.490.56
CSS3.700.480.680.58
WP1.560.52−0.54−0.53−0.49
SMS4.120.530.640.640.72−0.61
VB4.480.430.450.450.39−0.450.59
PSM
PEB
1.38
2.88
0.74
0.41
−0.31
0.53
−0.32
0.57
−0.33
0.57
0.49
−0.62
−0.38
0.67
0.28
0.58

−0.48

-
Notes: Correlations are significant at p ≤ 0.01 Abbreviations: Management commitment (MC); employees personnel attitude (EPA); coworkers safety support (CSS); workplace pressure (WP); safety management system (SMS); violation behavior (VB); personnel safety motivation (PSM); personnel error behavior (PEB).
Table 5. Reliability and convergent validity: Comparison of the initial and final structural model.
Number of ItemsCronbach’s AlphaAverage Variance Extracted (AVE)Composite Reliability
ConstructsInitial ModelFinal ModelInitial ModelFinal ModelInitial ModelFinal ModelInitial ModelFinal Model
MC980.7910.8720.4990.5250.8600.892
EPA740.7610.7910.4080.5530.8270.832
CSS650.7220.8500.5260.6250.8120.893
WP760.7290.8210.4590.5310.8100.870
SMS15140.8830.9240.4890.5060.9100.934
VB550.8880.8880.6930.6930.9180.918
PSM420.1800.8310.5610.8550.0630.922
PEB520.0700.7020.4360.7430.0050.852
Table 6. Hypothesis testing results.
RelationshipPath Coefficient (β)t-Statisticsp-ValueTest Result: HypothesisR2
MC → VB−0.0330.6680.504H1: unsupported0.393
EPA → VB0.0862.1260.034H2: supported
CSS → VB−0.0992.2570.024H3: supported
WP → VB−0.1443.7350.000H4: supported
SMS → VB0.56810.6320.000H5: supported
MC → PSM−0.0140.2740.784H6: unsupported0.433
EPA → PSM0.2145.4400.000H7: supported
CSS → PSM0.1102.2230.027H8: supported
WP → PSM−0.1854.9090.000H9: supported
SMS → PSM0.2814.4220.000H10: supported
MC → PEB−0.1022.1740.030H11: supported0.474
EPA → PEB0.1403.5270.000H12: supported
CSS → PEB0.1352.7450.006H13: supported
WP → PEB−0.1804.6350.000H14: supported
SMS → PEB0.4337.6360.000H15: supported
Table 7. ANFIS best configuration for violation behavior, personnel safety motivation, and personnel error behavior (dependent variables) according to the type of membership function.
Violation BehaviorPersonnel Safety MotivationPersonnel Error Behavior
Membership FunctionNumber of Membership FunctionRMSENumber of Membership FunctionRMSENumber of Membership FunctionRMSE
DSIGMF21.65922.34822.345
346.398341.538344.927
GAUSS2MF21.79822.60321.880
347.215329.042363.680
GAUSSMF21.85021.41821.815
37.42538.63336.977
GBELLMF21.89321.46823.479
314.605313.488317.037
PIMF21.69322.60922.419
340.553322.012331.659
PSIGMF21.65922.34822.345
346.398341.538344.927
TRAPMF21.86422.23021.694
36.90139.68936.971
TRIMF20.88321.07020.723
311.78736.61339.343
Note: The bold value is the lowest RMSE value.
Table 8. ANFIS sensitivity analysis results.
RMSE
AbsentInputsVBPSMPEB
-MC, EPA, CSS, WP, SMS0.8831.0700.723
MCEPA, CSS, WP, SMS0.4360.8910.587
EPAMC, CSS, WP, SMS1.3770.5940.910
CSSMC, EPA, WP, SMS0.4680.9060.565
WPMC, EPA, CSS, SMS0.8860.6770.473
SMSMC, EPA, CSS, WP0.5210.6530.495

