Detection of the Species of Origin for Pork, Chicken and Beef in Meat Food Products by Real-Time PCR


Abstract
: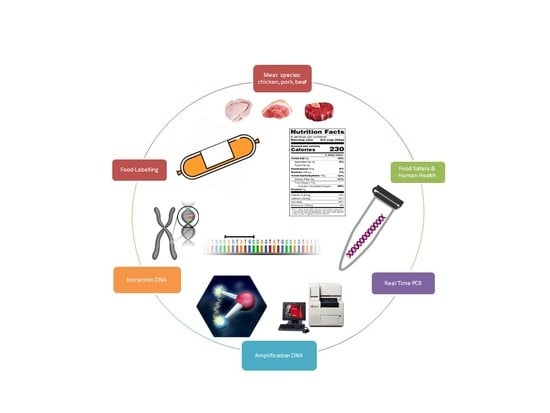
1. Introduction
2. Materials and Methods
2.1. Sampling for the Performance of Molecular Biology Tests
2.2. Extraction of Specific DNA Species from the Meat Products
2.2.1. Preparation of Reagents
2.2.2. Extraction Protocol
2.3. Amplification and Detection by Real Time-PCR to Determine Meat Percentagse
2.3.1. Preparation of the Reaction Mix (Reaction Mix Ref/Reaction Mix Bos, Sus, or Gallus)
2.3.2. Preparation of DNA Standards
2.3.3. Preparation of the Mix for Beef and Pork Real Time-PCR
2.3.4. Preparation of the Mix for Chicken Real Time-PCR
2.4. Expression of the Results
Internal Control of Result Quality
3. Results and Discussions
3.1. Selectivity and Specificity
- PC = number of positive results
- NF = number of negative false results
- NC = number of negative results
- PF = number of positive false results
3.2. Establishment of the Limit of Detection (LOD) and of the Limit of Quantification (LOQ)
3.3. Repeatability
3.3.1. Detection of the Bovine Species (Quality/Quantity)
3.3.2. Detection of the Porcine Species (Quality/Quantity)
3.3.3. Detection of the Gallinacean Species (Quality/Quantity)
3.4. Reproducibility
4. Conclusions
Author Contributions
Funding
Conflicts of Interest
References
- Nakyinsige, K.; Man, Y.B.C.; Sazili, A.Q. Halal authenticity issues in meat and meat products. Meat Sci. 2012, 91, 207–214. [Google Scholar] [CrossRef]
- Rodríguez, M.A.; García, T.; González, I.; Hernández, P.E.; Martín, R. TaqMan real-time PCR for the detection and quantitation of pork in meat mixtures. Meat Sci. 2005, 70, 113–120. [Google Scholar] [CrossRef] [PubMed]
- Vodnar, D.C.; Călinoiu, L.F.; Dulf, F.V.; Ştefănescu, B.E.; Crişan, G.; Socaciu, C. Identification of the bioactive compounds and antioxidant, antimutagenic and antimicrobial activities of thermally processed agro-industrial waste. Food Chem. 2017, 231, 131–140. [Google Scholar] [CrossRef] [PubMed]
- Montowska, M.; Alexander, M.R.; Tucker, G.A.; Barrett, D.A. Authentication of processed meat products by peptidomic analysis using rapid ambient mass spectrometry. Food Chem. 2015, 187, 297–304. [Google Scholar] [CrossRef] [PubMed]
- Sentandreu, M.Á.; Sentandreu, E. Authenticity of meat products: Tools against fraud. Food Res. Int. 2014, 60, 19–29. [Google Scholar] [CrossRef]
- Von Bargen, C.; Brockmeyer, J.; Humpf, H.-U. Meat Authentication: A New HPLC–MS/MS Based Method for the Fast and Sensitive Detection of Horse and Pork in Highly Processed Food. J. Agric. Food Chem. 2014, 62, 9428–9435. [Google Scholar] [CrossRef]
- Doosti, A.; Ghasemi Dehkordi, P.; Rahimi, E. Molecular assay to fraud identification of meat products. J. Food Sci. Technol. 2014, 51, 148–152. [Google Scholar] [CrossRef]
- Lanzilao, I.; Burgalassi, F.; Fancelli, S.; Settimelli, M.; Fani, R. Polymerase Chain Reaction-Restriction Fragment Length Polymorphism Analysis of Mitochondrial cytb Gene from Species of Dairy Interest. Available online: https://www.ingentaconnect.com/content/aoac/jaoac/2005/00000088/00000001/art00018 (accessed on 28 May 2019).
- Karabasanavar, N.S.; Singh, S.P.; Kumar, D.; Shebannavar, S.N. Detection of pork adulteration by highly-specific PCR assay of mitochondrial D-loop. Food Chem. 2014, 145, 530–534. [Google Scholar] [CrossRef]
- Karabasanavar, N.S.; Singh, S.P.; Kumar, D.; Shebannavar, S.N. Development and application of highly specific PCR for detection of chicken (Gallus gallus) meat adulteration. Eur. Food Res. Technol. 2013, 236, 129–134. [Google Scholar] [CrossRef]
- Kesmen, Z.; Sahin, F.; Yetim, H. PCR assay for the identification of animal species in cooked sausages. Meat Sci. 2007, 77, 649–653. [Google Scholar] [CrossRef]
- Walker, J.A.; Hughes, D.A.; Anders, B.A.; Shewale, J.; Sinha, S.K.; Batzer, M.A. Quantitative intra-short interspersed element PCR for species-specific DNA identification. Anal. Biochem. 2003, 316, 259–269. [Google Scholar] [CrossRef]
- Rao, Q.; Hsieh, Y.-H.P. Evaluation of a commercial lateral flow feed test for rapid detection of beef and sheep content in raw and cooked meats. Meat Sci. 2007, 76, 489–494. [Google Scholar] [CrossRef] [PubMed]
- Malmheden Yman, I.; Sandberg, K. Differentiation of meat from horse, donkey and their hybrids (mule/hinny) by electrophoretic separation of albumin. Meat Sci. 1987, 21, 15–23. [Google Scholar] [CrossRef]
- Armstrong, S.G.; Leach, D.N.; Wyllie, S.G. The use of HPLC protein profiles in fish species identification. Food Chem. 1992, 44, 147–155. [Google Scholar] [CrossRef]
- Kesmen, Z. A Research on the Meat Species Identification in Fresh and Processed Meat Products by Using PCR Techniques. Ph.D. Thesis, Ataturk University, Erzurum, Turkey, 2005. [Google Scholar]
- Chikuni, K.; Tabata, T.; Kosugiyama, M.; Monma, M.; Saito, M. Polymerase chain reaction assay for detection of sheep and goat meats. Meat Sci. 1994, 37, 337–345. [Google Scholar] [CrossRef]
- Martinez, I.; Malmheden Yman, I. Species identification in meat products by RAPD analysis. Food Res. Int. 1998, 31, 459–466. [Google Scholar] [CrossRef]
- Bartlett, S.E.; Davidson, W.S. FINS (forensically informative nucleotide sequencing): A procedure for identifying the animal origin of biological specimens. BioTechniques 1992, 12, 408–411. [Google Scholar]
- Brodmann, P.D.; Moor, D. Sensitive and semi-quantitative TaqManTM real-time polymerase chain reaction systems for the detection of beef (Bos taurus) and the detection of the family Mammalia in food and feed. Meat Sci. 2003, 65, 599–607. [Google Scholar] [CrossRef]
- Wolf, C.; Burgener, M.; Hübner, P.; Lüthy, J. PCR-RFLP Analysis of Mitochondrial DNA: Differentiation of Fish Species. LWT-Food Sci. Technol. 2000, 33, 144–150. [Google Scholar] [CrossRef]
- Ballin, N.Z. Authentication of meat and meat products. Meat Sci. 2010, 86, 577–587. [Google Scholar] [CrossRef]
- Sigma-Aldrich. Available online: http://www.sigmaaldrich.com/catalog/product/sigma/dntpca1?lang=en®ion=GB (accessed on 28 May 2019).
- Călinoiu, L.-F.; Ştefănescu, B.E.; Pop, I.D.; Muntean, L.; Vodnar, D.C. Chitosan Coating Applications in Probiotic Microencapsulation. Coatings 2019, 9, 194. [Google Scholar] [CrossRef]
- Călinoiu, L.F.; Cătoi, A.-F.; Vodnar, D.C. Solid-State Yeast Fermented Wheat and Oat Bran as A Route for Delivery of Antioxidants. Antioxidants 2019, 8, 372. [Google Scholar] [CrossRef] [PubMed]
- Stana, A.; Enache, A.; Vodnar, D.C.; Nastasă, C.; Benedec, D.; Ionuț, I.; Login, C.; Marc, G.; Oniga, O.; Tiperciuc, B. New Thiazolyl-triazole Schiff Bases: Synthesis and Evaluation of the Anti-Candida Potential. Molecules 2016, 21, 1595. [Google Scholar] [CrossRef] [PubMed]
- Mocan, A.; Moldovan, C.; Zengin, G.; Bender, O.; Locatelli, M.; Simirgiotis, M.; Atalay, A.; Vodnar, D.C.; Rohn, S.; Crisan, G. UHPLC-QTOF-MS analysis of bioactive constituents from two Romanian Goji (Lycium barbarum L.) berries cultivars and their antioxidant, enzyme inhibitory, and real-time cytotoxicological evaluation. Food Chem. Toxicol. 2018, 115, 414–424. [Google Scholar] [CrossRef] [PubMed]
- Vasile, C.; Rapa, M.; Stefan, M.; Stan, M.; Macavei, S.; Darie-Nita, R.N.; Barbu-Tudoran, L.; Vodnar, D.C.; Popa, E.E.; Stefan, R.; et al. New PLA/ZnO:Cu/Ag bionanocomposites for food packaging. Express Polym. Lett. 2017, 11, 531–544. [Google Scholar] [CrossRef]
- Mitrea, L.; Calinoiu, L.-F.; Precup, G.; Bindea, M.; Rusu, B.; Trif, M.; Stefanescu, B.-E.; Pop, I.-D.; Vodnar, D.-C. Isolated Microorganisms for Bioconversion of Biodiesel-Derived Glycerol Into 1,3-Propanediol. Bull. Univ. Agric. Sci. Vet. Med. Cluj-Napoca-Food Sci. Technol. 2017, 74, 43–49. [Google Scholar] [CrossRef]
- İlhak, O.İ.; Arslan, A. Identification of Meat Species by Polymerase Chain Reaction (PCR) Technique. Turk. J. Vet. Anim. Sci. 2007, 31, 159–163. [Google Scholar]
- Meyer, R.; Candrian, U.; Lüthy, J. Detection of pork in heated meat products by the polymerase chain reaction. J. AOAC Int. 1994, 77, 617–622. [Google Scholar]
- Shabani, H.; Mehdizadeh, M.; Mousavi, S.M.; Dezfouli, E.A.; Solgi, T.; Khodaverdi, M.; Rabiei, M.; Rastegar, H.; Alebouyeh, M. Halal authenticity of gelatin using species-specific PCR. Food Chem. 2015, 184, 203–206. [Google Scholar] [CrossRef]
- Murugaiah, C.; Noor, Z.M.; Mastakim, M.; Bilung, L.M.; Selamat, J.; Radu, S. Meat species identification and Halal authentication analysis using mitochondrial DNA. Meat Sci. 2009, 83, 57–61. [Google Scholar] [CrossRef]
- EUR-Lex-31999R1493-EN-EUR-Lex. Available online: https://eur-lex.europa.eu/legal-content/EN/TXT/?uri=CELEX:31999R1493 (accessed on 28 May 2019).


| Mix Components | Quantity/Reaction (µL) | 10 Reactions (10% Excess) |
|---|---|---|
| Reaction mix Ref/Reaction mix Bos | 18.0 | 198.0 |
| Taq Polymerase | 0.1 | 1.1 |
| Total volume | 18.1 | 199.1 |
| Reaction mix Ref/Reaction mix Sus | 18.0 | 198.0 |
| Taq Polymerase | 0.1 | 1.1 |
| Total volume | 18.1 | 199.1 |
| Reaction mix Ref/Reaction mix Gallus | 19.9 | 218.9 |
| Taq Polymerase | 0.1 | 1.1 |
| Total volume | 20 | 220.0 |
| Standard | Dilutions | No. of Copies/µL | No. of Copies/Reaction (for the Volume of 2 µL Standard DNA Used in the Reaction) |
|---|---|---|---|
| S1 | 45 µL buffer TE + 5 µL Standard DNA | 100,000 copies | 200,000 copies |
| S2 | 45 µL buffer TE + 5 µL S1 | 10,000 copies | 20,000 copies |
| S3 | 45 µL buffer TE + 5 µL S2 | 1000 copies | 2000 copies |
| S4 | 45 µL buffer TE + 5 µL S3 | 100 copies | 200 copies |
| S5 | 45 µL buffer TE + 5 µL S4 | 10 copies | 20 copies |
| Standard | Dilutions | No. Copies/µL | No. of Copies/Reaction (for the Volume of 5 µL Standard DNA Used in the Reaction) |
|---|---|---|---|
| S1 | 45 µL buffer TE + 5 µL Standard DNA | 100,000 copies | 500,000 copies |
| S2 | 45 µL buffer TE + 5 µL S1 | 10,000 copies | 50,000 copies |
| S3 | 45 µL buffer TE + 5 µL S2 | 1000 copies | 5000 copies |
| S4 | 45 µL buffer TE + 5 µL S3 | 100 copies | 500 copies |
| S5 | 45 µL buffer TE + 5 µL S4 | 10 copies | 50 copies |
| Settings | Blockcycler | Rotorcycler | Lightcycler |
|---|---|---|---|
| Initial denaturation (HOLD) Cycles Denaturation Annealing/Extension (CYCLE) | 5 min, 95 °C 45 10 s, 95 °C 15 s, 62 °C 30 s, 65 °C | 1 min, 95 °C 45 5 s, 95 °C 10 s, 62 °C 15 s, 65 °C | 1 min, 95 °C 45 5 s, 95 °C 10 s, 62 °C 15 s, 65 °C |
| Temperature of the transition/time ratio | Maximum | Maximum | Maximum |
| Fluorescence detector | Detection: End of extension phase Reporter: FAM Quencher: TAMRA Passive reference; none | Reporter: FAM | Channel 530/610 or F1/F2 Acquisition mode: single in extension phase |
| Settings | Blockcycler | Lightcycler/Rotorcycler |
|---|---|---|
| Initial denaturation (HOLD) | 5 min, 95 °C | 1 min, 95 °C |
| Cycles | 45 | 45 |
| Denaturation | 15 s, 95 °C | 10 s, 95 °C |
| Annealing/Extension (CYCLE) | 30 s, 60 °C | 15 s, 60 °C |
| Temperature of the transition/time ratio | Maximum | 20 °C/s |
| Fluorescence detector | Detection: End of the extension phase Reporter: FAM Quencher: TAMRA | Channel 530/610 or F1/F2 Acquisition mode: single in the extension phase |
| PRODUCT | DATE | |||||
|---|---|---|---|---|---|---|
| 13.03.2018 | 14.03.2018 | 28.03.2018 | 29.03.2018 | 23.06.2018 | 27.06.2018 | |
| Chicken Detection | Chicken Detection | Beef Detection | Beef Detection | Pork Detection | Pork Detection | |
| Chicken sausage | positive | positive | negative | negative | negative | negative |
| Chicken sausage | positive | positive | negative | negative | negative | negative |
| Chicken sausage | positive | positive | negative | negative | negative | negative |
| Beef bologna | negative | negative | positive | positive | negative | negative |
| Beef bologna | negative | negative | positive | positive | negative | negative |
| Beef bologna | negative | negative | positive | positive | negative | negative |
| Pork bologna | negative | negative | negative | negative | positive | positive |
| Pork bologna | negative | negative | negative | negative | positive | positive |
| Pork bologna | negative | negative | negative | negative | positive | positive |
| Standard | No. of Copies Certified DNA | Dilution Factor | The Determined Number of Copies | |
|---|---|---|---|---|
| Total Meat | Species | |||
| S5 beef | 20 | 1:4 | 6.53 | 5.42 |
| S5 chicken | 50 | 1:10 | 5.08 | 4.28 |
| S5 pork | 20 | 1:4 | 8.10 | 8.08 |
| Product | No. of DNA Copies | Beef% | |
|---|---|---|---|
| Total Protein (Ref) | Beef Species (Bos) | ||
| Beef bologna | 4430 | 3053 | 81.32 |
| 4473 | 2890 | 76.24 | |
| 2323 | 1545 | 78.48 | |
| 2201 | 1804 | 96.72 | |
| 5580 | 3982 | 84.21 | |
| 5577 | 3995 | 84.53 | |
| Positive control | 1028 | 868.6 | R% = 84.49, K = 1.18 |
| Reproducibility from Serial Analysis | Replicates | Statistical Calculation | |||||||||
|---|---|---|---|---|---|---|---|---|---|---|---|
| Matrix | Data | 1 | 2 | 3 | 4 | 5 | 6 | average | sr | RSDr | r |
| beef bologna | 06.04.2018 | 81.32 | 76.24 | 78.48 | 96.72 | 84.21 | 84.53 | 83.583 | 7.197 | 0.086 | 20.150 |
| Reproducibility from Serial Analysis | Replicates (Beef No. of Copies) | ||||||||||
|---|---|---|---|---|---|---|---|---|---|---|---|
| Matrix | Data | Conc. level | 1 | 2 | 3 | 4 | 5 | M | Std dev | RSDr | r |
| S5 | 05.04.2018 | 20 copies | 15.98 | 22.75 | 15.60 | 16.01 | 13.57 | 16.78 | 3.485 | 0.208 | 9.757 |
| Reproducibility From Serial Analysis | Replicates | Statistical Calculation | |||||||||
|---|---|---|---|---|---|---|---|---|---|---|---|
| Matrix | Data | 1 | 2 | 3 | 4 | 5 | 6 | average | sr | RSDr | r |
| pork sausages | 02.06.2018 | 23.36 | 21.44 | 21.74 | 23.51 | 23.30 | 23.30 | 22,775 | 3443 | 0.114 | 7242 |
| Reproducibility from Serial Analysis | Replicates (Beef No. of Copies) | Statistical Calculation | ||||||||||
|---|---|---|---|---|---|---|---|---|---|---|---|---|
| Matrix | Data | Conc. level | 1 | 2 | 3 | 4 | 5 | 6 | M | Std dev | RSDr | r |
| S5 | 02.06.2018 | 20 copies | 102.8 | 95.68 | 92.04 | 77.85 | 80.40 | 100.9 | 91,628 | 10.44 | 0.114 | 29.24 |
| Product | No. of DNA Copies | Pork (%) | |
|---|---|---|---|
| Total Protein (Ref) | Pork Species (Sus) | ||
| Pork sausages | 142,700 | 135,900 | 102.85 |
| 172,700 | 153,000 | 95.68 | |
| 139,400 | 118,800 | 92.04 | |
| 117,700 | 84,840 | 77.85 | |
| 140,500 | 104,600 | 80.40 | |
| 139,500 | 130,400 | 100.95 | |
| Positive control | 563.6 | 523 | R% = 92.80; K = 1.08 |
| Reproducibility from Serial Analysis | Replicates | Statistical Calculation | |||||||||
|---|---|---|---|---|---|---|---|---|---|---|---|
| Matrix | Data | 1 | 2 | 3 | 4 | 5 | 6 | average | sr | RSDr | r |
| Chicken sausage | 3 July 2018 | 99.0 | 97.4 | 90.7 | 99.3 | 100 | 96.8 | 97.3 | 3.556 | 0.037 | 9.95 |
| Reproducibility from Serial Analysis | Replicates (Aviary Genomic DNA, No. of Copies) | Statistical Calculation | ||||||||||
|---|---|---|---|---|---|---|---|---|---|---|---|---|
| Matrix | Data | Conc. level | 1 | 2 | 3 | 4 | 5 | 6 | average | sr | RSDr | r |
| S5 | 03 July 2018 | 50 copies | 58.1 | 54.2 | 65.13 | 66.6 | 57.78 | 73.3 | 62.563 | 7.102 | 0.114 | 19.886 |
| Product | No. of DNA Copies | Chicken% | |
|---|---|---|---|
| Total Protein (Ref) | Chicken Species (Gallus) | ||
| Chicken sausage | 117,400 | 110,700 | 99.01 |
| 119,200 | 110,600 | 97.42 | |
| 61,250 | 52,930 | 90.74 | |
| 61,330 | 58,020 | 99.33 | |
| 99,540 | 95,650 | 100.90 | |
| 102,500 | 94,550 | 96.86 | |
| Positive control | 569.9 | 542.2 | R% = 95.14 K = 1.05 |
| Analyst/Date | Product | No. of DNA Copies | Beef% | |
|---|---|---|---|---|
| Total Protein (Ref) | Beef Species (Bos) | |||
| Analyst 1/28.04.2018 | Beef bologna | 4430 | 3053 | 81.32 |
| 4473 | 2890 | 76.24 | ||
| 2323 | 1545 | 78.48 | ||
| 2201 | 1804 | 96.72 | ||
| 5580 | 3982 | 84.21 | ||
| 5577 | 3995 | 84.53 | ||
| Positive control | 1028 | 868.6 | R% = 84.49 K = 1.18 | |
| Analyst 2/06.04.2018 | Beef bologna | 3558 | 2519 | 82.83 |
| 3624 | 2730 | 88.13 | ||
| 1724 | 1421 | 96.43 | ||
| 1833 | 1490 | 95.10 | ||
| 4985 | 3415 | 80.15 | ||
| 5200 | 3542 | 79.69 | ||
| Positive control | 887.4 | 754 | R% = 84.96 K = 1.17 | |
| Analyst | Data | Beef% | |
|---|---|---|---|
| 81.32 | |||
| 76.24 | |||
| Analyst 1 | 28/03/2018 | 78.48 | |
| 96.72 | |||
| 84.21 | |||
| 84.53 | |||
| 82.83 | |||
| 88.13 | |||
| Analyst 2 | 06.04.2018 | 96.43 | |
| 95.10 | |||
| 80.15 | |||
| 79.69 | |||
| Calculations | Average | 85,319 | |
| Sr | 7.190 | ||
| RSDr | 0.084 | ||
| r | 20,132 | ||
| Analyst/Date | Product | No. of DNA Copies | Pork% | |
|---|---|---|---|---|
| Total Protein (Ref) | Pork Species (Sus) | |||
| Analyst 1/02.11.2018 | Pork bologna | 142,700 | 135,900 | 102.85 |
| 172,700 | 153,000 | 95.68 | ||
| 139,400 | 118,800 | 92.04 | ||
| 117,700 | 84,840 | 77.85 | ||
| 140,500 | 104,600 | 80.40 | ||
| 139,500 | 130,400 | 100.95 | ||
| Positive control | 563.6 | 523.0 | R% = 92.80 K = 1.08 | |
| Analyst 2/06.11.2018 | Pork bologna | 141,500 | 139,000 | 99.22 |
| 162,100 | 166,700 | 103.87 | ||
| 163,100 | 171,500 | 106.20 | ||
| 167,600 | 170,000 | 102.45 | ||
| 146,500 | 158,600 | 109.34 | ||
| Positive control | 567.7 | 561.0 | R% = 98.82 K = 1.01 | |
| Analyst | Data | Pork Species (%) | |
|---|---|---|---|
| 102.85 | |||
| 95.68 | |||
| Analyst 1 | 02/11/2018 | 78.48 | |
| 77.85 | |||
| 80.40 | |||
| 100.95 | |||
| 99.22 | |||
| 103.87 | |||
| Analyst 2 | 06/11/2018 | 106.20 | |
| 102.45 | |||
| 109.34 | |||
| Calculations | Average | 96,117 | |
| Sr | 11,606 | ||
| RSDr | 0.121 | ||
| r | 32,497 | ||
| Analyst/Date | Product | No. of DNA Copies | Chicken% | |
|---|---|---|---|---|
| Total Protein (Ref) | Chicken Species (Gallus) | |||
| Analyst 1/03.07.2018 | Chicken sausage | 117,400 | 110,700 | 99.01 |
| 119,200 | 110,600 | 97.42 | ||
| 61,250 | 52,930 | 90.74 | ||
| 61,330 | 58,020 | 99.33 | ||
| 99,540 | 95,650 | 100.90 | ||
| 102,500 | 94,550 | 96.86 | ||
| Positive control | 569.9 | 542.2 | R% = 95.14 K = 1.05 | |
| Analyst 2/04.07.2018 | Chicken sausage | 11,990 | 11,670 | 102.20 |
| 13,910 | 13,170 | 99.41 | ||
| 4778 | 4092 | 89.92 | ||
| 5296 | 5149 | 102.09 | ||
| 9293 | 9087 | 102.67 | ||
| 8909 | 8867 | 104.50 | ||
| Positive control | 689.0 | 656.8 | R% = 95.33 K = 1.05 | |
| Analyst | Data | Chicken Species (%) | |
|---|---|---|---|
| 99.01 | |||
| 97.42 | |||
| Analyst 1 | 03/07/2018 | 78.48 | |
| 99.33 | |||
| 100.90 | |||
| 96.86 | |||
| 102.20 | |||
| 99.41 | |||
| Analyst 2 | 04/07/2018 | 96.43 | |
| 102.09 | |||
| 102.67 | |||
| 104.50 | |||
| Calculations | Average | 98.28 | |
| Sr | 6.714 | ||
| RSDr | 0.068 | ||
| r | 18,799 | ||
| Performance Parameters | Unit of Measure (UM) | Performance Criterion | Value Obtained Following Validation | ||
|---|---|---|---|---|---|
| Beef% | Pork% | Chicken% | |||
| Detection limit | % | LOD declared in the SureFood ANIMAL QUANT kit is of 5 DNA copies corresponding to a concentration of 0.1% for chicken and 0.04% for beef and pork. | A common LOD of 8 DNA copies was established | ||
| 0.1% | 0.1% | 0.2% | |||
| Quantification limit | % | 20 DNA copies 0.2% | 20 DNA copies 0.2% | 50 DNA copies 1% | |
| Selectivity/specificity | % | 100 | 100 | ||
| Repeatability | % | RSDr ≤ 25 R = 2.8 × sr | 8.6 20.15 | 11.4 29.24 | 3.70 9.96 |
| Reproducibility | % | RSDR ≤ 35 R = 2.8 × sr | 8.4 20.13 | 12.1 32.49 | 6.8 18.80 |
| Measurement uncertainty | % | Calculated for a confidence range of 95%, k = 2 | 17 | 24.28 | 13.83 |
© 2019 by the authors. Licensee MDPI, Basel, Switzerland. This article is an open access article distributed under the terms and conditions of the Creative Commons Attribution (CC BY) license (http://creativecommons.org/licenses/by/4.0/).
Share and Cite
Chiş, L.-M.; Vodnar, D.C. Detection of the Species of Origin for Pork, Chicken and Beef in Meat Food Products by Real-Time PCR. Safety 2019, 5, 83. https://doi.org/10.3390/safety5040083
Chiş L-M, Vodnar DC. Detection of the Species of Origin for Pork, Chicken and Beef in Meat Food Products by Real-Time PCR. Safety. 2019; 5(4):83. https://doi.org/10.3390/safety5040083
Chicago/Turabian StyleChiş, Lavinia-Maria, and Dan Cristian Vodnar. 2019. "Detection of the Species of Origin for Pork, Chicken and Beef in Meat Food Products by Real-Time PCR" Safety 5, no. 4: 83. https://doi.org/10.3390/safety5040083
APA StyleChiş, L.-M., & Vodnar, D. C. (2019). Detection of the Species of Origin for Pork, Chicken and Beef in Meat Food Products by Real-Time PCR. Safety, 5(4), 83. https://doi.org/10.3390/safety5040083