1. Introduction
Traditional methodologies for analyzing traffic safety problems make use of inferential statistics applied to accident history data, analyzing the relationship between accidents and influencing factors [
1,
2]. The problems of consistency and availability of accident history data for a specific site as well as the methodological challenges posed by the extremely random nature and the uniqueness of accidents have led to the development of complementary approaches for analyzing traffic safety problems, such as traffic conflict techniques (TCTs). The basic hypothesis according to this approach is that there is a close relationship between conflicts and accidents. The interaction between road-users can be described as a continuum of safety related events that are evaluated by some surrogate safety performance indicators. The traffic conflict technique, in some circumstances, is difficult to apply, owing to the hardness in identifying vehicle within larger data sources [
3,
4,
5]. One of the most common methodologies to determine and quantify traffic conflicts is the use of microsimulation [
6,
7] to replicate the interaction between the factors contributing to the conflict and, in some circumstances, to the crash process. The potential of microscopic simulation in traffic safety and traffic conflicts analysis was initially investigated by Darzentas et al. [
8] and has gained a growing interest due to recent developments in human behavior modeling and real time vehicle data acquisition [
9,
10,
11,
12]. However, to make the microsimulation reflective of real interactions among vehicles, a proper calibration process is necessary, considering those based on observational data as input parameters. In this way, an estimate of realistic traffic conflicts can be produced.
The objective of this paper is to assess the validity of a microscopic framework to identify potentially unsafe vehicle interactions, providing a link between simulated surrogate safety indicators and observed accidents. The aim of the analysis is to demonstrate that high-risk locations identified by a microsimulation technique are superimposable to the ones identified by using the historical accidents data.
In
Section 2, the paper traces the development of research studies in modelling driver behavior and safety using the simulation technique.
Section 3 describes the methodological approach followed by the authors. In particular, this section is focused on the microsimulation package employed in the analysis, the surrogate safety indicators and the data used for the experiment. In
Section 4, the authors present the results of the simulation, with the identification of high-risk locations. In
Section 5, the authors discuss the results, in which the potential risk areas are compared to those where real accidents occurred, verifying the ability of the traffic conflict technique to identify real risk scenarios. The paper has been completed with some considerations on the strengths and weaknesses of the proposed methodology and makes suggestions about future developments and studies.
2. Literature Review
In the literature, there are several simulation models that provide measures of safety using surrogate safety measures. These models are able to analyze a set of situations and scenarios: un-signalized intersection, signalized intersection, rear-end, lane changing and bus stop conflicts [
5]. Many software packages determine surrogate safety measures making use of SSAM, a post-processor on the data output from the simulation model, developed by the Federal Highway Administration (FHWA) [
13]. This tool is compatible with the most employed traffic simulation models like VISSIM [
14], AIMSUM [
15], PARAMICS [
16] and TRITONE [
17].
In 2009, Archer and Young [
18] used VISSIM to investigate an incident reduction function at signalized vehicle actuated intersections, exploring the interaction between driver decisions, the dilemma zone and consequent red-light running for light vehicles. This study showed that the employment of a binary logistics function in road safety simulation models allows for the estimation of the number and severity of conflicts using surrogate safety measures. The performance measure considered by the authors was post-encroachment time (PET) and the case study for the experiment was an intersection in outer Melbourne.
Pirdavani et al. [
19] utilized PARAMICS to show the relationship between traffic volume, speed limits and safety. They applied microsimulation technique to evaluate safety effects of policy measures like speed limit at un-signalized intersections. The measure of conflicts they used was PET. However, the simulation model was employed without any calibration, verification nor validation process. Astarita et al. [
17] calibrated TRITONE using Deceleration Rate to Avoid a Crash (DRAC) and Time To Collision (TTC) as surrogate safety measures. Results showed that the methodology allows evaluation of applied traffic control measures in terms of safety.
Mahmud et al. [
20] proposed a division of the surrogate safety performance indicators into temporal and non-temporal proximal indicators. According to this categorization, temporal proximal indicators work under the assumption that when the vehicles are closer, the risk of a collision increases under the hypothesis that each collision is preceded by conflicts. One of the most frequently used temporal indicators is time to collision (TTC), expressed in seconds, which can be defined as expected time for two vehicles to reach a common position on the road assuming their speed and trajectory remain the same. A critical or threshold value is chosen to distinguish between safe and unsafe interactions. A TTC value lower than the selected threshold highlights an unsafe conflict. Different authors studied TTC threshold values, considering different application ambits [
21,
22,
23,
24]. Another commonly used surrogate safety measure is the post-encroachment time (PET), which represents the difference in time between the transit of a couple of vehicles (“offending” and “conflicting” road users) over a common area of potential conflict [
25]. Minderhoud and Bovy [
26] have proposed two new indicators derived from the time-to-collision (TTC) concept: the time exposed time to collision (TET) and the time integrated time-to-collision (TIT). TET represents the sum of all episodes (over the considered time period) in which a driver approaches a front vehicle with a TTC-value below the threshold value. TIT measures the level of safety with the integral of the TTC profile of drivers (in s
2).
Among the non-temporal proximal indicators there are the distance based proximal indicators. The proportion of stopping distance (PSD) was proposed by Allen et al. [
27] in 1978. It can be defined as the ratio between the remaining distance to the potential point of collision and the minimum acceptable stopping distance. Other non-temporal proximal safety indicators are those based on a deceleration rate. The most employed indicator of this category is Deceleration Rate to Avoid the Crash (DRAC) defined by Almqvist et al. [
28], in 1991. DRAC explicitly considers the role of speed differentials and decelerations in traffic flow and is defined in terms of the speed differential between following vehicle (FV) and lead vehicle (LV) divided by their closing time. The LV is responsible for the initial action (braking for a traffic light/stop sign, changing lanes and/or accepting a gap), while the FV responds to this action by braking. Archer [
29], in 2005, defined a risk scenario when the DRAC of a vehicle exceeds a threshold braking value of 3.35 m/s
2. This threshold value was considered also by Guido et al. [
12], in 2011, highlighting higher risk vehicle interactions. Another important indicator derived from DRAC is the crash potential index (CPI) [
9,
11]. CPI is defined as the probability that a given vehicle DRAC exceeds its maximum available deceleration rate (MADR) during a given time interval. MADR is a stochastic component introduced to take into account different vehicles categories and different pavement conditions (e.g., dry/wet) during a braking event that requires a specific DRAC level.
3. Methodology
The proposed methodology was applied to a subset of an urban network of a medium-small city, as better described in
Section 4.1 The safety performances of the network were analyzed using some surrogate safety measures highlighting some potential conflicts scenarios (or risk areas). The areas of greatest risk were obtained from the simulation, calibrated with real traffic flow data. These areas, in the next phase, were compared with those in which real accidents occurred. The fitting between simulated risk areas and real accidents locations was proved using Pearson’s correlation coefficient.
3.1. The Microsimulation Model
The microscopic package TRITONE is capable of simulating freeways and roads with different traffic scenarios. This software overcomes some limitations of other commercial traffic microsimulation packages, because it is open source and has a developer module which allows simulation procedures to be modified and traffic safety performance evaluated, through a series of indicators (Crash Potential Index, Deceleration Rate to Avoid Crash, Available Maximum Deceleration Rate, Time to Collision, etc.). In TRITONE the traffic components are microscopic, and the traffic flow attributes can be represented as resulting from individual vehicles movements. Moreover, the software gives the opportunity to choose different car following models.
For the present study Gipps’s car-following model was selected [
30]. In this model the speed of the follower vehicle is determined by three conditions. The first condition ensures that the vehicle does not exceed the desired speed or free-flow speed. The second condition ensures that the vehicle accelerates to its desired speed. This acceleration increases when the speed of the vehicle is near the initial speed and then decreases when vehicle is approaching the desired speed. The coefficients of the model were obtained from an interpolation curve using data collected on a moderate traffic road. The third condition regulates the speed of the vehicle that depends on the reaction time of the driver.
The equation of Gipps’s car following model is:
where,
Vn(t) is the speed of the target vehicle at time t (m/s),
an is the maximum acceleration (m/s
2) of the target vehicle,
T is the driver’s reaction time (s),
Vdes is the free flow speed (m/s).
The lane-changing model used in TRITONE for the study is the Gipps model [
31]. This model links lane change decisions to urban driving situations, taking into account important factors, such as safety gaps, the position of permanent obstacles, the presence of heavy vehicles and the speed advantage. Based on these criteria, drivers decide whether to move to the adjacent lane or not. The conditions for a vehicle lane changing in the Gipps model are the following:
the presence of permanent obstacles on the vehicle’s current lane;
the presence of lanes for special purposes;
the presence of a heavy vehicle on the current lane of the vehicle;
the target vehicle gains a speed advantage changing its lane.
Regarding the generation model of the vehicle, the time interval τ between the arrivals of two consecutive vehicles is governed by a random distribution of the assignment model [
32].
In order to apply this microscopic package for obtaining the trajectories of the vehicles and hence the potential conflicts based on the surrogate safety measures introduced below, it was necessary to calibrate and validate the simulation model.
The calibration was performed comparing two sets of traffic volumes through the GEH statistic [
33]: (1) observed traffic flow data at intersections, and (2) simulated traffic flow rate at intersections.
A GEH of less than 5.0 is considered a good match between the modelled and observed hourly traffic flow volumes. According to [
34], at least 85% of the volumes in a traffic model should have a GEH of less than 5.0.
The validation was carried out by using a new set of traffic volumes and comparing it with a new set of simulations in which the parameters of the model were calibrated. The goodness of fit of the model was measured employing root-mean square percentage Error (RMSPE).
3.2. Surrogate Safety Measures and Potential Risk Areas by Simulation
In order to obtain simulated surrogate safety measures, and then the potential risk areas, the authors applied the SSAM package to the TRITONE output. SSAM analyzes the vehicles trajectories generated by TRITONE and evaluates the interaction of each vehicle according to scientific criteria (e.g., the magnitude of safety measures) with which it can establish whether there is a potential conflict and to which category it belongs according to the collision angle.
The surrogate safety measures considered in the present study are Time to Collision (TTC) and Post Encroachment Time (PET).
As reported in the literature review section, TTC can be defined as the expected time for two vehicles to reach a common position on the road assuming their speed and trajectory remain the same. The equation form of TTC is:
where, Δ
X is the initial relative distance between the leading and following vehicles,
Lv is the length of the vehicle,
VLv is the initial speed of the leading vehicle, and
VFv is the initial speed of the following vehicle.
A TTC value lower than the selected threshold of 1.50 s highlights a potential conflict.
PET is defined as the time difference between the moment an “offending” vehicle leaves the area of potential collision and the moment the other vehicle arrives in the collision area. A value of PET lower than 5.00 s determines a risk scenario.
As previously introduced, potential conflicts scenarios have been identified in a simulation environment when the above-mentioned surrogate safety measures (TTC and PET), as obtained by SSAM, exceed some thresholds. A potential conflict between vehicles is defined when the values of TTC and PET are simultaneously lower than their respective thresholds.
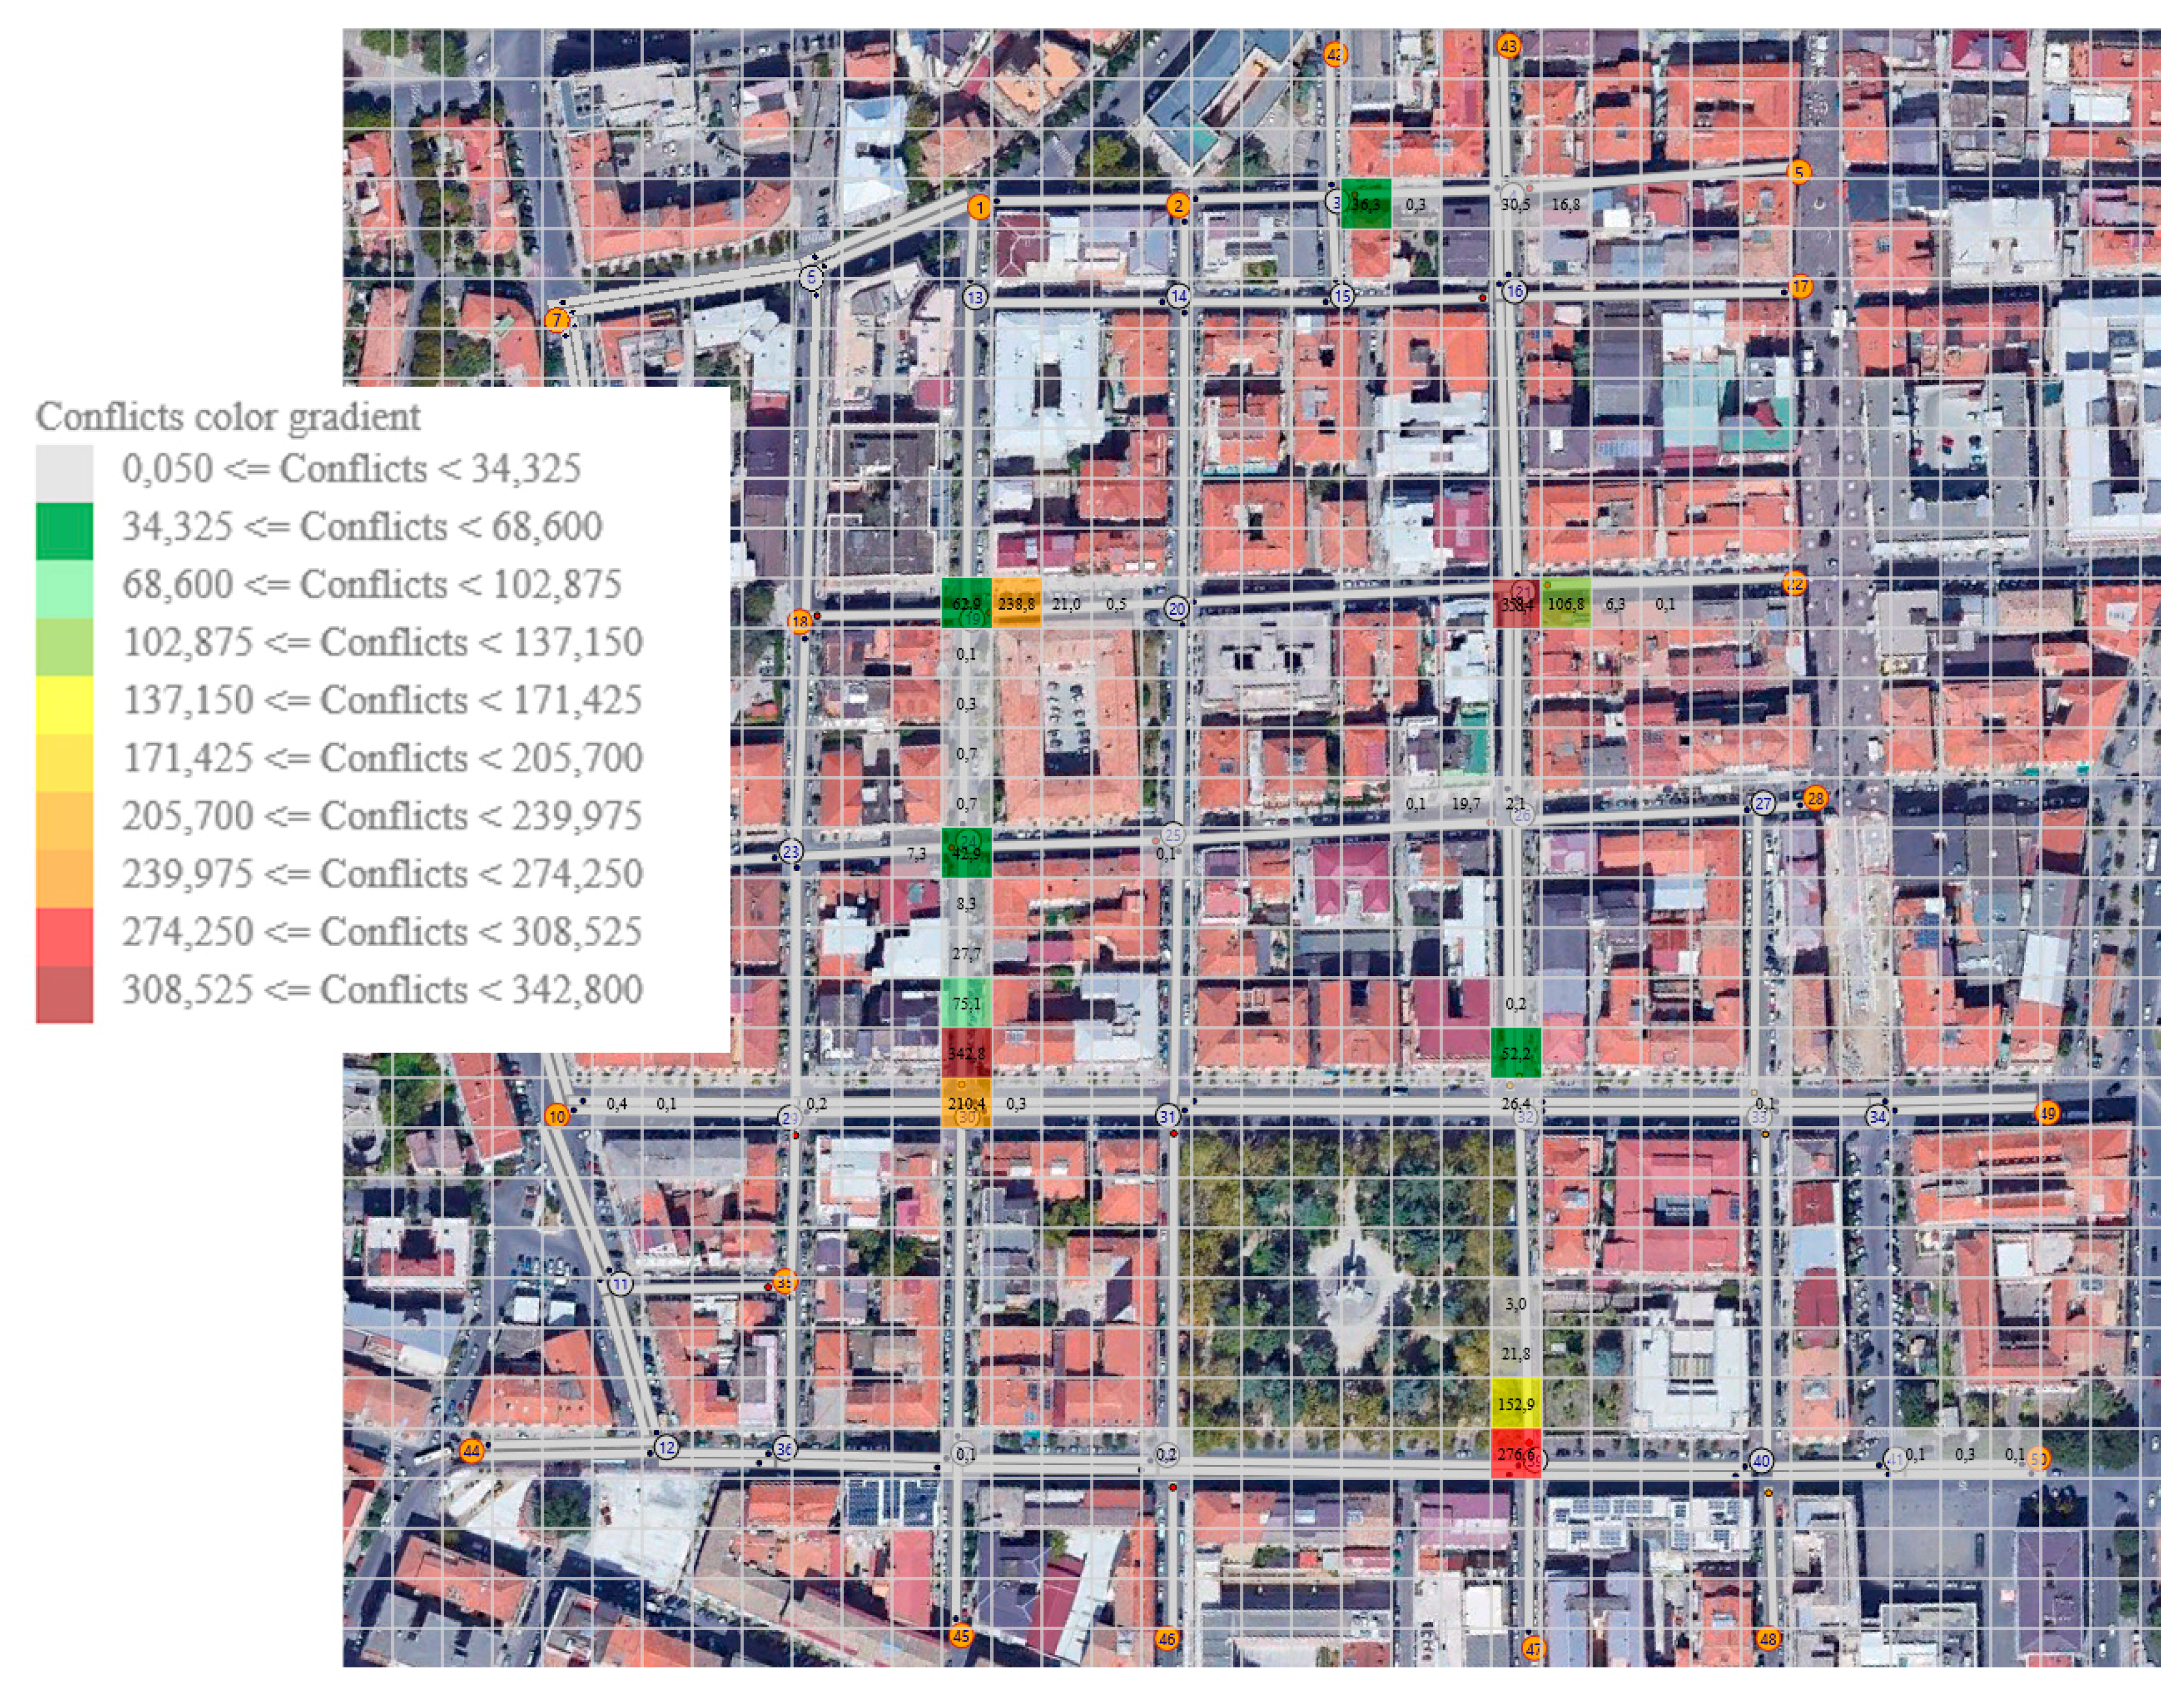
Furthermore, a graphic tool has been implemented as an add-on of TRITONE to allow for a qualitative-quantitative analysis of the areas at greatest risk of collision based on the SSAM analysis. The experimental site has been divided into square zones with a side of 15 m to discretize the network and evaluate the local effects of the vehicle interactions.
3.3. Accident Database
The accidents dataset was obtained from the database of Regional Center for Road Accidents’ Data Collection of the Calabria Region—CRISC (
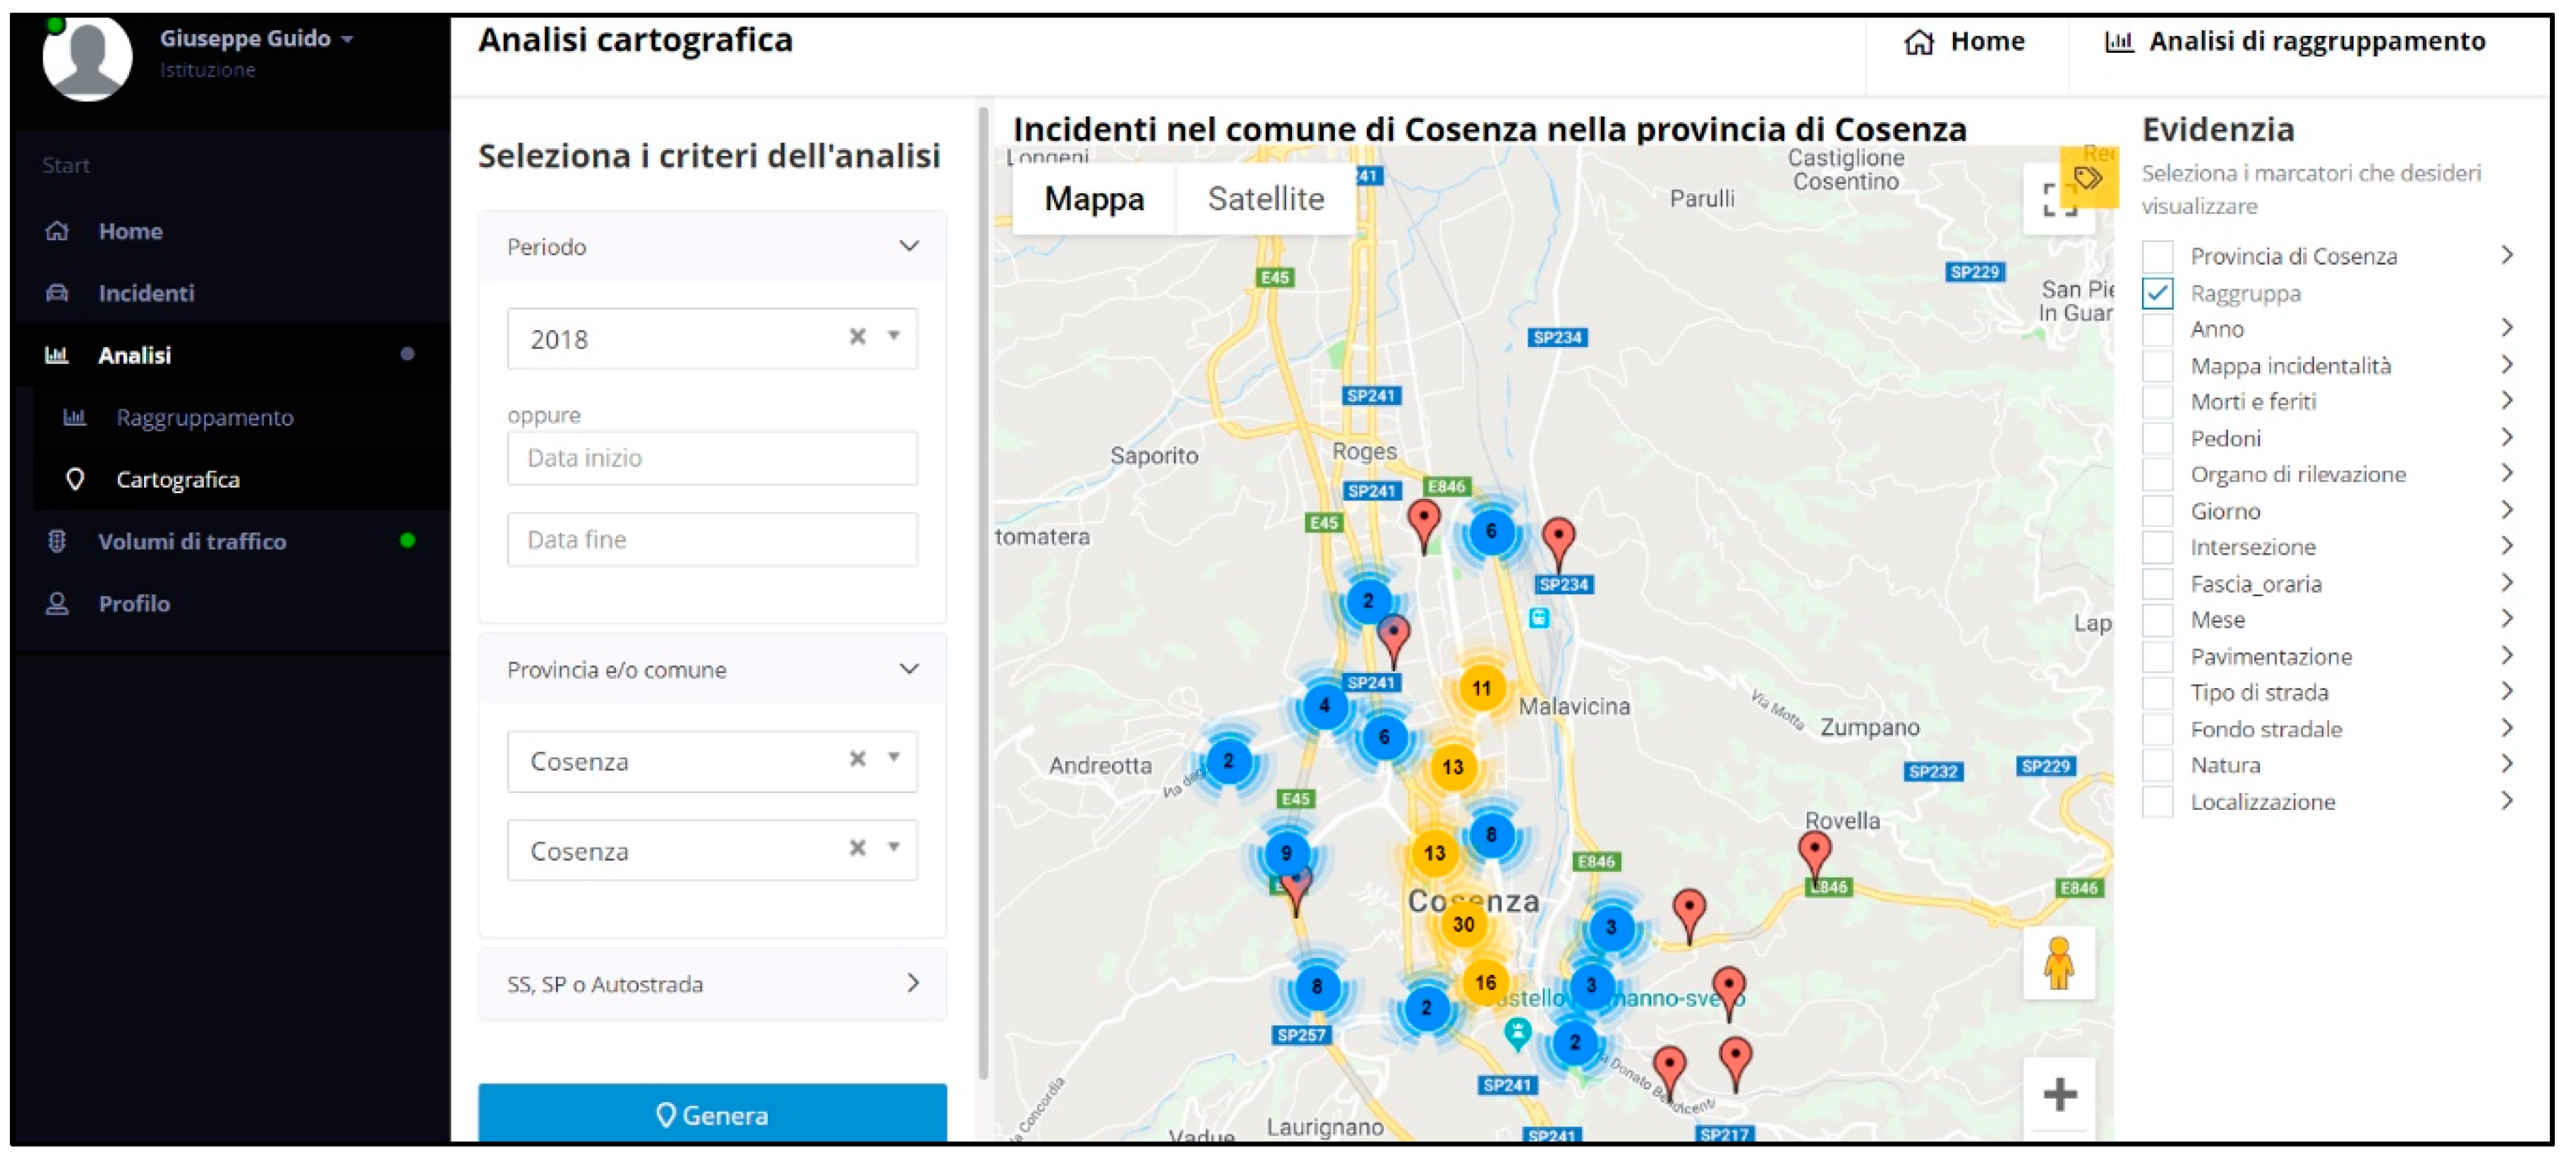
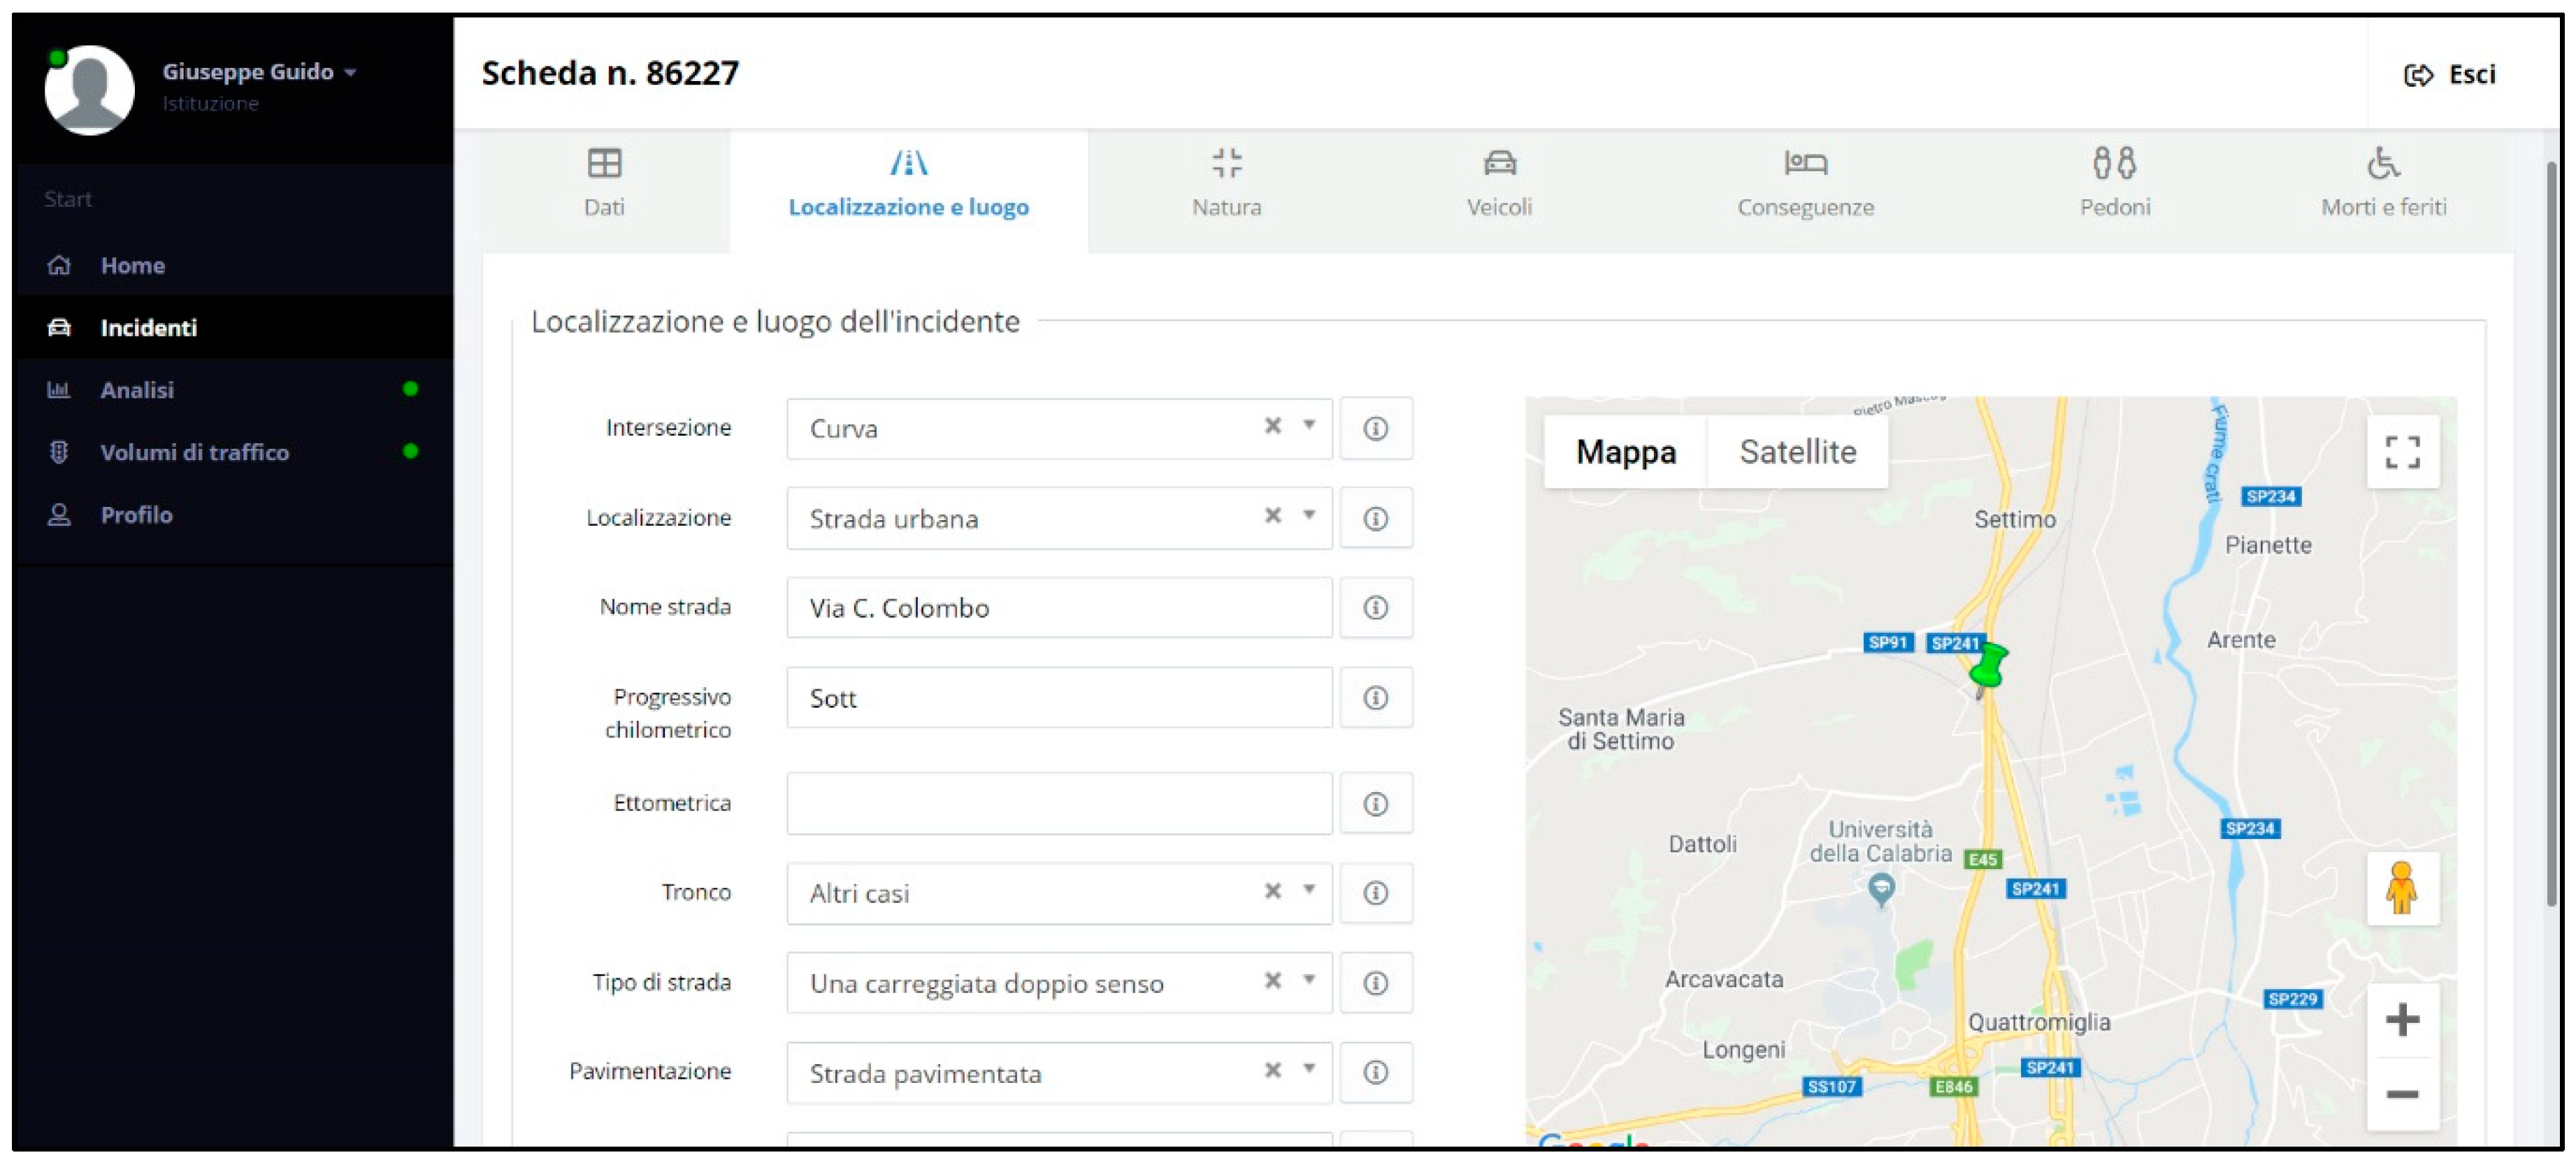
https://sicurezzastradalecalabria.it/). In this dataset, each accident occurrence has a set of information such as accident occurrence time, location, three levels of severity namely fatal, injury, and property damage only (PDO), and other characteristics. The following figures illustrate two screenshots from the CRISC web pages highlighting a sample of accident occurrence locations next to the experimental site (
Figure 1) and a sample of accident information report (
Figure 2).
4. Experimental Results
4.1. Experimental Site Description
As mentioned before, in order to test the reliability of the results produced with the application of the proposed methodology, a test site was selected from an urban road network in Cosenza (Italy). The total population is about 67,000 inhabitants. The area of the test site is 0.14 km
2 (
Figure 3). The subset size of the road network is about 5 km, including 33 intersections, six road north–south oriented segments and six east–west oriented road segments.
4.2. Accident Locations
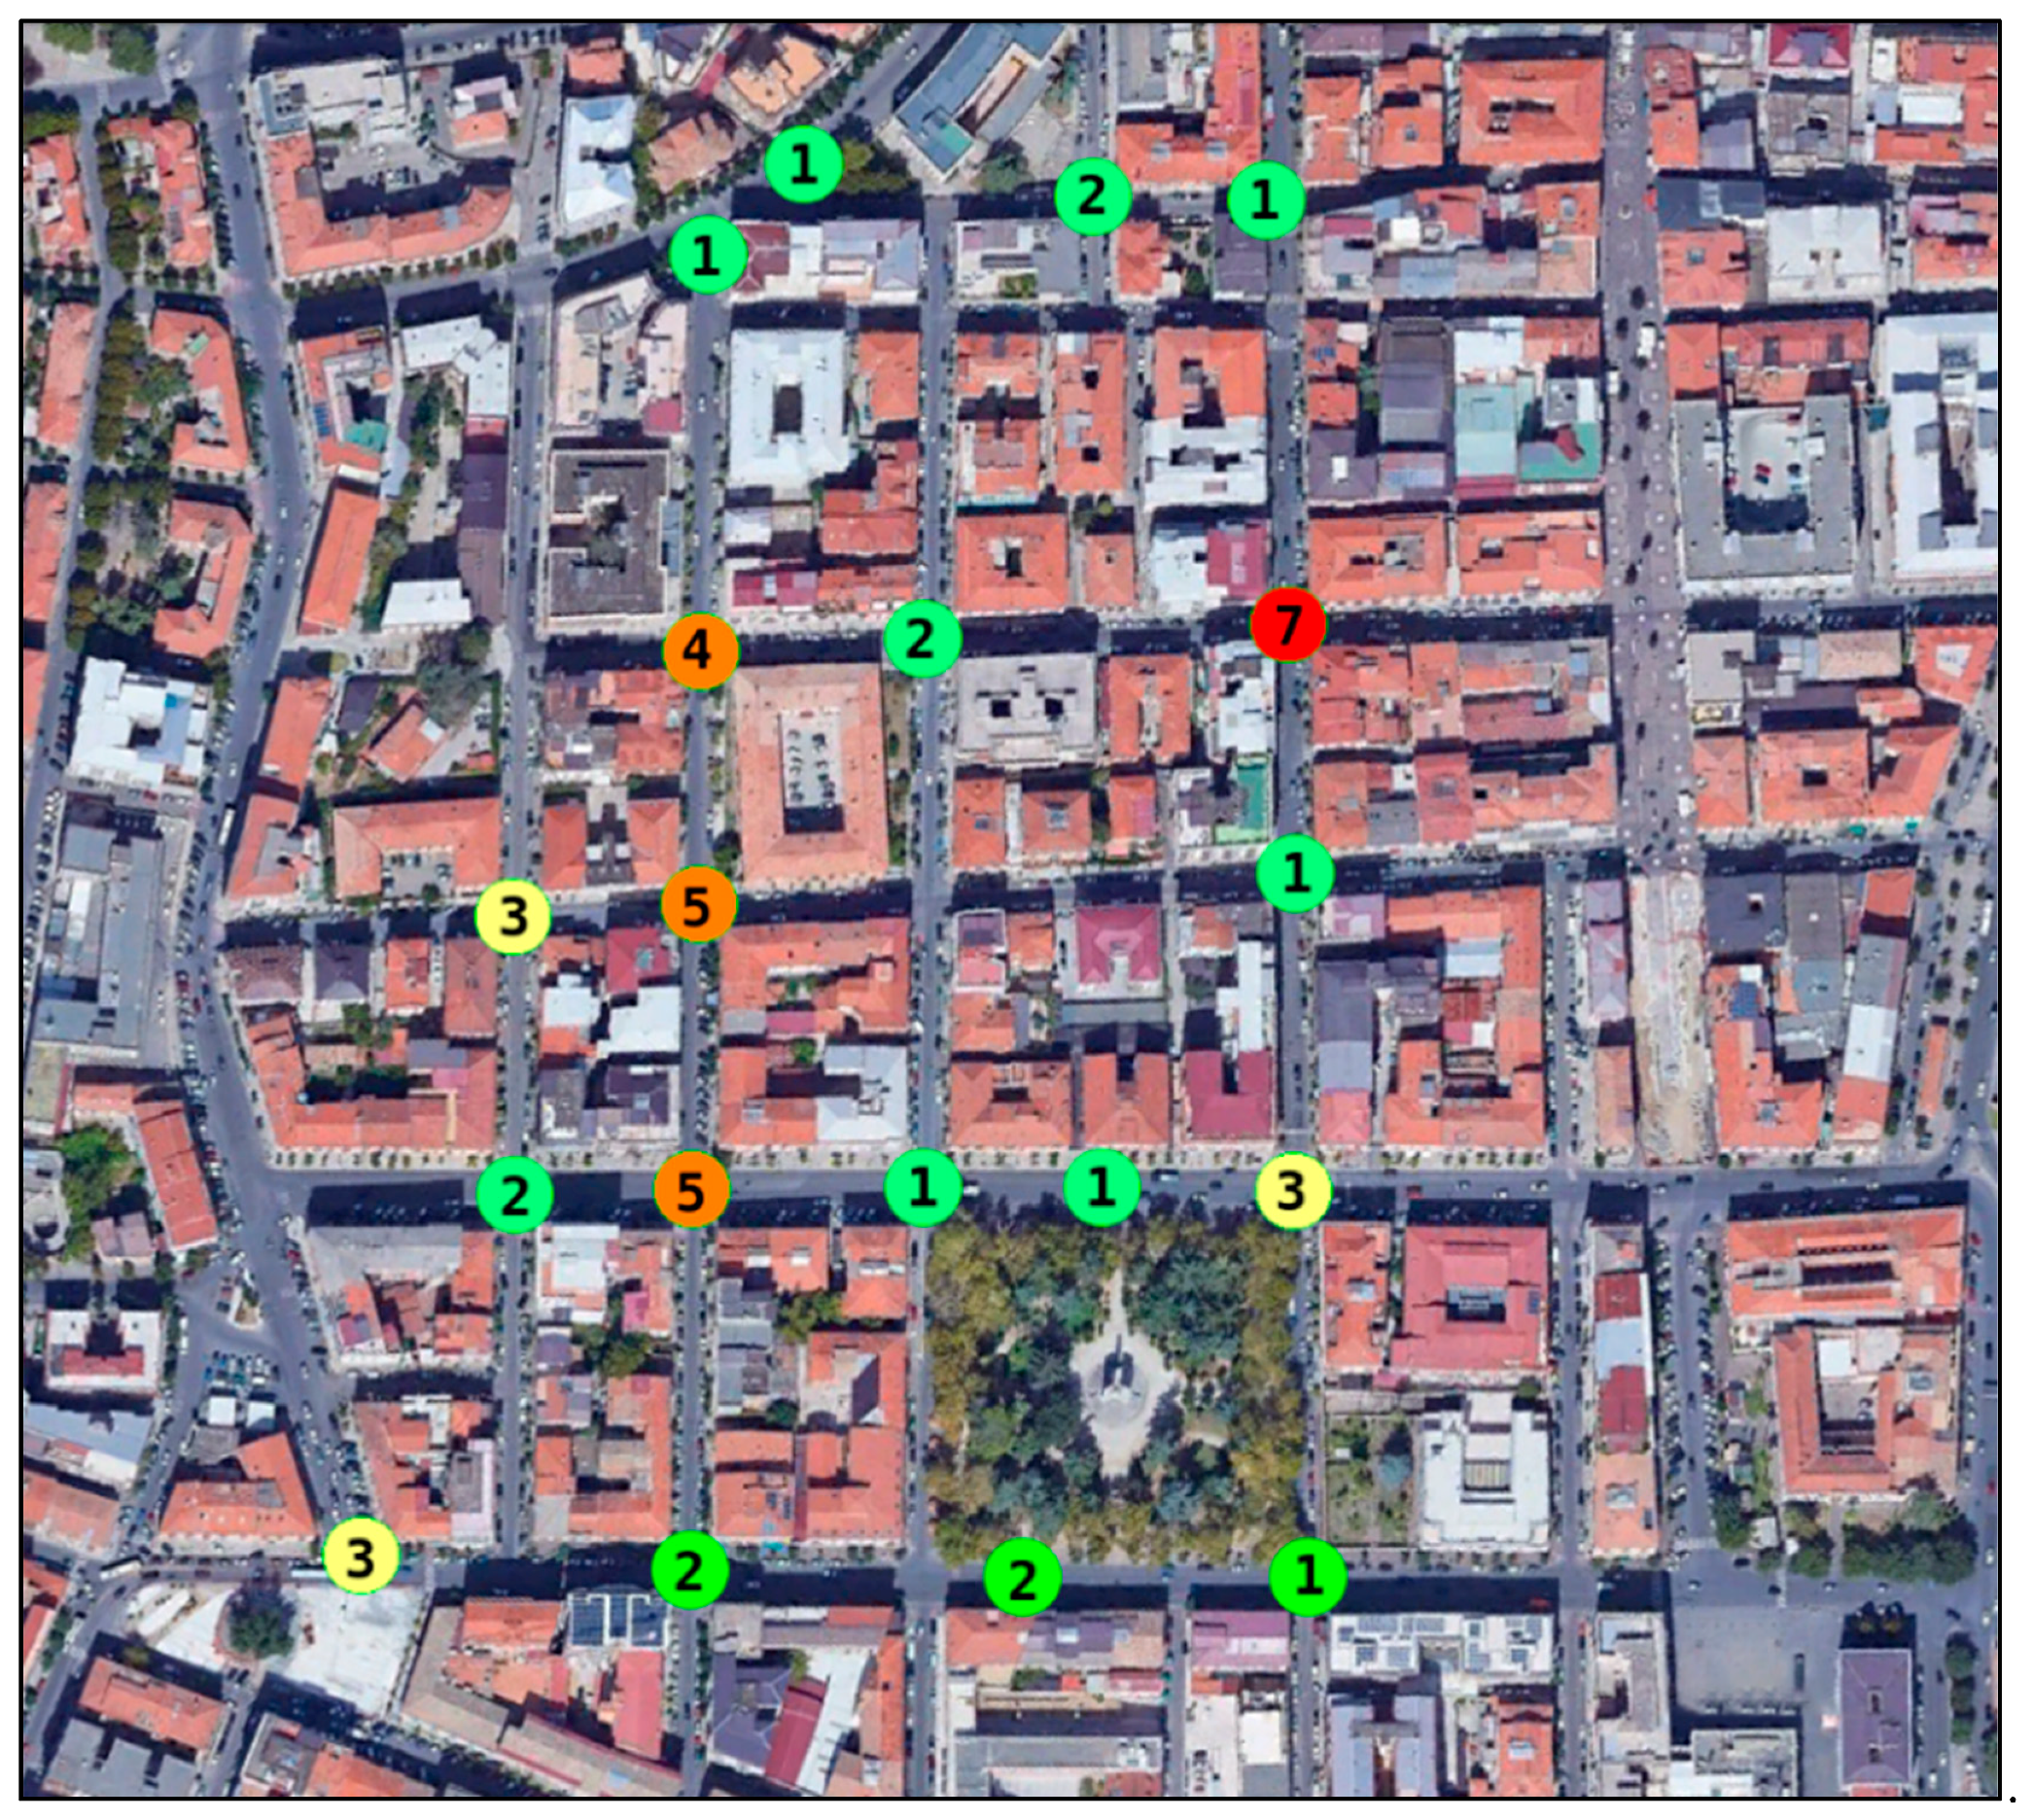
An analysis of the critical points was carried out in the area based on the accidents dataset obtained from the CRISC for a period of five years starting in 2014 (
Figure 4). The accidents we have considered are only those that involved two or more vehicles (e.g., frontal, side and rear-end collisions); no other types of accidents were considered (e.g., accidents between vehicles and pedestrians, or accidents between vehicles and obstacles), as they cannot be evaluated by SSAM. As highlighted in
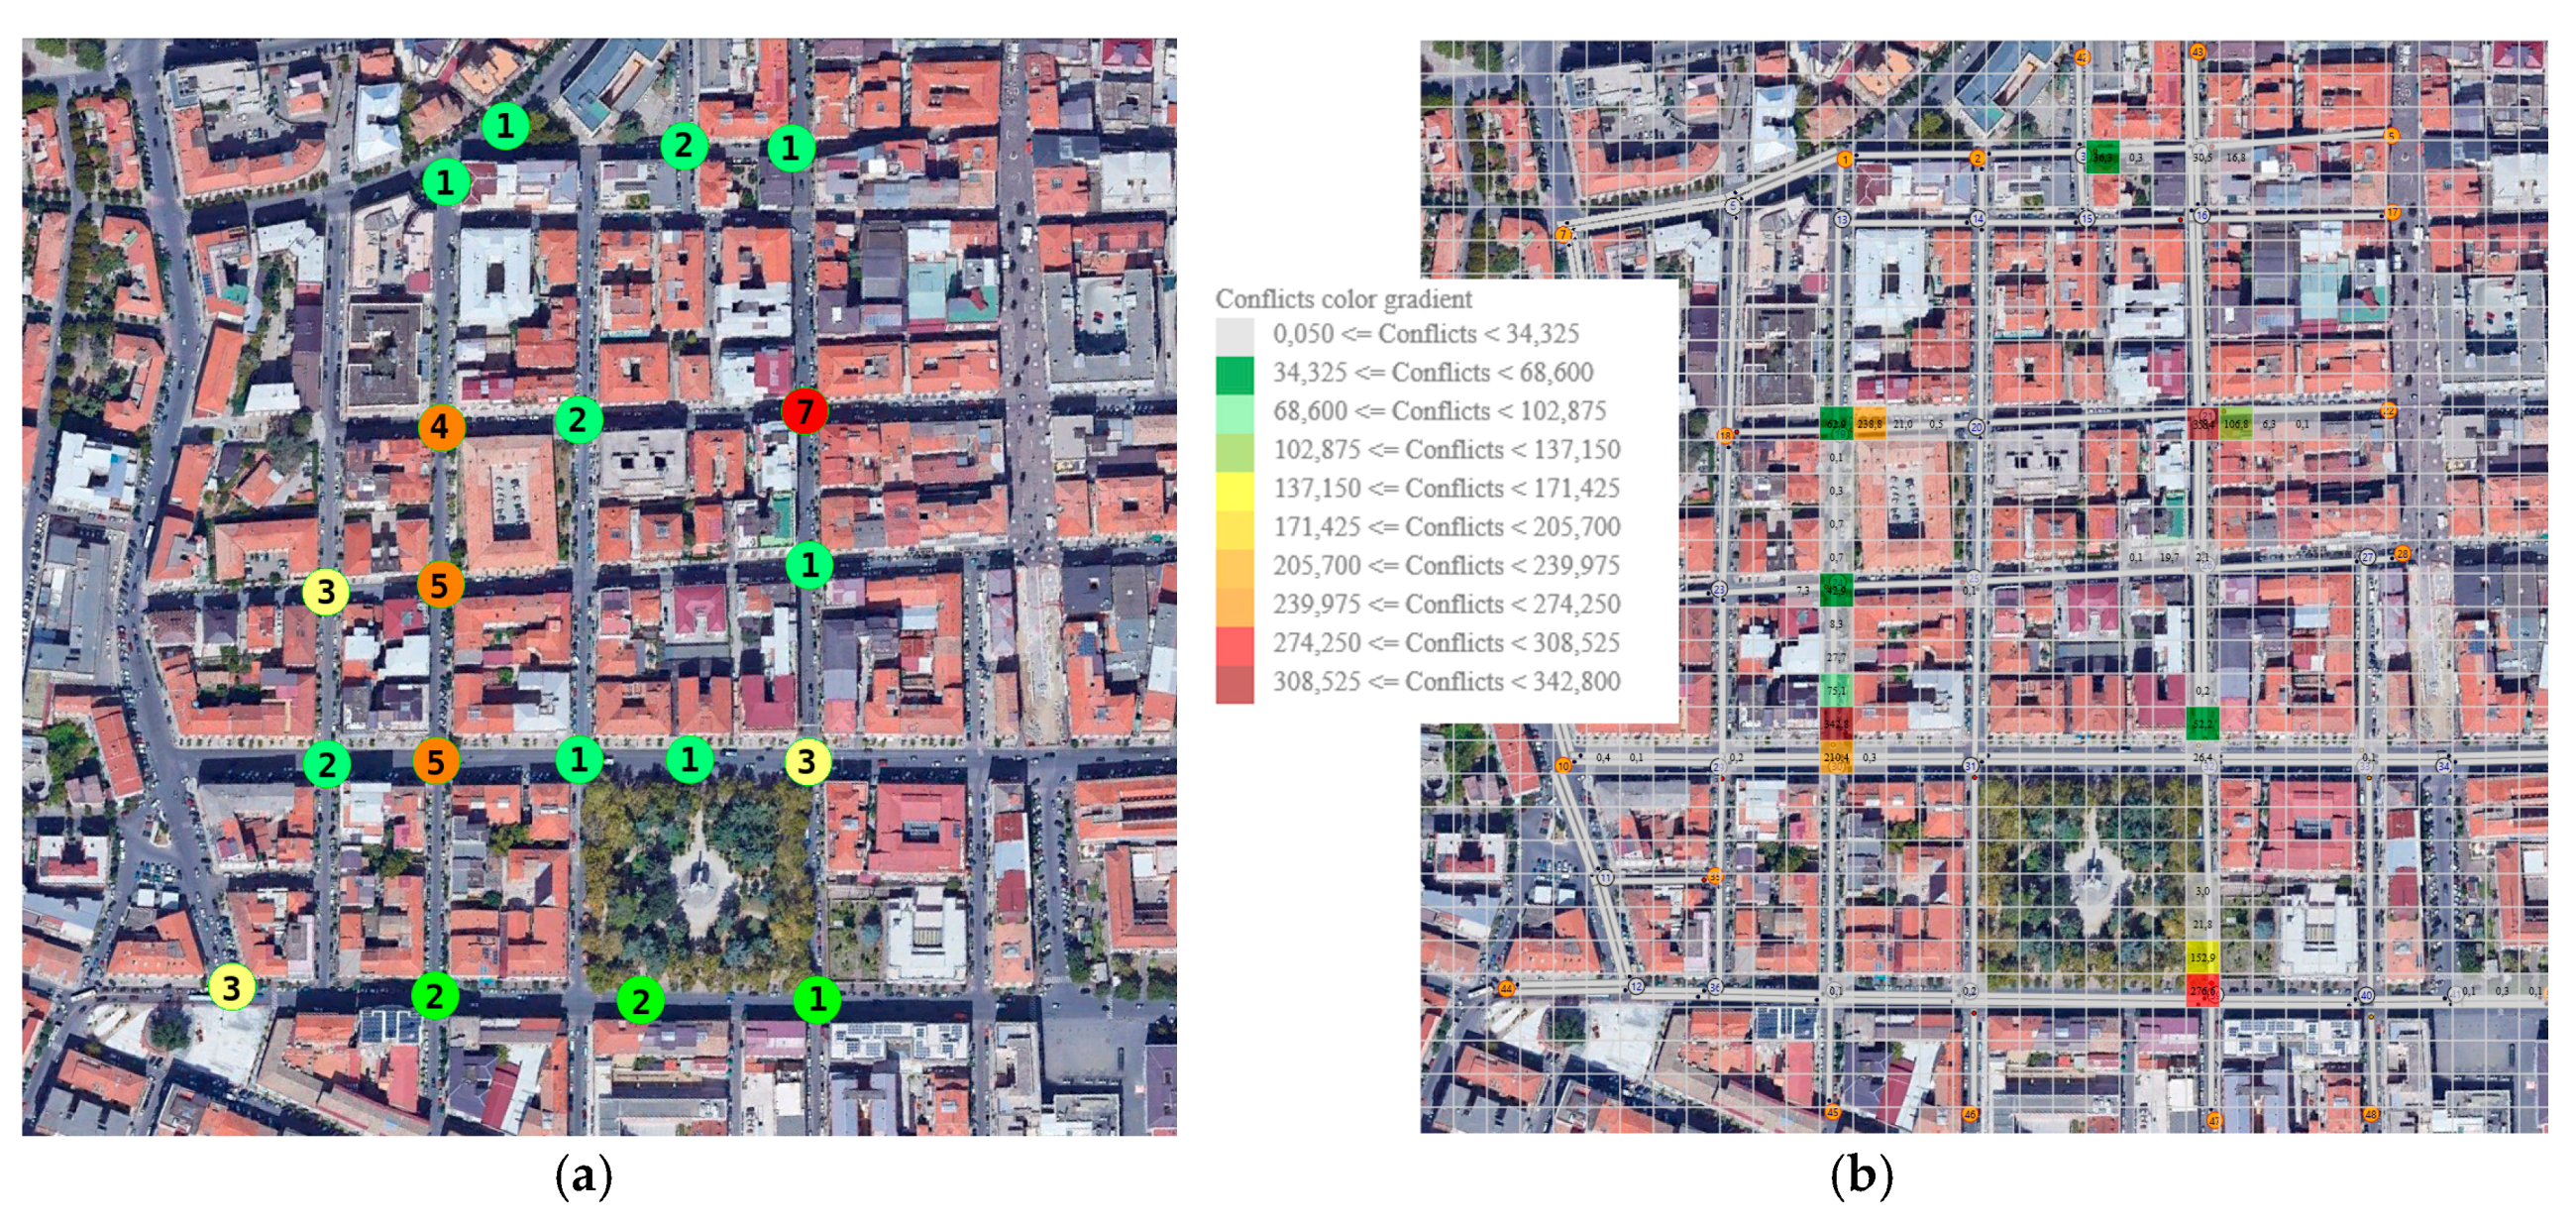
Figure 4, a total of 47 accidents were observed in the study area from 2014 to 2018, almost all of which occurred at intersections. The number in the circle indicates the number of accidents that occurred around the network node.
4.3. Risk Areas Detection by Simulation
The identification of potential conflicts scenarios was performed applying the SSAM package to TRITONE output, as described in
Section 3.2. However, before applying SSAM to obtain TTC and PET values from the simulated vehicles trajectories, a calibration stage of the simulation model was necessary based on the traffic flow volumes of the network links. Traffic flow volumes were previously evaluated with manual counting that allowed establishing average and peak traffic flows and the presence of 4.5% of heavy vehicles. The resulting dynamic O/D matrix that has been used for the dynamic network loading was extended over the 24 h of an average day.
The calibration stage of TRITONE showed that the GEH was lower than 5 (on average 3.14) for 88% of the compared traffic volumes (29 intersections out of 33); therefore, it is possible to assume that the simulation is well calibrated, and that its outputs in terms of network performance are reliable. Furthermore, for the validation stage, a value of RMSPE of 91% was assessed.
Based on this assumption, SSAM was applied to analyze the vehicles trajectories generated for a 24-h simulation and to evaluate TTC and PET values, obtaining an average value of TTC of 1.18 s, and an average value of PET of 2.03 s. Furthermore, the total number of potential conflicts in the simulated network was estimated to be 1758.
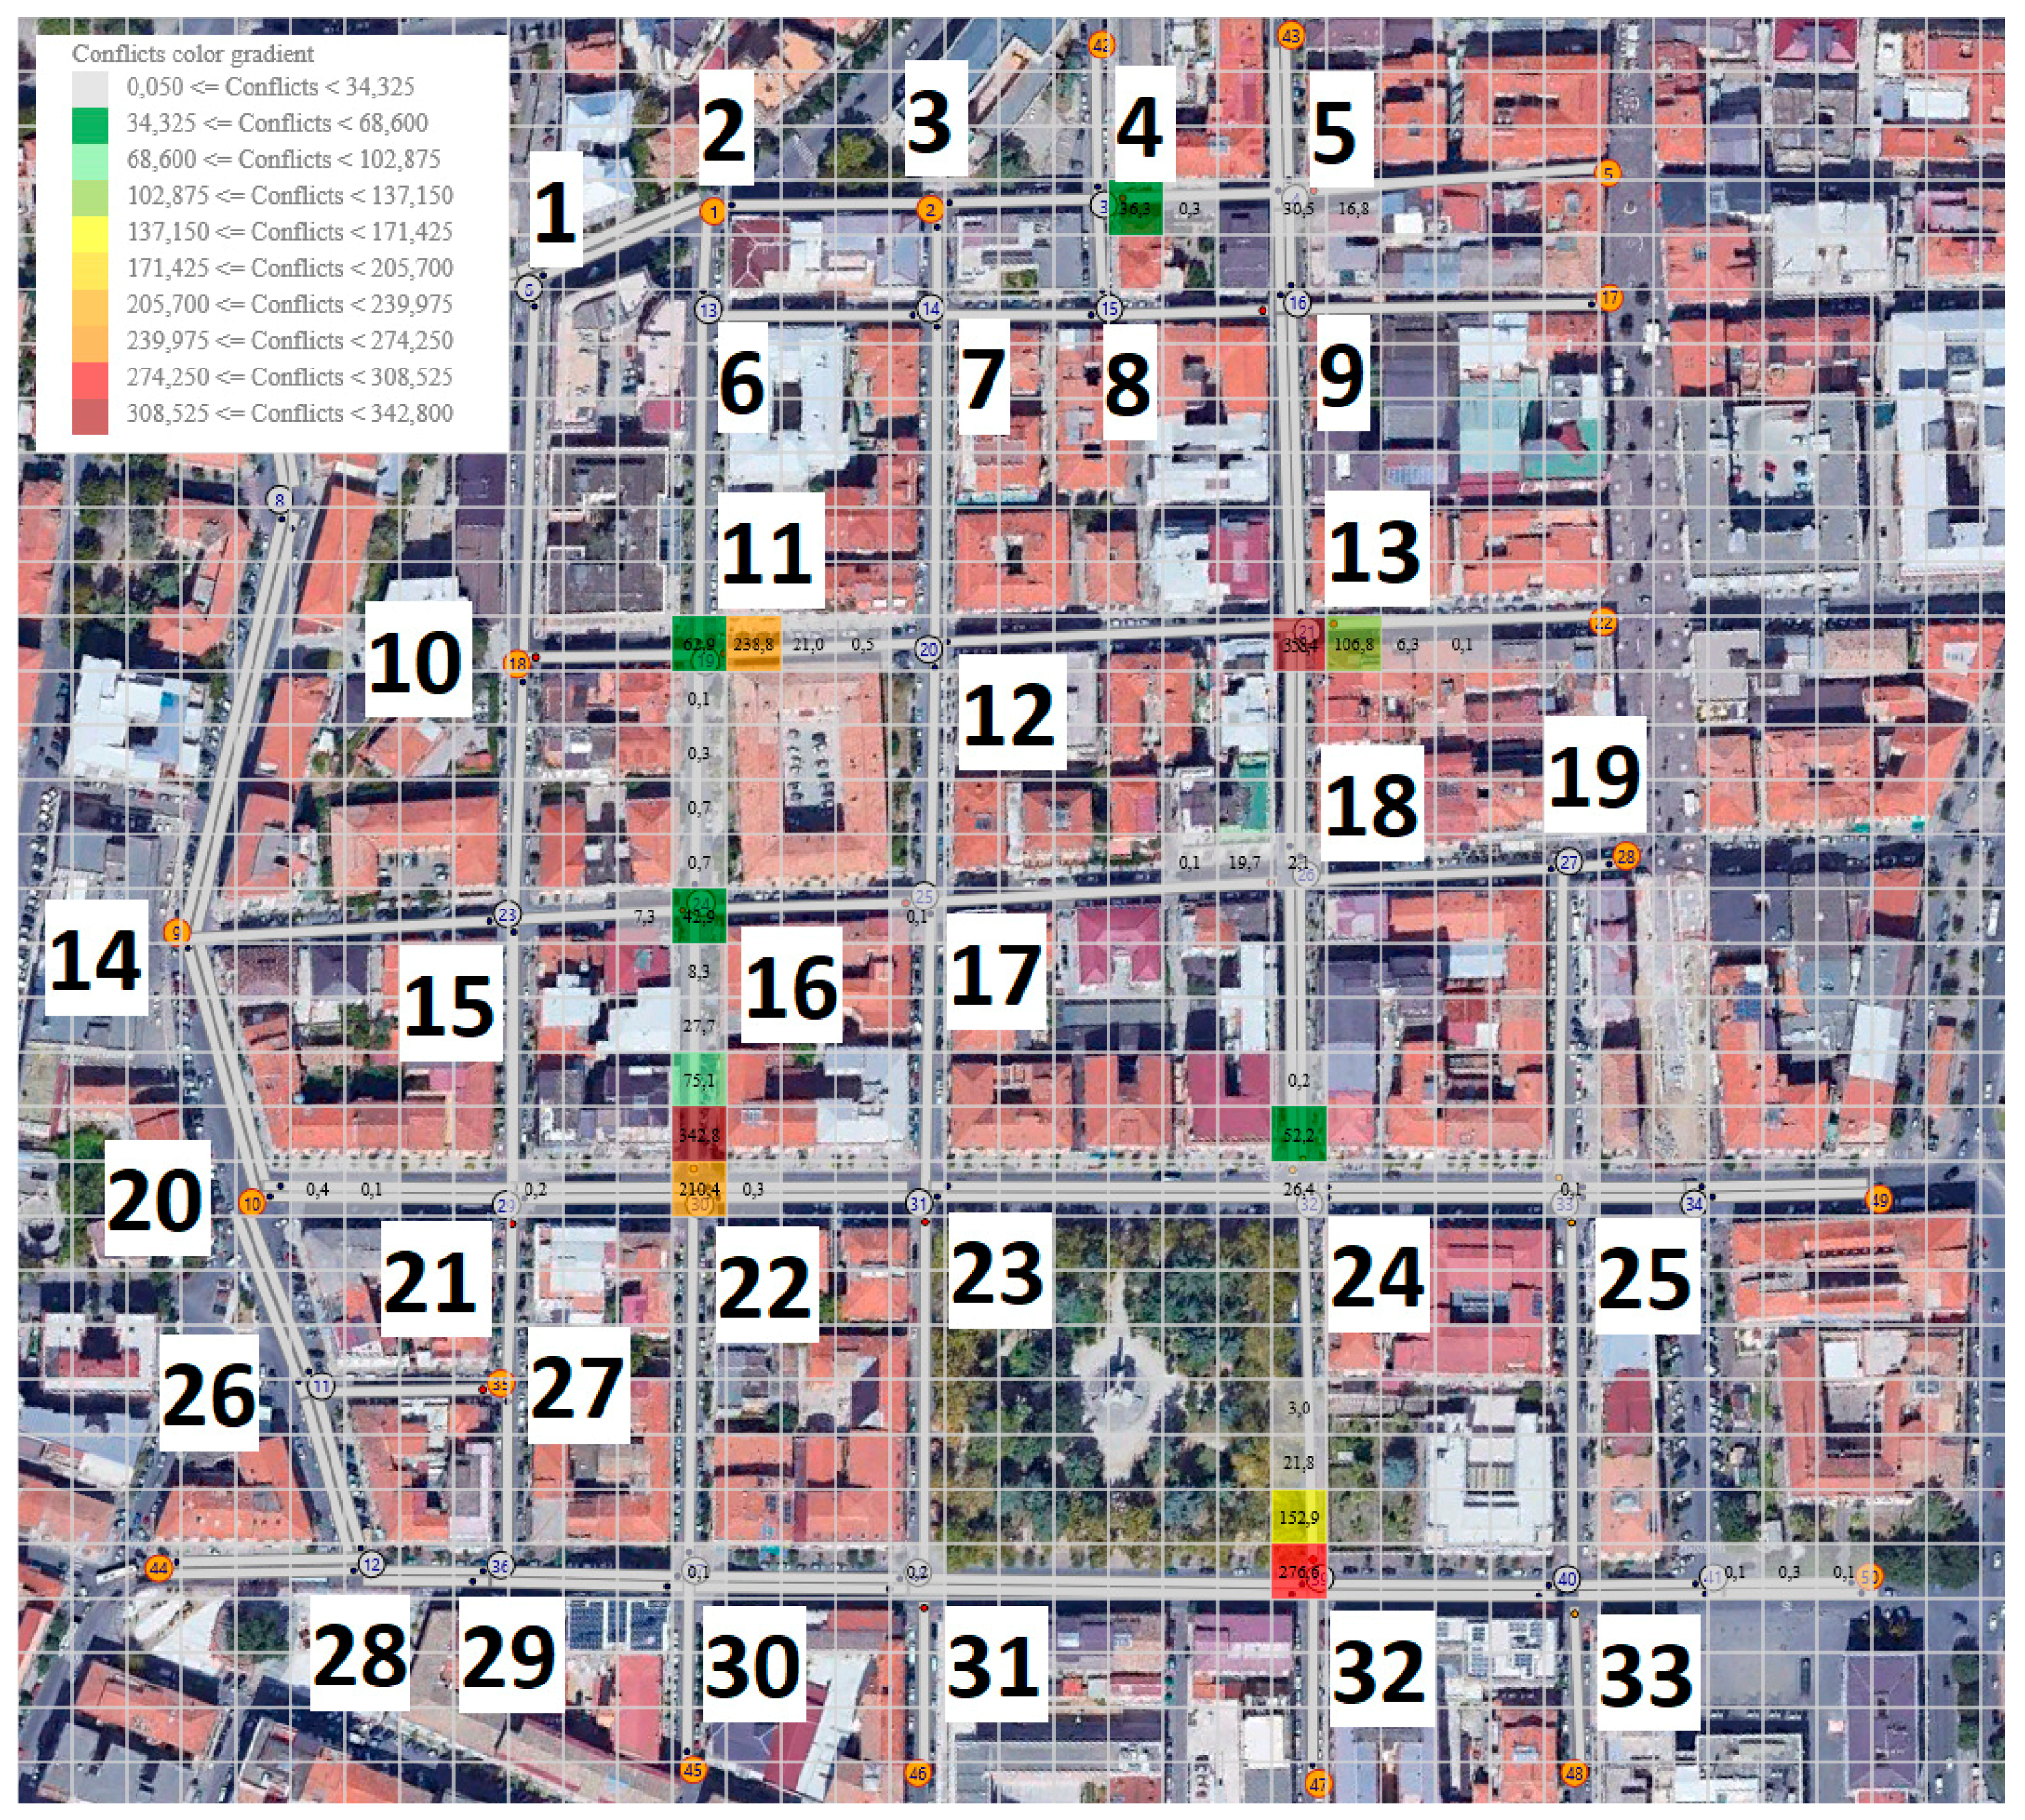
Figure 5 shows the potential conflicts heat-map as generated by the TRITONE’s add-on described in
Section 3.2.
5. Discussion of Results
From a first summary and qualitative analysis between the evidence coming from the CRISC accidents dataset and from the simulated potential conflicts areas, a correspondence between the risk areas highlighted by the two methodologies (
Figure 6) appears evident.
However, in order to assess the validity and the reliability of the proposed methodology for detecting risk areas by simulation, a correlation analysis was carried out between risk areas estimation and observed accidents locations.
Risk estimation is strictly determined by risk areas detection by simulation (ref. 4.3.). A Risk Rate was calculated for each road intersection as in Xie et al. [
34]:
where
i is the intersection index,
PotConfi are the potential conflicts at intersection i as estimated by SSAM (ref. 4.3.), and
TotFlowi is the value of the simulated flow traversing the intersection
i.
While the Accident Rate was calculated for each intersection as:
where
i is the intersection index,
AccCounti are the annual average number of accidents that occurred at intersection
i during the selected time interval (5 years), and
AADTi is the annual average daily traffic volume for intersection
i.
Table 1 summarizes the dataset used for the analysis of the 33 intersections.
The correlation analysis is based on the evaluation of Pearson’s correlation coefficient [
35] between risk rate and accident rate. A correlation significance test was also performed. In particular, Pearson’s correlation coefficient reached the value of 0.492 with a
p-value of 0.002; it highlights that the
p-value is less than 0.05, which indicates a statistically significant correlation between simulated risk scenarios and observed accidents. This result represents a validation of the applied methodology, providing a link between the microsimulation and observational data. Moreover, these outlines are supported by other studies as in Xie et al. [
34].
An in-depth analysis was also performed to identify which type of conflicts/accidents mainly characterizes each intersection (e.g., frontal, side and rear-end).
Table 2 shows the percentage of simulated conflicts and observed accidents grouped by type.
6. Conclusions
This paper investigates the correlation between real accident locations and simulated risk areas in an urban road network through an analysis based on a microscopic framework. TRITONE, a microscopic traffic simulation software package developed by the authors, was applied to simulate a subset of an urban road network in Cosenza (Italy), and to identify potentially unsafe vehicle interactions, providing a link between two simulated surrogate safety measures (TTC and PET) and observed accidents.
Risk areas identified by SSAM as potential conflicts scenarios highlighted in a simulation environment by TTC and PET were then compared to accidents locations coming from the database of Regional Center for Road Accidents’ Data Collection of Calabria Region (CRISC).
The main findings of the experimental application of the methodology described in
Section 3 can be summarized in three highlights:
- (1)
A qualitative graphic analysis obtained by the superimposition between the risk areas, as generated by the simulated conflicts technique applied to a vehicle-to-vehicle interactions, and the observed accident locations, as obtained from the CRISC (the graphic tool implemented as an add-on of TRITONE shows that the areas at greatest risk of collision based on the SSAM analysis coincide with those in which the highest frequency of accidents is recorded);
- (2)
A quantitative analysis obtained by Pearson’s correlation coefficient between risk rate and accident rate, which indicates a statistically significant correlation between simulated risk scenarios and observed accident (Pearson’s correlation is 0.492, with a p-value < 0.05);
- (3)
Microsimulation can provide reliable results in terms of safety evaluation on road networks when properly calibrated as in the paper (the GEH statistic ranges from a minimum of 0.179 to a maximum of 14.048 with an average value of 3.14, and 88% of the volumes in the simulation model has a GEH of less than 5.0).
To overcome the actual limitations of these methodologies, the authors intend to investigate how other surrogate safety measures can affect the correlation between risk rate and accident rate by evaluating the optimal thresholds values to be used for the determination of potential conflicts (e.g., less or more than 1.5 s for TTC).
Furthermore, a future development of the methodology could consider not only vehicles interactions, and therefore accidents involving two or more vehicles (e.g., frontal, side and rear-end collisions), but also other types of accidents involving isolated vehicles (e.g., accidents between vehicles and pedestrians, or accidents between vehicles and obstacles).
Because of that, in the next works, attention will be placed on formulating new specific safety measures, investigating the correlation between risk rate and accident rate for network links (not only for intersections), and making new experiments for wider areas.
Author Contributions
Conceptualization, G.G. and A.V.; Methodology, G.G. and A.V.; Software, V.A. and V.P.G.; Validation, G.G., A.V. and V.A.; Formal Analysis, G.G. and A.V.; Data Curation, V.A. and V.P.G.; Writing-Original Draft Preparation, G.G. and V.A.; Writing-Review & Editing, G.G., A.V. and V.A.; Visualization, A.V. and V.A.; Supervision, G.G.
Funding
This research received no external funding.
Conflicts of Interest
The authors declare no conflict of interest.
References
- Shi, X.; Wong, Y.D.; Li, M.Z.F.; Chai, C. Key risk indicators for accident assessment conditioned on pre-crash vehicle trajectory. Accid. Anal. Prev. 2018, 117, 346–356. [Google Scholar] [CrossRef]
- Alonso, F.; Alonso, M.; Esteban, C.; Useche, S.A. Knowledge of the concepts of “black spot”, “grey spot” and “high accident concentration sections” “among drivers”. Am. J. Traffic Transp. Eng. 2016, 1, 39–46. [Google Scholar]
- Pande, A.; Chand, S.; Saxena, N.; Dixit, V.; Loy, J.; Wolshon, B.; Kent, J.D. A preliminary investigation of the relationships between historical crash and naturalistic driving. Accid. Anal. Prev. 2017, 101, 107–116. [Google Scholar] [CrossRef]
- Zheng, L.; Ismail, K.; Meng, X. Traffic conflict techniques for road safety analysis: Open questions and some insights. Can. J. Civ. Eng. 2014, 41, 633–641. [Google Scholar] [CrossRef]
- Young, W.; Sobhani, A.; Lenné, M.G.; Sarvi, M. Simulation of safety: A review of the state of the art in road safety simulation modelling. Accid. Anal. Prev. 2014, 66, 89–103. [Google Scholar] [CrossRef]
- FHWA. Surrogate Safety Measures from Traffic Simulation Models; Siemens Gardner Transportation Systems/FHWA: Tucson, AZ, USA, 2003.
- Caliendo, C.; Guida, M. Microsimulation approach for predicting crashes at unsignalized intersections using traffic conflicts. J. Transp. Eng. 2012, 138, 1453–1467. [Google Scholar] [CrossRef]
- Darzentas, J.; Cooper, D.F.; Storr, P.A.; McDowell, M.R.C. Simulation of road traffic conflicts at T-junctions. Simulation 1980, 34, 155–164. [Google Scholar] [CrossRef]
- Cunto, F.; Saccomanno, F.F. Calibration and validation of simulated vehicle safety performance at signalized intersections. Accid. Anal. Prev. 2008, 40, 1171–1179. [Google Scholar] [CrossRef]
- Oh, C.; Kim, T. Estimation of rear-end crash potential using vehicle trajectory data. Accid. Anal. Prev. 2010, 42, 1888–1893. [Google Scholar] [CrossRef]
- Saccomanno, F.; Cunto, F.; Guido, G.; Vitale, A. Comparing Safety at Signalized Intersections and Roundabouts Using Simulated Rear-End Conflicts. Transp. Res. Rec. J. Transp. Res. Board 2008, 2078, 90–95. [Google Scholar] [CrossRef]
- Guido, G.; Saccomanno, F.; Vitale, A.; Astarita, V.; Festa, D. Comparing safety performance measures obtained from video capture data. J. Transp. Eng. 2011, 137, 481–491. [Google Scholar] [CrossRef]
- FHWA. Surrogate Safety Assessment Model (SSAM); FHWA-HRT-08-049; Research, Development, and Technology, Turner-Fairbank Highway Research Center: McLean, VA, USA, 2008.
- PTV. VISSIM User Manual Version 7.0; PTV Planung Transport Verkehr AG: Karlsruhe, Germany, 2014. [Google Scholar]
- AIMSUM. AIMSUN NG Manual; Transport Simulation Systems: Barcelona, Spain, 2007. [Google Scholar]
- Quadstone. Paramics Modeller V3.0 User Guide and Reference Manual; Quadstone Ltd.: Edinburgh, UK, 2002. [Google Scholar]
- Astarita, V.; Guido, G.; Vitale, A.; Giofré, V. A new microsimulation model for the evaluation of traffic safety performances. Eur. Transp.-Trasp. Eur. 2012, 51, 1–16. [Google Scholar]
- Archer, J.; Young, W. Signal treatments to reduce heavy vehicle crash-risk at metropolitan highway intersections. Accid. Anal. Prev. 2009, 41, 404–411. [Google Scholar] [CrossRef] [PubMed]
- Pirdavani, A.; Brijs, T.; Bellemans, T.; Wets, G. Evaluation of traffic safety at un-signalized intersections using microsimulation: A utilization of proximal safety indicators. Adv. Transp. Stud. 2010, 22, 43–52. [Google Scholar]
- Mahmud, S.M.S.; Ferreira, L.; Hoque, M.S.; Tavassoli, A. Application of proximal surrogate indicators for safety evaluation: A review of recent developments and research needs. IATSS Res. 2017, 41, 153–163. [Google Scholar] [CrossRef]
- Van der Horst, A.R.A. A Time-Based Analysis of Road User Behaviour at Intersections. In ICTCT Conference Proceedings; TNO Institute for PerceptionSoesterberg: Soesterberg, The Netherlands, 1990. [Google Scholar]
- Sayed, T.; Zaki, M.H.; Autey, J. Automated safety diagnosis of vehicle-bicycle interactions using computer vision analysis. Saf. Sci. 2013, 59, 163–172. [Google Scholar] [CrossRef]
- Vogel, K. A comparison of headway and time to collision as safety indicators. Accid. Anal. Prev. 2003, 35, 427–433. [Google Scholar] [CrossRef]
- Huang, F.; Liu, P.; Yu, H.; Wang, W. Identifying if VISSIM simulation model and SSAM provide reasonable estimates for field measured traffic conflicts at signalized intersections. Accid. Anal. Prev. 2013, 50, 1014–1024. [Google Scholar] [CrossRef]
- Cooper, P.J. Experience with Traffic Conflicts in Canada with Emphasis on ‘Post Encroachment Time’ Techniques. In International Calibration Study of Traffic Conflict Techniques; Springer: Berlin/Heidelberg, Germany, 2011. [Google Scholar]
- Minderhoud, M.M.; Bovy, P.H.L. Extended time-to-collision measures for road traffic safety assessment. Accid. Anal. Prev. 2001, 33, 89–97. [Google Scholar] [CrossRef]
- Allen, B.J.; Shin, B.T.; Cooper, B.J. Analysis of traffic conflicts and collision. Transp. Res. Rec. 1978, 667, 67–74. [Google Scholar]
- Almqvist, S.; Hyden, C.; Risser, R. Use of Speed Limiters in Cars for Increased Safety and a Better Environment; Transportation Research Board: Washington, DC, USA, 2003. [Google Scholar]
- Archer, J. Indicators for Traffic Safety Assessment and Prediction and Their Application in Micro-Simulation Modelling; Royal Institute of Technology: Stockholm, Sweden, 2005. [Google Scholar]
- Gipps, P.G. A behavioural car-following model for computer simulation. Transp. Res. Part B 1981, 15, 105–111. [Google Scholar] [CrossRef]
- Gipps, P.G. A model for the structure of lane-changing decisions. Transp. Res. Part B Methodol. 1986, 20, 403–414. [Google Scholar] [CrossRef]
- Cowan, R.J. Useful headway models. Transp. Res. 1975, 9, 371–375. [Google Scholar] [CrossRef]
- UK Highway Agency. Design Manual for Roads and Bridges; UK Highway Agency: Guildford, UK, 2008; Section 2; Volume 12. [Google Scholar]
- Xie, K.; Yang, D.; Ozbay, K.; Yang, H. Use of real-world connected vehicle data in identifying high-risk locations based on a new surrogate safety measure. Accid. Anal. Prev. 2019, 125, 311–319. [Google Scholar] [CrossRef] [PubMed]
- Pearson, K. Note on regression and inheritance in the case of two parents. Proc. R. Soc. Lond. 1895, 58, 240–242. [Google Scholar]
© 2019 by the authors. Licensee MDPI, Basel, Switzerland. This article is an open access article distributed under the terms and conditions of the Creative Commons Attribution (CC BY) license (http://creativecommons.org/licenses/by/4.0/).
